Behavioural reactions of three-spined sticklebacks to simulated risk of predation—Effects of predator distance and movement
Abstract
The behavioural response of animals to predation risk commonly depends on the behaviour of potential predators. Here, we report an experiment investigating effects of predator model (a life-like wooden trout model) distance and movement on the behaviour of three-spined sticklebacks Gasterosteus aculeatus L. in a standardized experimental setting. When the predator model was immobile, the behaviour of the sticklebacks could, in general, not be clearly distinguished from a no-predator control treatment. When moving the predator 41 cm towards the stickleback, clear anti-predator behaviours were observed. However, behavioural expression depended on the distance to the predator. At the two farthest distances (approaching from 129 to 88 cm and from 170 to 129 cm), the sticklebacks approached the predator and spent little time freezing. At the two closest distances (approaching from 88 to 47 cm and from 47 to 6 cm), the sticklebacks increased the distance to the predator model and froze their movements. These results suggest that the closest-distance groups showed avoidance behaviour, whereas the farthest-distance groups instead appeared to start inspecting the potential predator. This provides evidence for conditional anti-predator behaviour and highlights the importance of considering distance to, and movement of predator models when interpreting data from standardized behavioural trials.
Introduction
Animals have evolved a diversity of responses to predators where the choice of anti-predator behavioural strategy depends on the trade-off between the benefits of reducing risks associated with predator encounters and costs related to loss of time and energy which instead could be spent on fitness-increasing activities such as foraging, mate search, and courting (Ydenberg and Dill 1986; Lima 1998; Johnsson 2008). For example, behavioural reactions depend on the level of threat, which is determined by the distance to the predator, behaviour of the predator, predator species, group size, and environmental factors, such as turbidity, light level, and distance to the nearest shelter (Cerri 1983; Lima and Dill 1990; Godin 1997). Just like the movements of prey increase the risk of detection by a predator (Martel and Dill 1995), the activity of a predator can influence its detectability by the potential prey. When detected, the behaviour of the predator may influence the prey’s interpretation of the predator’s intent (Cooper 2000; Stankowich and Coss 2006). Moving predators have been shown to elicit stronger anti-predator reactions in potential prey, especially when the movement appears directed towards the prey (Tulley and Huntingford 1988). When the predator is detected while actively hunting, then the distance to the predator and its approach velocity will influence the anti-predator reaction of the prey. Longer distance between the predator and prey organisms, and the slower approach by a moving predator, is commonly associated with a lower anti-predation response by the potential prey (Dill 1974; Ydenberg and Dill 1986; Stankowich and Blumstein 2005). When conducting laboratory experiments, it could therefore be expected that the presentation of the predator model influences the recorded behavioural scores.
The usage of artificial predator models is a common alternative to the usage of live predators when analysing visually mediated anti-predator responses of animals, for ethical reasons (Huntingford 1984), and due to the fact that live predators are unpredictable and may affect the subject prey differently in each trial (Tulley and Huntingford 1988; McGhee et al. 2013). A multitude of model predators has previously been used in behavioural experiments, in widely different environments. For example, stuffed skins of predators have commonly been used to simulate predator threat in terrestrial environments (e.g., Kruuk 1964; Shalter 1978; Hoogland 1981) and also in aquatic environments (e.g., Wolf 1985; Godin and Morgan 1985). However, in aquatic experiments, two- or three-dimensional artificial models are more commonly used (e.g., Karplus and Ben Tuvia 1979; Magurran and Girling 1986; Metcalfe et al. 1987). Karplus et al. (1982) showed that simple artificial models can elicit biologically relevant responses in blue green damselfish Chromis viridis (Cuvier 1830), as reactions to models shaped like sympatric predators were stronger than reactions to models shaped like non-predatory species. However, it should be recognized that the appearance of the model will likely affect the behaviour of the subject individuals for which anti-predator behaviour is scored. For example, more naturalistic predator models have been shown to elicit stronger responses in European minnows Phoxinus phoxinus (L.) than less naturalistic models (Magurran and Girling 1986). General knowledge about the reactions of fish to different presentations of model predators is important, as anti-predator behaviours are used to assess effects of environmental factors on the performance of animals (e.g., Barber et al. 2004; Näslund et al. 2015).
In this study, we tested the behavioural reactions of three-spined stickleback Gasterosteus aculeatus L. to a naturalistic (wood) brown trout imitation. In particular, we were interested in how the distance between the subject stickleback and the model trout affected the behaviour of the stickleback, and how the reactions differ between an immobile and a moving trout.
We hypothesized that the anti-predator behaviour of three-spined sticklebacks is conditional on the distance to the predator and on the behaviour of the predator (i.e., whether or not it is moving), and broadly predicted behavioural differences among our treatment groups. More specific predictions were avoided, as differences in behaviour may depend on different avoidance strategies as well as on differences in the level of perceived threat. Thus, with respect to the exact behavioural patterns expressed in each situation, the study is explorative. The experiment provides information to be incorporated in future experimental setups investigating anti-predator behaviour using artificial predator models and also provides insights regarding reaction distances and potential anti-predation strategies in three-spined sticklebacks.
Materials and methods
Subject animals
Subject sticklebacks were captured between 14 and 16 April 2014, in the stream Stora Ån in Gothenburg, Sweden (WGS84: 57°38′22.8″N 11°55′12.6″E), using minnow traps made from 1.5-l PET bottles. The capture site in Stora Ån is situated 800 m upstream the outlet into the sea. The stickleback population consists of individuals being fully or semi-plated with respect to the bone-plate armour and typically retains all dorsal and pelvic spines (a few individuals have been found with only one dorsal spine; J. Näslund, personal observation, 2011). All subject fish except one were female or non-reproductive males. The mean body length (nose tip to the end of the caudal fin) was 58.6 mm (standard deviation: 7.4 mm; range: 42–74 mm). All captured fish were kept in a single communal tank (90 L) for 14–17 d in the laboratory for acclimation before being subjected to behavioural trials. The communal tank contained sand and gravel substrate, plastic plants, and cobble, and the sides were covered by black plastic to reduce disturbance from outside. The sticklebacks were fed frozen bloodworms (midge larvae, Chironomidae; Akvarieteknik, Sweden) once every day. Water temperature was kept relatively constant at 10–12 °C during the whole time the fish were housed in the laboratory.
Experimental setup and treatments
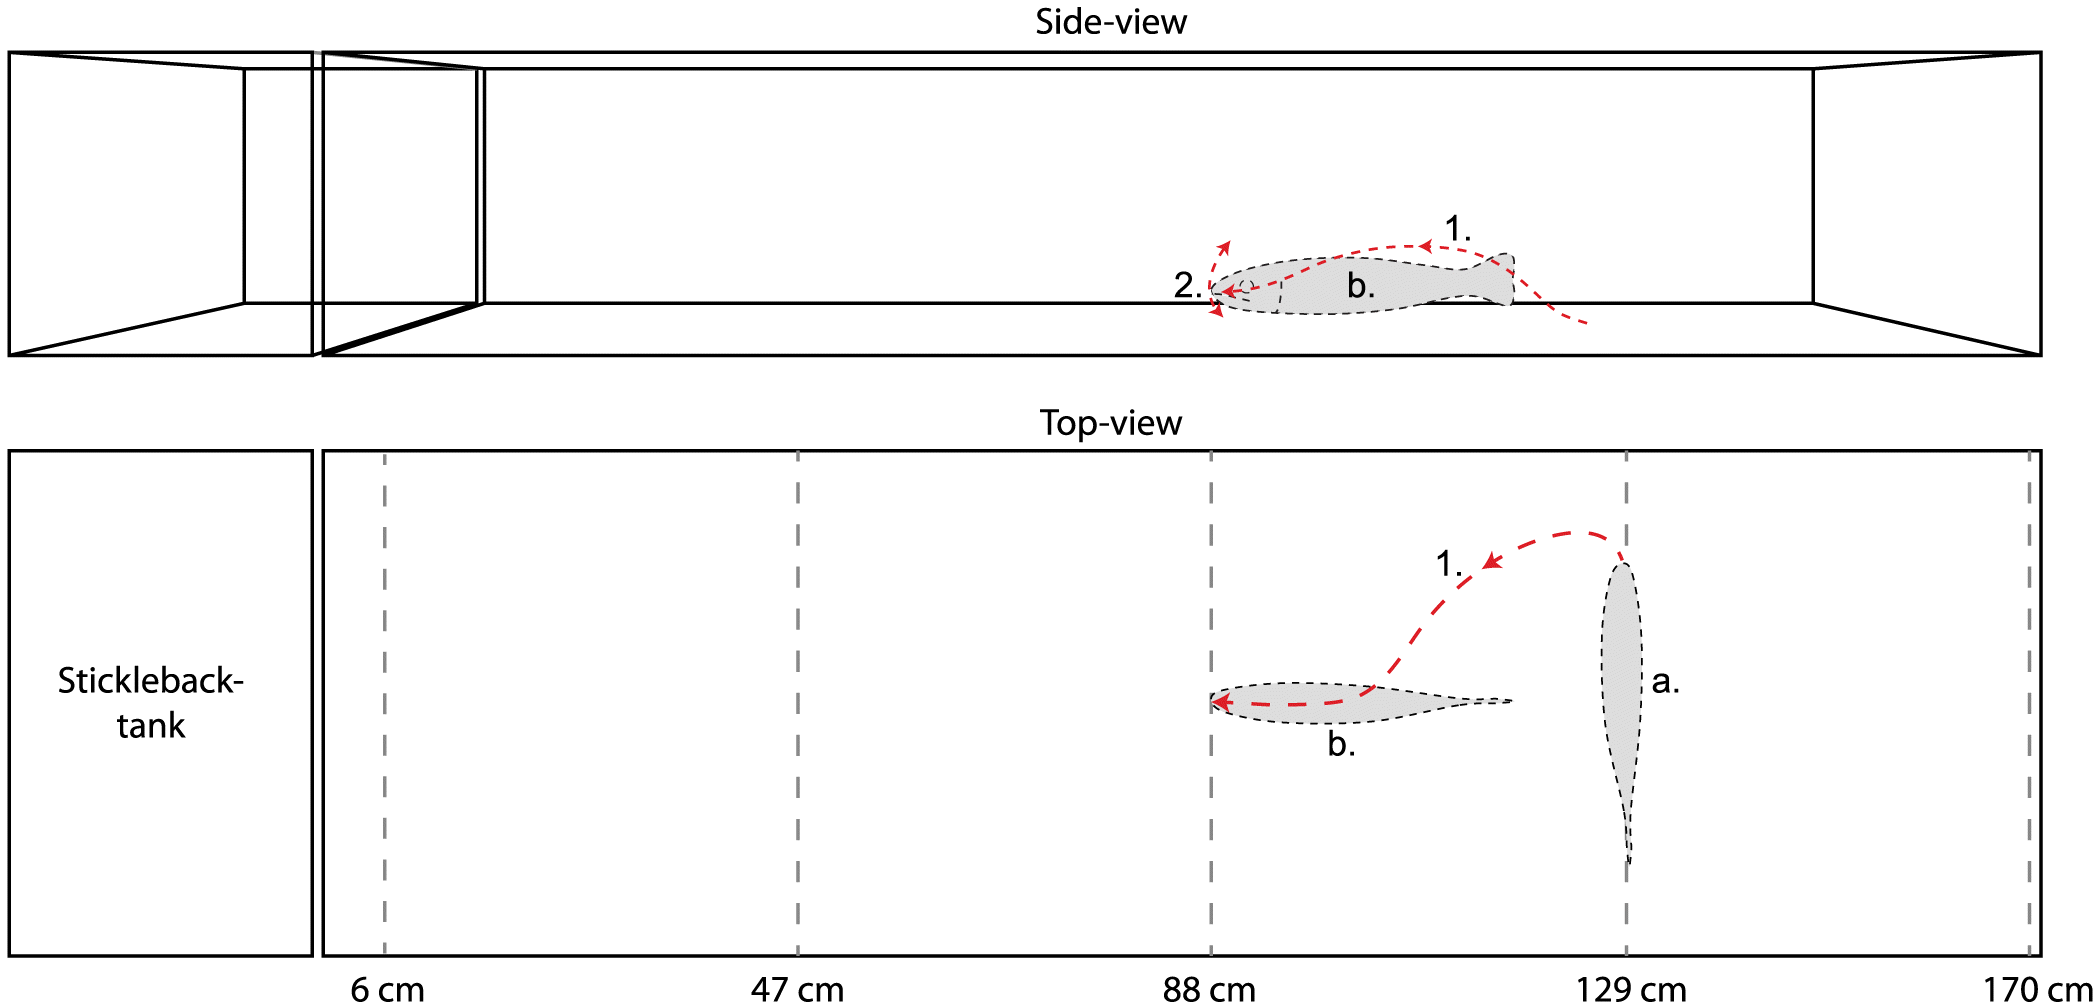
The experimental tank setup consisted of two aquaria placed close together: one smaller (L × W × H: 30 × 50 × 30 cm) for the subject stickleback and one larger (L × W × H: 170 × 50 × 30 cm) for the predator model. Separate tanks were used to restrict the stickleback within the view of a video camera (Sony Handycam HDR-XR155, Sony Corp., Japan) placed by the side of the subject aquarium. In between the tanks, an opaque grey PVC plate was inserted, which could be removed at the start of a trial. The bottom of the subject tank was covered with fine sand, and the two walls not facing the camera or the predator aquarium were covered by white paper. Water in the subject aquarium (depth: 20 cm) was flowing through the tank to keep temperature (10–12 °C) and oxygen levels consistent through trials, and to flush out any chemical compounds released by fish between trials. The bottom of the predator tank was covered with small cobblestone (diameter: 2–5 cm) and filled with water to 20 cm depth. A screen hid the experimenter from the subject fish to reduce human-related disturbance.
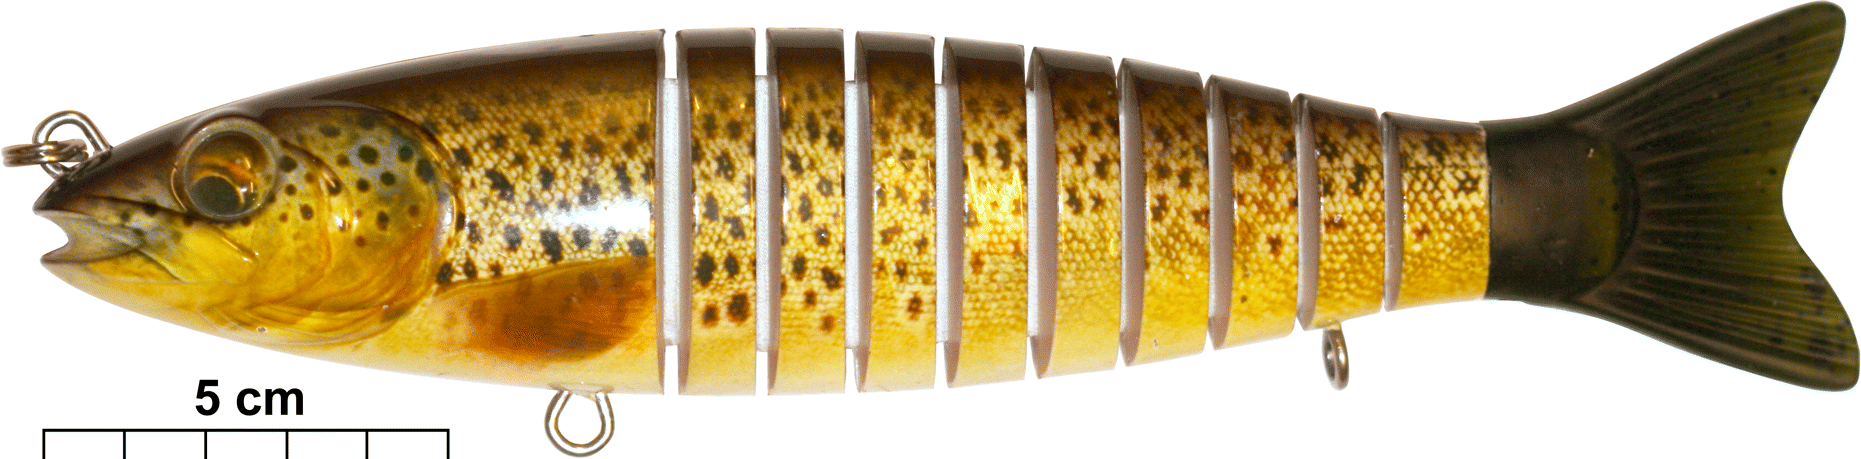
The predator model used consisted of a 22.5-cm-long wooden fishing lure (Bertus I.T.T. Multi Trout BT, Innovative Technology Team, The Netherlands), shaped and coloured as a brown trout, and jointed to give the model a movement pattern similar to a live trout (Fig. 1). The model was attached frontally by monofilament nylon line to a thin metal rod outside of the tank, which could be operated by the experimenter to make the predator model move. A lead weight was attached to the underside of the model to make it stay at the bottom at a natural brown trout position (i.e., hovering ca. 2 cm above the bottom). Anadromous brown trout are known to inhabit the stream where the subject sticklebacks were caught (J. Näslund, personal observation, 2013), and trout are known to eat three-spined sticklebacks in other water systems (Wootton 1984; Huntingford et al. 1994). Thus, the brown trout model is mimicking a natural predator for the stickleback as a species, but the predator–prey relationship in our population is assumed (albeit judged to be very likely).
Fig. 1.
The experimental setup is schematically illustrated in Fig. 2. In the trials, the predator model was placed at one of four distances from the stickleback tank (47, 88, 129, and 170 cm) with the side of the lure facing the stickleback tank, so that the whole model was visible. For each distance, 10 sticklebacks were tested. In addition, we had one control treatment (denoted as CTRL) where no predator model was present. A trial started within 10 min of acclimation for the stickleback in the subject aquarium. Thereafter, the dividing screen was removed and video recording began. During the first 5 min (denoted as T1–T5), we recorded the behaviour of the stickleback without moving the trout model. After 5 min, we terminated trials for CTRL fish. For the model-exposed fish, we started a second phase of the trial where we lifted the stick to which the model was attached and moved the predator forward 41 cm. For approximately 3 min (denoted as T6–T8; duration of T8 varied slightly among individuals depending on the length of the recorded video, from 79 to 95 s), we slowly kept lifting the front of the trout model approximately 5 cm, every 10 s. Thus, we recorded behaviour to both a still trout model and a moving trout model. Treatments in the experiment are consequently denoted as: D47→6, D88→47, D129→88, and D170→129; the first number indicates the original position (distance in cm) of the predator model (i.e., during the immobile-model period), and the second number indicates the distance to which the predator was moved (mobile-model period). After trials, we measured total body length (to the nearest mm) and wet mass (to the nearest 0.1 g; Kern EW 3000-2M, Kern & Sohn GmbH, Germany) after anaesthetizing the fish with 2-phenoxyethanol (0.5 ml l−1).
Fig. 2.
Behavioural scoring
Behavioural variables were scored from the recorded videos. For each minute, we scored time spent freezing (i.e., keeping the body still, only moving pectoral fins), time spent within a body length’s distance from the wall closest to the predator aquarium (frontal zone), time spent in the bottom half of the water column, that is, within 10 cm distance from the bottom (bottom zone), the number of dashes (defined as all types of distinct escape responses where the fish rapidly moves away from its current position, i.e., long, staggered, or erratic dashes; see e.g., Barber et al. 2004), and the number of pitches towards the substrate (“nose-down” food-searching behaviour).
Analyses
Behavioural data were analysed using generalized linear mixed models (GLMMs) in IBM SPSS Statistics 22 (IBM Corp., USA). We chose to analyse different behavioural scores separately, to give a clear picture of specific effects on the different scores. To analyse the proportions of time freezing, time in the frontal zone, and time in the bottom zone for each minute of the trials, we used binomial GLMMs with probit-link functions. The choice of probit over logit was based on the corrected Akaike Information Criterion (AICC), with all ΔAICC > 100. Satterthwaite’s approximation was applied to estimate degrees of freedom, and model-based covariance estimates were used for tests of fixed effects and coefficients (i.e., assuming that model assumptions were correct). The model covariance structure was selected by comparing the AICC for different covariance structures (diagonal, compound symmetry, and scaled identity). In all cases, scaled identity was found to be the best structure (all ΔAICC > 100). The models for each analysis were constructed by the 1-min periods as a within-subject factor (TIME), the treatment group (distance to predator) as a fixed factor (DIST), the interaction between these factors (TIME × DIST), fish identity (ID) as a random factor, and body length as a covariate (LENGTH). LENGTH was removed from the model if its parameter estimate had a P-value higher than 0.1, which was the case in all models (all P > 0.38). Post hoc pairwise contrasts (Fisher’s least significant difference) were applied to investigate differences among treatment groups for each time period and differences among time periods for each treatment.
A number of dashes and pitches were found to be generally very low and are therefore only described and not analysed using statistical models.
Ethics statement
The experiment was conducted in accordance with Swedish law and regulations and was approved by the Ethical Committee on Animal Experiments in Gothenburg, Sweden (ethical licence number 15-2014).
Results and discussion
General notes
Model statistics are presented in Table 1, and visualisations of results are shown in Fig. 3. In the following sections, P-values refer to pairwise contrasts. We present and discuss the major patterns in the data, with P ≤ 0.05 being considered a significant difference; complete tables of the P-values of all pairwise contrasts are found in the supplement to the article (Tables S1–S3).
Table 1.
| Proportion of time freezing | Proportion of time in frontal zone | Proportion of time in bottom zone | |||||||
|---|---|---|---|---|---|---|---|---|---|
| Fixed effects | F | df1, df2 | P | F | df1, df2 | P | F | df1, df2 | P |
| DIST | 0.887 | 4, 43 | 0.480 | 1.326 | 4, 49 | 0.274 | 0.642 | 4, 41 | 0.636 |
| TIME | 15.202 | 7, 287 | <0.001 | 1.128 | 7, 281 | 0.346 | 10.522 | 7, 284 | <0.001 |
| TIME × DIST | 3.619 | 25, 287 | <0.001 | 3.025 | 25, 281 | <0.001 | 1.908 | 25, 284 | 0.007 |
| Residual effect | Estimate (SE) | Z | P | Estimate (SE) | Z | P | Estimate (SE) | Z | P |
| Variance | 22.696 (1.901) | 11.941 | <0.001 | 30.084 (2.544) | 11.826 | <0.001 | 21.696 (1.824) | 11.896 | <0.001 |
| Random effect covariance | Estimate (SE) | Z | P | Estimate (SE) | Z | P | Estimate (SE) | Z | P |
| Var(Intercept) | 0.529 (0.140) | 3.783 | <0.001 | 0.759 (0.214) | 3.551 | <0.001 | 1.200 (0.304) | 3.950 | <0.001 |
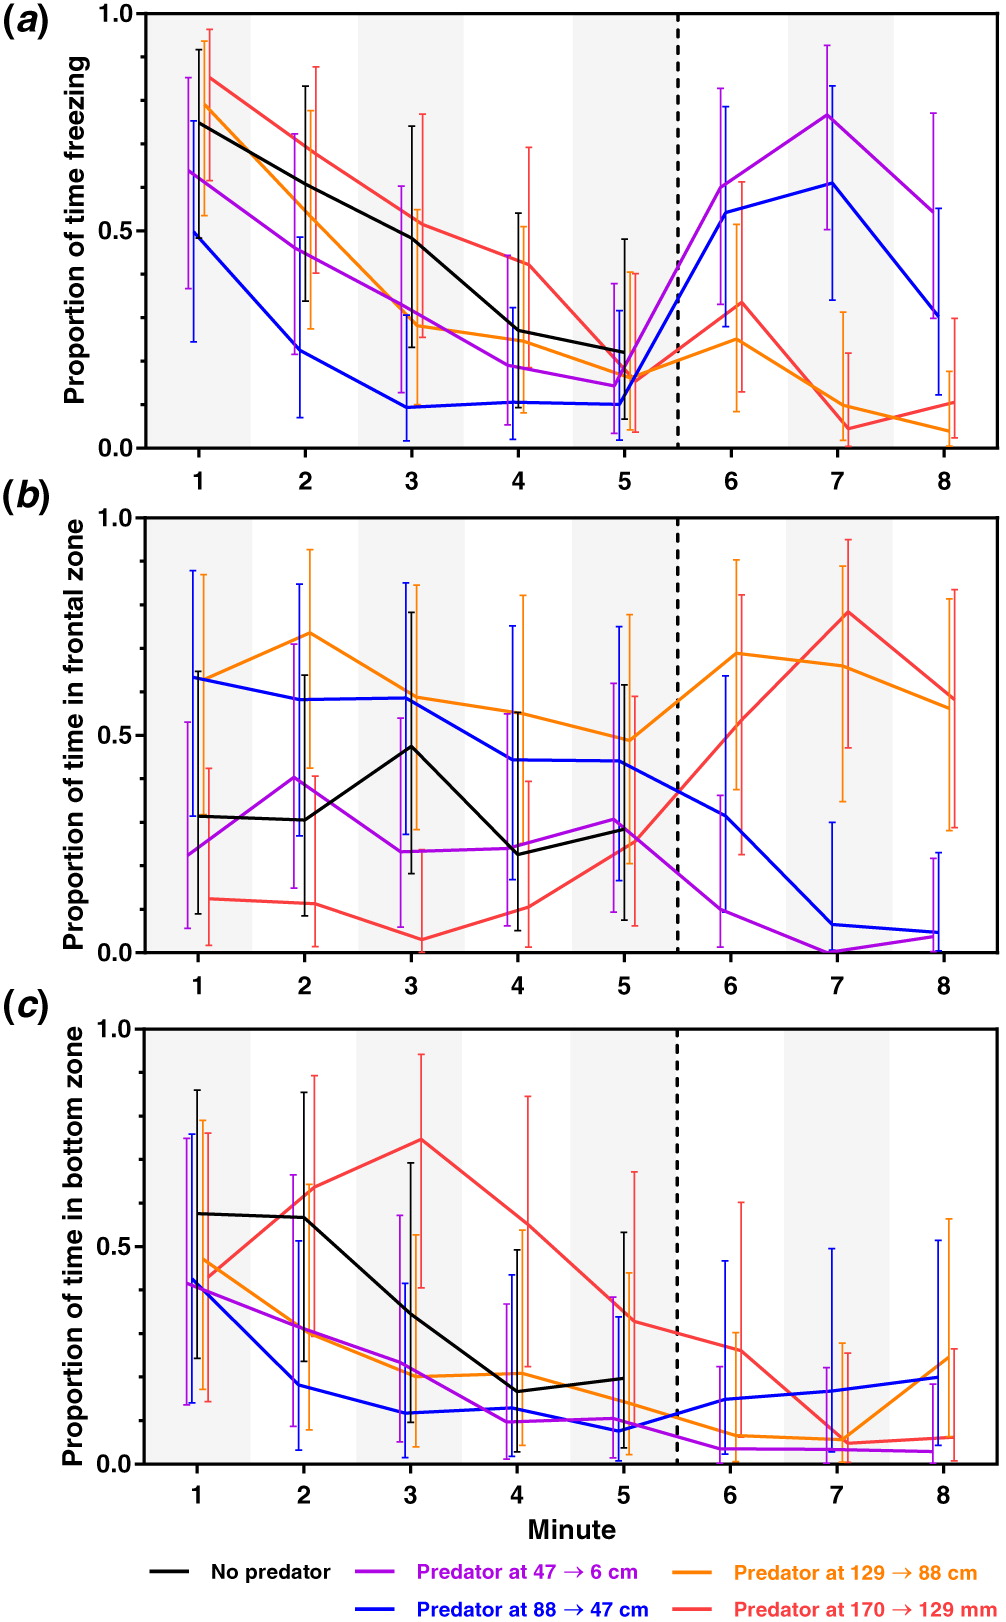
Fig. 3.
Freezing behaviour
The proportion of time spent freezing generally decreased over the first 5 min (immobile-model period) following the removal of the dividing screen (all P ≤ 003 for T1 vs. T4 and all P ≤ 0.002 for T1 vs. T5). It seems likely that the removal of the divider, in general, elicited freezing responses in the subject fish, which then gradually became less prone to freezing over the following minutes whereas the predator model was immobile. During parts of this time, D88→47 froze less than CTRL and D170→129 (T2–T3 for D88→47 vs. CTRL, all P ≤ 0.029; T1–T4 for D88→47 vs. D170→129, all P ≤ 0.045). However, the relevance of these differences can be questioned, as the D88→47 treatment group starts the trial with a lower freezing response and seems to have a faster acclimation. Why this should be expressed only in the D88→47 group is not clear to us. We note not only this result as potentially interesting but also issue an alert for the possibility of a spurious significance.
During the minute following the predator model approach (T6), the two treatments being closest to the model (D47→6 and D88 →47) increased the time spent freezing. For D47→6, T6 differed from T4 to T5 (all P ≤ 0.002); for D88→47, T6 differed from T2 to T5 (all P ≤ 0.020). For D47→6, these differences were maintained through T7 to T8 (all P ≤ 0.004); for D88→47, the differences were maintained at least through T7 (P ≤ 0.001). This suggests that the continuous movements of the model (i.e., lifting the head of the model a few centimetres every 10th second) kept the sticklebacks vigilant. In the two treatments with the predator model being located farther away, the T6–T8 did not appear to differ markedly from the period just prior to the predator approach (i.e., T5, all P ≥ 0.158). While it is hard to decide which part of the immobile-model period is the appropriate control to which the response to a mobile predator should be compared, it is clear that there is a response to the predator model in D47→6 and D88→47. Thus, when the predator is nearby and approaches, the response by the stickleback is increased time spent in a freezing position.
During T7, both D47→6 and D88→47 froze more than D129→88 and D170→129 (all P ≤ 0.001), and this was also the general pattern for the mobile-predator period (T6–T8) with respect to estimated means (Fig. 3a). This result divides the two farthest-distance treatments from the two closest-distance treatments. Such a division was not seen during the immobile-model period.
The function of the freezing behaviour at close distances to the predator model is unclear. Theoretical models and empirical studies generally show that escape should be elicited when the predator comes within a certain threshold distance (Dill 1974; Magurran et al. 1985; Ydenberg and Dill 1986; Pitcher et al. 1986; Nishiumi and Mori 2015). Freezing behaviours are typically interpreted as a behaviour reducing the probability of detection. However, it could be that the increased freezing of D47→6 and D88→47 sticklebacks is part of a predator-inspection behaviour (Dugatkin and Godin 1992; Godin 1997). At shorter distances, the stickleback does not necessarily have to approach the predator to assess its intentions.
Frontal zone usage
There was no clear time effect on the proportion of time spent in the frontal zone during the immobile-predator period (T1–T5) (P ≥ 0.100 for all treatments). Some treatments differed during this period, most notably with D170→129 spending less time in the frontal zone than D129→88 (T1–T4; all P ≤ 0.016) and D88→47 (T1–T3; all P ≤ 0.014). The CTRL treatment only differed from D170→129 at T3 (D170→129 spending less time in frontal zone; P = 0.012) and from D129→88 at T2 (D129→88 spending more time in frontal zone; P = 0.037) during this time (all other comparisons with CTRL had P ≥ 0.100). These detected differences could potentially be spurious, as the vast majority of the pairwise comparisons with the CTRL group were non-significant. At the end on the immobile-model period (T5), all treatments had largely overlapping confidence intervals (all P ≥ 0.283). This indicates that any differences in frontal zone usage, depending on the distance to the predator, may be short lived.
During the minute following the predator approach (T6), no treatment showed a distinct change in front zone usage, as compared with T5 (all P ≥ 0.100). However, the frontal zone usage of the D170→129 treatment during T6 was higher than during T1–T4 (all P ≤ 0.011). This effect appears to be a consequence of increased frontal zone due to the predator model approach. This is because the D170→129 treatment also maintained a generally higher frontal zone usage during T7–T8 (all P ≤ 0.036). For D129→88, time spent in the frontal zone was relatively constant (all P ≥ 0.100). However, as the time spent in the frontal zone was relatively high in the immobile-model period for this group, it is hard to distinguish a response to the predator model approach; likely, the response is similar to the response by D170→129. During T7–T8, both of the two treatments closest to the predator model reduced the time spent in the frontal zone, as compared with the immobile-model period in general (P ≤ 0.045 for T5 and T2; all other P ≤ 0.113). The avoidance of the frontal zone in D47→6 and D88→47 during T7–T8 suggests that the fish try to avoid the predator, and the dashing reactions of a subset of the D47→6 group, which were not seen in any other group when the model approached, suggest that escape is part of the anti-predator repertoire in sticklebacks. The relatively small size of the stickleback tank, which is a common feature of laboratory experiments (e.g., Fernö and Järvi 1998; Lehtiniemi 2005; Jones and Godin 2010), limited the possible escape distance of the sticklebacks, and therefore they may be forced to freeze as the only viable option left after having put as much distance as possible between themselves and the predator.
During T7 and T8, both D47→6 and D88→47 spent less time in the frontal zone than D129→88 and D170→129 (all P ≤ 0.001), and this was also the general pattern for the mobile-predator period (T6–T8) with respect to estimated means (Fig. 3b). Increase in the usage of the frontal zone in the two treatments farthest away from the predator model is here interpreted as a sign of predator-inspection behaviour, as we commonly saw an immediate and lasting approach response as soon the predator had moved towards the subject fish. Typically, when a three-spined stickleback detects a piscine predator, it stops, raises its spines and fixates the predator, whereafter it commonly starts to approach the predator to inspect it (see e.g., Pitcher 1991; Huntingford et al. 1994; Godin and Valdron Clark 1997). This behaviour is thought to signal to the predator that it has been detected, or to investigate the intent of the potential predator (or a combination of both functions) (Dugatkin and Godin 1992). From the data, it appears that inspection motivation is strong when the predator is at a relatively far distance. The threshold distance for the initiation of inspection appears to lie somewhere between 44 and 88 cm, but this could possibly differ depending on factors such as the type or size of predator, and environmental characteristics (Ydenberg and Dill 1986; Godin 1997). It may also be that sticklebacks close to the predator model can inspect without approaching the model.
Bottom zone usage
All treatments, except from D170→129, decreased their time in the bottom zone over the 5 min of the immobile-model period, as evidenced by differences between T1 and T5 (all P ≤ 0.030; also see Fig. 3c). D170→129 appeared to use more time in the bottom zone than D47→6 and D88→47 during T3 and T4 (all P ≤ 0.041). No distinct differences from CTRL were found in any treatment group (all P ≥ 0.075).
During the mobile-predator period, all treatments spent relatively little time in the bottom zone, and there were no apparent differences among treatments (all P ≥ 0.100).
Dashes and pitches
At the start of the trials, dashes were observed in approximately half of the fish (40–70%) in all groups during the first minute after the divider was removed. The group without predator model had the highest number of fish responding, indicating that the response may not have been a consequence of exposure to the predator model but rather a response to the removal of the divider. During the following 4 min (immobile-model period) only one fish, from the no-predator treatment, dashed. During the first minute following predator approach, four fish dashed, all from the D47→6 group. Thereafter three more fish from the D47→6 group and one fish from the D88→47 group dashed over the following 2 min.
Twenty-six fish in total displayed pitches over the experiment, generally at a very low frequency. In the no-predator group, 50% of the fish pitched the first 5 min. In the groups with predator models, the percentages were 30%, 40%, 50%, and 50%, in order of increasing distance to the predator. During the 3 min following predator approach, the percentages were 10%, 30%, 60%, and 20%, in order of increasing distance to the predator.
Summary discussion and implications
The sticklebacks’ response to an immobile-predator model was not particularly distinct (as compared with the CTRL treatment; Fig. 3a–3c). The moving model, however, caused clear anti-predator reactions in freezing (Fig. 3a) and time spent in the frontal zone (Fig. 3b). Interestingly, the anti-predator behaviour differed among treatment groups. At the two shortest distances between the stickleback tank and the model, the sticklebacks were freezing to a higher extent. They also moved away from the model, particularly in D47→6 where dash behaviours were observed, and spent more time in the upper back section of the tank. We observed some sticklebacks in the two closest-distance treatments (D47→6 and D88→47) made a few inspection approaches soon after the predator moved but then retreated to the back of the tank. At the two farthest-distance treatments (D129→88 and D170→129), the sticklebacks were more active in the frontal zone instead, likely reflecting predator-inspection behaviour. The results show that the anti-predator strategies differ depending on the location and movement of a potential predator.
The findings presented here can be utilized when designing laboratory experiments. We suggest that moving models could be used to obtain reliable behavioural scores from small prey fishes, based on the apparent stronger anti-predator reactions to this type of model presentation. Notably, most researchers appear to use moving predator models (e.g., Magurran et al. 1985; Pitcher et al. 1986; Metcalfe et al. 1987; Fernö and Järvi 1998; Jones and Godin 2010, to name a few studies), but a few studies have utilized immobile models to be able to use movement tracking software (van der Bijl et al. 2015). Small fish like sticklebacks are commonly used in behavioural ecology experiments, e.g., within the currently prominent field of animal personality. A trait like boldness should preferably be scored in a potentially risky situation, and predator models may be incorporated into such trials as highly standardized risk factors (as opposed to live predators, which vary in behaviour). However, if an experimental situation is not perceived as risky by the subject fish, the results could be misinterpreted by the researcher. Our study suggests that an immobile predator may not be perceived as an immediate threat by sticklebacks, and consequently, the behaviours scored in a trial involving an immobile predator may not represent an anti-predator response. However, it is possible that different populations of sticklebacks (and different species) will react in different ways to a still predator model. For example, Tulley and Huntingford (1988) showed that sticklebacks from a low-predation environment were bolder than conspecifics from a high-predation environment in the presence of a still pike model (distance between model and subject not stated in the paper). No difference in anti-predator behaviour was, however, seen between the populations when the pike was moved towards the sticklebacks, which further suggests that a moving predator model is a better for scoring of anti-predator behaviour.
To obtain scores of predator inspection, which could be a good behavioural indicator of boldness, moving predator models at distances >88 cm away seem appropriate based on the present study. If escape responses are to be scored, a close distance between the model and the subject fish is probably to prefer, as dashing behaviours were only seen in the D47→6 group in this study.
We note that the behavioural responses in the experimental situation vary substantially among individuals (Table 1 and Fig. 3). This is not at all unexpected, as sticklebacks are widely recognised to have individual differences in their response to predators, depending on both heredity and previous experience (Huntingford et al. 1994). The patterns observed in this study suggest that effects of experimental design on behavioural expression are strong, as the effects are detected with relatively small sample sizes, despite substantial among-individual variation.
In conclusion, laboratory anti-predator behaviour of three-spined sticklebacks is shown to be challenging to discern from “normal” novel-environment behaviours when using an immobile-predator model. An approaching, and thereafter continuously moving, predator model induced stronger anti-predator behaviours. The specific anti-predator behaviours that were expressed, however, depended on the distance between the subject stickleback and the predator model.
Acknowledgements
We thank two anonymous reviewers for their helpful and constructive comments on the initial manuscript version of this paper. No specific funding was received for the research presented in this manuscript.
References
Barber I, Walker P, and Svensson PA. 2004. Behavioural responses to simulated avian predation in female three spined sticklebacks: The effect of experimental Schistocephalus solidus infections. Behaviour, 141: 1425–1440.
Cerri RD. 1983. The effect of light intensity on predator and prey behaviour in cyprinid fish: Factors that influence prey risk. Animal Behaviour, 31: 736–742.
Cooper WE. 2000. Tradeoffs between predation risk and feeding in a lizard, the broad-headed skink (Eumeces laticeps). Behaviour, 137: 1175–1189.
Dill LM. 1974. The escape response of the zebra danio (Brachydanio rerio) I. The stimulus for escape. Animal Behaviour, 22: 711–722.
Dugatkin LA, and Godin J-GJ. 1992. Prey approaching predators: A cost-benefit perspective. Annales Zoologici Fennici, 29: 233–252.
Fernö A, and Järvi T. 1998. Domestication genetically alters the anti-predator behaviour of anadromous brown trout (Salmo trutta)—A dummy predator experiment. Nordic Journal of Freshwater Research, 74: 95–100.
Godin J-GJ. 1997. Evading predators. In Behavioural ecology of teleost fishes. Edited by J-GJ Godin. Oxford University Press, Oxford. pp. 191–136.
Godin J-GJ, and Morgan MJ. 1985. Predator avoidance and school size in a cyprinodontid fish, the banded killifish (Fundulus diaphanus Lesueur). Behavioral Ecology and Sociobiology, 16: 105–110.
Godin J-GJ, and Valdron Clark KA. 1997. Risk-taking in stickleback fishes faced with different predatory threats. Écoscience, 4: 246–251.
Hoogland JL. 1981. The evolution of coloniality in white-tailed and black-tailed prairie dogs (Sciuridae: Cynomys leucurus and C. ludovicianus). Ecology, 62: 252–272.
Huntingford FA. 1984. Some ethical issues raised by studies of predation and aggression. Animal Behaviour, 32: 210–215.
Huntingford FA, Wright PJ, and Tierney JF. 1994. Adaptive variation in antipredator behavior in threespine stickleback. In The evolutionary biology of the threespine stickleback. Edited by MA Bell, and SA Foster. Oxford University Press, Oxford. pp. 277–296.
Johnsson JI. 2008. Behavioural defenses in fish. In Fish defenses, vol. 2: Pathogens predators and parasites. Edited by G Zaccone, C Perrière, A Mathis, and BG Kapoor. Science Publishers, Enfield, NH. pp. 243–276.
Jones KA, and Godin J-GJ. 2010. Are fast explorers slow reactors? Linking personality type and anti-predator behaviour. Proceedings of the Royal Society B, 277: 625–632.
Karplus I, and Ben Tuvia S. 1979. Warning signals of Cryptocentrus steinitzi (Pisces, Gobiidae) and predator models. Zeitschrift für Tierpsychologie, 51: 225–232.
Karplus I, Goren M, and Algom D. 1982. A preliminary experimental analysis of predator face recognition by Chromis caeruleus (Pisces, Pomacentridae). Zeitschrift für Tierpsychologie, 58: 53–65.
Kruuk H. 1964. Predators and anti-predator behaviour of the black-headed gull (Larus ridibundus L.). Behaviour Supplement, 11: 1–129.
Lehtiniemi M. 2005. Swim or hide: Predator cues cause species specific reactions in young fish larvae. Journal of Fish Biology, 66: 1285–1299.
Lima SL. 1998. Nonlethal effects in the ecology of predator-prey interactions. BioScience, 48: 25–34.
Lima SL, and Dill LM. 1990. Behavioral decisions made under the risk of predation: A review and prospectus. Canadian Journal of Zoology, 68: 619–640.
Magurran AE, and Girling SL. 1986. Predator model recognition and response habituation in shoaling minnows. Animal Behaviour, 34: 510–518.
Magurran AE, Oulton W, and Pitcher TJ. 1985. Vigilant behaviour and shoal size in minnows. Zeitschrift für Tierpsychologie, 67: 167–178.
Martel G, and Dill LM. 1995. Influence of movement by coho salmon (Oncorhynchus kisutch) parr on their detection by common mergansers (Mergus merganser). Ethology, 99: 139–149.
McGhee KE, Pintor LM, and Bell AM. 2013. Reciprocal behavioral plasticity and behavioral types during predator-prey interactions. The American Naturalist, 182: 704–717.
Metcalfe NB, Huntingford FA, and Thorpe JE. 1987. The influence of predation risk on the feeding motivation and foraging strategy of juvenile Atlantic salmon. Animal Behaviour, 35: 901–911.
Näslund J, Lindström E, Lai F, and Jutfelt F. 2015. Behavioural responses to simulated bird attacks in marine three-spined sticklebacks after exposure to high CO2 levels. Marine and Freshwater Research, 66: 877–885.
Nishiumi N, and Mori A. 2015. Distance-dependent switching of anti-predator behavior of frogs from immobility to fleeing. Journal of Ethology, 33: 117–124.
Pitcher T. 1991. Who dares, wins: The function and evolution of predator inspection behaviour in shoaling fish. Netherlands Journal of Zoology, 42: 371–391.
Pitcher TJ, Green DA, and Magurran AE. 1986. Dicing with death: Predator inspection behaviour in minnow shoals. Journal of Fish Biology, 28: 439–448.
Shalter MD. 1978. Effect of spatial context on the mobbing reaction of pied flycatchers to a predator model. Animal Behaviour, 26: 1219–1221.
Stankowich T, and Blumstein DT. 2005. Fear in animals: A meta-analysis and review of risk assessment. Proceedings of the Royal Society B, 272: 2627–2634.
Stankowich T, and Coss RG. 2006. Effects of predator behaviour and proximity on risk assessment by Columbian black-tailed deer. Behavioral Ecology, 17: 246–254.
Tulley JJ, and Huntingford FA. 1988. Additional information on the relationship between intra-specific aggression and anti-predator behaviour in the three-spined stickleback, Gasterosteus aculeatus. Ethology, 78: 219–222.
van der Bijl W, Thyselius M, Kotrschal A, and Kolm N. 2015. Brain size affects the behavioural response to predators in female guppies (Poecilia reticulata). Proceedings of the Royal Society B, 282: 20151132.
Wolf NG. 1985. Odd fish abandon mixed-species groups when threatened. Behavioral Ecology and Sociobiology, 17: 47–52.
Wootton RJ. 1984. A functional biology of sticklebacks. University of California Press, Berkeley and Los Angeles, CA. 265 p.
Ydenberg RC, and Dill LM. 1986. The economics of fleeing from predators. Advances in the Study of Behavior, 16: 229–249.
Supplementary material
Supplementary Material 1(PDF / 318 KB):
- Download
- 318.93 KB
Information & Authors
Information
Published In

FACETS
Volume 1 • Number 1 • January 2017
Pages: 55 - 66
Editor: Daniel Schindler
History
Received: 8 January 2016
Accepted: 4 April 2016
Version of record online: 10 June 2016
Copyright
© 2016 Näslund et al. This work is licensed under a Creative Commons Attribution 4.0 International License (CC BY 4.0), which permits unrestricted use, distribution, and reproduction in any medium, provided the original author(s) and source are credited.
Data Availability Statement
All relevant data are within the paper, in the Supplementary Material, and data for the experiment are available from the figshare database https://doi.org/10.6084/m9.figshare.3155911.v1.
Key Words
Sections
Subjects
Authors
Author Contributions
JN and JIJ conceived and designed the study.
LP performed the experiments/collected the data.
JN analyzed and interpreted the data.
JN and JIJ contributed resources.
All drafted or revised the manuscript.
Competing Interests
The authors have declared that no competing interests exist.
Metrics & Citations
Metrics
Other Metrics
Citations
Cite As
Joacim Näslund, Leo Pettersson, and Jörgen I Johnsson. 2017. Behavioural reactions of three-spined sticklebacks to simulated risk of predation—Effects of predator distance and movement. FACETS.
1(): 55-66. https://doi.org/10.1139/facets-2015-0015
Export Citations
If you have the appropriate software installed, you can download article citation data to the citation manager of your choice. Simply select your manager software from the list below and click Download.
Cited by
1. Understanding feeding competition under laboratory conditions: Rohu (Labeo rohita) versus Amazon sailfin catfish (Pterygoplichthys spp.)
2. Three-spined sticklebacks show dimension-specific preferences for shelter
3. Males show their best side revisited – Effects of predation pressure on laterality in wild guppies
4. Are behavioral responses to eyespots in sticklebacks influenced by the visual environment? An experimental examination
5. Unreplicable state‐dependent effects on start‐box emergence latency in wild‐origin sticklebacks
6. The specificity of sperm-mediated paternal effects in threespine sticklebacks
7. Cue recognition and behavioural responses in the three-spined stickleback (Gasterosteus aculeatus) under risk of fish predation
8. External and internal grouping characteristics of juvenile walleye pollock in the Eastern Bering Sea
9. Studying behavioural variation in salmonids from an ecological perspective: observations questions methodological considerations
10. Real or fake? Natural and artificial social stimuli elicit divergent behavioural and neural responses in mangrove rivulus,
Kryptolebias marmoratus