Communicating science: Sending the right message to the right audience
Abstract
For science communication to be effective, scientists must understand which sources of information their target audiences most frequently use and trust. We surveyed academic and non-academic scientists, natural resource managers, policymakers, students, and the general public about how they access, trust, and communicate scientific information. We found trust and use of information sources was related to participant age and group identity, but all groups had high levels of use and trust of personal experience and colleagues. Academic journals were the most trusted source by all groups, and social media the least trusted by most groups. The level of communication between target groups was not always bilateral, with the public generally perceiving their interaction with all other groups as low. These results provide remarkable insight into the flow of scientific information. We present these findings in the context of facilitating information flow between scientists and other stakeholders of scientific information.
Introduction
Although peer-reviewed journals have long been the primary medium for scientists to communicate among themselves, there is a growing interest among scientists to improve communication with broader audiences, including policymakers, natural resource managers, and the general public (Nisbet and Scheufele 2009; Kuehne et al. 2014; Singh et al. 2014; Varner 2014). Each of these target audiences requires accurate scientific information to make informed decisions (Fischhoff 2013), from the public making decisions about how to conserve ground water during droughts to the actions of policymakers in protecting at-risk species at the national scale (e.g., Rands et al. 2010). For science communication to be effective, there is a need for scientists to understand which sources of information their audiences use and trust. Here, we define science communication as the exchange of scientific information with target audiences.
Currently, scientists have an unprecedented choice of outlets to distribute scientific information. Although traditional approaches (e.g., peer-reviewed journals and academic conferences) are effective for scientists communicating among themselves, science communication requires other outlets to reach broader, non-scientist audiences. For example, news and specialized science media outlets can be used to provide information to the public (e.g., television, newspapers, and radio; Bickford et al. 2012), and web-based media (e.g., podcasts and social media) are increasingly utilized by scientists to communicate with target audiences directly (Darling et al. 2013; Bombaci et al. 2016). Specialized communication channels to reach specific target audiences also exist (e.g., policy briefings). Despite the range in potential communication methods, we are only beginning to understand how these outlets are used and trusted, making it challenging for scientists to identify how best to reach their target audiences.
With so much choice in communication outlets, trust becomes an essential criterion that factors into how audiences consume scientific information. Even primary research includes a degree of uncertainty and non-scientists can often equate uncertainty with a lack of understanding (Dietz 2013). This disconnect between scientists and non-scientists can be magnified if there is an additional lack of trust due to the medium by which scientific information is disseminated. For example, if scientific information is readily available through social media and other online tools (Bik et al. 2015) but users of those information sources do not fully trust them (McClain and Neeley 2014), then these outlets may not be the optimal mechanism for exchanging information. Understanding the trust audiences have in a communication medium can enable scientists to make choices to effectively reach their target audiences. Although information flow is not one-way, the goal of our study is to help scientists to better understand their audiences to more effectively communicate with them.
For scientists to reach their intended audience, they need to understand which sources of scientific information their audiences use and trust. We sought to address this knowledge gap by surveying a range of audiences including academic and non-academic scientists, natural resource managers, policymakers, students, and the general public. We asked users which sources they use to access scientific information and how much they trust these sources. To determine the direction, strength, and gaps in communication, and to identify potential mismatches between trust and use, we also investigated the level of interaction between target audiences. We interpret these results in the context of enhancing information flow between scientists and their audiences.
Materials and methods
Survey questionnaires were administered online through QuestionPro Survey Software (QuestionPro Inc., Seattle, WA, USA; http://www.questionpro.com) from 16 July 2014 to 31 December 2014, and paper-based surveys were distributed through five public libraries across Vancouver, BC, Canada, from 12 August 2014 to 17 October 2014. Paper and web-based surveys had identical questions and answer choices. Respondents did not have to complete every question on the survey. The online questionnaire was advertised through Facebook, Twitter, ResearchGate, listservs (Benthos, Bioserve, Ecolog, and the Society for Conservation Biology), and flyers throughout Vancouver. The paper-based surveys in public libraries allowed for the participation by members of the public who were less likely to find our surveys via the internet-based sources listed above. We selected the five libraries that hosted the survey to capture a wide range of socioeconomic groups. The survey was approved as having minimal risk to participants by the Behavioural Research Ethics Board (BREB# H14-01167) at UBC.
We asked respondents to self-identify as academic scientists, non-academic scientists (e.g., government and consultants), policymakers (i.e., those with the ability to influence or determine policy), resource managers, students, or general public (non-scientist/non-policy), and give demographic information such as age, country of origin, current community type (rural, suburban, and metropolis), and level of education (full survey in Supplementary Material 1). Responses from policymakers were extremely low (n = 2) from our general advertisements, so we contacted 94 members of resource advisory and policy councils from Canada and the United States directly via email, and received a further five responses. Although commercially available survey programs bin data on a discrete scale, we improved the capabilities of our analysis by increasing the number of bins to the maximum (100) possible for the software with general Likert guides (e.g., never, monthly, daily; not at all, neutral, and very much), rather than using a traditional five-point scale. Thus, our 100-point scale approximated a more appropriate continuous scale for our response variable (Chimi and Russell 2009). Although paper responses were continuous values, we binned answers to the same 100-point scale to make paper and online responses comparable. To minimize differences in interpretation of the general trust questions by participants, we created a term for general trust by asking participants to rate their agreement with the statements, “most people can be trusted” and “you can’t be too careful in dealing with people” and then generated a single value based on responses.
Statistical analyses
All analyses were conducted in R (v. 3.1.1, R Core Development Team). Our final dataset for mixed models consisted of 334 participants. Sample sizes for each “group” were as follows: academic scientists = 59, natural resource managers = 23, non-academic scientists = 56, policymakers = 5, students = 93, and general public = 98. We binned the age of participants into five-year intervals to provide relatively balanced sample sizes per age group (minimum 13 participants per interval) while not losing information regarding the effects of participant age on information source use or trust, except for ages 18–20 (youngest age of participants), and 66+ (due to low number of participants in each five-year bin above this age). Thus, sample sizes for each age category were 18–20 = 24, 21–25 = 40, 26–30 = 52, 31–35 = 50, 36–40 = 37, 41–45 = 29, 46–50 = 24, 51–55 = 26, 56–60 = 13, 61–65 = 17, and 66+ = 22. For our models of information source trust and use, we excluded education as a predictor as this variable was highly correlated with both age and group. We did not expect survey medium (i.e., paper or online) to influence survey responses (Denscombe 2006); however, we included survey medium as a random effect in all models to be conservative, given the narrow geographical region sampled via paper versus the global distribution of online responses.
We used an information theoretic (IT) approach (Burnham and Anderson 2002), linear mixed-effects models, and model averaging to determine the relative influences of age, group, and general trust on both the use of three main sources of information (academic journals, social media, and personal experience) and the trust in these sources. These three sources were chosen as journals represent the traditional standard of science communication, social media is an emerging method of general communication, and personal experience is common to all groups and influences levels of trust. For each response, we scaled the dependent variable to reduce skew and then constructed a global model with country and community as random effects, and age, group, and general trust as fixed effects. We used a conservative approach to estimate the “best possible” (i.e., most parsimonious) model for each response variable. To do so, we fit all possible combinations of our fixed effects (eight models, or 2 n where n = number of predictors), selected those with ΔAICc (AICc = Akaike information criterion (corrected for small sample sizes)) ≤ 2 from the top model, and estimated parameters for each fixed effect included in these ΔAICc ≤ 2 subsets by model averaging following Burnham and Anderson (2002).
To compare trust in and use of information sources by groups, we used a Kruskal–Wallis analysis of variance (ANOVA) with multiple comparisons for “trust” and “use” scores for each information source (values binned between 0 and 100) by group. We also used this method to compare the perceived frequency of communication within and among groups.
Results
Trust versus use
Of our six series of linear mixed-effects models examining the trust and use of social media, academic journals, and personal experience by groups, global models investigating academic journals fit our data best for both trust (R 2 = 0.19) and use (R 2 = 0.35), whereas global models investigating the trust and use of personal experience had the lowest fit (R 2 = 0.04, 0.16, respectively; Table 1). Full details of model comparison for each suite of models fitted to each response variable are presented in Table S1, whereas parameter estimates from the final averaged model for each response variable are presented in Table 1. Model results suggested that members of all groups trust peer review over other sources, but of all groups, the general public had the lowest trust of peer-reviewed journals, and used this information source the least, on average (Table 1). Participants between the ages of 26 and 30 exhibited higher trust of social media, whereas non-academic scientists and the general public exhibited significantly less trust of social media (Table 1). Participants over age 50 and the general public also used social media less to access scientific information (Table 1).
Table 1.
| Trust | Use | |||||
|---|---|---|---|---|---|---|
| Social media | Academic journals | Personal experience | Social media | Academic journals | Personal experience | |
| R 2 = 0.14, s = 4, wt = 0.81 | R 2 = 0.19, s = 4, wt = 0.81 | R 2 = 0.04, s = 2, wt = 0.99 | R 2 = 0.20, s = 3, wt = 0.91 | R 2 = 0.35, s = 2, wt = 0.99 | R 2 = 0.16, s = 3, wt = 0.84 | |
| Intercept | −0.14 (−0.74 to 0.47) | −0.43 (−1.17 to 0.31) | −0.031 (−0.31 to 0.24) | 0.090 (−0.48 to 0.66) | 0.43 (−0.14 to 1.00) | 0.041 (−0.47 to 0.56) |
| Age 21–25 | 0.33 (−0.18 to 0.85) | 0.29 (−0.17 to 0.73) | 0.17 (−0.31 to 0.66) | 0.26 (−0.25 to 0.77) | ||
| Age 26–30 | 0.49 (0 to 0.98) | 0.27 (−0.16 to 0.70) | 0.35 (−0.12 to 0.82) | 0.14 (−0.35 to 0.63) | ||
| Age 31–35 | 0.38 (−0.13 to 0.88) | 0.098 (−0.34 to 0.53) | −0.014 (−0.51 to 0.48) | 0.32 (−0.18 to 0.82) | ||
| Age 36–40 | 0.010 (−0.42 to 0.62) | 0.15 (−0.30 to 0.60) | −0.10 (−0.62 to 0.41) | 0.29 (−0.23 to 0.80) | ||
| Age 41–45 | 0.025 (−0.52 to 0.58) | 0.17 (−0.31 to 0.65) | −0.28 (−0.83 to 0.27) | −0.23 (−0.77 to 0.32) | ||
| Age 46–50 | 0.24 (−0.34 to 0.82) | −0.010 (−0.52 to 0.50) | 0.067 (−0.50 to 0.64) | −0.013 (−0.59 to 0.57) | ||
| Age 51–55 | −0.16 (−0.75 to 0.43) | −0.48 (−0.97 to 0) | −0.58 (−1.17 to −0.02) | −0.34 (−0.90 to 0.22) | ||
| Age 56–60 | −0.54 (−1.26 to 0.18) | 0.015 (−0.58 to 0.61) | −0.81 (−1.51 to −0.11) | −0.42 (−1.12 to 0.27) | ||
| Age 61–65 | −0.43 (−1.08 to 0.22) | −0.25 (−0.79 to 0.30) | −1.01 (−1.65 to −0.37) | −0.56 (−1.19 to 0.08) | ||
| Age 66+ | −0.16 (−0.76 to 0.43) | −0.35 (−0.86 to 0.17) | −0.87 (−1.45 to −0.29) | 0.22 (−0.36 to 0.80) | ||
| Resource manager | −0.29 (−0.84 to 0.27) | −0.380 (−0.82 to 0.06) | −0.37 (−0.89 to 0.15) | −0.80 (−1.18 to −0.42) | ||
| Non-academic scientist | −0.43 (−0.82 to −0.03) | −0.017 (−0.35 to 0.31) | −0.053 (−0.44 to 0.33) | −0.45 (−0.74 to −0.16) | ||
| General public | −0.42 (−0.77 to −0.06) | −0.37 (−0.73 to −0.02) | −0.35 (−0.70 to −0.01) | −1.25 (−1.56 to −0.94) | ||
| Policymaker | 0.60 (−0.30 to 1.50) | 0.19 (−0.63 to 1.01) | 0.76 (−0.17 to 1.69) | −0.88 (−1.59 to −0.17) | ||
| Student | −0.080 (−0.43 to 0.27) | −0.024 (−0.33 to 0.28) | −0.22 (−0.60 to 0.16) | −0.56 (−0.82 to −0.29) | ||
| General trust | 0.54 (−0.30 to 1.39) | 0.67 (−0.01 to 1.34) | 0.19 (−0.57 to 0.95) | 0.41 (−0.35 to 1.17) | 0.37 (−0.22 to 0.95) | 0.27 (−0.49 to 1.03) |
Note: Significant predictors (where confidence intervals do not overlap zero) are depicted in bold. R 2 describes the goodness of fit of the global model for each response variable, whereas s and wt represent the number of models incorporated in the final averaged model and their cumulative AIC weight, respectively. Only values from predictors incorporated into the final averaged model for each response variable are included.
Each group ranked peer-reviewed scientific journals the highest in terms of trust followed by scientific conferences (84.9 ± 18.3 [SD] vs 80.8 ± 21.1, P < 0.001, n = 385; Fig. 1, Table S2). The public used peer-reviewed journals (36.6 ± 28.5) significantly less than news outlets (61.7 ± 33.5, P < 0.001, n = 89) and personal experience (59.8 ± 28.0, P < 0.001, n = 89), though not significantly less than information from colleagues (45.7 ± 31.8, P = 0.08, n = 89). Personal experience and colleagues were both widely used and trusted sources of scientific information across all groups (mean use: 59.2 ± 29.1, 68.5 ± 29.3; mean trust: 60.9 ± 24.0, 70.7 ± 23.6, respectively). News outlets and social media were also widely used to access scientific information (56.7 ± 34.0 and 50.9 ± 36.9), but were among the least-trusted sources of scientific information (44.4 ± 24.2 and 33.5 ± 24.9, respectively).
Fig. 1.
Communication within and among groups
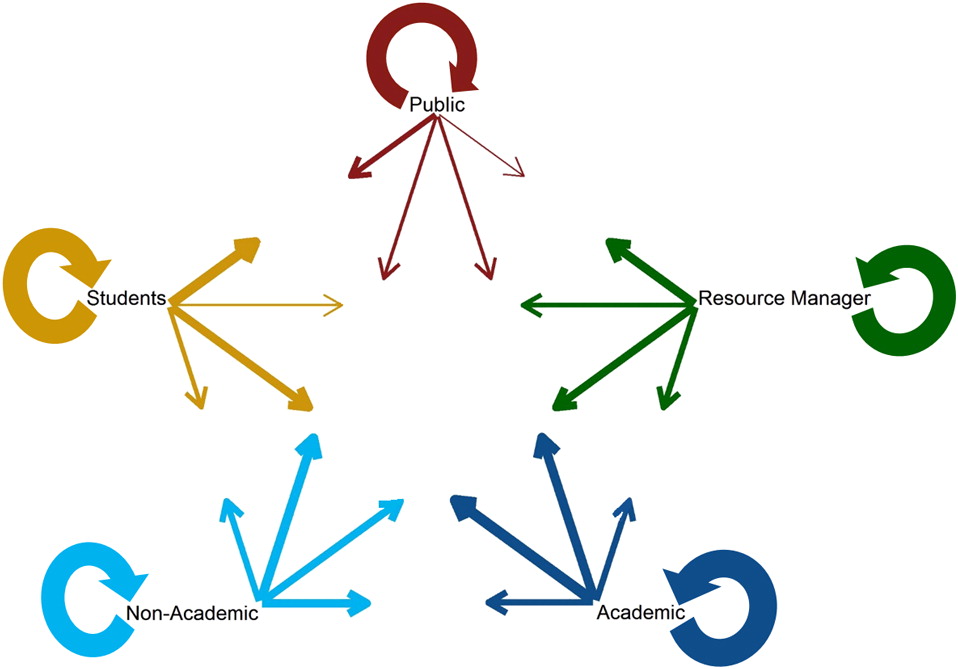
As expected, participants interacted more often with members from their own group than others (82.5 ± 27.9 within group vs 45.7 ± 35.1 out of group, P < 0.001, n = 273; Fig. 2). However, the public had the weakest within-group interaction (66.4 ± 37.4) compared to other groups (90.3 ± 18.4, P < 0.001, n = 366; Table S3). The public also estimated their frequency of interaction with all other groups as much lower than it was perceived by the other group in the interaction (29.6 ± 29.9 vs 77.8 ± 30.7, P < 0.001, n = 354; Fig. 2).
Fig. 2.
Discussion
Trust versus use
Peer review has long been the gold standard by which scientists measure information and communicate results (Neylon and Wu 2009). Thus, the finding that each group trusted peer-reviewed scientific journals the most is not surprising. Although scientists commonly rely on peer-reviewed journals, the general public used them the least of all groups and instead tended to learn from personal experiences, news outlets, or colleagues. Personal experience and colleagues were both widely used and trusted sources of scientific information among all groups, a trend that suggests ease of accessibility and the desire for discovery-based learning (Kolb and Kolb 2009). Interestingly, although news outlets and social media were commonly used to access scientific information, they were among the least-trusted sources, perhaps stemming from fears over sensationalism and misreporting (Kohring and Matthes 2007).
Given academic journals were the most trusted source of information across all groups, increasing their use outside academia is desirable. Harris et al. (2014) found that over half of the staff members in US state health departments did not use peer-reviewed journals to find evidence, with access and cost identified as reasons. The problem of poor access to scientific research is likely magnified for the general public, who may, in turn, be forced to access scientific information from other, likely non-peer-reviewed sources. As scientific research continues to become more “open”, there is great potential for scientists to engage in meaningful interactions with other groups. However, there are still barriers for authors to make their work open access, including publication costs, limitations in the types of open access journals that are available (e.g., certain disciplines may have few open access journals available to publish in), and in some cases, perceived lower quality of open access journals (e.g., predatory publishers, newer publications having low citations if they are not adequately indexed and searchable). However, there is evidence when controlling for journal age and discipline citation rates for open access articles are nearly identical in biomedical fields (Björk and Solomon 2012), and certainly over time, as open access articles are more widely accessible, many will have increased readership and citations. However, a general lay audience may still have difficulties understanding the technical language of a scientific paper; to communicate the main points of a paper to a wider audience, journals could consider publishing lay abstracts (i.e., plain language summaries) with traditional abstracts (Kuehne and Olden 2015). In addition, publicizing these lay abstracts through social media, which is already widely used by scientists and non-scientists alike, might be effective for engaging a diversity of audiences (Bickford et al. 2012). Scientists are increasingly using social media to engage with target audiences (e.g., Darling et al. 2013). However, to build trust in this medium, there is a need for mechanisms that distinguish trustworthy science from non-peer-reviewed information. One possibility might be the creation of “verified” social media accounts of leading scientists as a means of evaluating the quality and integrity of shared information. Such a platform could function like some open access journals where both reviews and author responses are published alongside the original research (e.g., PeerJ) with a lay, rather than academic, readership as the target. Social media would also allow target audiences to engage directly with scientists through posting questions or comments. The relatively low use of peer-reviewed journals among non-scientists may also reflect that many peer-reviewed studies are inaccessible behind paywalls (Hayes 1992). The push toward open access journals may begin to reverse this trend. In addition, although we did provide examples of common peer-reviewed journals in our survey (Nature and PLoS ONE), it is very likely that many members of the general public may be unclear about whether a publication is actually a peer-reviewed journal or not. It would likely be beneficial for scientists to conduct outreach educating the public about what peer review means, and how to evaluate journals and peer-reviewed articles. Understanding how to critique science on their own would likely increase the trust the public has in the scientific process. However, this is also an area where current research is lacking and little empirical evidence is available.
Communication among groups
We found considerable within-group interaction and little bilateral interaction among many groups. In particular, the public self-reported less communication with other groups than was perceived by those groups. In contrast, policymakers reported a higher level of interaction with other groups than was perceived by those groups. To our knowledge, this is the first evidence of such an asymmetry in science communication. This pattern might be a byproduct of the relative number of policymakers (few) and public (many). Policymakers were very difficult to reach in conducting this survey (see Materials and methods), and this difficulty in direct communication may also factor into the low perceived interaction with policymakers by other groups. Furthermore, the very few policymakers who took the time to respond to our survey are likely more interested in science communication, and our results from such a small sample size should be treated with caution.
Our finding that the public reported little communication with other groups suggests there is a greater need for public outreach in scientific discourse. Part of the challenge is that, too often, science communication is still seen as a one-way flow of information, which is not the best mind-set for engaging with an audience (Miller 2001). Even when scientists are encouraged to frame their research in an interesting narrative, scientists are still cast as the guardians of knowledge, generously sharing their findings with members of the public (e.g., Olson 2009). Taking an empirical approach to determine how people understand scientific information may be key to improving communication among groups (Varner 2014). As our results show, personal experience is a common and trusted way for people from various groups to receive scientific information. Citizen science is an obvious way to increase the public’s personal experience with science; however, previous studies have found that the amount of scientific information participants learn from participating in citizen science projects can be limited (Jordan et al. 2011; Land-Zandstra et al. 2016). If citizen science is successful, it may help to not only inform the target audience but also create a sense of appreciation for the scientific process and better inform lay decision making (Dickinson et al. 2012). There is a clear precedent that active engagement, dialogue, and discussion are crucial factors in promoting knowledge retention, enthusiasm, and analytical capacity (Varner 2014), which may, in turn, support the communication of scientific information. Targeted communications training for the next generation of scientists could facilitate the process of information flow among groups and enhance the practice of science communication. In addition, many universities and institutions have developed media relation centers, and conferences have begun to include workshops on improving science communication; we encourage the use of these tools which are currently available.
Although we surveyed a broad audience across the web, most responses from the general public came from library submissions in Vancouver. Although it is unlikely that response quality differed between paper and online surveys (Yun and Trumbo 2000; Denscombe 2006) and respondents’ country of origin was included in our models to account for any geographical bias, some caution should still be taken in generalizing the results from the surveyed public to the global public, as religious and political values might influence how science communication is viewed regionally.
Conclusions
Our results suggest trust and use of scientific information differs based on audience. Even so, key trends such as the high use of social media by the public and the high trust of peer-reviewed journals point to a path for enhancing communication between groups. With calls for science communication to be more effective, understanding how individuals access and trust scientific information outlets is essential to ensuring the right message reaches the right audience.
Acknowledgements
R. Matthews in the Department of Sociology at UBC advised our survey design. S. Singh and library branch heads of Vancouver Public Libraries allowed us to use the libraries as survey stations. Funding provided by the Biodiversity Research Centre at UBC. The thoughtful contributions of two anonymous reviewers improved the quality of this manuscript.
References
Bickford D, Posa MRC, Qie L, Campos-Arceiz A, and Kudavidanage EP. 2012. Science communication for biodiversity conservation. Biological Conservation, 151(1): 74–76.
Bik HM, Dove AD, Goldstein MC, Helm RR, MacPherson R, Martini K, et al. 2015. Ten simple rules for effective online outreach. PLoS Computational Biology, 11(4): e1003906.
Björk BC, and Solomon D. 2012. Open access versus subscription journals: a comparison of scientific impact. BMC Medicine, 10(73): 1–10.
Bombaci SP, Farr CM, Gallo HT, Mangan AM, Stinson LT, Kaushik M, et al. 2016. Using Twitter to communicate conservation science from a professional conference. Conservation Biology, 30(1): 216–225.
Burnham K, and Anderson D. 2002. Model selection and multi-model inference: a practical information-theoretic approach. Springer, New York, New York, USA. 488 pp.
Chimi CJ, and Russell DL. 2009. The Likert scale: a proposal for improvement using quasi-continuous variables. In Proceedings of the Information Systems Education Conference, Washington, DC, 8 November 2009. Vol. 26. pp. 1–10 [online]: Available from: http://proc.isecon.org/2009/4333/ISECON.2009.Chimi.pdf.
Darling ES, Shiffman D, Côté IM, and Drew JA. 2013. The role of Twitter in the life cycle of a scientific publication. Ideas in Ecology and Evolution, 6(1): 32–43.
Denscombe M. 2006. Web-based questionnaires and the mode effect: an evaluation based on completion rates and data contents of near-identical questionnaires delivered in different modes. Social Science Computer Review, 24(2): 246–254.
Dickinson JL, Shirk J, Bonter D, Bonney R, Crain RL, Martin J, et al. 2012. The current state of citizen science as a tool for ecological research and public engagement. Frontiers in Ecology and the Environment, 10(6): 291–297.
Dietz T. 2013. Bringing values and deliberation to science communication. Proceedings of the National Academy of Sciences, 110(3): 14081–14087.
Fischhoff B. 2013. The sciences of science communication. Proceedings of the National Academy of Sciences, 110(3): 14033–14039.
Harris JK, Allen P, Jacob RR, Elliott L, and Brownson RC. 2014. Information-seeking among chronic disease prevention staff in state health departments: use of academic journals. Preventing Chronic Disease, 11: E138.
Hayes DP. 1992. The growing inaccessibility of science. Nature, 356(6372): 739–740.
Jordan RC, Gray SA, Howe DV, Brooks WR, and Ehrenfeld JG. 2011. Knowledge gain and behavioral change in citizen-science programs. Conservation Biology, 25(6): 1148–1154.
Kohring M, and Matthes J. 2007. Trust in news media: development and validation of a multidimensional scale. Communication Research, 34(2): 231–252.
Kolb AY, and Kolb DA. 2009. The learning way: meta-cognitive aspects of experiential learning. Simulation & Gaming, 40(3): 297–327.
Kuehne LM, and Olden JD. 2015. Opinion: lay summaries needed to enhance science communication. Proceedings of the National Academy of Sciences, 112(12): 3585–3586.
Kuehne LM, Twardochleb LA, Fritschie KJ, Mims MC, Lawrence DJ, Gibson PP, et al. 2014. Practical science communication strategies for graduate students. Conservation Biology, 28(5): 1225–1235.
Land-Zandstra AM, Devilee JLA, Snik F, Buurmeijer F, and van den Broek JM. 2016. Citizen science on a smartphone: participants’ motivations and learning. Public Understanding of Science, 25(1): 45–60.
McClain C, and Neeley L. 2014. A critical evaluation of science outreach via social media: its role and impact on scientists. F1000Research, 3: 300.
Miller S. 2001. Public understanding of science and the crossroads. Public Understanding of Science, 10(1): 115–120.
Neylon C, and Wu S. 2009. Article-level metrics and the evolution of scientific impact. PLoS Biology, 7(11): e1000242.
Nisbet MC, and Scheufele DA. 2009. What’s next for science communication? Promising directions and lingering distractions. American Journal of Botany, 96(10): 1767–1778.
Olson R. 2009. Don’t be such a scientist. Island Press, Washington, DC. 216 pp.
Rands MR, Adams WM, Bennun L, Butchart SH, Clements A, Coomes D, et al. 2010. Biodiversity conservation: challenges beyond 2010. Science, 329(5997): 1298–1303.
Singh GG, Tam J, Sisk TD, Klain SC, Mach ME, Martone RG, et al. 2014. A more social science: barriers and incentives for scientists engaging in policy. Frontiers in Ecology and the Environment, 12(3): 161–166.
Varner J. 2014. Scientific outreach: toward effective public engagement with biological science. BioScience, 64(4): 333–340.
Yun GW, and Trumbo CW. 2000. Comparative response to a survey executed by post, e-mail, and web form. Journal of Computer-Mediated Communication, 6(1).
Supplementary material
Supplementary Material 1(PDF / 107 KB):
- Download
- 107.30 KB
Supplementary Material 2(PDF / 34.6 KB):
- Download
- 34.62 KB
Supplementary Material 3(PDF / 15.8 KB):
- Download
- 15.83 KB
Supplementary Material 4(PDF / 12.6 KB):
- Download
- 12.68 KB
Information & Authors
Information
Published In
FACETS
Volume 1 • Number 1 • January 2017
Pages: 127 - 137
Editor: Steve Heard
History
Received: 16 April 2016
Accepted: 28 June 2016
Version of record online: 31 August 2016
Copyright
© 2016 Wilson et al. This work is licensed under a Creative Commons Attribution 4.0 International License (CC BY 4.0), which permits unrestricted use, distribution, and reproduction in any medium, provided the original author(s) and source are credited.
Data Availability Statement
All relevant data are within the paper and in the Supplementary Material.
Key Words
Sections
Subjects
Authors
Author Contributions
All conceived and designed the study.
MJW, TLR, and EKP performed the experiments/collected the data.
MJW and RRG analyzed and interpreted the data.
All contributed resources.
All drafted or revised the manuscript.
Competing Interests
MRD is employed by Canadian Science Publishing, publisher of FACETS, but was not involved in review or editorial decisions regarding this manuscript.
Metrics & Citations
Metrics
Other Metrics
Citations
Cite As
Matthew J. Wilson, Tonya L. Ramey, Michael R. Donaldson, Ryan R. Germain, and Elizabeth K. Perkin. 2017. Communicating science: Sending the right message to the right audience. FACETS.
1(): 127-137. https://doi.org/10.1139/facets-2016-0015
Export Citations
If you have the appropriate software installed, you can download article citation data to the citation manager of your choice. Simply select your manager software from the list below and click Download.
Cited by
1. UK flockdown: A survey of smallscale poultry keepers and their understanding of governmental guidance on highly pathogenic avian influenza (HPAI)
2. Literature syntheses to inform marine ecosystem management: lessons learned from stakeholder participation
3. Cascading effects of climate change on recreational marine flats fishes and fisheries
4. Bursting out of our bubble: using creative techniques to communicate within the systematic review process and beyond
5. Facilitating the wise use of experts and evidence to inform local environmental decisions
6. UALGORITMO, a New Instrument of the University of Algarve for Scientific Outreach
7. Embracing Complexity and Context to Improve Science Communication
8. Online Noise as Illustrated by Pitfalls and Biogeography Associated With Common Names for Puma concolor
9. The first five years of FACETS: Canada’s multidisciplinary open access academy journal
10. Communication of Design Research: A Use-Case Agnostic Framework and Its Application
11. Going rogue: what scientists can learn about Twitter communication from “alt” government accounts
12. Prescribed Burns in California: A Historical Case Study of the Integration of Scientific Research and Policy
13. “You Gotta Choose Your Words Carefully”: Findings from Interviews with Environmental Health Scientists about Their Research Translation Perceptions and Training Needs
14. Informing conservation decisions through evidence synthesis and communication
15. Considerations for effective science communication