Open access

Carbon cycle implications of terrestrial weathering changes since the last glacial maximum

Publication: FACETS
14 March 2017

Abstract

We examine the importance of the rock weathering feedback mechanism during the last deglacial period (∼16 000–4000 BCE) using an Earth system model of intermediate complexity (the University of Victoria Earth System Climate Model (UVic ESCM)) with four box-model parameterizations of terrestrial weathering. The deglacial climate change is driven by changes in orbital parameters, ice core reconstructions of atmospheric CO2 variability, and prescribed removal of continental ice sheets. Over the course of the 12 000 year simulation period, increases in weathering provide a mechanism that slowly removes CO2 from the atmosphere, in opposition to the observed atmospheric CO2 increase during this period. These processes transfer both carbon and alkalinity to the ocean, the combination of which results in as much as a 1000 Pg C increase in total ocean carbon, relative to a control simulation with constant weathering. However, the rapid expansion of northern hemisphere vegetation introduces a significant uncertainty among the weathering parameterizations. Further experiments to test the individual impacts of weathering dissolved inorganic carbon and alkalinity fluxes on ocean biogeochemistry suggest that the worldwide distribution of rock types and the ratio of carbonate to silicate weathering may be crucially important in obtaining an accurate estimate of changes in global weathering rates.

Introduction

The weathering of carbonate and silicate rocks on land is a key process in the global carbon cycle and, through its coupling with calcium carbonate deposition in the ocean, is the primary sink of carbon on geological timescales (Urey 1952; Walker et al. 1981). The rate at which these processes remove carbon from the Earth system is sensitive to changes in the environment, notably temperature (Berner 1991), biological production (Lenton and Britton 2006), and perhaps more indirectly, river runoff (Walker and Kasting 1992). This gives rise to a negative feedback mechanism that regulates the global climate on multimillennial timescales. However, there have been very few quantitative assessments of its impacts on carbon cycling and ocean biogeochemistry, and its relevance over time frames of 104 years or shorter is largely unknown.
The purpose of this paper is to investigate how the potential changes in global terrestrial weathering may have affected ocean biogeochemistry and the global carbon cycle during the last deglacial period (∼19 000–4000 BC). Changes in weathering rates are expressed as a modulation of initial conditions based on changes in temperature, atmospheric CO2, or vegetation net primary production (NPP), and various parameterizations are tested and compared using the University of Victoria Earth System Climate Model (UVic ESCM). A prescribed time series of atmospheric CO2 is used to accurately drive climate change during the period and thus better estimate changes in weathering rates. The impact of the latter on atmospheric CO2 concentrations is then determined using the weathering rates obtained previously as boundary conditions for a second set of simulations performed at various periods of the deglaciation during which atmospheric CO2 is allowed to vary according to model carbon cycle dynamics. Overall, this study allows us to make an estimate of the variations in weathering rates within glacial–interglacial timescales and their impact on the carbon cycle.
The chemical weathering of rocks is characterized by the cleavage of bonds of the mineral lattice by water, often in the presence of an organic or inorganic acid. Carbonic acid (H2CO3) is one such secondary weathering agent, acquired from the dissolution in rainwater of atmospheric carbon or the oxic degradation of organic matter in soils. Rock weathering products, including calcium and bicarbonate ions (the most abundant cation and anion, respectively, in most river waters), can be carried away with runoff to rivers and into the ocean. For example, calcium carbonate dissolution by carbonic acid is represented by:
CaCO3+CO2+H2OCa2++2HCO3
(1)
The influx of dissolved inorganic carbon (DIC) ([CO2(aq)] + [H2CO3] + [HCO3 ] + [CO3 2−]) and carbonate alkalinity (CA) ([HCO3 ] + 2[CO3 2−]) to the ocean surface layer is balanced by the precipitation and burial of biogenic calcium carbonate (CaCO3) in the marine sediments; perturbations to the oceanic [CO3 2−] (= (DIC − CA) at the pH of seawater) result in a repositioning of the carbonate compensation depth (CCD), the depth below which the dissolution rate of calcium carbonate exceeds its flux to the deep sea. In the long term, this allows the ocean to maintain a remarkably stable alkalinity, as any increases in ocean acidity (such as can be caused by a CO2 invasion from the atmosphere) can be neutralized by elevating the CCD, exposing carbonate sediments to dissolution, and the release of carbonate ions (CO3 2−) back into the ocean. This oceanic buffer factor, along with carbonate dissolution on land (due to weathering), is the primary means through which ocean alkalinity is restored and is responsible for maintaining both atmospheric and oceanic pCO2 close to equilibrium. In short, the weathering of calcium carbonate can accelerate the transfer of CO2 between the atmosphere and the ocean, but it does not contribute to a permanent return of carbon to the geologic reservoir (Ridgwell and Zeebe 2005; Sarmiento and Gruber 2006).
A large fraction of rock weathering reactions involves a weakening of chemical bonds in the lattice of silicate minerals on contact with water, whereby hydrogen ions replace positively charged cations (mostly Ca2+ and Mg2+), which are bounded to the negatively charged ion (alumino)silicate framework. One of the most common examples is given by calcium silicate hydrolysis, as described by the following schematic, irreversible (at Earth surface conditions) reaction (Ebelmen 1845; Urey 1952):
CaSiO3+2CO2+3H2OCa2++H4SiO4+2HCO3
(2)
This equation represents the weathering of a simple silicate mineral (in our example, wollastonite) into silicic acid (which often precipitates as amorphous silica SiO2), consuming one more molecule of CO2 than carbonate dissolution while sending the same amounts of calcium and bicarbonate ions to the ocean. The combination of eq. (2) with calcium carbonate precipitation (the reverse of eq. 1) shows how this results in a net removal of one molecule of CO2:
CaSiO3+CO2CaCO3+SiO2
(3)
Weathering rates due to silicate hydrolysis tend to be considerably slower than from the dissolution of carbonate minerals—it removes on an average of 0.28–0.30 Pg C per year (Amiotte Suchet and Probst 1995)—hence, the effect of atmospheric CO2 consumption by silicate weathering only becomes a significant sink of carbon on geological timescales (105 to 106+ years). For the remainder of this article, dissolution of carbonates (on land) and hydrolysis of silicates will be treated separately and referred to as carbonate and silicate weathering, respectively.
The role of rock weathering in regulating long-term global climate has been established by past box-modeling efforts (Walker et al. 1981; Berner et al. 1983; Berner 1991). These studies linked the rate of atmospheric CO2 consumption by silicate weathering to changes in atmospheric partial CO2 pressure, as a possible explanation for the general decreasing trend of atmospheric CO2 levels on geological timescales. Although atmospheric CO2 concentration is often used as a broad proxy for environmental and(or) climate change, sometimes the direct effects of temperature and river runoff were also parameterized in these studies. Walker et al. (1981) (commonly referred to as WHAK) developed expressions relating silicate weathering to atmospheric pCO2 (through vegetation production) and temperature (including a weak dependency on runoff) and used them to offer a solution to the faint young Sun paradox by providing a convenient mechanism for a slow and steady decrease in atmospheric greenhouse gas concentrations. Although the model used rudimentary parameterizations derived from early general circulation models and experimental data, it built a foundation for future long-term carbon cycle model studies.
Berner et al. (1983) (commonly referred to as BLAG) built a geochemical cycle model in which the long-term evolution of atmospheric carbon content is driven by imbalances between CO2 outgassing by volcanic activity and the burial of carbonate sediments that follows the weathering of silicate rocks. In this model, the silicate weathering rate was given a similar dependency on temperature and atmospheric CO2, and it was used to solve a series of mass balance equations to determine the inward and outward fluxes for the atmospheric, land, ocean, and mineralogical carbon reservoirs. Following Berner et al. (1983), Berner (1991) simplified the geochemical component by lumping together the carbonate minerals and combining the atmosphere and ocean into a single reservoir, in favor of adding more direct biological mechanisms (notably, the soil-biological enhancement of weathering). Land area, elevation, and runoff were also introduced as parameters in the new model called GEOCARB. Much like its predecessor, this model was developed to reconstruct the evolution of atmospheric pCO2 over the past hundreds of millions of years (which was calculated as a series of successive atmosphere–ocean steady states). Subsequent versions were called GEOCARB II (Berner 1994) and GEOCARB III (Berner and Kothavala 2001), and these further improved the weathering parameterizations based on the latest observational data and global circulation model (GCM) output.
The importance of the negative feedback mechanism associated with rock weathering is somewhat underwhelming on non-geological timescales, with few notable exceptions; chief among these is the late Pleistocene epoch (Kump and Alley 1994; Munhoven 2002) because of the rapid climatic and environmental changes that accompany glacial inception and termination. Yet, due to a lack of a quantitative assessment of the latter’s impacts on global rock weathering, there is considerable uncertainty as to whether the intensity of each glacial or interglacial period would be reinforced or tempered as a result of changes in weathering rates (Bluth and Kump 1994). On the one hand, the combination of cooler global temperatures and weathering-inhibiting ice sheets should act to reduce CO2 consumption from chemical weathering during glacial maxima, hence keeping with its perceived role as a negative feedback mechanism. On the other hand, the drop in mean sea level during said glaciations would have increased the effective area of continental shelves that are exposed to weathering, including a large increase in continental land area at low latitudes. Moreover, the intense pressure of ice sheets could increase the mineral reactivity of silicate rocks, thus drastically increasing weathering rates for a short period when the ice sheet retreats and the area is subject to weathering again (Kump and Alley 1994). However, little is known about the relative impacts of each of those factors; thus, it is difficult to establish with certainty what would have been the role of rock weathering in the context of shifting glacial conditions in the northern hemisphere.
Few attempts have been made using climate models to investigate the significance of variations in chemical weathering rates during the Pleistocene glacial cycles. Bluth and Kump (1994) developed a spatially explicit, empirical weathering scheme in which the runoff dependency of weathering is modulated by the local lithological composition. Considering an increase of continental margins and a decrease in ice-free continental land during the last glacial maximum (LGM), this model could not reproduce the apparent increase in global silicate weathering that was suggested by the Ge/Sr isotope records of that time (Gibbs and Kump 1994). In an intercomparison study, Munhoven (2002) compared glacial–interglacial variations in CO2 between the latter and the GEM-CO2 (Amiotte Suchet and Probst 1995) models. Glacial bicarbonate production rates were found to be 20%–30% lower compared with the present day, whereas CO2 consumption rates decreased by 5%–20% during the LGM, accounting for up to one quarter of the total fluctuations in atmospheric CO2 levels. The loss in CO2 consumption was not partitioned equally between the two weathering processes, with a slight increase in modern silicate weathering being accompanied by a much larger decrease in carbonate weathering. More recently, the importance of rock weathering on glacial timescales has been questioned; Foster and Vance (2006) argued that the reduction of weathering in glaciated continental interiors would have been significant enough to negate the enhancing effect of exposed continental shelves due to receding sea levels.
The remainder of this paper is divided into four sections. The first section describes the climate model used in this study, and the second section presents an overview of the experimental setup. The “Results” section presents the outputs of the transient and snapshot model runs. Concluding remarks are given in the final section.

Model description

This study uses version 2.9 of the University of Victoria Earth System Climate Model (henceforth UVic ESCM), which is an intermediate-complexity coupled atmosphere/ocean/sea-ice model with integrated land surface and vegetation schemes (Weaver et al. 2001). Its main component is version 2.2 of the Geophysical Fluid Dynamics Laboratory (GFDL) modular ocean model (MOM), a three-dimensional ocean general circulation model with 19 uneven vertical levels (Pacanowski 1995), which is coupled to a vertically integrated energy–moisture balance atmosphere model (Fanning and Weaver 1996), a dynamic–thermodynamic sea-ice model (Bitz et al. 2001), a land surface scheme and dynamic global vegetation model (Meissner et al. 2003), and a sedimentation model (Archer 1996). Land surface properties (surface temperature, soil moisture content and temperature, and snow cover) and soil carbon content are computed with a single (1 m) layer version of the Meteorological Office surface exchange scheme version 2 (MOSES-2) (Cox et al. 1999), and terrestrial vegetation dynamics are handled by the Hadley Centre’s top-down representation of interactive foliage and flora including dynamics (TRIFFID) model (Cox 2001). The TRIFFID model describes the state of the terrestrial biosphere in terms of soil carbon content and vegetation distribution, which is expressed through the structure and coverage of five plant functional types: broadleaf tree, needleleaf tree, C3 grass, C4 grass, and shrub vegetation.
The UVic ESCM also includes a fully coupled global carbon cycle, which consists of inorganic carbon chemistry and land surface exchanges of CO2 (Ewen et al. 2004), and a nutrient-phytoplankton-zooplankton-detritus (NPZD) module that calculates the contribution of the biological pump to ocean biogeochemistry (Schartau and Oshlies 2003; Schmittner et al. 2008). Terrestrial carbon fluxes and reservoirs are described by Matthews et al. (2005) and coupled to the global model by Meissner et al. (2003).
The model is driven in the short term by seasonal variations in solar insolation and wind fields (Kalnay et al. 1996) and in the long term by orbital parameter changes and a reconstruction of atmospheric CO2 content over the past 20 000 years (Indermühle et al. 1999). The spatial coverage and height of continental ice sheets, which are prescribed every 1000 years using data from the model ICE-5G (Peltier 2004), also act as a driver of climate change during the deglacial period. The land–sea configuration used in all subcomponents operates in a global spatial domain with a spherical grid resolution of 3.6° (zonal) by 1.8° (meridional), which is comparable with most coupled coarse resolution atmospheric-oceanic global circulation models (AOGCMs). In the current configuration of the model, ocean bathymetry and sea level are static and fixed to present-day conditions, and thus some features of the LGM and deglacial period are not included here, such as the lower sea level and appearance of continental shelves in shallow portions of the current-day ocean.
Terrestrial weathering in the UVic ESCM is parameterized as a land-to-ocean flux of dissolved inorganic carbon (FDIC) and alkalinity (FALK, with FALK = 2FDIC) via river discharge. In the standard version of the model, the incoming flux of carbon to the ocean as weathering is set to equal the sedimentation rate of CaCO3 to balance the long-term carbon and alkalinity budgets in the ocean; the initial, steady-state value is typically held constant throughout the transient model runs. This effectively suppresses the long-term negative feedback mechanism by preventing the weathering rate from adapting to changes in environmental factors such as temperature and atmospheric CO2 concentration. Meissner et al. (2012) replaced the standard parameterization of weathering in the UVic ESCM with a number of adaptations from previous carbon-cycle box-models (see “Methods” section) to introduce and investigate the weathering negative feedback mechanism in the context of future climate change scenarios. They found that the long-term climate response to various emission scenarios depends almost exclusively on the total amount of CO2 released, regardless of the rate at which it is being emitted, and that carbon uptake through an increase in terrestrial weathering has a significant effect on the climate system. There were, however, some differences between the various weathering schemes concerning the rate of carbon removal.
Using a similar approach as Meissner et al. (2012), we introduced a set of box-model parameterizations of terrestrial weathering to examine potential impacts on the carbon cycle as weathering rates adjust to the increase in temperature and atmospheric CO2 levels during the latest deglacial period. These weathering schemes were adapted from Berner (1994), Lenton and Britton (2006), and Uchikawa and Zeebe (2008), and a full description of their implementation into the UVic ESCM is given by Meissner et al. (2012).

Methods

In this study, we investigated the variation in rock weathering rate during the last deglacial period (16 000–4000 BCE) using a box-model approach whereby we modulated the initial global weathering following changes to certain parameters: globally averaged surface air temperature (SAT), globally averaged atmospheric carbon dioxide (CO2) concentration, and globally summed vegetation NPP. Our objective was to assess the potential impacts of deglacial climate change on the long-term carbon cycle, notably through the changes in global chemical erosion rates and their effects on atmospheric carbon dioxide concentrations. To this end, various parameterizations of carbonate and silicate weathering were adapted to the UVic ESCM to examine the scope of possible climate and carbon cycle responses. One model version called GEOCARB followed the parameterization introduced in GEOCARB II (Berner 1994) and subsequently used in GEOCARB III (Berner and Kothavala 2001), which expresses the flux of weathering as a function of changes in temperature and atmospheric CO2:
FAlk,w=FAlk,w,0gCO2(CO2)[fSigSi(SAT)+fCagCa(SAT)]
(4)
FDIC,w=FDIC,w,0[fSi+fCagCO2(CO2)gCa(SAT)]
(5)
where
gCO2(CO2)=(2pCO2pCO2,01+pCO2pCO2,0)0.4
(6)
gSi(SAT)=(1+0.038(SATSAT0))0.65e0.09(SATSAT0)
(7)
gCa(SAT)=1+0.087(SATSAT0)
(8)
and F Alk,w,0 and FDIC,w,0 are the LGM riverine flux of alkalinity and dissolved inorganic carbon (DIC), pCO2 is the atmospheric CO2 concentration, SAT is the global mean SAT, and the index 0 denotes the initial state (i.e., LGM) values. The factors f Si and f Ca stand for fraction of silicate (0.25) and carbonate (0.75) weathering, respectively (Lenton and Britton 2006). An adaptation of the GEOCARB models proposed by Lenton and Britton (2006), in which atmospheric CO2 is replaced with the more variable vegetation NPP rather than atmospheric CO2, served as a second model version that we will refer to as LB:
FAlk,w=FAlk,w,0(NPPNPP0)[fSigSi(SAT)+fCagCa(SAT)]
(9)
FDIC,w=FDIC,w,0[fSi+fCa(NPPNPP0)gCa(SAT)]
(10)
where NPP is the global mean net primary production. Our third version was based on an alternative formulation by Uchikawa and Zeebe (2008), henceforth UZ, which loosely follows Walker and Kasting (1992) in calculating variations in global weathering intensity as a sole factor of atmospheric CO2 content:
FAlk,w=FAlk,w,0[fSi(pCO2pCO2,0)0.6+fCapCO2pCO2,0]
(11)
FDIC,w=FDIC,w,0[fSi+fCapCO2pCO2,0]
(12)
Finally, our fourth parameterization, called LGM, used fluxes of DIC and alkalinity which remained constant at their LGM value (F Alk,w = F Alk,w,0; F DIC,w = F DIC,w,0).
It is important to emphasize that these box-model parameterizations were taken out of their original, pre-industrial contextual frame, and applied to LGM and deglacial conditions. Initial temperature and NPP were calculated from a 10 000+ year equilibrium run with LGM (19 000 BCE) boundary conditions. LGM values for globally averaged temperature (9.15 °C), globally summed NPP (39.3 Pg/year), as well as weathering fluxes of DIC (0.12 Pg C/year) and alkalinity (0.24 Pg C/year) were in reasonable agreement with previous estimates of glacial conditions (Bluth and Kump 1994; Brovkin et al. 2012). The simulated glacial weathering DIC and alkalinity fluxes were somewhat lower than in other models; this discrepancy is mainly caused by the absence of LGM continental shelves in this version of the model, which causes it to underestimate the global rate of carbonate weathering. Variations in atmospheric CO2 levels were prescribed based on ice core data from the Taylor Dome in Antarctica (Indermühle et al. 1999), and acted as the main driver of deglacial climate change alongside prescribed continental ice sheet retreat (Peltier 2004) and astronomical changes in solar insolation (Berger 1978). Starting from LGM equilibrium values, the UVic ESCM was integrated to year 4000 BC (totaling 15 000 years) for each of the four weathering parameterizations described above. Results are presented in the “Ocean biogeochemistry” subsection.
The reasoning behind our prescribing of atmospheric CO2 content lies in the inability of the UVic ESCM to reproduce the observed trend of CO2 during the deglacial period and early Holocene (Simmons et al. 2016). One of the major restrictions of this approach, however, is that it prevents assessing the direct response of atmospheric CO2 content to changes in global weathering intensity, effectively limiting the investigation to changes in ocean biogeochemistry, notably the DIC and alkalinity content of the ocean. Hence, we devised a second set of experiments whereby fixed DIC and alkalinity weathering fluxes would be used to estimate potential changes in atmospheric CO2 within long-term equilibrium run under appropriate boundary conditions (ice sheet distribution and orbital parameters). The model was first spun up with 10 000 BCE and 15 000 BCE conditions and LGM (aka. 19 000 BCE) weathering fluxes. Then, for each respective time period, the values of those fluxes were increased by predetermined amounts (see Table 1), and the model was integrated for several thousand years for each set of DIC flux and alkalinity flux values. A total of 12 simulations were integrated and compared (see Table 1). This set of experiments, described in greater detail in the “Changes in atmospheric CO2” subsection of the Results, allowed us to explore the sensitivity of the atmospheric CO2 response to the respective changes in weathering DIC and alkalinity fluxes as well as the changes in this sensitivity through different stages of the deglacial period.
Table 1.
Table 1. Increase in weathering DIC and alkalinity compared with LGM (19 000 BCE) values for each sensitivity test.
Experiment nameAlkalinity differencea , bDIC differencea , cΔCO2 d
10KY0.0950.035−16.5
10KY_ALK0.095−33.9
10KY_ALK+0.142−50.2
10KY_ALK−0.035−10.9
10KY_DIC0.035+22.9
10KY_DIC+0.050+32.8
10KY_DIC−0.013+9.5
15KY0.0350.013−6.9
15KY_ALK0.035−12.8
15KY_ALK+0.095−29.0
15KY_DIC0.013+4.3
15KY_DIC+0.035+13.8

Note: Paleo year is indicated in the name of each experiment: 10 000 BCE if starting with 10KY and 15 000 BCE if starting with 15KY. Paleo year determines the ice sheet configuration and orbital parameters used for each experiment. See “Methods” section for further explanation of the notation. DIC, dissolved inorganic carbon; LGM, last glacial maximum. On the nomenclature: 10KY and 15KY indicate the year relevant to DIC and ALK fluxes and other boundary conditions used to drive the models 10 000 BCE and 15 000 BCE, respectively; “ALK” and “DIC” indicate that only that specific weathering flux has been altered; and “+” and “−” indicate that the weathering flux altered in this experiment corresponds to a different year than the other boundary conditions: ±5000 years depending on the sign.

a
All fluxes are given in units of Pg C/year and represent an increase from LGM values.
b
LGM value for weathering alkalinity flux is 0.24 Pg C/year.
c
LGM value for weathering DIC flux is 0.12 Pg C/year.
d
Change in atmospheric CO2 concentration (ppm) after 8000 years of model integration.

Results

Ocean biogeochemistry (transient runs)

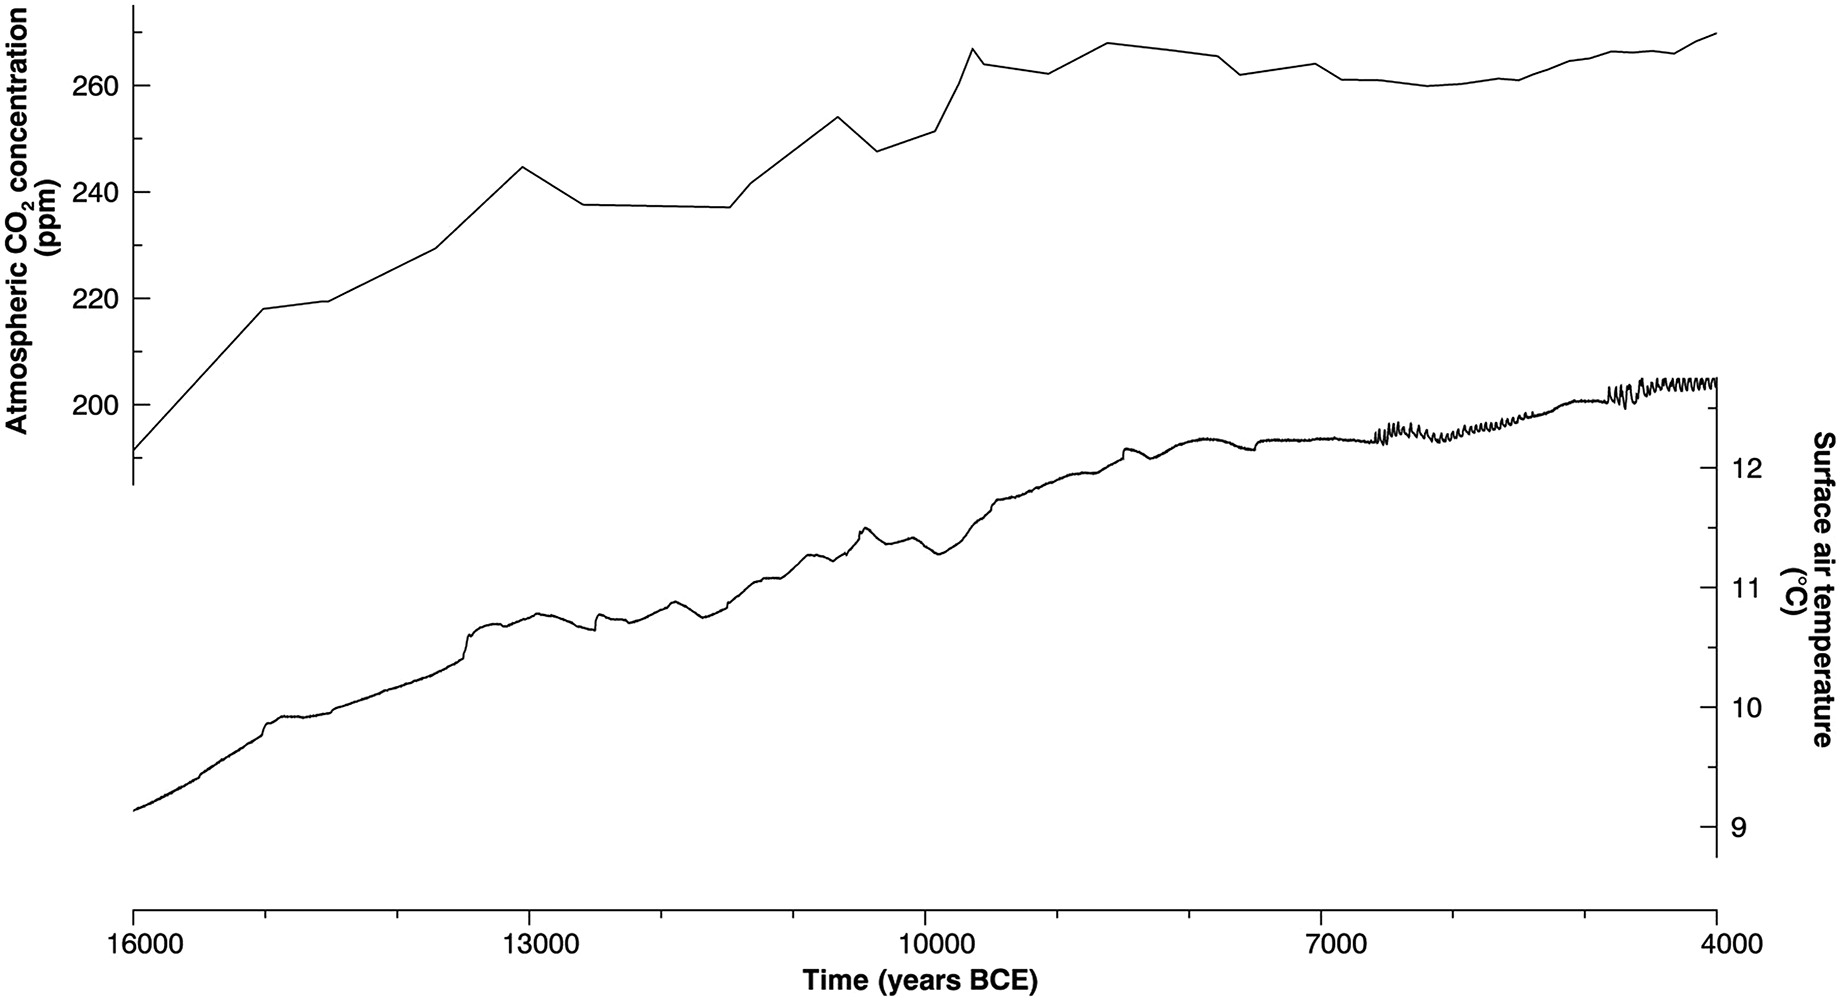
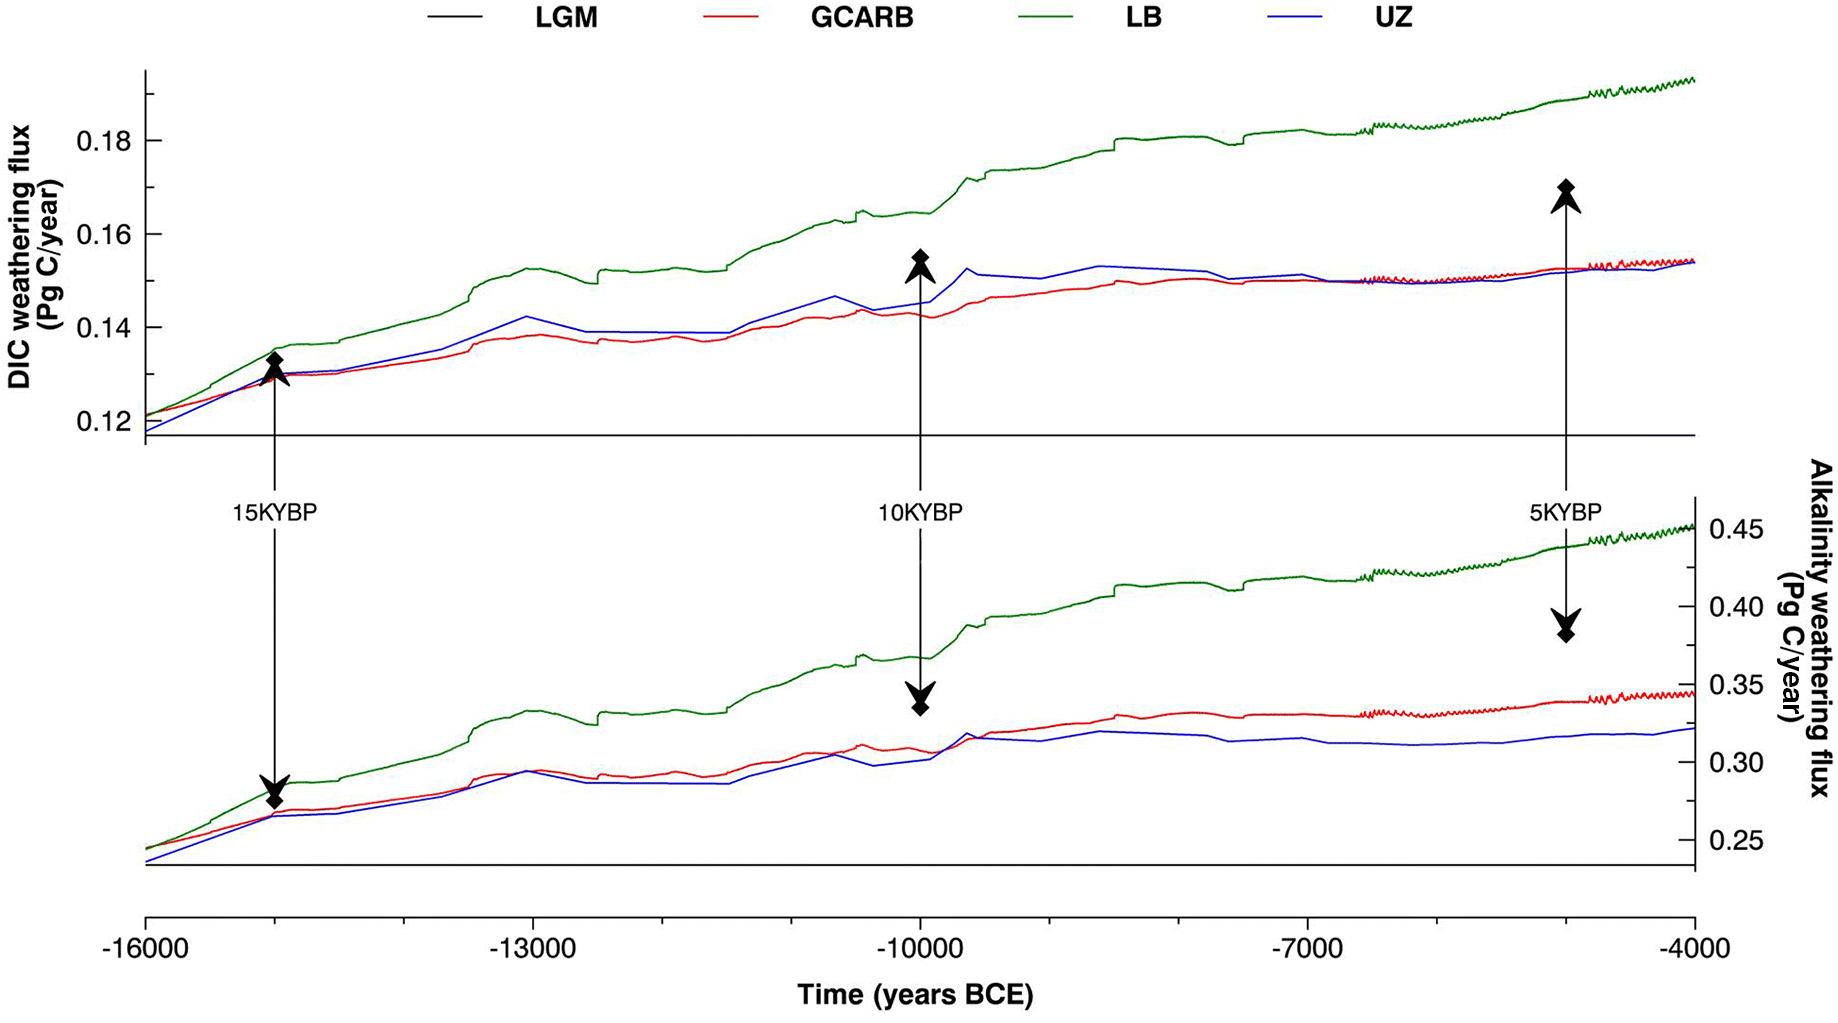
The time series of atmospheric CO2 concentration and simulated SAT are shown in Fig. 1, and their impact on global riverine DIC and alkalinity fluxes as calculated using the various weathering schemes are presented in Fig. 2. Close similarities between the CO2 curve in Fig. 1 and the time series for the GEOCARB (red) and UZ (blue) parameterizations in Fig. 2 support the idea that atmospheric CO2 concentration is the primary driver of changes in global weathering intensity. Temperature was also factored into the GEOCARB parameterization, but it makes little difference here as globally averaged SAT change in the UVic ESCM is mostly driven by changes in the CO2 content of the atmosphere. It is noteworthy that the GEOCARB and UZ parameterizations produce similar results despite being derived from entirely independent empirical methods, both yielding a 15 000 year increase in DIC flux of about 0.03–0.04 Pg C/year compared with the LGM control run (black).
Fig. 1.
Fig. 1. Time series of observed atmospheric carbon dioxide concentration (top) and simulated surface air temperature (bottom). The data shown here are taken from the LGM model run, but it should be noted that the numbers are the same for each of the weathering schemes. More specifically, atmospheric CO2 in this experiment is prescribed based on ice core data (Indermühle et al. 1999) and is therefore not a model variable.
Fig. 2.
Fig. 2. Time series of the global riverine flux of dissolved inorganic carbon (top) and alkalinity (bottom) into the ocean for the weathering parameterizations GEOCARB (red), LB (green), UZ (blue), and LGM (black). The initial weathering fluxes of carbon and alkalinity is approximately 0.12 Pg C/year and 0.24 Pg C/year, respectively. The DIC and alkalinity values for 15KYBP, 10KYBP, and 5KYBP used in the equilibrium runs are also indicated. The values from “5KYBP” are used only in the 10KYBP_DIC+ and 10KYBP_ALK+ simulations.
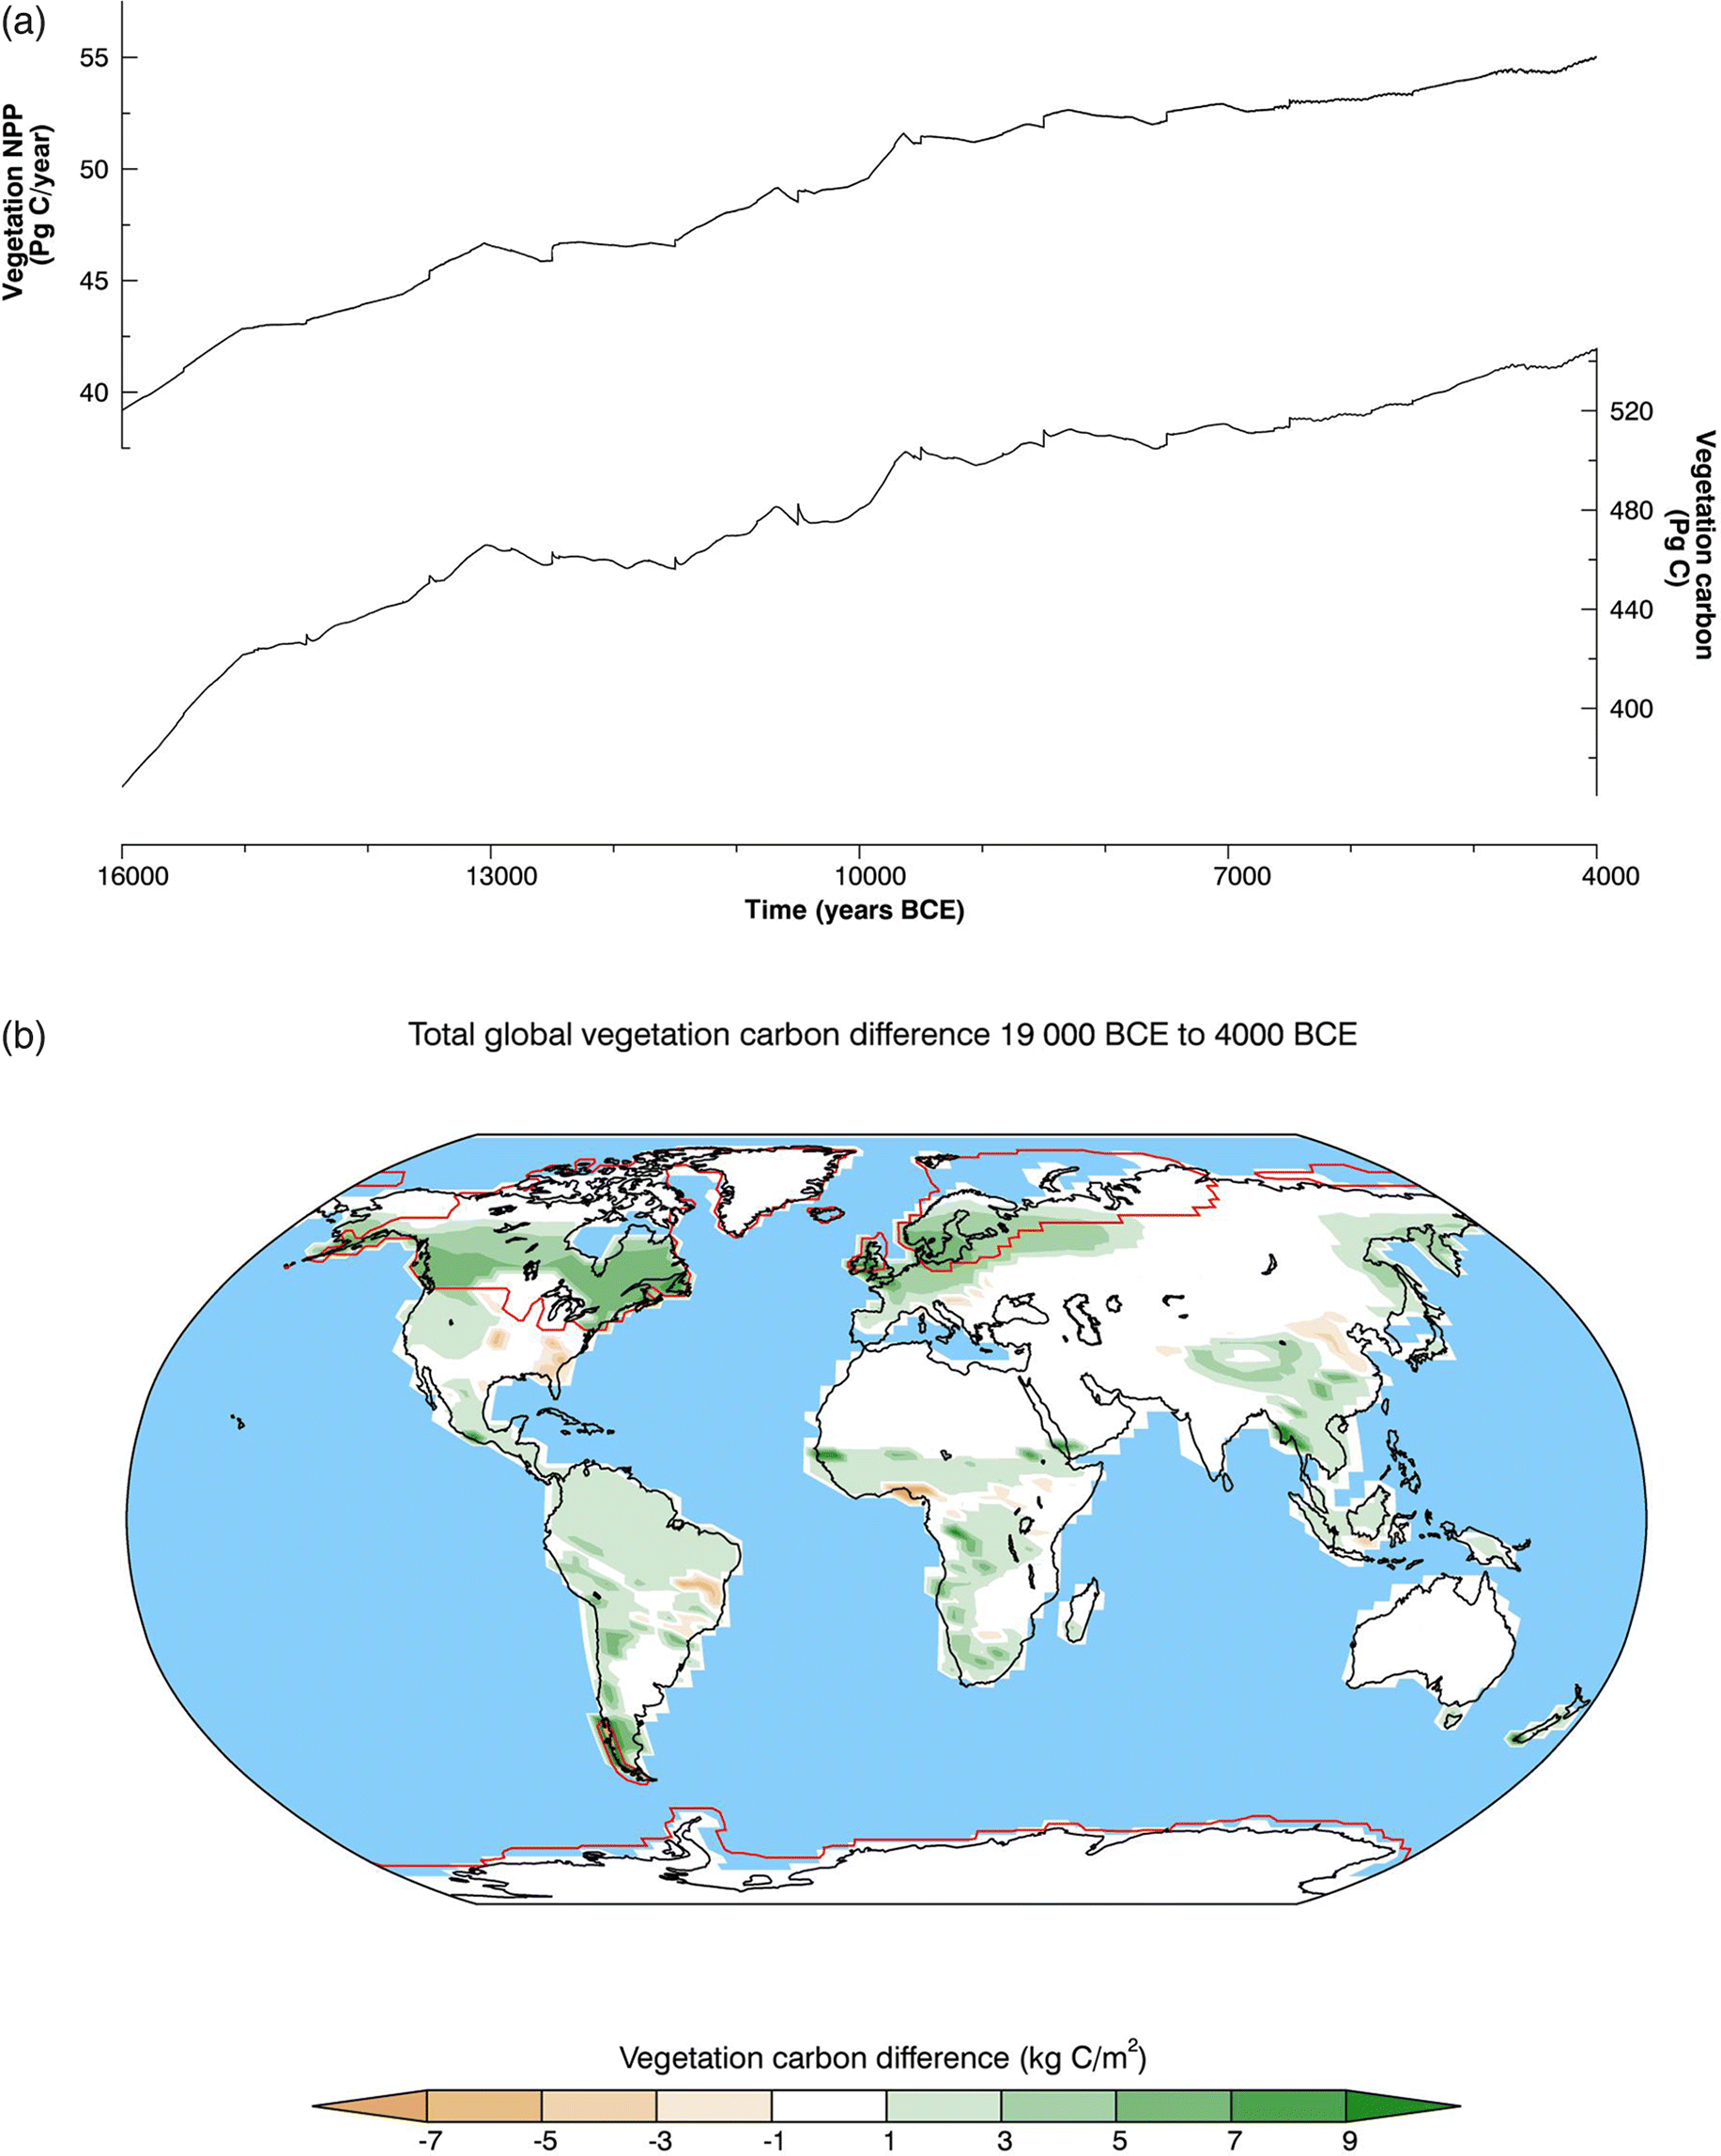
Figure 2 also shows a considerable deviation of the LB (green) parameterization from GEOCARB and UZ. The almost twofold increase in DIC and alkalinity weathering fluxes by year 4000 BCE compared with the other model simulations is likely a consequence of LB accounting for changes in vegetation production (see Fig. 3a), which increases drastically as northern vegetation expands into the previously ice-covered areas (see Fig. 3b). It is interesting that no such deviation appeared in present-day simulations despite a much greater carbon cycle disruption (see UVic_LB curves in Meissner et al. 2012). Although this can be partially explained by more significant variations in vegetation cover through the deglacial period, this outcome is suggestive of the role of vegetation dynamics as a major driver of the weathering negative feedback mechanism during the period.
Fig. 3.
Fig. 3. Output of the vegetation model, shown here as (a) a time series of vegetation net primary production (top) and total carbon (bottom), and (b) a spatial distribution of vegetation carbon changes between years 16 000 BCE and 4000 BCE. This plot represents the vegetation change as calculated from the LGM parameterization, but the output is similar for each of the weathering schemes. In panel (b), the extent of continental ice during the LGM is outlined in red.
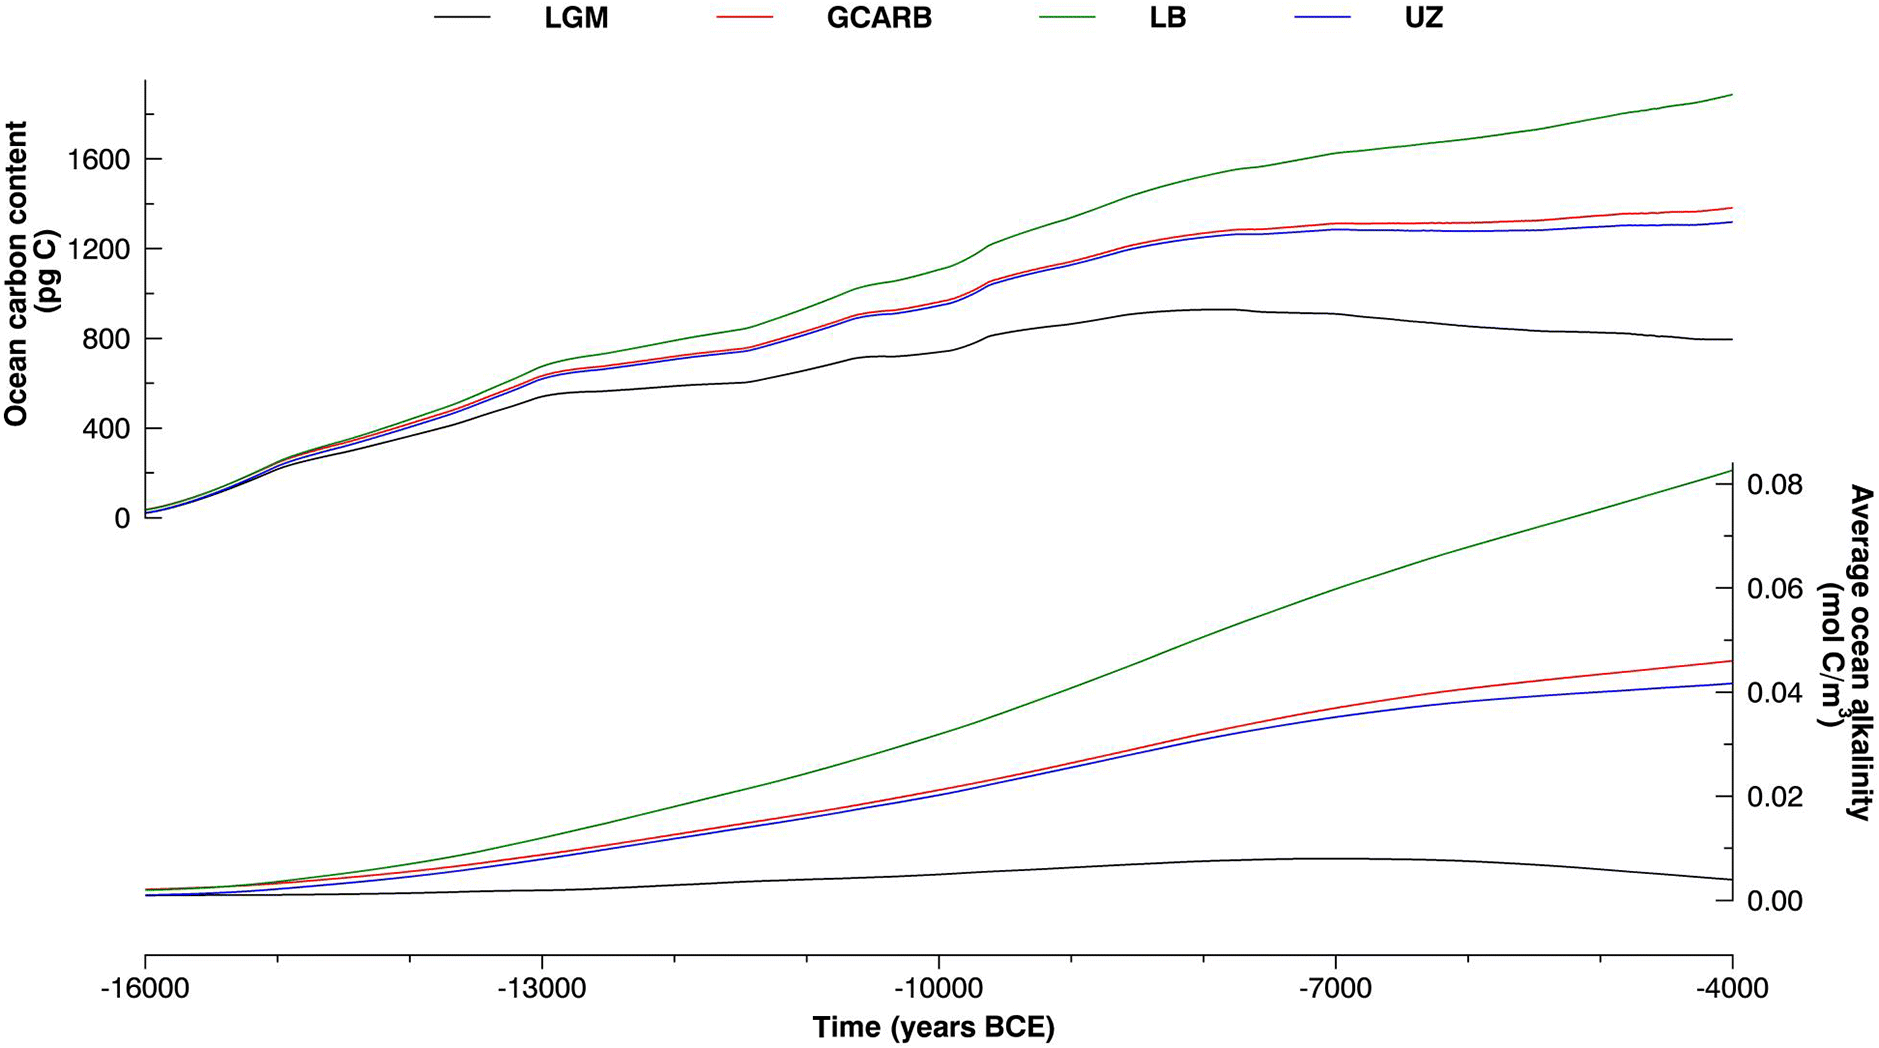
These differences notwithstanding, all (non-control) model versions used in the present study yield an observable increase in rock weathering rates, as evidenced by the rising fluxes of riverine DIC and alkalinity, along with the associated increases in ocean carbon content and alkalinity (Fig. 4). The additional ocean DIC (∼500 Pg C for GEOCARB and UZ, ∼1000 Pg C for LB) represents only a small fraction of the total ocean carbon content of 37 500 Pg C, but it is nonetheless not negligible (especially when compared with the total change in atmospheric carbon content of 80 ppm or 170 Pg C). Not surprisingly, the LB parameterization produces the highest amount of increase in ocean carbon content. More interestingly, Fig. 2 shows that UZ produces slightly more DIC than GEOCARB, but less alkalinity. Despite this difference, the change in ocean carbon shown in Fig. 4 suggests that GEOCARB weathering outputs slightly more DIC in the ocean, underlining the crucial role of alkalinity within the oceanic carbon cycle. The LGM parameterization, which represents the amount added to the ocean by the model without dynamic weathering changes, adds the least amount of carbon out of the four weathering schemes. For the latter case, the added carbon to the ocean results almost entirely from the prescribed increase in atmospheric CO2, although all our simulations show an increase in ocean carbon in response to the increase in atmospheric CO2 concentrations.
Fig. 4.
Fig. 4. Difference time series of the global oceanic carbon (top) and alkalinity (bottom) content, compared with the LGM (19 000 BCE) values; results are compared for each of the weathering parameterizations GEOCARB (red), LB (green), UZ (blue), and LGM (black). The initial ocean carbon content and alkalinity are approximately 37 500 Pg C and 2.424 mol C/m3, respectively.
The time series of ocean alkalinity shown in Fig. 4 reflects a similar narrative, but with somewhat different metrics. Whereas LB weathering supplies more or less twice as much DIC to the ocean as the LGM parameterization, it increases ocean alkalinity by as much as eight times over that seen in the control run. Compared with the GEOCARB and UZ parameterizations, LB weathering sends approximately 1.5 times more DIC to the ocean, as opposed to an almost twofold increase in ocean alkalinity. This prominent increment in ocean alkalinity is indicative of an increase in global silicate weathering, which suggests at least some removal of CO2 from the atmosphere.
The numbers obtained within the context of this study are subject to some important caveats, as the box-model approach is missing some key elements of the deglacial period (notably, sea level changes, differences in the spatial configuration of rock types, and weathering under ice sheets), which can only be represented with a spatially explicit scheme. Our results are nonetheless consistent with the general box-model narrative that global weathering intensity should increase with global temperature and expanded vegetation cover, and can therefore be interpreted as a quantitative assessment of the strength of the weathering negative feedback mechanism during the deglacial period.
Of all the factors examined in this study, the parameterization of biological activity as either a function of CO2 or NPP appears to be the most significant source of uncertainty among the model versions. This is characterized by the large difference between the output of LB and that of GEOCARB and UZ, which points to a much more significant impact of vegetation on weathering intensity when it is represented through changes in global production. Based on these results alone, it is difficult to assess whether the LB parameterization is an accurate representation of the biological enhancement of weathering or an overestimation. It could be argued that TRIFFID’s consideration of climate and biochemical factors in its calculation of plant photosynthesis and respiration (which is reflected in NPP) is more sophisticated than the Michaelis–Menten function in GEOCARB (see eq. 6). The latter is a fairly crude attempt to capture the CO2 fertilization of weathering rate, which neglects the direct impacts of other important drivers and controls on plant productivity such as temperature and hydrology. The difference between the results of the simplistic GEOCARB function and the perhaps superior representation in LB suggests that vegetation dynamics is a very important control on global weathering rates and on the strength of the negative feedback mechanism; it is therefore important to further assess the effect of biogeophysical changes on weathering rates in future work, so as to reduce the key uncertainty in contributions to weathering changes during the last deglacial period.

Changes in atmospheric CO2 (equilibrium runs)

The experiments described in the previous section demonstrate the potential for deglacial weathering changes to affect the ocean carbon pool in a significant manner. From these prescribed CO2 experiments, however, we are not able to show the effect this may have had on atmospheric CO2 concentrations over this period. In this section, we therefore show a series of sensitivity simulations in which we allowed atmospheric CO2 to freely evolve in response to different weathering rates at two different time periods during the deglacial period. Table 1 lists the combination of weathering DIC/alkalinity flux increases and paleo year (from which the external forcings are determined—see “Methods” section) for each of the sensitivity tests. For the base experiments 10KY and 15KY, the increases in both DIC and alkalinity fluxes are approximately equal to the average increases produced by GEOCARB, UZ, and LB (see previous section) at 10 000 BCE and 15 000 BCE, respectively. The notation “ALK” is appended to indicate that only the alkalinity flux has been increased for this experiment, likewise for “DIC” and the DIC flux. Finally, the “+” and “−” symbols denote cases where the increases in alkalinity and/or DIC fluxes do not correspond with the experiment’s paleo year: a “+” (“−”) sign indicates that weathering fluxes correspond to the averaged output of GEOCARB, UZ, and LB for a point in time 5000 years later (earlier) than the paleo year. Note that we did not carry out a 15KY_DIC− or 15KY_ALK− simulation, as in these cases there would not be any increase in weathering fluxes to drive changes in atmospheric CO2 concentrations.
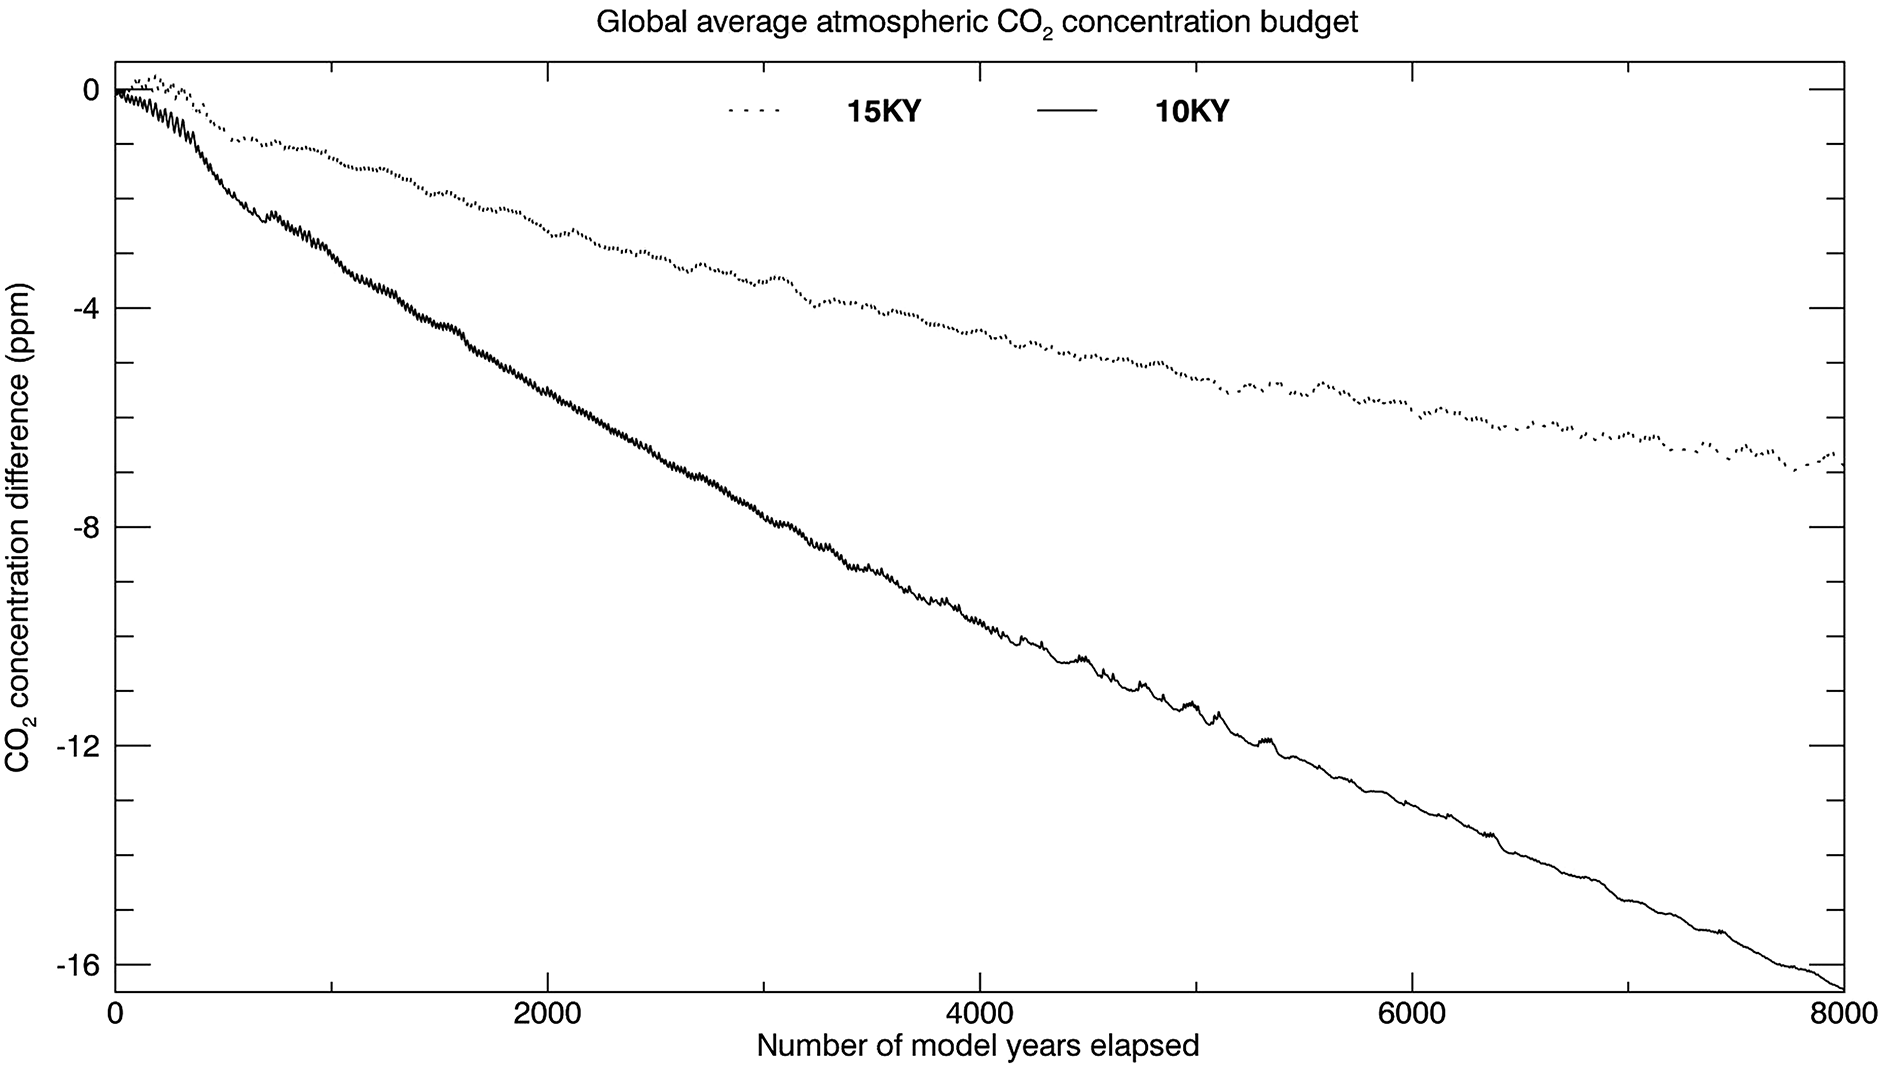
The time series of atmospheric CO2 for the base experiments 10KY and 15KY, shown in Fig. 5, suggests that the weathering negative feedback mechanism would have operated against the increasing CO2 trend during the deglacial period and early Holocene. We obtained a reduction in atmospheric CO2 concentration on the order of 16.5 ppm over 8000 years as a result of increasing weathering alkalinity and DIC fluxes from LGM to 10 000 BCE values, with everything else remaining equal. Integrating the model using 15 000 BCE weathering yields an atmospheric CO2 decrease of 6.9 ppm, less than half as much as from 10KY. This difference can be mostly attributed to the lower alkalinity and DIC fluxes rather than from the time period (see below).
Fig. 5.
Fig. 5. Difference time series of atmospheric CO2 for experiments 10KY (solid) and 15KY (dotted), relative to the initial atmospheric concentrations of 251 and 210 ppm, respectively.
The slow response time of atmospheric CO2 arises from the long response timescale of ocean biogeochemistry to weathering inputs. It should be noted that ocean alkalinity and DIC are not in a quasi-equilibrium state after 8000 years, which implies that longer integration times would produce larger values of atmospheric CO2 reduction. It can be argued, however, that any such values would have limited meaning, given the timing of other perturbations to the carbon cycle from human activities associated with the beginning of the Anthropocene. We can therefore conclude from our 10 000 BCE equilibrium run that increases in alkalinity and DIC fluxes of 0.095 Pg C/year and 0.035 Pg C/year, respectively, would have by themselves produced a decrease in atmospheric CO2 concentration of approximately 16.5 ppm over 8000 years, in opposition to the observed trend of increasing CO2 concentrations.
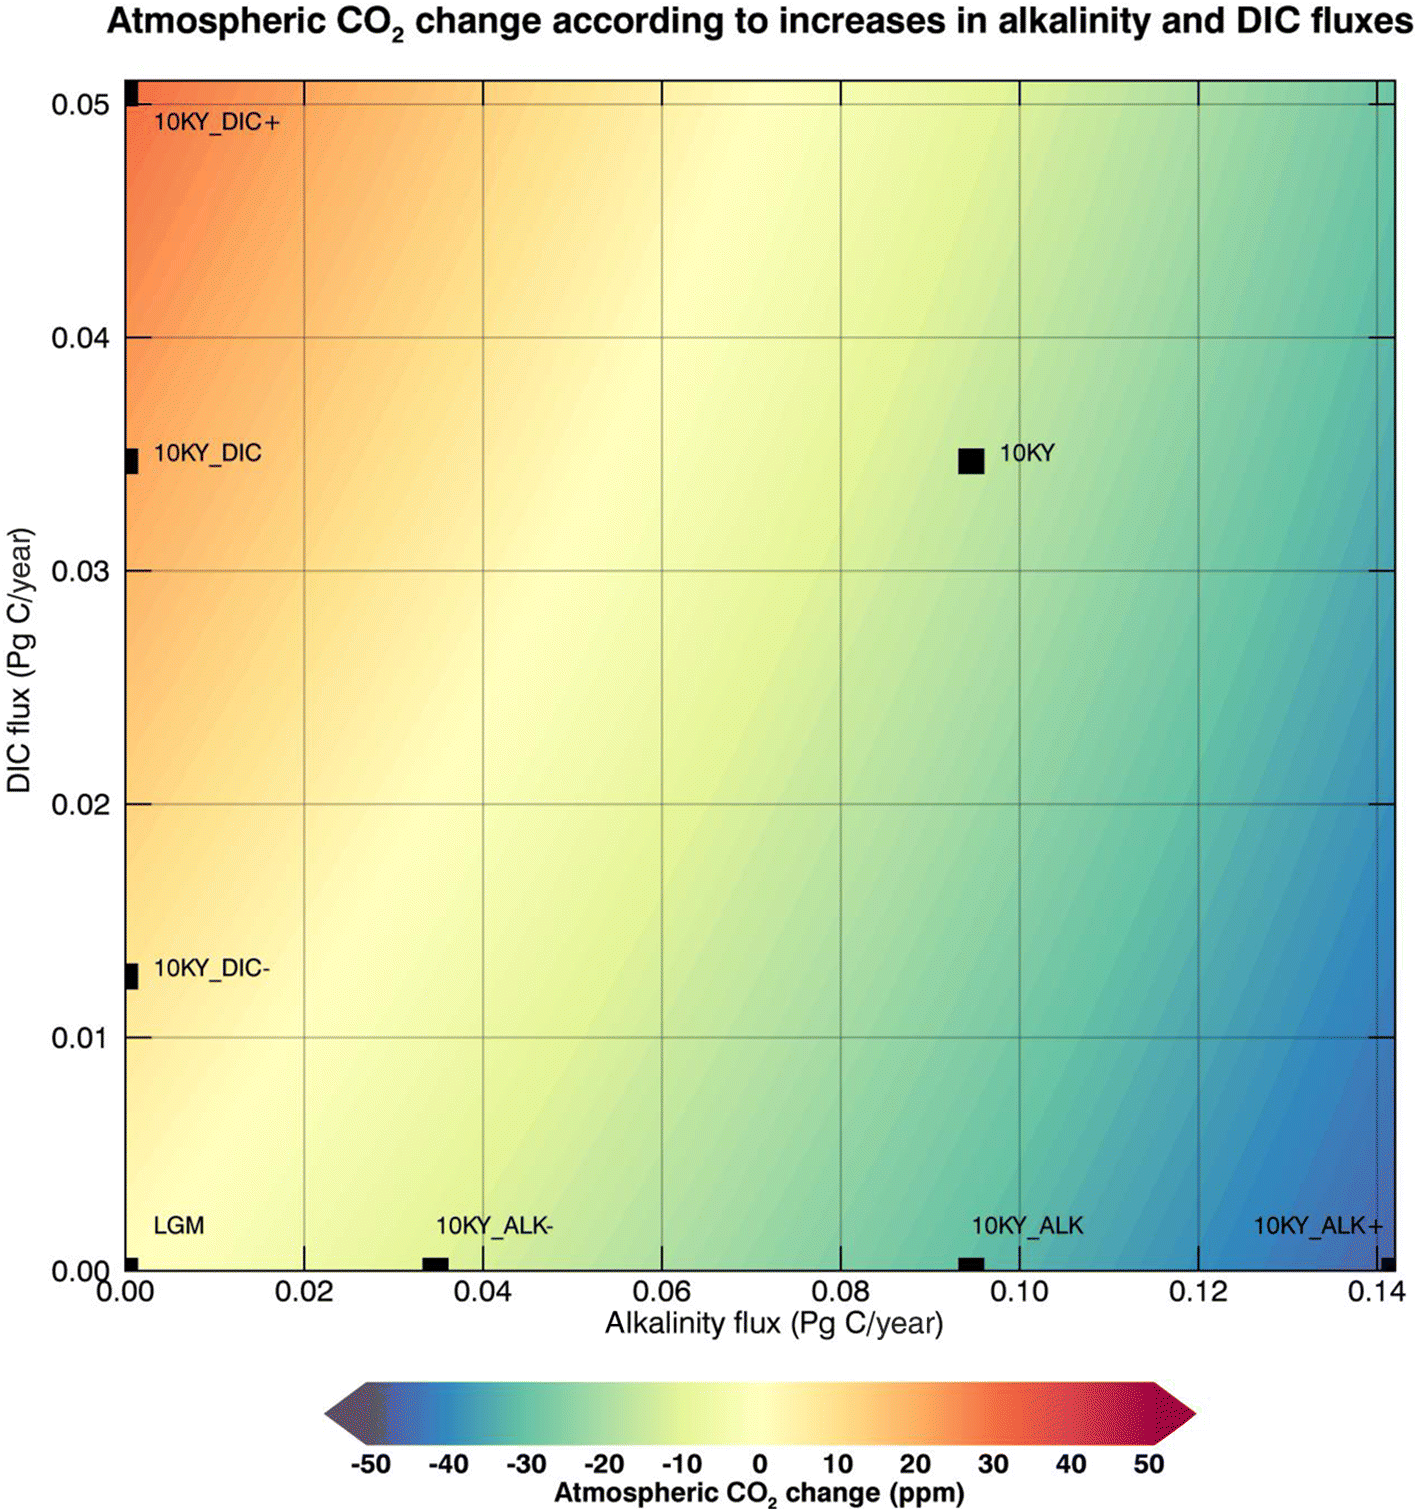
The sensitivity tests presented here also outline the fundamental difference between alkalinity and DIC fluxes regarding their impact on the oceanic buffer factor (aka. [HCO3 ]), which regulates air–sea exchanges of CO2. To quantify this effect, we carried out a multivariate linear regression analysis based on the 8000 year difference in atmospheric CO2 concentration for each of the alkalinity flux and DIC flux combinations examined in this study; the resulting contour plot (Fig. 6) illustrates the individual contributions of alkalinity and DIC fluxes to changes in atmospheric CO2 content. The shape of Fig. 6 suggests a relative independence of the two factors regarding their combined impact on atmospheric CO2. Using a simplified factor separation analysis (Yin and Berger 2012) with 10KY as f 11, 10KY_ALK as f 10, 10KY_DIC as f 01, and the initial condition as f 00, we find that the synergy between the two factors (aka. f11^ ) produces an additional decrease in atmospheric CO2 of 5.5 ppm, which is much lower than the individual contributions of alkalinity (−33.9 ppm) and DIC (+22.9 ppm). To assess the importance of the paleo year (i.e., the external forcings), we can also compare 10KY_ALK (−33.9 ppm) with 15KY_ALK+ (−29.0 ppm) and 10KY_DIC (+22.9 ppm) with 15KYB_DIC+ (+13.8 ppm). There appears to be a greater impact on DIC flux than on alkalinity flux, perhaps due to differing ocean biogeochemistry between 10 000 BCE and 15 000 BCE initial conditions, but overall, the effect of external forcings is considerably smaller than the change in weathering intensity. A similar outcome can be obtained by comparing the pairs of 15KY_ALK (−12.8 ppm) with 10KY_ALK− (−10.9 ppm) and 15KY_DIC (+4.3 ppm) with 10KY_DIC− (+9.5 ppm).
Fig. 6.
Fig. 6. Contour plot of the 8000 year atmospheric CO2 difference produced by any given combination of alkalinity flux difference (x axis) and DIC flux difference (y axis), regressed from the results of several equilibrium runs. The experiments used to calculate the best fit are identified by black squares on the plot, and the adjacent label refers to the experiment’s name in Table 1.
The main distinction between carbonate weathering and silicate weathering in the parameterizations used here lies in the fact that DIC fluxes to the ocean are only affected by carbonate weathering, whereas alkalinity increases as a result of both silicate and carbonate weathering. Based on our results (see Fig. 6), it would then follow that the ratio of carbonate weathering to silicate weathering is a key determinant of the strength of the weathering feedback mechanism. In this study, we used a global ratio of 25% silicate weathering to 75% carbonate weathering, as did Meissner et al. (2012). Two-dimensional reconstructions of rock lithology in the literature suggest that the percentage of carbonate weathering could have ranged between 62% and 67% (Meybeck 1987; Amiotte Suchet and Probst 1995; Gaillardet et al. 1999) during modern times and may have been as low as 57% during the LGM (Ludwig et al. 1999; Munhoven 2002). The slightly higher fraction of carbonate weathering used here may have resulted in a small underestimation of the impact of weathering changes. Furthermore, as rock lithology (which determines the Ca/Si weathering ratio) is not uniformly distributed across the earth surface, it is possible that changes in the latitudinal distribution of weathering intensity—such as occurred during the latest deglacial period—would have had a profound impact on global weathering intensity.

Conclusions

In this paper, we examined the effect of deglacial weathering changes on ocean biogeochemistry and atmospheric CO2 using a set of box-model parameterizations of weathering fluxes within the UVic ESCM. We used weathering parameterizations based on temperature (Berner 1994), atmospheric CO2 concentrations (Walker and Kasting 1992; Uchikawa and Zeebe 2008), and vegetation production (Lenton and Britton 2006), first adapted to the model by Meissner et al. (2012), to diagnose the change in riverine alkalinity and DIC fluxes during the latest deglacial period. The model was run from the end of the LGM (16 000 BCE) to the mid-Holocene (4000 BCE) using prescribed changes in atmospheric CO2, ice sheet configuration, and orbital parameters to drive climate change. Our results suggest that alkalinity and DIC fluxes may have increased by as little as 0.063 Pg C/year and 0.024 Pg C/year, respectively, or as much as 0.126 Pg C/year and 0.044 Pg C/year, respectively, between the LGM and the mid-Holocene. The expansion of vegetation following the retreat of continental ice and the resulting rapid increase in vegetation production are the main reasons for the differences in the results among the weathering parameterizations and result from a very different treatment of biological enhancement of weathering by the various model versions. This indicates the importance of obtaining a better understanding of the effect of deglacial vegetation dynamic on the rock cycle.
We then prescribed the increases in alkalinity and DIC fluxes obtained from the transient model simulations into the model at specified time points (10 000 BCE and 15 000 BCE) to estimate the effect of these weathering changes on atmospheric CO2 levels, and to separate the individual contributions of alkalinity and DIC as well as the other external forcings (ice sheet distribution and orbital parameters). We found the impact on atmospheric CO2 of changes in global weathering fluxes after 8000 model years to be on the order of a 16.5 ppm decrease for 10 000 BCE weathering levels, and about half as much for 15 000 BCE. The individual contributions of alkalinity and DIC were substantial and of opposite direction; where DIC inputs alone led to a net loss of carbon from the ocean to the atmosphere, alkalinity inputs by themselves stimulated a significant CO2 uptake into the ocean. These two effects combined relatively linearly, resulting in a net increase in ocean carbon (and associated drawdown of atmospheric CO2) from increased weathering. Based on the different effects of carbonate and silicate weathering on alkalinity and DIC fluxes, these results suggest that the spatial distribution of rock lithology influences the strength of the weathering negative feedback mechanism. This becomes especially important when investigating the effects of land configuration changes, such as would have happened during the deglacial period. Although there are some examples in the literature of rock-type-driven, spatially explicit weathering schemes (Goddéris et al. 2006; Taylor et al. 2016), none of these models are incorporated within intermediate-complexity models and thus would be ill-suited to examine changes in weathering on glacial timescales. A two-dimensional weathering model taking into account the worldwide distribution of rock lithology, such as can be found in a recent version of the intermediate-complexity Grid Enabled Integrated Earth System (GENIE) model (Colbourn et al. 2013), would be better suited for further research in this direction.
This work has demonstrated that global rock weathering rates can be altered in a meaningful way during a period of large climate change such as the latest deglacial period and can result in a nontrivial impact on the global carbon cycle. This box-model study does not take into account the subtleties of two-dimensional rock lithology distribution nor the important geographical changes in weathering distributions inherent to the deglacial period, as would have been induced from ice sheet retreat and sea level change. These are, therefore, important processes to include in further analyses of the effect of deglacial weathering changes on ocean biogeochemistry and climate change.
Acknowledgements

We thank KJ Meissner for providing the code for the weathering parameterizations in the model and for her feedback on an earlier draft of this paper. We are very grateful to two anonymous reviewers for their helpful comments and to A Mucci for revising the section on carbonate chemistry. Finally, the support of NSERC Discovery Grants awarded to LAM and HDM is much appreciated.

References

Amiotte Suchet P, and Probst JL. 1995. A global model for present day atmospheric/soil CO2 consumption by chemical erosion of continental rocks (GEM-CO2). Tellus B, 47: 273–280.
Archer D. 1996. A data-driven model of the global calcite lysocline. Global Biogeochemical Cycles, 10: 511–526.
Berger AL. 1978. Long-term variations of daily insolation and Quaternary climatic changes. Journal of the Atmospheric Sciences, 35: 2362–2367.
Berner RA. 1991. A model for atmospheric CO2 over Phanerozoic time. American Journal of Science, 291: 339–376.
Berner RA. 1994. GEOCARB II: a revised model of atmospheric CO2 over Phanerozoic time. American Journal of Science, 294: 56–91.
Berner RA, and Kothavala Z. 2001. GEOCARB III: a revised model of atmospheric CO2 over Phanerozoic time. American Journal of Science, 301: 182–204.
Berner RA, Lasaga AC, and Garrels RM. 1983. The carbonate-silicate geochemical cycle and its effect on atmospheric carbon dioxide over the past 100 million years. American Journal of Science, 283: 641–683.
Bitz CM, Holland MM, Weaver AJ, and Eby M. 2001. Simulation the ice-thickness distribution in a coupled climate model. American Journal of Science, 106: 2441–2463.
Bluth GJS, and Kump LR. 1994. Lithologic and climatologic controls of river chemistry. Geochimica et Cosmochimica Acta, 58: 2341–2359.
Brovkin V, Ganopolski A, Archer D, and Munhoven G. 2012. Glacial CO2 cycle as a succession of key physical and biogeochemical processes. Climate of the Past, 8: 251–264.
Colbourn G, Ridgwell A, and Burton TM. 2013. The rock geochemical model (RokGeM) v0.9. Geoscientific Model Development, 6: 1543–1573.
Cox P. 2001. Description of the “TRIFFID” dynamic global vegetation model. Met Office: Hadley Centre technical note 24.
Cox P, Betts M, Bunton RA, Essery CB, Rowntree RL, and Smith J. 1999. The impact of new land surface physics on the GCM simulation of climate and climate sensitivity. Climate Dynamics, 15: 183–203.
Ebelmen JJ. 1845. Sur les produits de la décomposition des espèces minérales de la famille des silicates. Annales des Mines, 7: 3–66.
Ewen TL, Weaver AJ, and Eby M. 2004. Sensitivity of the inorganic ocean carbon cycle to future climate warming in the UVic coupled model. Atmosphere-Ocean, 42: 23–42.
Fanning AF, and Weaver AJ. 1996. An atmospheric energy-moisture balance model: climatology, interpentadal climate change and coupling to an ocean general circulation model. Journal of Geophysical Research, 101: 15111–15128.
Foster GL, and Vance D. 2006. Negligible glacial–interglacial variation in continental chemical weathering rates. Nature, 444: 918–921.
Gaillardet J, Dupré B, Louvat P, and Allègre CJ. 1999. Global silicate weathering and CO2 consumption rates deduced from the chemistry of large rivers. Chemical Geology, 159: 3–30.
Gibbs MT, and Kump LR. 1994. Global chemical erosion during the Last Glacial Maximum and the present: sensitivity to changes in lithology and hydrology. Paleoceanography, 9: 529–543.
Goddéris Y, François LM, Probst A, Schotta J, Moncoulona D, Labata D, et al. 2006. Modelling weathering processes at the catchment scale: the WITCH numerical model. Geochimica et Cosmochimica Acta, 70: 1128–1147.
Indermühle A, Stocket TF, Joos F, Fischer H, Smith H, Wahlen M, et al. 1999. Holocene carbon-cycle dynamics based on CO2 trapped in ice at Taylor Dome, Antarctica. Nature, 398: 121–126.
Kalnay E, Kanamitsu M, Kistler R, Collins W, Deaven D, Gandin L, et al. 1996. The NCEP/NCAR 40-year reanalysis project. Bulletin of the American Meteorological Society, 77: 437–471.
Kump LR, and Alley RB. 1994. Global chemical weathering on glacial time scales. In Material fluxes on the surface of the earth. National Research Council. National Academy Press, Washington, D.C., pp. 46–60.
Lenton TM, and Britton C. 2006. Enhanced carbonate and silicate weathering accelerates recovery from fossil fuel CO2 perturbations. Global Biogeochemical Cycles, 20: GB3009.
Ludwig W, Amiotte-Suchet P, and Probst J-L. 1999. Enhanced chemical weathering of rocks during the last glacial maximum: a sink for atmospheric CO2? Chemical Geology, 159: 147–161.
Matthews HD, Weaver AJ, and Meissner KJ. 2005. Terrestrial carbon cycle dynamics under recent and future climate change. Journal of Climate, 18: 1609–1628.
Meissner KJ, Weaver AJ, Matthews HD, and Cox P. 2003. The role of land surface dynamics in glacial inception: a study with the UVic Earth System Climate Model. Climate Dynamics, 21: 515–537.
Meissner KJ, McNeil BI, Eby M, and Wiebe EC. 2012. The importance of the terrestrial weathering feedback for multimillennial coral reef habitat recovery. Global Biogeochemical Cycles, 26: GB3017.
Meybeck M. 1987. Global chemical weathering of surficial rocks estimated from river dissolved loads. American Journal of Science, 287: 401–428.
Munhoven G. 2002. Glacial–interglacial changes of continental weathering: estimates of the related CO2 and HCO3 flux variations and their uncertainties. Global and Planetary Change, 33: 155–176.
Pacanowski RC. 1995. MOM 2 documentation, user’s guide and reference manual. GFDL Ocean Group Technical Report, NOAA, GFDL. 232 pp.
Peltier WR. 2004. Global glacial isostasy and the surface of the ice-age Earth: the ICE-5 G (VM2) model and GRACE. Annual Review of Earth and Planetary Sciences, 32: 111–149.
Ridgwell A, and Zeebe R. 2005. The role of the global carbonate cycle in the regulation and evolution of the Earth system. Earth and Planetary Science Letters, 234: 299–315.
Sarmiento J, and Gruber N. 2006. Ocean biogeochemical dynamics. Princeton University Press, Princeton, New Jersey, USA.
Schartau M, and Oschlies A. 2003. Simultaneous data-based optimization of a 1 D-ecosystem model at three locations in the North Atlantic: part I—method and parameter estimates. Journal of Marine Research, 61: 765–793.
Schmittner A, Oschlies A, Matthews HD, and Galbraith ED. 2008. Future changes in climate, ocean circulation, ecosystems, and biogeochemical cycling simulated for a business-as-usual CO2 emission scenario until year 4000 AD. Global Biogeochemical Cycles, 22: GB1013.
Simmons CT, Matthews HD, and Mysak LA. 2016. Deglacial climate, carbon cycle and ocean chemistry changes in response to a terrestrial carbon release. Climate Dynamics, 46: 1287–1299.
Taylor LL, Quirk J, Thorley RM, Kharecha PA, Hansen J, Ridgwell A, et al. 2016. Enhanced weathering strategies for stabilizing climate and averting ocean acidification. Nature Climate Change, 6: 402–406.
Uchikawa J, and Zeebe RE. 2008. Influence of terrestrial weathering on ocean acidification and the next glacial inception. Geophysical Research Letters, 35: L23608.
Urey HC. 1952. The planets: their origin and development. Yale University Press, New Haven, Connecticut.
Walker JC, and Kasting JF. 1992. Effects of fuel and forest conservation on future levels of atmospheric carbon dioxide. Palaeogeography, Palaeoclimatology, Palaeoecology, 97: 151–189.
Walker JC, Hays PB, and Kasting JF. 1981. A negative feedback mechanism for the long-term stabilization of Earth’s surface temperature. American Journal of Science, 86, 9776–9782.
Weaver AJ, Eby M, Wiebe EC, Bitz CM, Duffy PB, Ewen TL, et al. 2001. The UVic Earth System Climate Model: model description, climatology, and applications to past, present and future climates. Atmosphere-Ocean, 39: 361–428.
Yin QZ, and Berger A. 2012. Individual contribution of insolation and CO2 to the interglacial climates of the past 800,000 years. Climate Dynamics, 38: 709–724.

Information & Authors

Information

Published In

cover image FACETS
FACETS
Volume 2Number 1January 2017
Pages: 267 - 285
Editor: Tom A. Al

History

Received: 29 July 2016
Accepted: 13 December 2016
Version of record online: 14 March 2017

Data Availability Statement

All relevant data are within the paper.

Key Words

  1. deglacial climate change
  2. paleoclimatology
  3. climate modeling
  4. biogeochemistry
  5. weathering

Sections

Subjects

Authors

Affiliations

M.-O. Brault [email protected]
Department of Geography, McGill University, Montreal, QC H3A 0B9, Canada
L.A. Mysak
Department of Atmospheric and Oceanic Sciences, McGill University, Montreal, QC H3A 0B9, Canada
H.D. Matthews
Department of Geography, Planning and Environment, Concordia University, Montreal, QC H4B 1R6, Canada

Author Contributions

All conceived and designed the study.
M-OB performed the experiments/collected the data.
M-OB and HDM analyzed and interpreted the data.
LAM and HDM contributed resources.
All drafted or revised the manuscript.

Competing Interests

LAM is currently serving as a Subject Editor for FACETS, but was not involved in review or editorial decisions regarding this manuscript.

Metrics & Citations

Metrics

Other Metrics

Citations

Cite As

Export Citations

If you have the appropriate software installed, you can download article citation data to the citation manager of your choice. Simply select your manager software from the list below and click Download.

There are no citations for this item

View Options

View options

PDF

View PDF

Get Access

Media

Media

Other

Tables

Share Options

Share

Share the article link

Share on social media