Nickel geochemistry of oil sands fluid petroleum coke deposits, Alberta, Canada
Abstract
Nickel (Ni) leaching from oil sands petroleum coke can have toxicological effects on aquatic organisms. However, geochemical controls on Ni release, transport, and attenuation within coke deposits remains limited. We examined the geochemistry of fluid coke and associated pore waters from two deposits at an oil sands mine near Fort McMurray, Alberta, Canada. Synchrotron-based micro-X-ray fluorescence (μXRF) and micro-X-ray absorption near edge structure (μXANES) spectroscopy show that Ni(II)-porphyrin complexes dominate, but inorganic phases including Ni(II)-sulfide and Ni(II)-oxide comprise a minor component of fluid coke. Sequential chemical extractions suggested that sorption–desorption reactions may influence Ni mobility within fluid coke deposits. Although only a small proportion of total Ni (<4%) is susceptible to leaching under environmentally relevant concentrations, dissolved Ni concentrations (n = 65) range from 2 to 120 μg·L−1 (median 7.8 μg·L−1) within the two deposits and generally decrease with depth below the water table. Pore water Ni concentrations are negatively correlated with pH, but not with dissolved sulfate, bicarbonate, or chloride. Overall, our findings suggest that pore water pH and sorption–desorption reactions are principal controls on dissolved Ni concentrations within oil sands fluid petroleum coke deposits.
Introduction
Metal leaching from petroleum coke at oil sands mines in northern Alberta, Canada, presents a potential risk to water quality (Puttaswamy et al. 2010; Puttaswamy and Liber 2011, 2012; Zhang et al. 2016; Nesbitt and Lindsay 2017; Nesbitt et al. 2017). Approximately 8 × 10⁶ tonnes of this bitumen upgrading byproduct were produced in 2016 and, although more than 10% of this was used as fuel in on site operations, total coke inventories in the Athabasca oil sands region (AOSR) now exceed 106 × 106 tonnes (AER 2016). Approximately 54% of this regional inventory was produced using a fluid coker (i.e., fluid coke), whereas the remainder was produced using a delayed coker (AER 2016). Fluid coke is principally comprised of carbon (C) and sulfur (S) derived from the bitumen ore (Zubot et al. 2012; Nesbitt et al. 2017). However, fluid coke also contains several minor elements including silicon (Si), aluminum (Al), iron (Fe), titanium (Ti), calcium (Ca), potassium (K), and magnesium (Mg), which are associated with included mineral phases, plus potentially hazardous trace elements including nickel (Ni), vanadium (V), and molybdenum (Mo) (Zubot et al. 2012; Nesbitt and Lindsay 2017; Nesbitt et al. 2017). Mine closure landscapes within the AOSR will integrate overburden, mine wastes, and upgrading byproducts, including petroleum coke (Simhayov et al. 2017). Integrating knowledge of the geochemical controls on metal release and mobility within coke deposits and adjacent geohydrologic systems into mine closure planning could help minimize potential impacts on water quality.
Dissolved Ni concentrations exceeding 50 μg·L−1 have been reported for leachates derived from oil sands fluid petroleum coke (Puttaswamy et al. 2010). Furthermore, Ni has been linked to elevated toxicity of these leachates to aquatic organisms (Puttaswamy et al. 2010; Puttaswamy and Liber 2011, 2012). Puttaswamy et al. (2010) reported that Ni contributed to the acute toxicity of some coke leachates and Puttaswamy and Liber (2011, 2012) found that Ni toxicity becomes a concern at neutral to mildly acidic pH conditions. Such conditions have been observed in oil sands fluid coke deposits (Nesbitt and Lindsay 2017) and some oil sands mine closure landforms containing fluid or delayed coke (Appels et al. 2017; Murray et al. 2017; Simhayov et al. 2017). Microcosm studies conducted by Baker et al. (2012) found that integration of thin fluid coke layers into reclaimed wetlands increased Ni concentrations in sediment pore waters and enhanced Ni uptake by macrophytic algae. Potentially phytotoxic levels of Ni uptake have been reported for plants grown directly in fluid coke (Nakata et al. 2011). In general, these previous studies suggest that Ni release from oil sands petroleum coke presents a potential risk to water quality.
The Ni content of oil sands petroleum coke can range from approximately 100 to 700 mg·kg−1 (Jack et al. 1979; Har 1981; Chung et al. 1996; Nesbitt et al. 2017). Zubot et al. (2012) reported lower Ni concentration ranging from 35 to 68 mg·kg−1 for oil sands fluid coke; however, these results are inconsistent with other studies. Nesbitt et al. (2017) reported a median Ni concentration of 210 mg·kg−1 (range 130–460 mg·kg−1) for fluid coke. Our study found that porphyrin complexes dominate solid-phase Ni speciation, which is generally consistent with geological petroleum systems (Lewan and Maynard 1982; Lewan 1984). Although metalloporphyrins are generally regarded as stable complexes, their degradation has been reported in both field (Grosjean et al. 2004) and laboratory (Cordero et al. 2015) studies. The internal structure of fluid petroleum coke particles is characterized by a series of concentric layers formed during successive coking cycles (Furimsky 2000; Zubot 2010; Nesbitt et al. 2017). Distinct differences in V speciation between the inner and outer regions of individual layers suggest that coking may also degrade metalloporphyrins (Nesbitt and Lindsay 2017). Additionally, Ni(II)/Mo(IV)-sulfide particles (supported by γ-Al2O3) added to catalyze hydroconversion of bitumen distillates may also be incorporated in coke (Gray 2015). The catalyst may also promote conversion of porphyrinic Ni to NiS (Gray 2015), which could represent an additional inorganic Ni phase in fluid coke. Accumulation of degradation or weathering products, which may include oxides or other inorganic phases, could therefore influence Ni release within coke deposits.
This study assessed geochemical controls on dissolved Ni concentrations within oil sands fluid petroleum coke deposits. Detailed analyses of solids and associated pore water were performed to (i) examine whether spatial variations in Ni speciation occur within coke particles and (ii) investigate relationships between geochemical conditions and groundwater Ni concentrations within coke deposits. Results provide new insight into geochemical controls on Ni release and mobility within oil sands fluid coke deposits and have potential to inform decision-making on oil sands mine closure.
Study site
The Mildred Lake mine is located approximately 35 km north of Fort McMurray, Alberta, Canada (Fig. 1). Fluid coking is employed during bitumen upgrading to thermally convert non-distillable bitumen fractions into volatile compounds. This process involves cycling coke particles between a burner vessel, where coke particles are heated to between 480 and 565 °C, and a coker vessel, where heated bitumen is sprayed onto the hot coke particles. The spherical coke particles increase in size with the addition of new concentric layers during successive cycles and are excluded when they exceed approximately 0.3 mm in diameter. The excluded coke particles are combined with process water and transported via pipeline to the large nearby on-site deposits.
Fig. 1.
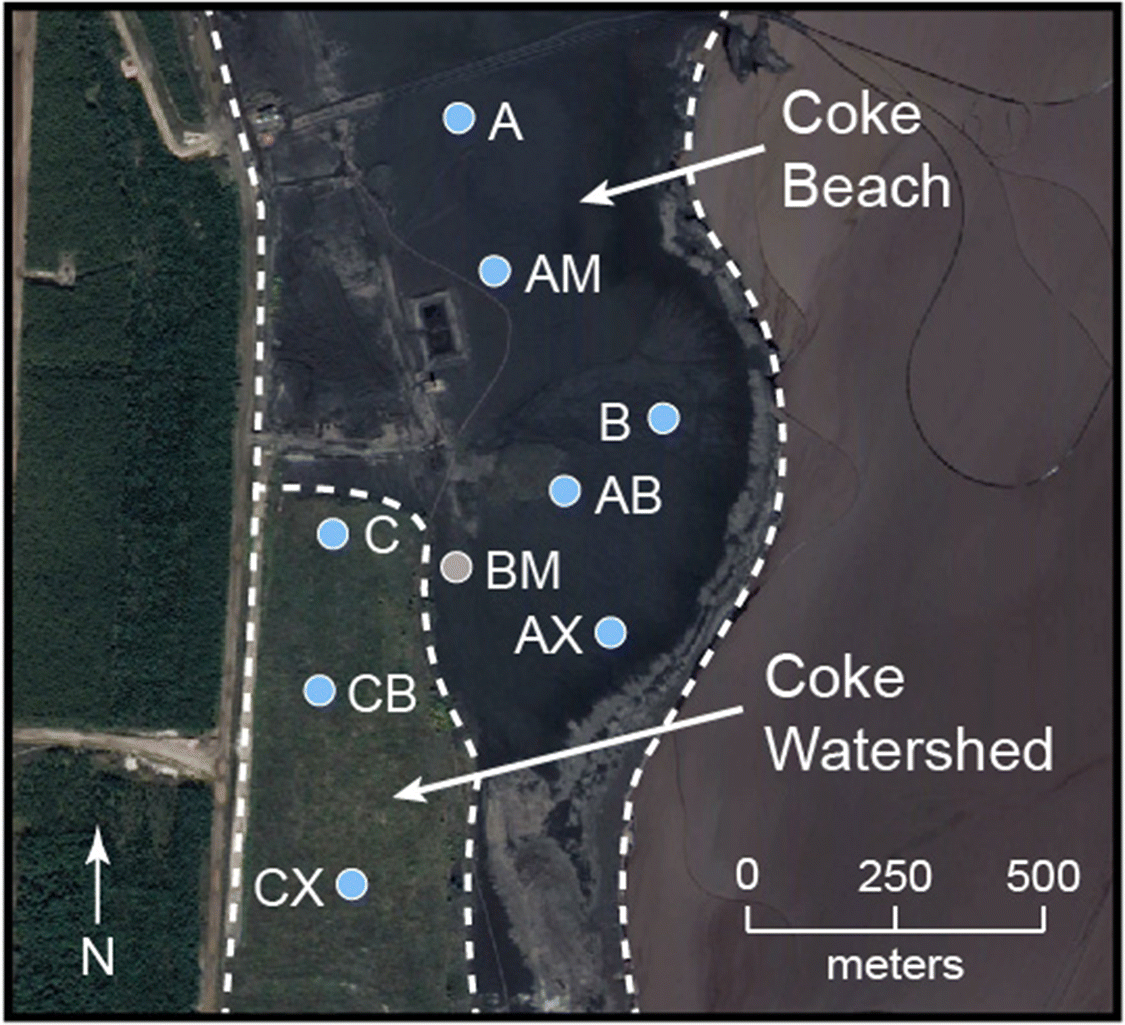
Field work was conducted from July through September 2014 at two fluid petroleum coke deposits situated within the Mildred Lake Settling Basin (MLSB), which also contains fluid fine tailings (FFT) and other bitumen extraction and upgrading byproducts. More than 3 × 10⁷ tonnes of fluid petroleum coke have been deposited since 2000 along the western margin of the MLSB. Coke Beach (CB) is an uncovered deposit that covers over 1.5 km2 and, at the time of sampling, continued to receive fresh fluid petroleum coke. Deposition at the 0.28 km2 Coke Watershed (CW) deposit concluded in 2003 when an experimental reclamation soil cover was constructed. These coke deposits are hydrologically connected to both the underlying FFT and the adjacent water cover in MLSB. Uncovered coke within the CB deposit exhibits a shallow downward slope to the east and extends below the water cap.
Materials and methods
Solid-phase samples
An amphibious track-mounted sonic drill rig was used to collect continuous core samples at six locations in CB and three locations in CW. The cores were collected by advancing casing in sequential 2.0 m intervals to either 6.0 or 8.0 m below surface. Upon retrieval of each interval, the core was extruded from the casing and, immediately, sub-samples were collected every 0.5 m and transferred into polyethylene (PE) bottles. Samples were shipped to the University of Saskatchewan on ice and stored at −20 °C until analysis.
Prior to analysis, the frozen samples were transferred to an anaerobic chamber (<5% v/v H2, balance N2) where they were thawed, vacuum-filtered to remove excess pore water, and sealed in gas-tight amber glass vials. The sealed bottles were removed from the anaerobic chamber and transferred to a −20 °C freezer. Once the samples were frozen, the bottles were removed from the freezer, uncapped, and immediately transferred to a freeze drier, which was operated at −40 °C under vacuum until the samples were completely dry (∼24 h).
Polished thin sections were prepared for a subset of dried samples. The dried coke was vacuum embedded in medical-grade epoxy and mounted to 27 mm × 47 mm quartz glass slides using cyanoacrylate adhesive (Nesbitt et al. 2017). The mounted sections were ground to a thickness of 30 μm and polished with 0.5 μm diamond paste prepared with synthetic kerosene to avoid dissolution of water-soluble phases.
Synchrotron analyses
Micro-X-ray fluorescence (μXRF) spectroscopy and micro-X-ray absorption near edge structure (μXANES) spectroscopy data were collected at beamline 13-ID-E at the Advanced Photon Source, Argonne National Laboratory. The beamline utilized a dual Si(111) crystal cryo-cooled monochromator to select incident beam energy. μXRF maps of several samples were collected at an incident beam energy of 15 keV with a 2 μm × 2 μm focused beam. Data were obtained in continuous scanning mode using a four-element Si-drift detector (Vortex ME4; Hitachi, Ltd., Chiyoda, Tokyo, Japan) with a 25 ms effective dwell time for each pixel. Nickel K-edge μXANES spectra were then collected at locations within coke particle cross-sections identified from the Ni K μXRF maps. The spectra were collected by scanning the incident energy from −100 to +644 eV relative to the theoretical Ni K-edge (8333 eV). Fluorescence counts for both μXRF and μXANES were dead-time corrected and I0 normalized.
Processing of the μXRF mapping data was carried out using both beamline-specific software (GSECARS X-ray Microprobe Map Viewer, version 8) and a custom matrix manipulation code was developed in MATLAB v. 2010a (MathWorks, Inc., Natick, Massachusetts, USA). Data reduction and analysis of μXANES spectra was performed using the Athena module of the Demeter software package (version 0.9.21) (Ravel and Newville 2005). Reference spectra for Ni(II) octaethyl porphyrin (NiOEP), Ni(II) tetraphenyl porphyrin (NiTPP), Ni(II) oxide [NiO], Ni(II) hydroxide [Ni(OH)2], hydrated Ni(II) sulfate [NiSO4·6H2O], and Ni(II) carbonate hydroxide [NiCO3·2Ni(OH)2] were previously collected (Nesbitt et al. 2017). A reference spectrum for Ni(II) sulfide [NiS] was also obtained. Linear combination fitting (LCF) of μXANES was performed from −30 to +95 eV relative to the theoretical Ni K-edge (8333 eV). The fit sum was unconstrained (i.e., not forced to 1) so that both the fit sum and R-factor could be used as an assessment of the quality of each fit.
Extractions
Sequential selective chemical extractions were performed to assess the potential for Ni release from coke under relevant environmental conditions. Consequently, the extraction protocol used for this study included chemical analyses of the water-soluble (F1), exchangeable (F2), reducible (F3), and acid-soluble (F4) fractions (Table 1). The water-soluble extractant solution was prepared by equilibrating ultrapure water (18.2 MΩ·cm) with ambient laboratory air for 24 h. The remaining solutions were prepared in the anaerobic chamber by dissolving high-purity reagents (i.e., ≥99.0%) in ultrapure water that was first purged with N2 gas for 24 h. The final pH of the F2 (pH = 6.7) and F3 (pH = 7.0) were adjusted using phosphoric acid (H3PO4) and sulfuric acid (H2SO4), respectively. The final pH of the F1 and F4 fractions were measured but not adjusted.
Table 1.
| Fraction | Fraction type | Extractant solution | Extractant pH | Mechanism |
|---|---|---|---|---|
| F1 | Water soluble | Ultrapure water (18.2 MΩ·cm) | ∼6.5 | Dissolution of water-soluble phases |
| F2 | Exchangeable | 0.58 mol·L−1 Na2HPO4·7H2O; 0.42 mol·L−1 NaH2PO4·H2O | 6.7 | Anion exchange with PO43− and cation exchange with Na+ at coke, clay, and (hydr)oxide surfaces |
| F3 | Reducible | 0.12 mol·L−1 Na-ascorbate; 0.17 mol·L−1 Na-citrate; 0.60 mol·L−1 Na-bicarbonate | 7.0 | Reductive dissolution of amorphous/poorly crystalline Fe(III) and Mn(IV) (hydr)oxide phases |
| F4 | Acid soluble | 0.11 mol·L−1 acetic acid | ∼2.8 | Acid dissolution of carbonates, crystalline Fe(III) and Mn(V) (hydr)oxide phases, NiS and NiO |
Freeze-dried coke samples (n = 11) obtained at different depths from locations AB, AM, CX, and DM were sieved into three particle size fractions (fi): f1 ≤ 149 μm; 149 μm < f2 ≤ 350 μm; 350 μm < f3. Extractions were conducted in triplicate for each of these size fractions. The extraction procedure was initiated by weighing 1.0 g of dried coke into acid-washed 50 mL polypropylene (PP) (SuperClear™ Ultra-High Performance; VWR International, Radnor, Pennyslvania, USA) centrifuge tubes, dispensing 40 mL of ultrapure water (F1) into each tube, and shaking at 80 rpm for 16 h. Following shaking, the tubes were centrifuged (5804R; Eppendorf, Hamburg, Germany) at 4000 rpm (2934g) for 40 min. The supernatant was then collected using a syringe (30 mL HSW NORM-JECT; Henke-Sass Wolf, Tuttlingen, Germany) and passed through a 0.45 μm polyethersulfone (PES) syringe filter (Acrodisc® 25 mm; Pall Corporation, Port Washington, New York, USA). The filtered supernatant was acidified with nitric acid (HNO3) to <pH 2 and stored at 4 °C until analysis by inductively coupled plasma—mass spectrometry (ICP-MS) (NexION 300D; PerkinElmer, Inc., Waltham, Massachusetts, USA). This process was repeated for solutions F2 through F4. Between each extraction step, the samples were washed by adding another 20 mL of ultrapure water (18.2 MΩ·cm), shaking at 80 rpm for 20 min, centrifuging at 4000 rotations per minute (rpm) for 20 min, and discarding the supernatant. Nickel release was normalized to the dry coke mass and results were recalculated in mg·kg−1.
Point of zero charge
The pH point of zero charge (pHpzc) was determined using a modified version of that described by Pourrezaei et al. (2014). Briefly, a 0.1 mol·L−1 sodium chloride (NaCl) solution was prepared with deionized water. The solution was transferred to an anoxic chamber (≤5 vol.% H2(g), balance N2(g)) and bubbled with high-purity nitrogen gas (N2(g)) to remove dissolved carbon dioxide (CO2(aq)). After approximately 12 h, 25 mL of this solution was transferred into nine 40 mL amber glass vials and the initial pH was adjusted to between 2 and 10, at 1 pH unit intervals, using 0.1 N hydrochloric acid (HCl) or sodium hydroxide (NaOH) solutions. Next, 0.5 g of homogenized and vacuum-filtered coke was added to each vial, which was sealed in the anoxic chamber using gas-impermeable rubber-lined septa. The sealed bottles were shaken at 60 rpm for 48 h, after which the final pH was measured. The difference between the initial pH and final pH was plotted against initial pH, and the intersection point of the curve with initial pH was taken as the pHpzc (Pourrezaei et al. 2014).
Water sampling and analyses
Multi-level groundwater wells were fabricated using 0.3 cm inner diameter (ID) polyethylene (PE) tubing, which was perforated and screened with 125 μm Nitex mesh over the bottom 10 cm. Eight to 10 of these wells were bundled around a 1.9 cm ID PE standpipe, which was also screened over the bottom 10 cm. The bundles were prepared such that individual well screens were spaced 0.25, 0.5, or 1.0 m apart, with closer spacing at shallower depths to be positioned near the water table. The bundles were installed within 3 m laterally of all continuous coring locations, except BM, using the same sonic drill rig. Briefly, a 7.6 cm diameter steel drill casing fitted with an aluminum knock-out tip was advanced to 6.0 or 8.0 m below ground surface. The well bundle was advanced down the casing, which was retrieved while retaining the well bundle and knock-out tip at the desired depth. Water was added to minimize buoyancy of the bundle during this process. Coke readily collapsed around the well screens as the casing was retrieved.
Water sampling was delayed for at least 30 d after installation. The static water table elevation was measured in the central standpipe at each site prior to purging three well volumes from each well using a peristaltic pump (Geopump Series II; Geotech Environmental Equipment Inc., Denver, Colorado, USA). Clean Pt-cured silicone tubing was connected to the 0.3 cm ID well tubing and fed through the pump to facilitate sampling. The other end of the silicone tubing was attached to a custom-built in-line flow-through cell. Measurements of pH, redox potential (Eh), electrical conductivity (EC), and temperature were performed as water was pumped through the cell. Calibration of the pH electrode (Orion 8156BNUWP ROSS Ultra; Thermo Fisher Scientific, Waltham, Massachusetts, USA) was checked before each measurement and recalibrated using NIST-traceable pH 7, 4, and 10 buffer solutions if the measured and theoretical pH values differed by more than 0.02 pH units. The performance of the redox electrode (Orion 9678BNWP; Thermo Fisher Scientific, Waltham, Massachusetts, USA) was checked between measurements using both ZoBell’s solution (Nordstrom 1977) and Light’s solution (Light 1972). Measured redox potentials were corrected to the standard hydrogen electrode and Eh values are reported.
The flow-through cell was then disconnected, and water was passed through inline 0.45 μm PES filters (Aquaprep; Pall Corporation, Port Washington, New York, USA). Field determinations of alkalinity, H2S, and NH3-N were performed immediately upon sample collection. Alkalinity was determined by titration with normalized H2SO4 to the bromocresol green methyl red end-point. Dissolved concentrations of hydrogen sulfide (H2S) and ammonia as nitrogen (NH3-N) were quantified on a portable spectrophotometer (DR 2800; HACH Company, Loveland, Colorado, USA) using the methylene blue (HACH Method 8131) and salicylate (HACH Method 10031) methods, respectively. Samples for inorganic anions, stable isotopes of water, and dissolved organic carbon (DOC) quantification were stored in clean PE bottles at 4 °C. Dissolved inorganic anion concentrations were quantified by ion chromatography (IC) (ICS-2100; Dionex Corporation, Sunnyvale, California, USA). Vapor equilibration and cavity ring-down spectroscopy (L2120-i Isotopic Water Analyzer; Picarro, Santa Clara, California, USA) were used to measure δ18O and δ2H values (Wassenaar et al. 2008). The DOC samples were transferred into amber glass vials and acidified with 5% (v/v) H3PO4 to remove inorganic carbon. Quantification of DOC was performed by wet ultraviolet light–persulfate oxidation of DOC and thermal conductivity detection of evolved carbon dioxide (Model 1010 TOC Analyzer; OI Analytical, College Station, Texas, USA).
Trace element and major element samples were passed through 0.1 μm PES syringe filters (Acrodisc; Pall Corporation, Port Washington, New York, USA), acidified to <pH 2 using concentrated trace metal grade nitric acid (OmniTrace; EMD Millipore, Burlington, Massachusetts, USA), and stored at 4 °C in clean PE bottles until analysis. Trace elements were quantified by ICP-MS, and major element concentrations were determined by inductively coupled plasma optical emission spectrometry (ICP-OES) (Varian Vista RL; Agilent Technologies, Santa Clara, California, USA). Thermodynamic speciation modelling of pore water chemistry was performed using PHREEQCi (version 3.1.5) with the MINTEQA2 V4 database (Parkhurst and Appelo 2013). Correlations between pore water parameters were evaluated by determining Pearson product-moment correlation coefficients for centered log-ratio transformed data.
Results and discussion
X-ray spectroscopy
μXRF maps of coke particle cross-sections at the Ni Kα emission line revealed heterogeneous Ni distribution within coke particles (Fig. 2). These cross-sectional maps revealed multiple rings characterized by elevated Ni concentrations, which is consistent with the concentric layer structure previously reported for oil sands fluid petroleum coke (Furimsky 2000; Zubot 2010; Nesbitt et al. 2017). These maps indicated that Ni concentrations were elevated near the outer margin relative to the inner region of individual layers. Vanadium exhibits a similar distribution within individual layers that comprise fluid petroleum coke particles (Nesbitt and Lindsay 2017). These findings suggest that Ni is concentrated at the outer margin of each concentric layer during the fluid coking process.
Fig. 2.
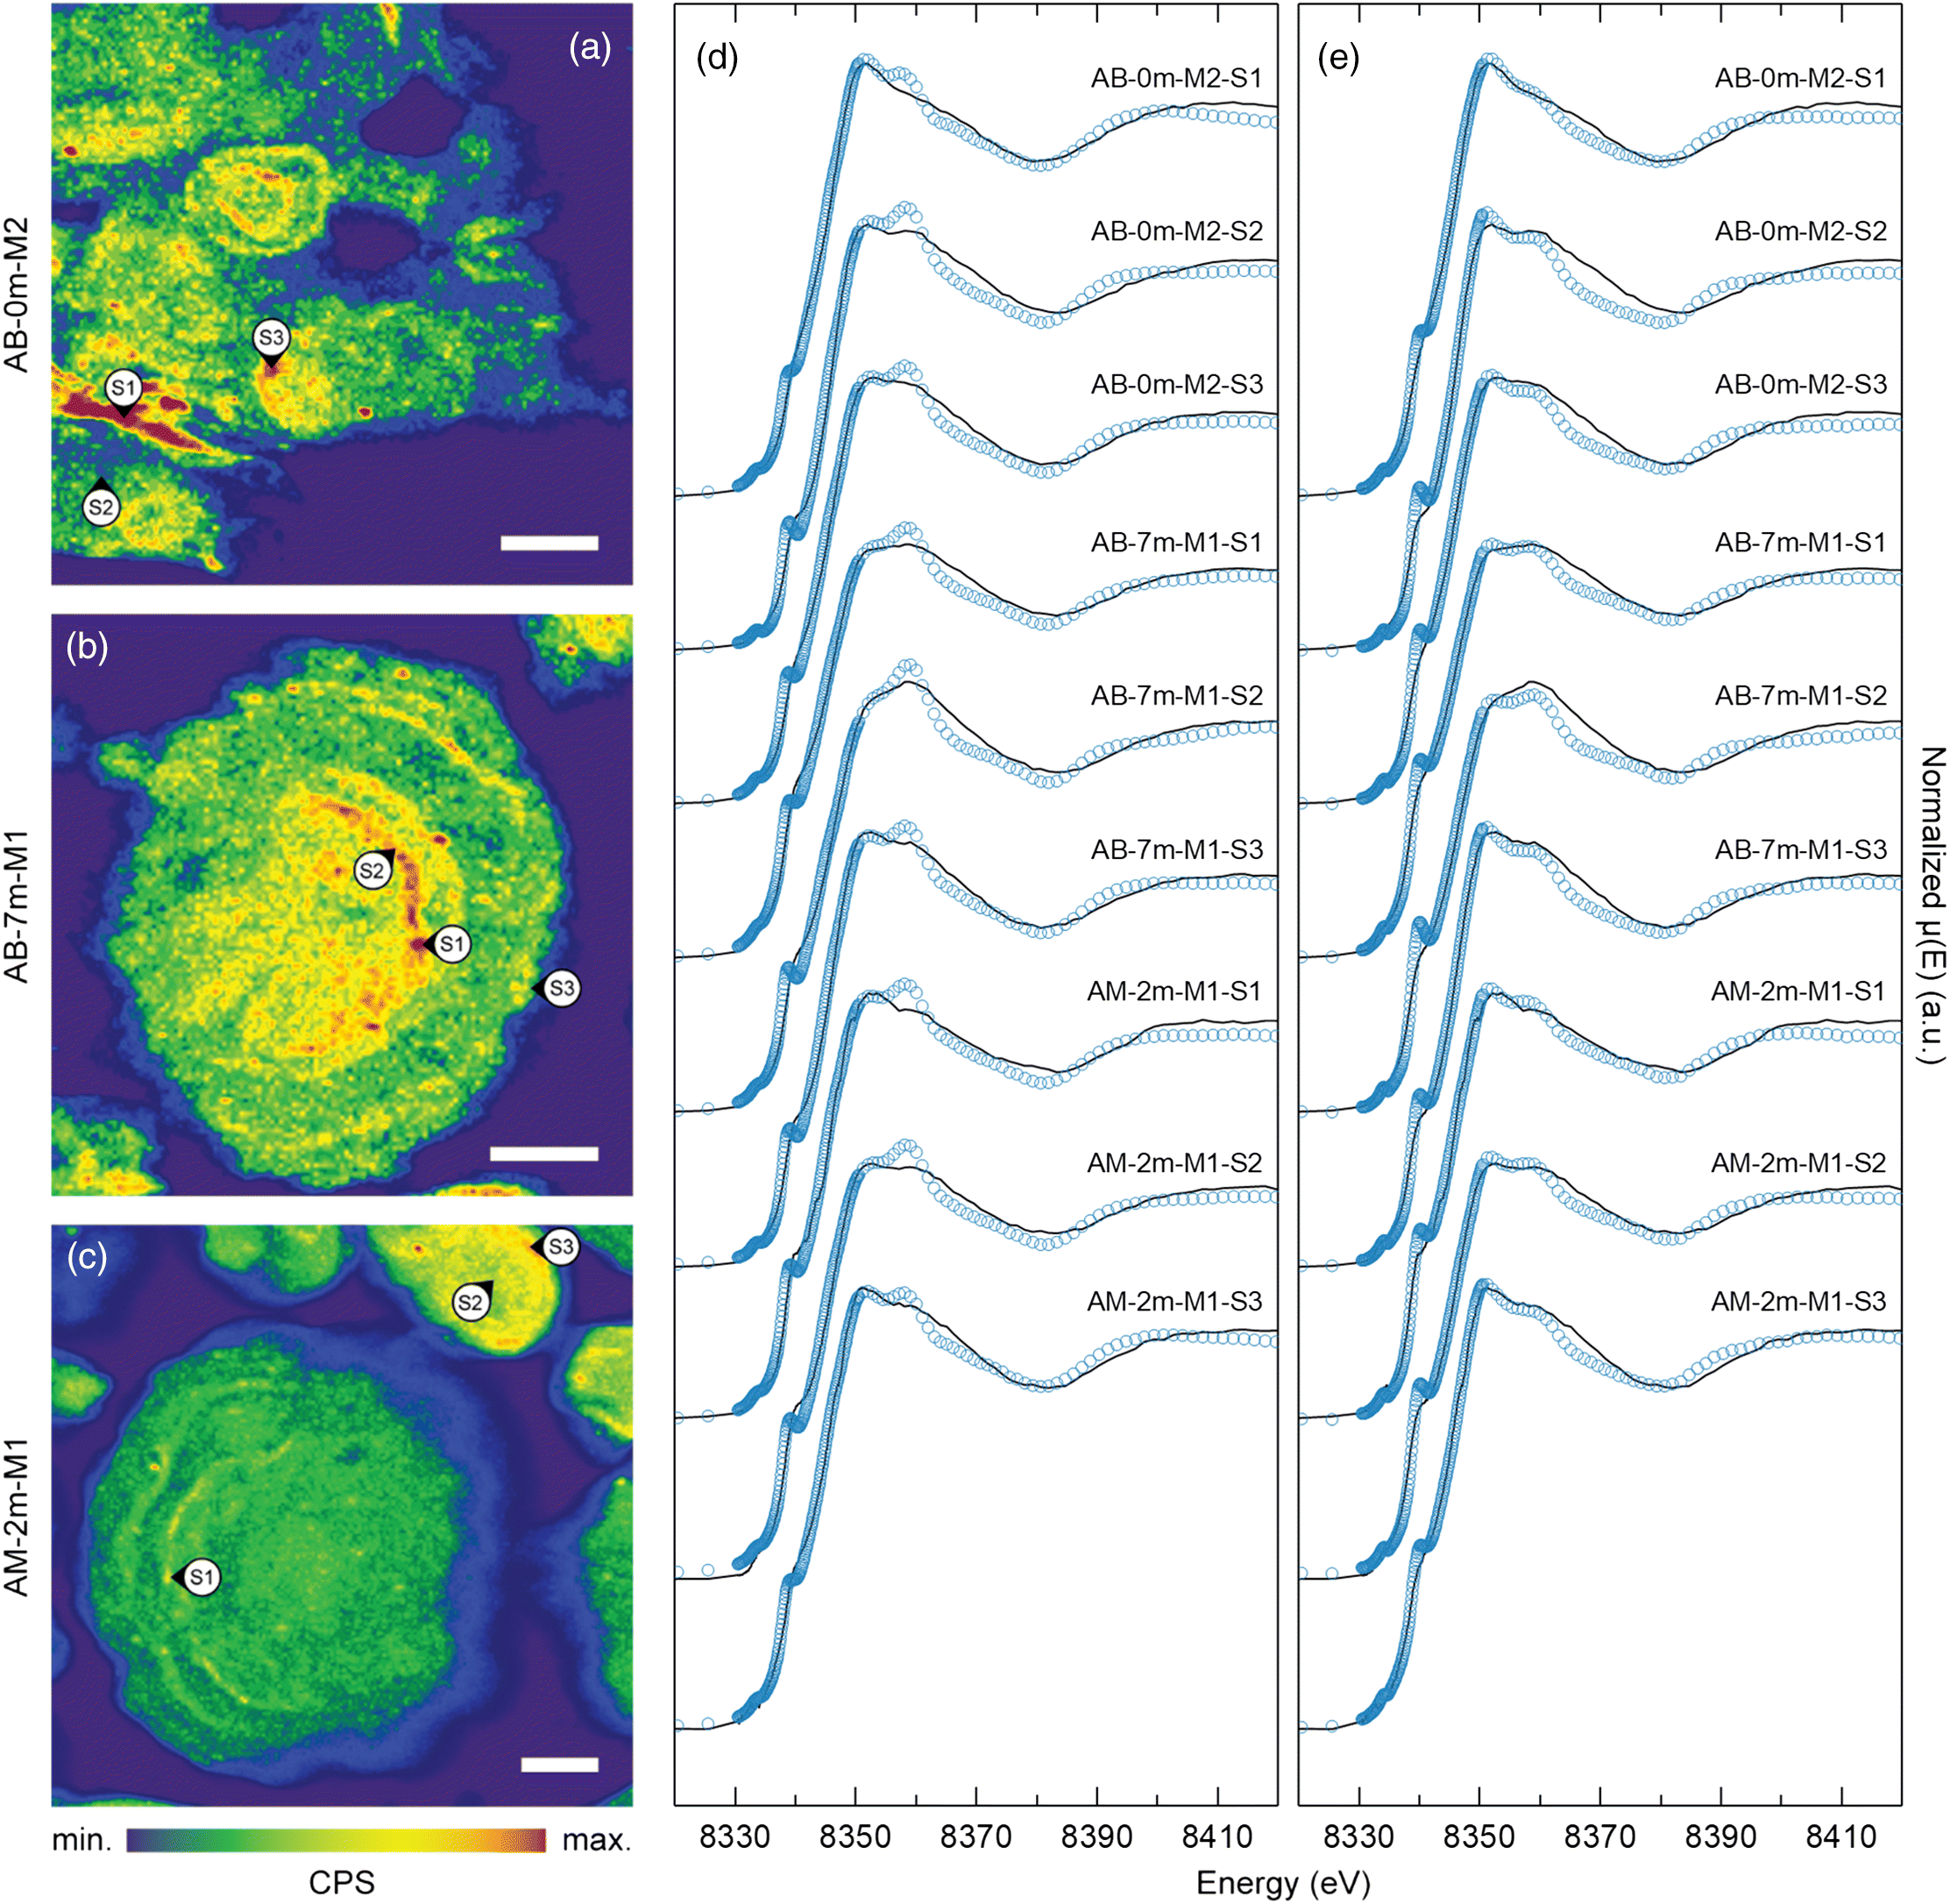
Nickel K-edge μXANES spectra exhibited a distinct doublet feature on the white line at ∼8352 and ∼8359 eV. All spectra exhibited a rounded shoulder at 8340 eV and a small pre-edge feature at 8334 eV. Spectra from the inner region of individual concentric layers exhibited a higher magnitude at 8359 eV peak. These spectra were generally consistent with previously reported Ni K-edge XANES spectra (Nesbitt et al. 2017) where Ni(II) occurred in porphyrinic square-pyramidal N coordination. Conversely, the Ni K-edge μXANES spectra obtained for the outer margins of individual concentric layers, where elevated Ni concentrations were observed, generally exhibited a higher magnitude peak at 8352 eV. The Ni μXANES line shape after ∼8370 eV was similar among all measurement spots and was generally consistent with Ni K-edge spectra previously reported for bulk fluid coke samples (Nesbitt et al. 2017). Nickel K-edge XANES spectra for asphaltene samples from Alberta oil sands (Lytle 1983) were generally consistent with spectra obtained for Ni porphyrins and the inner region of individual concentric layers (Fig. 2).
Two potential mechanisms could account for the observed differences in Ni coordination between the inner region and outer margin of each concentric layer. The first potential mechanism is distortion of the organo-metallic asphaltenic Ni site during coking. Finite difference modelling of the near-edge structure (FDMNES) (Bunău and Joly 2009) for Ni(II) porphyrins indicated that slight inflation and deflation of the overall molecular structure strongly influenced the doublet feature (Nesbitt et al. 2017). When the local porphyrin structure (i.e., Ni-N, N–C, and C–C bonds) surrounding the Ni metal centre were equally inflated by between 3% and 10%, the characteristic porphyrin doublet white line feature was replaced with a single sharp asymmetrical white line at ∼8352 eV. The second potential mechanism is distortion or degradation of metalloporphyrins and accumulation of inorganic Ni phases during fluid coking. For example, Ni(II) oxide exhibits a strong whiteline feature at ∼8350 eV but no secondary peak at ∼8359 eV (Fig. 2). This phase also exhibits a pre-edge peak at 8333 eV without a shoulder at 8340 eV. Although there may be distortions and variability in Ni coordination proximal to the organo-metallic Ni centres in asphaltenic micelles, the spectral similarity among all measurement spots at higher energy implies an underlying constant long-range Ni coordination.
Combinatorial fitting was performed for each Ni K-edge μXANES spectrum (n = 18) to assess all unique combinations of up to four of the six reference spectra (i.e., NiOEP, NiTPP, NiO, NiS, Ni(OH)2, NiSO4·6H2O, NiCO3·2Ni(OH)2). The best fits for all spectra, which exhibited the smallest R-factors and residuals, consistently included NiTPP, NiOEP, NiO, and NiS. Fitting Ni μXANES spectra with porphyrin, NiO, and NiS standards generally yielded quantitatively acceptable (R-factor <0.009), albeit occasionally qualitatively poor, fits (Table 2). Spectra obtained for Ni(OH)2, NiSO4·6H2O, and NiCO3·2Ni(OH)2 reference materials exhibited similar features to those of NiO. Therefore, including more than one of these reference spectra in the LCF produced negative component weightings and therefore did not improve overall fits. Nickel(II) sulfide can be formed during hydroconversion processes via hydrodemetallation reactions of porphyrinic Ni prior to coking (Gray 2015). Fine Ni/Mo-sulfide catalyst particles may also be transported to the coking process through attrition of larger catalyst pellets in upstream hydroconversion reactors (Gray 2015). The shoulder at ∼8340 eV in the NiS reference spectrum contributes to the shoulder observed at the same energy in the sample spectra, which improved fits for almost every sample. The LCF results indicated that the NiO and NiS reference spectra explained up to a maximum of 43% of the sample spectra, with the remaining proportion comprised of varying proportions of NiTPP and NiOEP reference spectra. Moreover, Ni μXANES spectra obtained from spots near outer margins of individual concentric layers exhibited the highest NiO and NiS weightings, which suggests elevated Ni concentrations also correspond to the highest relative proportion of inorganic or non-porphyrinic Ni phases.
Table 2.
| Reference material | ||||||
|---|---|---|---|---|---|---|
| Sample spectrum | NiTPP (%) | NiOEP (%) | NiO (%) | NiS (%) | Sum (%) | R-factor |
| AB-0m-M1-S1 | 20 ± 3 | 62 ± 2 | 7 ± 1 | 8 ± 1 | 97 | 0.0051 |
| AB-0m-M1-S2 | 17 ± 3 | 52 ± 2 | 11 ± 1 | 17 ± 1 | 97 | 0.0046 |
| AB-0m-M1-S3 | 22 ± 3 | 55 ± 2 | 8 ± 1 | 12 ± 1 | 97 | 0.0050 |
| AB-0m-M2-S1a | 5 ± 2 | 48 ± 2 | 29 ± 1 | 14 ± 1 | 97 | 0.0035 |
| AB-0m-M2-S2a | 21 ± 2 | 59 ± 2 | 17 ± 1 | 0 ± 0 | 97 | 0.0054 |
| AB-0m-M2-S3a | 6 ± 3 | 61 ± 2 | 16 ± 1 | 14 ± 1 | 97 | 0.0042 |
| AB-7m-M1-S1a | 14 ± 3 | 46 ± 2 | 9 ± 1 | 28 ± 1 | 97 | 0.0052 |
| AB-7m-M1-S2a | 8 ± 3 | 68 ± 3 | 1 ± 1 | 19 ± 1 | 97 | 0.0064 |
| AB-7m-M1-S3a | 21 ± 2 | 51 ± 2 | 18 ± 1 | 7 ± 1 | 98 | 0.0039 |
| AB-7m-M2-S2 | 9 ± 3 | 62 ± 2 | 17 ± 1 | 8 ± 1 | 96 | 0.0044 |
| AB-7m-M2-S3 | 7 ± 3 | 67 ± 3 | 5 ± 1 | 18 ± 1 | 96 | 0.0059 |
| AM-2m-M1-S1a | 25 ± 3 | 41 ± 3 | 15 ± 1 | 17 ± 1 | 98 | 0.0055 |
| AM-2m-M1-S2a | 25 ± 3 | 42 ± 3 | 11 ± 1 | 18 ± 1 | 96 | 0.0054 |
| AM-2m-M1-S3a | 17 ± 2 | 41 ± 2 | 23 ± 1 | 19 ± 1 | 99 | 0.0027 |
| AM-2m-M2-S1 | 0 ± 0 | 71 ± 1 | 11 ± 1 | 15 ± 1 | 96 | 0.0053 |
| AM-2m-M2-S3 | 4 ± 3 | 68 ± 3 | 5 ± 1 | 20 ± 1 | 96 | 0.0065 |
| AM-6m-M1-S2 | 11 ± 3 | 61 ± 3 | 3 ± 1 | 14 ± 1 | 89 | 0.0084 |
| AM-6m-M1-S4 | 23 ± 4 | 50 ± 3 | 0 ± 1 | 19 ± 1 | 93 | 0.0097 |
a
Spectra presented in Fig. 2.
To further assess contributions to the lineshape of these Ni K-edge μXANES spectra, a second LCF scenario was also considered. Linear combination fits were generated using a Ni K-edge XANES spectrum for AOSR asphaltene (Lytle 1983) and NiS, plus one of the following: NiO, Ni(OH)2, NiSO4·6H2O, or NiCO3·2Ni(OH)2 (Fig. 2). The Ni K-edge spectrum for this asphaltene sample is likely more representative than the synthetic porphyrin reference materials of pre-coking Ni speciation. Consequently, fit quality—determined based upon R-factor and residuals—was improved considerably with this second scenario. Nickel coordination in this asphaltene sample was, however, less well constrained than in the NiTPP and NiOEP reference materials. In this second LCF scenario, different inorganic Ni reference spectra, all of which are geochemically feasible within coke deposits, were included in the best fits of various sample spectra (Table 3). Due to the similar features of Ni K-edge spectra for the various inorganic reference materials, the LCF results do not necessarily confirm the presence or absence of a given inorganic Ni-bearing compound. Nickel(II)-sulfide was expected in the samples and, therefore, was included in fits for all sample spectra. The NiS reference spectrum differs substantially from that of the other inorganic reference materials and is unlikely to produce non-unique fits.
Table 3.
| Reference material | |||||||
|---|---|---|---|---|---|---|---|
| Sample spectrum | Ni-asphaltene (%) | Ni(II)-sulfide (%) | Ni(II)-oxide (%) | Ni(II)-sulfate (%) | Ni(II)-carbonate (%) | Sum (%) | R-factor |
| AB-0m-M1-S1 | 87 ± 1 | 0 ± 0 | — | 12 ± 1 | — | 98 | 0.0053 |
| AB-0m-M1-S2 | 73 ± 1 | 12 ± 1 | — | 12 ± 1 | — | 98 | 0.0031 |
| AB-0m-M1-S3 | 79 ± 1 | 7 ± 1 | — | 12 ± 1 | — | 98 | 0.0040 |
| AB-0m-M2-S1a | 57 ± 1 | 11 ± 1 | — | — | 29 ± 1 | 97 | 0.0025 |
| AB-0m-M2-S2a | 78 ± 2 | 0 ± 0 | — | 20 ± 1 | — | 98 | 0.0059 |
| AB-0m-M2-S3a | 72 ± 1 | 6 ± 1 | — | — | 20 ± 1 | 98 | 0.0044 |
| AB-7m-M1-S1a | 71 ± 1 | 15 ± 1 | 11 ± 1 | — | — | 98 | 0.0029 |
| AB-7m-M1-S2a | 86 ± 1 | 5 ± 1 | — | — | 7 ± 10 | 98 | 0.0065 |
| AB-7m-M1-S3a | 71 ± 1 | 8 ± 1 | — | 19 ± 1 | — | 98 | 0.0031 |
| AB-7m-M2-S2 | 76 ± 1 | 0 ± 0 | — | — | 21 ± 1 | 97 | 0.0051 |
| AB-7m-M2-S3 | 82 ± 1 | 5 ± 1 | — | — | 10 ± 1 | 97 | 0.0065 |
| AM-2m-M1-S1a | 76 ± 1 | 5 ± 1 | 18 ± 1 | — | — | 100 | 0.0034 |
| AM-2m-M1-S2a | 77 ± 1 | 7 ± 1 | 14 ± 1 | — | — | 98 | 0.0033 |
| AM-2m-M1-S3a | 56 ± 1 | 23 ± 1 | — | 21 ± 1 | — | 100 | 0.0022 |
| AM-2m-M2-S1 | 82 ± 1 | 0 ± 0 | — | — | 15 ± 1 | 98 | 0.0076 |
| AM-2m-M2-S3 | 82 ± 2 | 6 ± 1 | — | — | 9 ± 1 | 97 | 0.0062 |
| AM-6m-M1-S2 | 86 ± 1 | 0 ± 0 | — | 5 ± 1 | — | 91 | 0.0050 |
| AM-6m-M1-S4 | 87 ± 1 | 5 ± 1 | 3 ± 1 | — | — | 95 | 0.0034 |
a
Spectra presented in Fig. 2.
In the first LCF scenario, NiO was consistently favoured over other inorganic standards (i.e., Ni(OH)2, NiSO4·6H2O, or NiCO3·2Ni(OH)2), because small changes in the overall spectra could be accounted for by varying the relative proportion of NiTPP and NiOEP. Conversely, in the second LCF scenario, different inorganic standards were favoured over NiO because the asphaltene alone could not account for small variations in the overall spectra. The fit sum was consistently closer to 1.0 for fits generated using the second scenario, further indicating that the Ni K-edge spectrum for AOSR asphaltene is a better fit than any linear combination of spectra for the synthetic NiTPP and NiOEP reference materials.
Linear combination fitting approximated the relative magnitudes of the doublet peaks at ∼8352 and ∼8359 eV reasonably well. Conversely, attempts to simulate the dampening and broadening of the shoulder at 8340 eV, although improved by the inclusion of NiS, were generally unsuccessful (Fig. 2). This inconsistency could result from the presence of an unknown Ni-bearing phase or, more likely, from variability at the nano-scale in the distortion of Ni coordination sites within coke. This interpretation is consistent with results of FDMNES analysis described by Nesbitt et al. (2017).
Sequential extractions
Results of the sequential extraction protocol revealed that Ni release was dependent on both extractant and particle size (Fig. 3). Water-soluble Ni (F1) averaged 0.25 ± 0.22 mg·kg−1 across all locations and grain-size fractions. The highest water-soluble Ni concentrations, which exceeded 0.5 mg·kg−1, were observed for the smallest grain-size fraction (f1) and the shallowest (i.e., 0 and 0.5 m below surface) samples. Exchangeable Ni (F2) exhibited a median value of 2.6 mg·kg−1 among all samples and averaged 3.1 ± 0.9 and 2.1 ± 1.1 mg·kg−1 for the smallest and largest particle-size fractions, respectively. Background Ni concentrations in the weak reductant solution (F3) approached values measured in the supernatant following this extraction step. Consequently, Ni release could only be determined for two samples. Finally, acid-soluble Ni (F4) for all locations and grain-size fractions averaged 0.47 ± 0.19 mg·kg−1 with a median value of 0.43 mg·kg−1. Although not statistically significant, there was an apparent inverse relationship between Ni release and grain size for the F1 and F2 fractions. Overall, the summed Ni released during the selective extraction protocol averaged 3.6 ± 1.4 mg·kg−1, which corresponds to 1.6% ± 0.8% (w/w) of total Ni concentrations reported by Nesbitt et al. (2017).
Fig. 3.
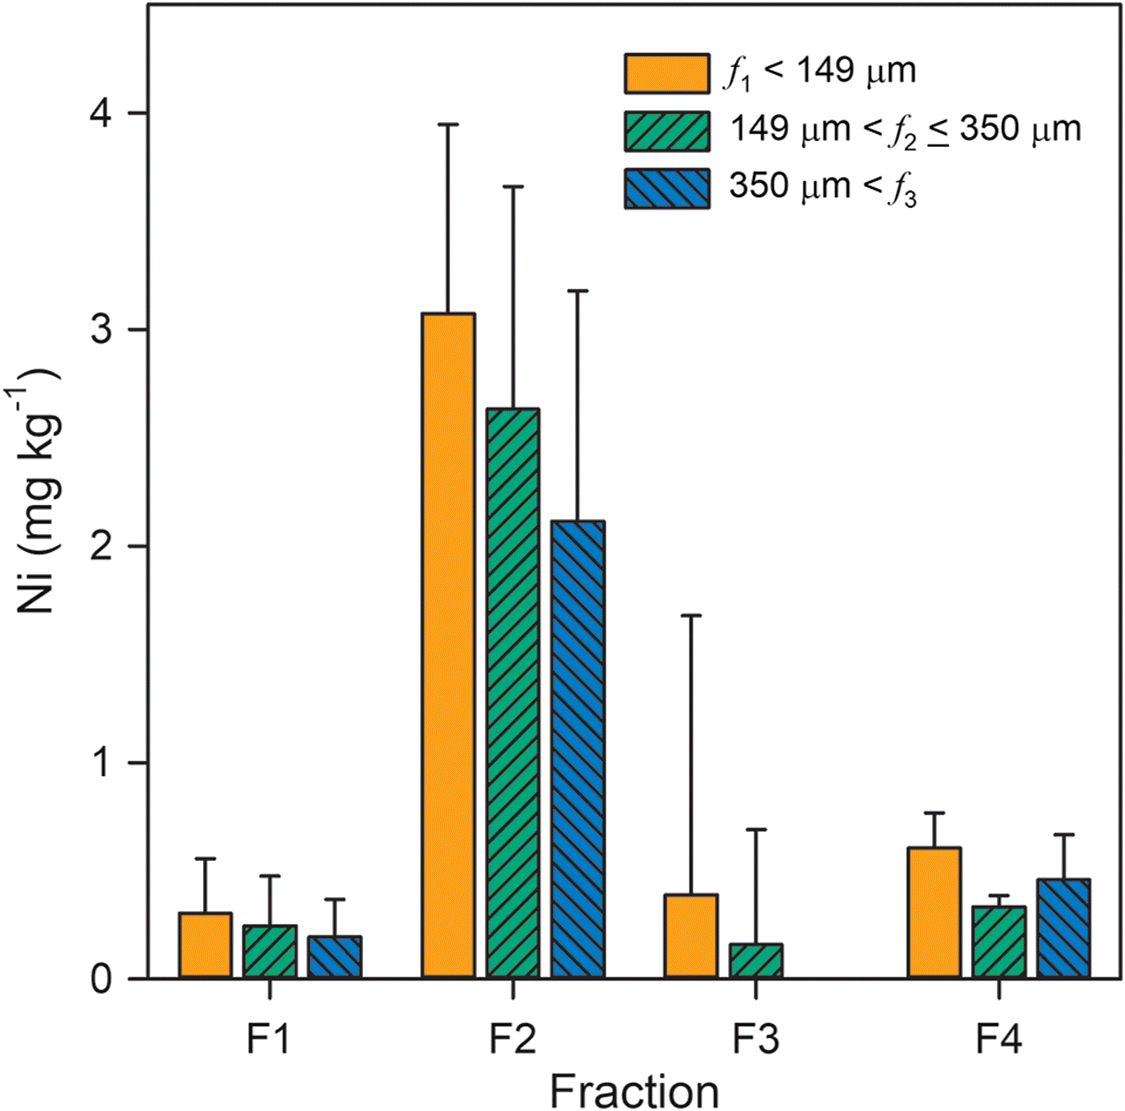
Extraction results indicated that only a small proportion of total Ni present in these coke deposits can be leached under environmentally relevant conditions. This result is consistent with the interpretation that porphyrin complexes are not the principal source of dissolved Ni within oil sands fluid petroleum coke deposits. Although organic Ni phases generally comprise the major component of total Ni (Nesbitt et al. 2017), inorganic phases are a likely source of dissolved Ni within these deposits. Limited Ni release during the water-soluble sequential extraction step suggested that NiSO4·6H2O and other soluble inorganic Ni(II) phases did not represent a major component of leachable Ni within the coke samples. In contrast, approximately 80% of total Ni release occurred during the reducible sequential extraction step. The extractant solution used during this step was buffered to pH 6.7, which is near the measured pHpzc of 6.4 and a value of 6.5 ± 0.3 previously reported for oil sands fluid petroleum coke (Pourrezaei et al. 2014). Consequently, exchange with Na and a pH-dependent change in net surface charge may have contributed to Ni release in the exchangeable fraction. Nickel release was limited in the reducible fraction, but some Ni release was detected with the acid-soluble fraction. Iron and Mn release with these fractions were also limited, suggesting that Fe(III) and Mn(V) (hydr)oxide contents were generally low. Therefore, Ni release in the acid-soluble fraction is more likely associated with carbonate, hydroxide, or sulfide phases and potentially with desorption of remaining Ni at low pH. Overall, these results indicate that Ni release may be enhanced at elevated ionic strength and acidic pH.
Pore water chemistry
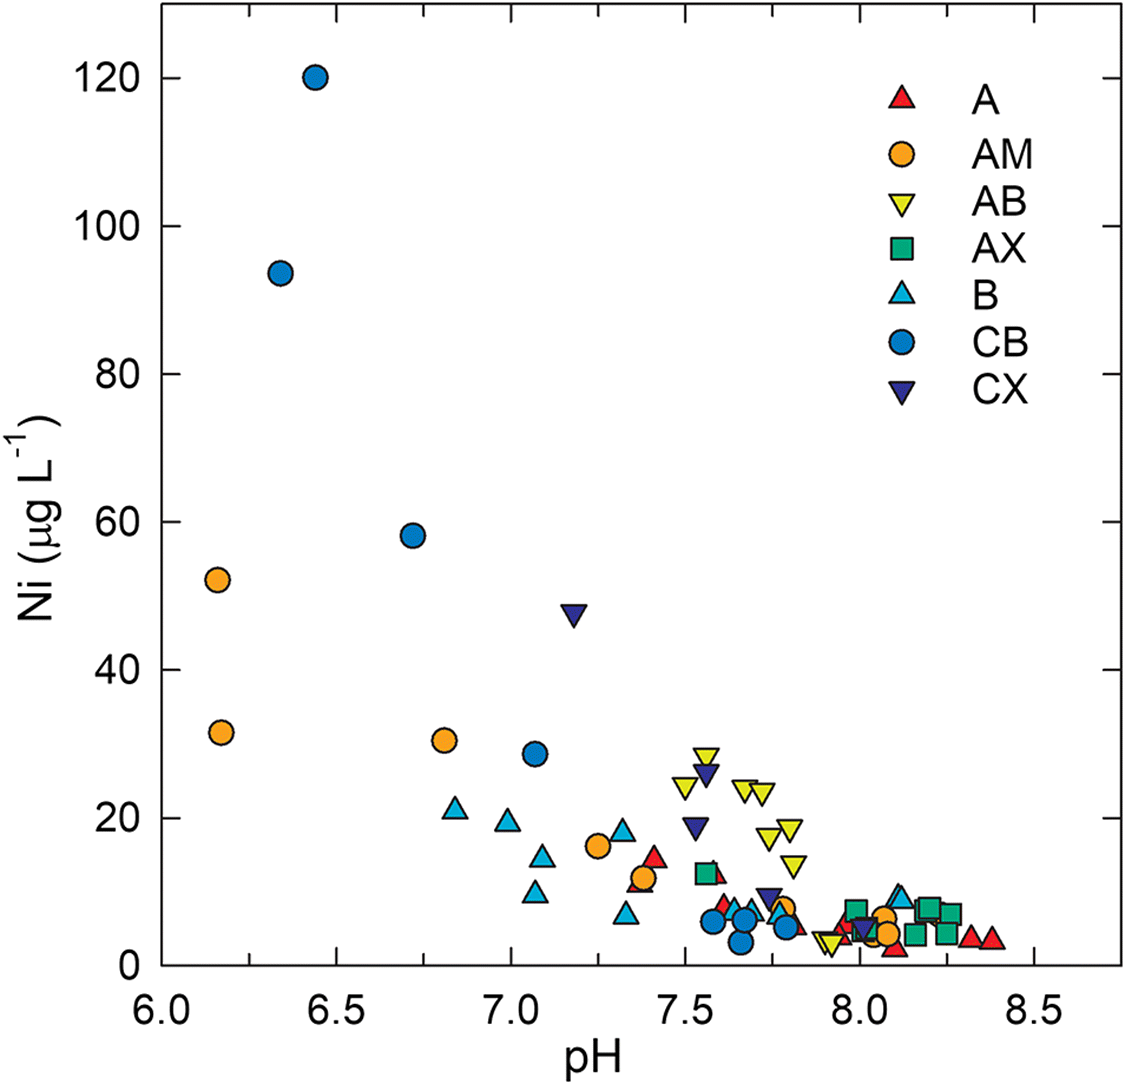
Pore water samples from the CB and CW deposits exhibited total dissolved Ni concentrations ranging from 2 to 120 μg·L−1 with a median value of 7.8 μg·L−1 (Fig. 4). The highest concentrations occurred within the upper 1.0 m of the saturated zone, and dissolved Ni generally decreased with increasing depth below the water table. This trend was generally opposite to that observed for pH, which increased with depth below the water table (Fig. 4). The median pore water pH was 7.7 and values ranged from 6.3 to 8.4. A significant (p < 0.05) negative correlation (R = −0.79) between pH and Ni (Fig. 5) suggested that pH-dependent precipitation–dissolution or sorption reactions influenced Ni distribution and mobility within coke deposits. Zajic et al. (1977) observed a similar negative relationship between dissolved Ni concentrations and pH in coke pore water. Puttaswamy and Liber (2011) reported Ni concentrations in oil sands fluid petroleum coke leachate of 145 ± 31 μg·L−1 at pH 5.5 compared with 0.2 ± 0.1 μg·L−1 at pH 9.5. Thermodynamic speciation modelling results indicated that pore water was consistently undersaturated with respect to NiO(s), NiCO3(s), and Ni(OH)2(s), suggesting that these phases were not principal controls on dissolved Ni concentrations.
Fig. 4.
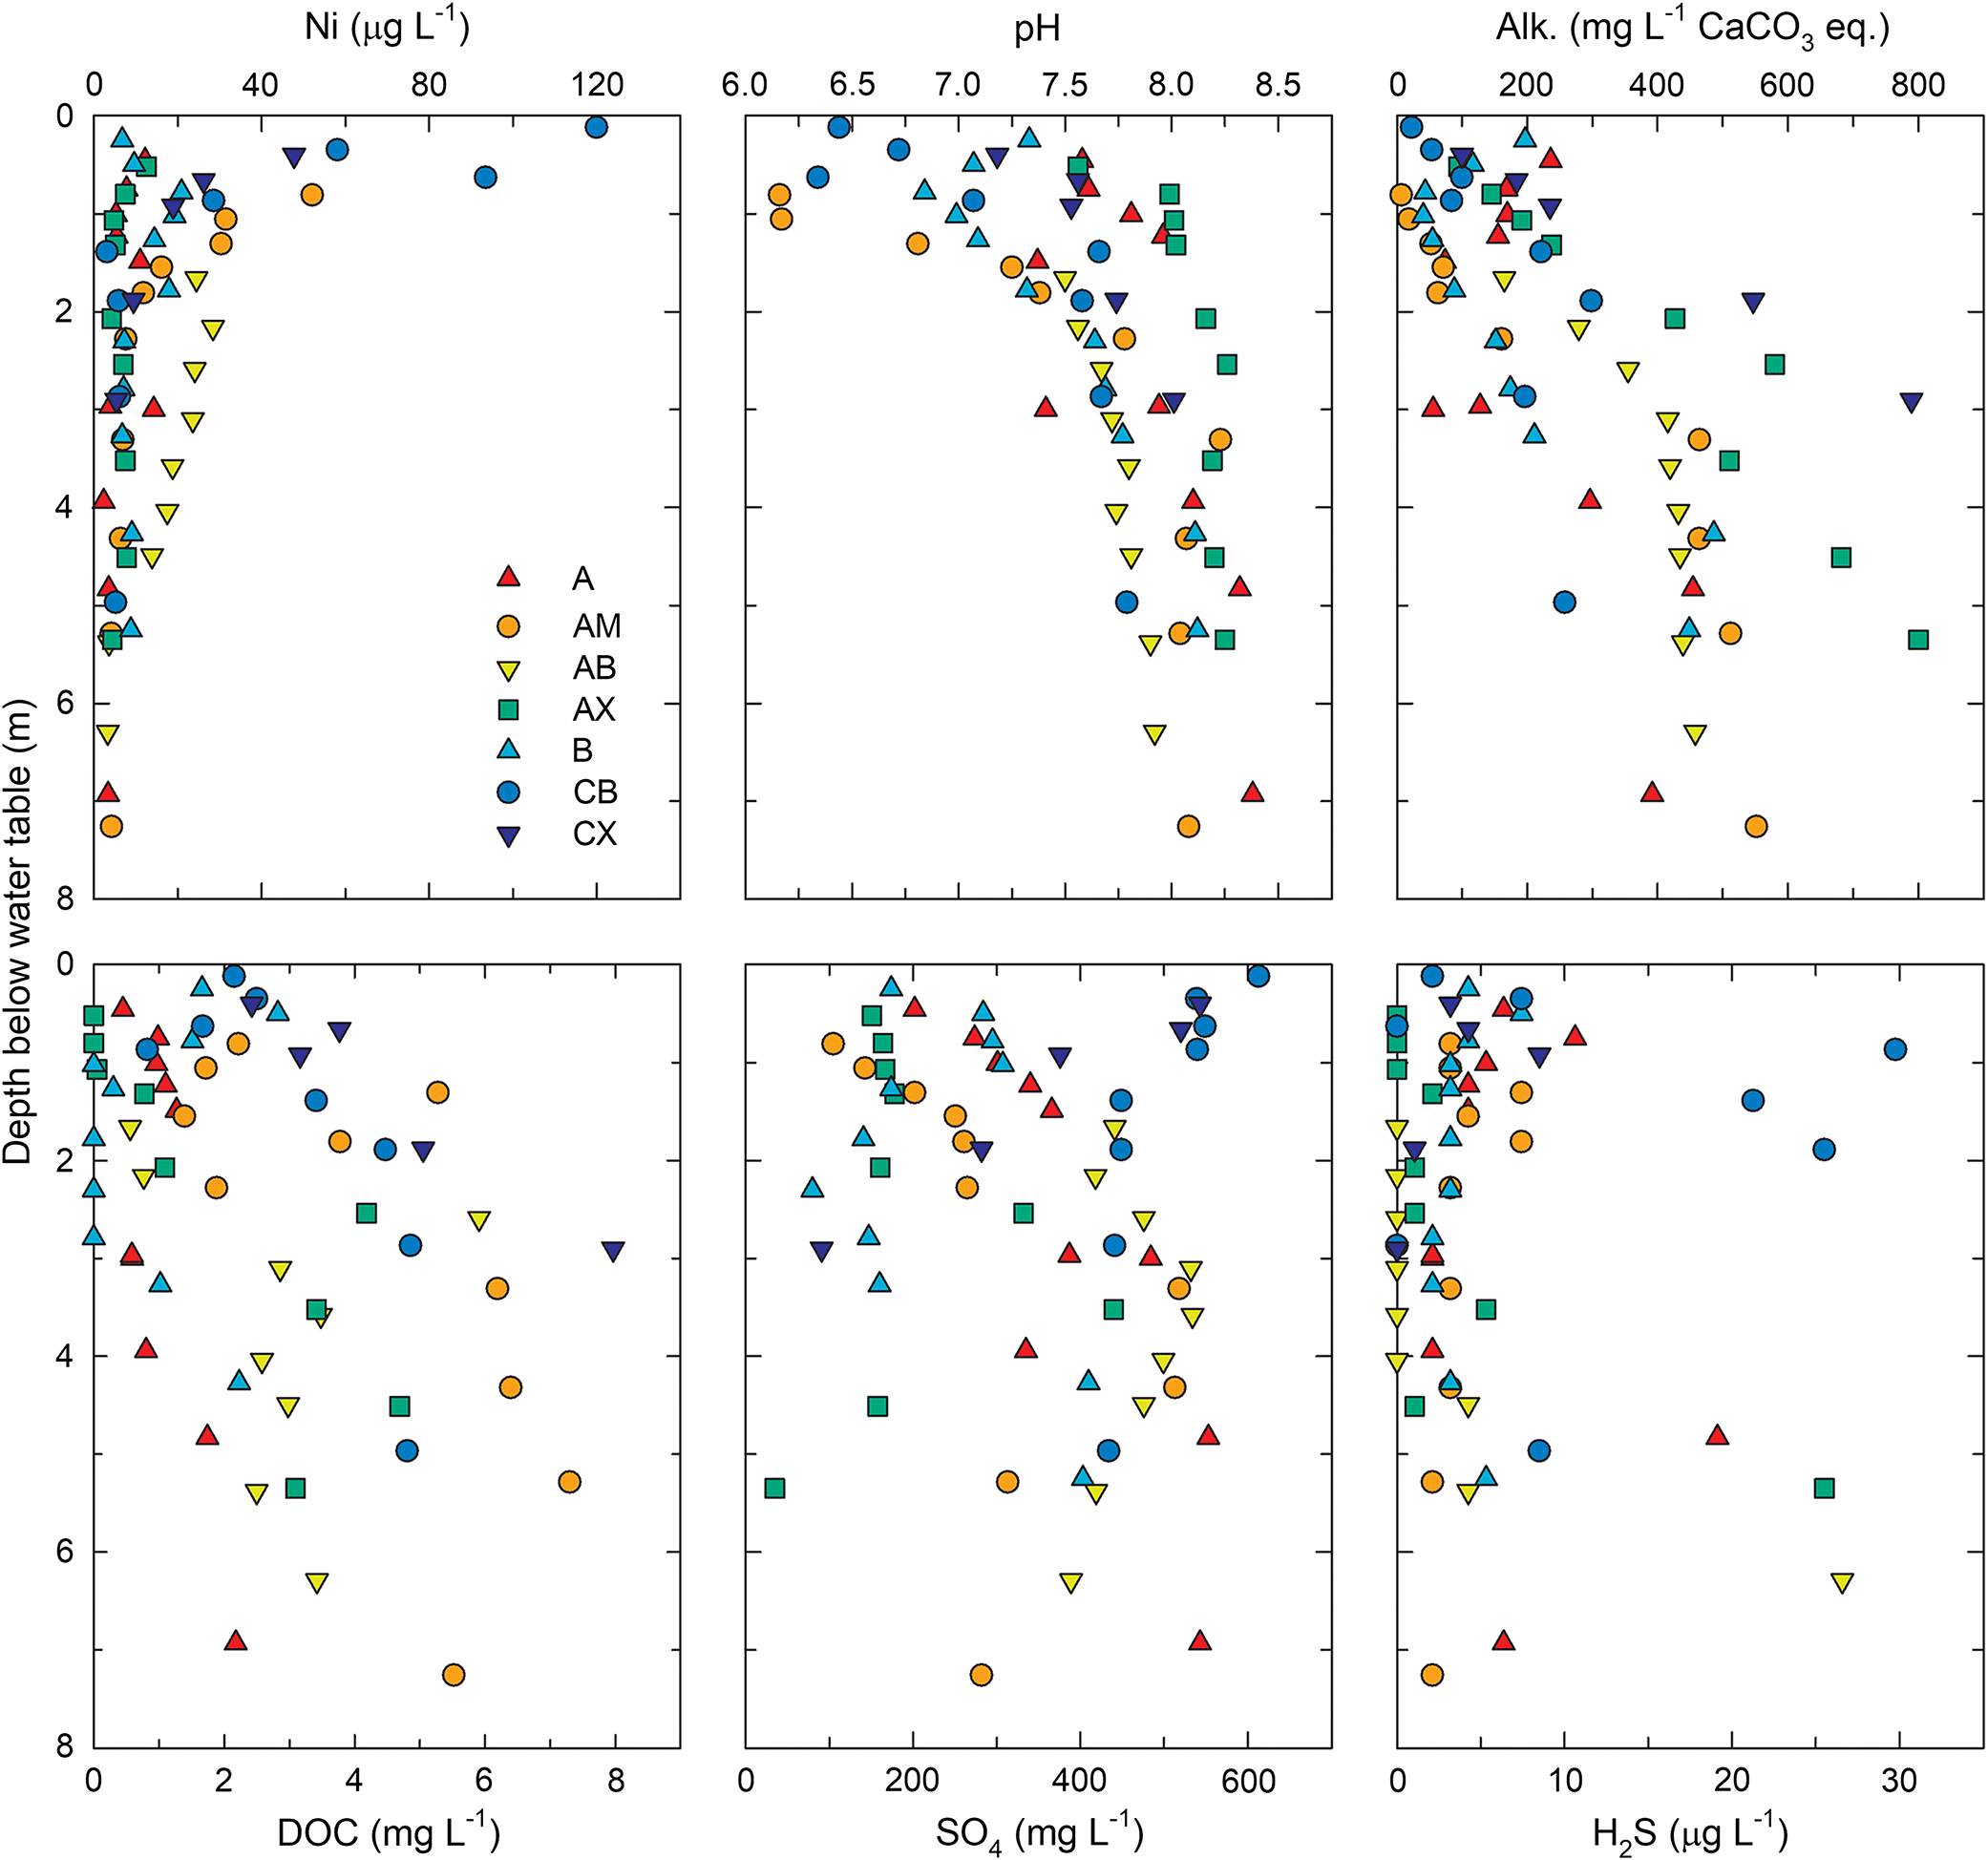
Fig. 5.
Pore water alkalinity (median: 230 mg·L−1 as CaCO3) exhibited a downward increasing trend, with concentrations exceeding 400 mg·L−1 (as CaCO3) observed in the lowermost wells for most locations (Fig. 4). Dissolved organic carbon concentrations ranged from 0 to 15 mg·L−1 (median 2.2 mg·L−1) and generally increased with depth. Dissolved SO4 concentrations (median 340 mg·L−1) concentrations exhibited more variability, both among locations and with depth at individual locations. Previous research suggests Ni leaching may be enhanced in the presence of dissolved SO4 (Puttaswamy and Liber 2012). However, total dissolved nickel concentrations did not correlate with SO4, alkalinity, or DOC, suggesting these constituents were not important controls on Ni mobility within coke deposits. Elevated H2S concentrations were detected at several locations with concentrations ranging from <5 to 30 μg·L−1. Consequently, pore water was supersaturated with respect to NiS(s), mackinawite [FeS(s)], and pyrite [FeS2(s)]. Nickel incorporation into mackinawite and pyrite formed under sulfate-reducing conditions can occur (Luther et al. 1980; Huerta-Diaz et al. 1998; Rickard 2012). Precipitation of these sulfide phases, therefore, has potential to limit dissolved Ni concentrations under sulfate reducing conditions within the coke deposits.
Speciation modelling results suggested that Ni2+ comprised 30%–90% of dissolved Ni (median 62%), whereas NiHCO3+, NiCO30, and NiSO40 accounted for the remainder. In general, the proportion of Ni2+ predicted by the model declined with depth corresponding to decreased total Ni concentrations and increased proportions of both NiHCO3+ and NiCO30. Depth-dependent trends in NiSO40 abundance were not apparent due to the greater spatial variability in SO4 concentrations relative to alkalinity. Complexation with Cl− and OH− was not predicted to strongly influence aqueous Ni speciation. The presence of non-ionic complexes (i.e., NiCO30, NiSO40) may have partially limited Ni sorption.
The pore water data indicate that pH is a dominant control on dissolved Ni concentrations within fluid coke deposits. Pore water pH ranged from slightly below (pH 6.2) to above (pH 8.4) measured and published (Pourrezaei et al. 2014) pHpzc values for oil sands fluid petroleum coke. This observation suggests that sorption–desorption reactions involving Ni2+ and positively charged aqueous Ni complexes (e.g., NiHCO3+) likely influence dissolved Ni concentrations within the fluid coke deposits. Consequently, the observed negative relationship between pH and dissolved Ni concentrations may result from pH-dependent variation in net surface charge and, therefore, Ni2+ and NiHCO3+ sorption. The precipitation of secondary sulfide phases may have limited dissolved Ni concentrations at greater depths below the water table. However, Ni K-edge μXANES spectra could not discriminate between NiS formed by catalytic conversion of porphyrinic Ni and potential secondary NiS precipitated in situ. Nevertheless, the pore water chemistry results indicate that Ni mobility should be limited in mildly alkaline and sulfidic environments, which are commonly observed in tailings deposits in the AOSR (Stasik et al. 2014; Dompierre et al. 2016; Reid and Warren 2016).
Conclusions
Geochemical controls on dissolved Ni concentrations in oil sands fluid petroleum coke deposits were examined using synchrotron-based spectroscopy, sequential extractions, pore water sampling, and geochemical speciation modelling. Micro-X-ray fluorescence (μXRF) mapping and micro-X-ray absorption near edge structure (μXANES) spectroscopy revealed heterogeneous Ni distribution and speciation within coke particles. Nickel concentrations were elevated near outer margins of individual concentric layers that comprise these particles. Porphyrinic coordination dominated Ni speciation in the inner region of these concentric layers, whereas inorganic Ni was also detected near the outer margins. Selective extractions, pore water chemistry, and speciation modelling indicated that Ni release is largely controlled by pore water pH and sorption-desorption reactions. Extraction results also indicated that only a small proportion of total Ni within coke is likely susceptible to leaching under environmentally relevant conditions, which is also consistent with porphyrin complexes dominating solid-phase Ni speciation. Dissolved Ni concentrations within the coke deposits generally increased with decreasing pH. Corresponding speciation modelling, coupled with selective extraction results, support the interpretation that sorption–desorption reactions are an important control on Ni concentrations within coke pore waters. Overall, these findings indicated that Ni mobility within fluid petroleum coke deposits should remain limited under alkaline pH conditions.
Acknowledgements
Funding was provided by the Natural Sciences and Engineering Research Council of Canada (NSERC) and Syncrude Canada Ltd. through the NSERC Industrial Research Chairs program (Grant No. IRCPJ-450684-13). JAN and LAS recognize support from the NSERC—Toward Environmentally Responsible Resource Extraction—Collaborative Research and Training Experience (NSERC-TERRE-CREATE) program (Grant No. CREAT 449124-2014). JAN also acknowledges support from the SRK Canada Graduate Scholarship Program. A portion of the research described in this paper was performed at the Advanced Photon Source, a U.S. Department of Energy (DOE) Office of Science User Facility operated for the DOE Office of Science by Argonne National Laboratory under contract no. DE-AC02-06CH11357. We thank T. Lanzirotti and M. Newville for assistance with XAS data collection. We thank Dr. Ning Chen for providing an XAS reference spectrum for NiS. We also thank N. Galuschik for assistance with sample collection and analyses. This paper benefited from constructive comments from three anonymous reviewers.
References
AER. 2016. ST-98-2016: Alberta’s Energy Reserves 2015 and Supply/Demand Outlook 2016–2025. Alberta Energy Regulator, Calgary, Alberta.
Appels WM, Wall SN, Barbour SL, Hendry MJ, Nichol CF, and Chowdhury SR. 2017. Pyrite weathering in reclaimed shale overburden at an oil sands mine near Fort McMurray, Canada. Mine Water and the Environment, 36: 479–494.
Baker LF, Ciborowski JJH, and MacKinnon MD. 2012. Petroleum coke and soft tailings sediment in constructed wetlands may contribute to the uptake of trace metals by algae and aquatic invertebrates. Science of the Total Environment, 414: 177–186.
Bunău O, and Joly Y. 2009. Self-consistent aspects of x-ray absorption calculations. Journal of Physics: Condensed Matter, 21: 345501.
Chung KH, Janke LCG, Dureau R, and Furimsky E. 1996. Leachability of cokes from Syncrude stockpiles. Environmental Science and Engineering Magazine, 9(2): 50–53.
Cordero PRF, Bennett RM, Bautista GS, Aguilar JPP, and Dedeles GR. 2015. Degradation of nickel protoporphyrin disodium and vanadium oxide octaethylporphyrin by Philippine microbial consortia. Bioremediation Journal, 19: 93–103.
Dompierre KA, Lindsay MBJ, Cruz-Hernández P, and Halferdahl GM. 2016. Initial geochemical characteristics of fluid fine tailings in an oil sands end pit lake. Science of The Total Environment, 556: 196–206.
Furimsky E. 2000. Characterization of cokes from fluid/flexi-coking of heavy feeds. Fuel Processing Technology, 67(3): 205–230.
Gray MR. 2015. Upgrading oilsands bitumen and heavy oil. 1st edition. The University of Alberta Press, Edmonton, Alberta. 512 p.
Grosjean E, Adam P, Connan J, and Albrecht P. 2004. Effects of weathering on nickel and vanadyl porphyrins of a Lower Toarcian shale of the Paris basin. Geochimica et Cosmochimica Acta, 68: 789–804.
Har SH. 1981. Characterization of oil sands fluid coke. M.Sc. thesis, University of Alberta, Edmonton, Alberta. 132 p.
Huerta-Diaz MA, Tessier A, and Carignan R. 1998. Geochemistry of trace metals associated with reduced sulfur in freshwater sediments. Applied Geochemistry, 13: 213–233.
Jack TR, Sullivan EA, and Zajic JE. 1979. Leaching of vanadium and other metals from Athabasca Oil Sands coke and coke ash. Fuel, 58(8): 589–594.
Lewan MD. 1984. Factors controlling the proportionality of vanadium to nickel in crude oils. Geochimica et Cosmochimica Acta, 48: 2231–2238.
Lewan MD, and Maynard JB. 1982. Factors controlling enrichment of vanadium and nickel in the bitumen of organic sedimentary rocks. Geochimica et Cosmochimica Acta, 46: 2547–2560.
Light TS. 1972. Standard solution for redox potential measurements. Analytical Chemistry, 44(6): 1038–1039.
Luther GW III, Meyerson AL, Krajewski JJ, and Hires R. 1980. Metal sulfides in estuarine sediments. Journal of Sedimentary Research, 50: 1117–1120.
Lytle FW. 1983. Cold Lake asphaltene Ni XAS spectra. International X-ray Absorption Society XAFS Database [online]: Available from ixs.iit.edu/database/data/Farrel_Lytle_data/RAW/.
Murray KR, Barlow N, and Strack M. 2017. Methane emissions dynamics from a constructed fen and reference sites in the Athabasca Oil Sands Region, Alberta. Science of the Total Environment, 583: 369–381.
Nakata C, Qualizza C, MacKinnon M, and Renault S. 2011. Growth and physiological responses of Triticum aestivum and Deschampsia caespitosa exposed to petroleum coke. Water, Air, & Soil Pollution, 216: 59–72.
Nesbitt JA, and Lindsay MBJ. 2017. Vanadium geochemistry of oil sands fluid petroleum coke. Environmental Science & Technology, 51: 3102–3109.
Nesbitt JA, Lindsay MBJ, and Chen N. 2017. Geochemical characteristics of oil sands fluid petroleum coke. Applied Geochemistry, 76: 148–158.
Nordstrom DK. 1977. Thermochemical redox equilibria of ZoBell’s solution. Geochimica et Cosmochimica Acta, 41: 1835–1841.
Parkhurst DL, and Appelo CAJ. 2013. Description of input and examples for PHREEQC—a computer program for speciation, batch-reaction, one-dimensional transport, and inverse geochemical calculations. U.S. Geological Survey techniques and methods 6–A43. United States Geological Survey (USGS), Washington D.C., USA 497 p. Available from pubs.usgs.gov/tm/06/a43/pdf/tm6-A43.pdf.
Pourrezaei P, Alpatova A, Chelme-Ayala P, Perez-Estrada LA, Jensen-Fontaine M, Le XC, et al. 2014. Impact of petroleum coke characteristics on the adsorption of the organic fractions from oil sands process-affected water. International Journal of Environmental Science and Technology, 11: 2037–2050.
Puttaswamy N, and Liber K. 2011. Identifying the causes of oil sands coke leachate toxicity to aquatic invertebrates. Environmental Toxicology and Chemistry, 30: 2576–2585.
Puttaswamy N, and Liber K. 2012. Influence of inorganic anions on metals release from oil sands coke and on toxicity of nickel and vanadium to Ceriodaphnia dubia. Chemosphere, 86: 521–529.
Puttaswamy N, Turcotte D, and Liber K. 2010. Variation in toxicity response of Ceriodaphnia dubia to Athabasca oil sands coke leachates. Chemosphere, 80: 489–497.
Ravel B, and Newville M. 2005. ATHENA, ARTEMIS, HEPHAESTUS: data analysis for X-ray absorption spectroscopy using IFEFFIT. Journal of Synchrotron Radiation, 12: 537–541.
Reid ML, and Warren LA. 2016. S reactivity of an oil sands composite tailings deposit undergoing reclamation wetland construction. Journal of Environmental Management, 166: 321–329.
Rickard D. 2012. Metal sequestration by sedimentary iron sulfides. In Developments in sedimentology—Sulfic sediments and sedimentary rocks. Edited by D Rickard. Vol. 65, Ch. 7, pp. 287–317. Elsevier B.V., New York, New York, USA.
Simhayov RB, Price JS, Smeaton CM, Parsons C, Rezanezhad F, and Van Cappellen P. 2017. Solute pools in Nikanotee Fen watershed in the Athabasca oil sands region. Environmental Pollution, 225: 150–162.
Stasik S, Loick N, Knöller K, Weisener C, and Wendt-Potthoff K. 2014. Understanding biogeochemical gradients of sulfur, iron and carbon in an oil sands tailings pond. Chemical Geology, 382: 44–53.
Wassenaar LI, Hendry MJ, Chostner VL, and Lis GP. 2008. High resolution pore water δ2H and δ18O measurements by H2O(liquid)–H2O(vapor) equilibration laser spectroscopy. Environmental Science & Technology, 42: 9262–9267.
Zajic JE, Jack TR, Sullivan EA, and Woodfield G. 1977. Metals, microbes and bituminous sands: chemical and microbially-assisted leaching of Athabasca oil sands cokes. Alberta Oil Sands Technology and Research Authority (AOSTRA), Edmonton, Alberta, Canada. Agreement #20.
Zhang Y, Shotyk W, Zaccone C, Noernberg T, Pelletier R, Bicalho B, et al. 2016. Airborne petcoke dust is a major source of polycyclic aromatic hydrocarbons in the Athabasca oil sands region. Environmental Science & Technology, 50: 1711–1720.
Zubot W, MacKinnon MD, Chelme-Ayala P, Smith DW, and Gamal El-Din M. 2012. Petroleum coke adsorption as a water management option for oil sands process-affected water. Science of the Total Environment, 427–428: 364–372.
Zubot WA. 2010. Removal of naphthenic acids from oil sands process water using petroleum coke. M.Sc. thesis, University of Alberta, Edmonton, Alberta. 169 p.
Information & Authors
Information
Published In
FACETS
Volume 3 • Number 1 • October 2018
Pages: 469 - 486
Editor: Ian S. Butler
History
Received: 4 October 2017
Accepted: 26 February 2018
Version of record online: 30 April 2018
Copyright
© 2018 Nesbitt et al. This work is licensed under a Creative Commons Attribution 4.0 International License (CC BY 4.0), which permits unrestricted use, distribution, and reproduction in any medium, provided the original author(s) and source are credited.
Data Availability Statement
All relevant data are within the paper.
Key Words
Sections
Subjects
Plain Language Summary
Improving understanding of nickel leaching from petroleum coke in Canada’s oil sands region
Authors
Author Contributions
JAN and MBJL conceived and designed the study.
JAN, LAS, and MBJL performed the experiments/collected the data.
All analyzed and interpreted the data.
JAN, JMR, and MBJL drafted or revised the manuscript.
Competing Interests
The authors have declared that no competing interests exist.
Metrics & Citations
Metrics
Other Metrics
Citations
Cite As
Jake A. Nesbitt, Jared M. Robertson, Lawrence A. Swerhone, and Matthew B. J. Lindsay. 2018. Nickel geochemistry of oil sands fluid petroleum coke deposits, Alberta, Canada. FACETS.
3(1): 469-486. https://doi.org/10.1139/facets-2017-0115
Export Citations
If you have the appropriate software installed, you can download article citation data to the citation manager of your choice. Simply select your manager software from the list below and click Download.
Cited by
1. Polysphaeroides filiformis, a proterozoic cyanobacterial microfossil and implications for cyanobacteria evolution
2. Intracellular bound chlorophyll residues identify 1 Gyr-old fossils as eukaryotic algae
3. Geochemical conditions influence vanadium, nickel, and molybdenum release from oil sands fluid petroleum coke
4. An EXAFS and XANES Study of V, Ni, and Fe Speciation in Cokes for Anodes Used in Aluminum Production
5. Aqueous- and solid-phase molybdenum geochemistry of oil sands fluid petroleum coke deposits, Alberta, Canada