Open access

Small to large-scale patterns of ground-dwelling spider (Araneae) diversity across northern Canada

This article has been corrected.
VIEW CORRECTION
Publication: FACETS
20 September 2018

Abstract

We examined how Arctic spider (Araneae) biodiversity is distributed at multiple spatial scales in northern Canada using a standardized hierarchical sampling design. We investigated which drivers, environmental or spatial, influence the patterns observed. Spatial patterns of Arctic spider species richness and composition were assessed in 12 sites located in arctic, subarctic, and north boreal ecoclimatic regions, spanning 30 degrees of latitude and 80 degrees of longitude. Variation in diversity was partitioned in relation to multiple environmental and spatial drivers of diversity patterns. Over 23 000 adult spiders, representing 306 species in 14 families, were collected in northern Canada, with 107 species (35% of the total species collected) representing new territorial or provincial records. Spider diversity was structured at the regional scale across ecoclimatic regions but was not structured with latitude. Longitudinal patterns of spider diversity across Canada may be explained by post-glacial dispersal. At local scales, diversity was non-randomly distributed and possibly limited by biotic interactions. We recommend the use of ecoclimatic regions as a framework for conservation of biodiversity in northern Canada and spiders as useful bioindicators that can help us understand the effects of climate change across ecoclimatic regions of northern Canada.

Introduction

Given current rapid climate change in the Arctic (IPCC 2013), it is essential to understand how northern arthropods, which constitute more than 60% of the northern diversity (CAFF 2013), are distributed and which factors influence spatial patterns of diversity. This is required to develop sustainable long-term conservation strategies. Because these small ectothermic organisms respond to fine variations in microhabitat, but often have large range of distribution (CAFF 2013; Hansen et al. 2016), appropriate investigation of diversity patterns and drivers underlying those patterns is required at multiple spatial scales.
Looking to the literature, it is clear that determining patterns at multiple spatial scales can help to unravel some unexpected biological information (e.g., host specificity within butterflies (Summerville et al. 2003)), reinforce the importance of some habitats for biodiversity conservation (Paknia and Pfeiffer 2011) or the impact of some disturbances on biodiversity (Fournier and Loreau 2001), and determine processes driving biodiversity patterns (Marques and Schoereder 2014). Using a standardized nested sampling design, patterns and processes of tropical and temperate forest arthropods have been successfully described, focusing on local and regional patterns of butterflies and moths (Summerville et al. 2003; Beck et al. 2012), flies (Lévesque-Beaudin and Wheeler 2011), beetles (Fournier and Loreau 2001; Gering et al. 2003), ants (Paknia and Pfeiffer 2011), and spiders (Cabra-García et al. 2010; Larrivée and Buddle 2010). Although the effects of spatial scales on arthropods have been extensively studied, there remain relatively few studies that focus on biome transitions.
Ecological patterns and processes in more temperate regions are known to differ from those in tropical regions (Algar et al. 2011), and it is reasonable to assume patterns and processes in Arctic regions, which have received little attention (but see Ernst and Buddle 2015; Hansen et al. 2016; Cameron and Buddle 2017), will also differ from other major biomes on the planet. Therefore, the objective of this research was to document Arctic biodiversity patterns across multiple geographical scales, from within-site (sample to sample) to regional scales (i.e., across all of northern Canada), using ground-dwelling spiders (Araneae) as a model taxon, and to determine the relative importance of environmental and spatial drivers underlying spatial patterns of diversity in northern Canada.
Arctic spiders are diverse, abundant, and easy to collect. They have microhabitat preferences that allow effective comparisons of biodiversity within and between habitats (Sikes et al. 2013; Hansen et al. 2016; Cameron and Buddle 2017). Spiders are also key ecological components of the Arctic food web as prey items for vertebrates (Meltofte et al. 2007; Bolduc et al. 2013) and predators of insects (Roslin et al. 2013; Wirta et al. 2015). At northern latitudes, two families, Lycosidae (wolf spiders) and Linyphiidae (sheetweb spiders), dominate spider abundance, yet sheetweb spiders also exhibit high species richness in the high Arctic (Høye and Forchhammer 2008; Rich et al. 2013; Cameron and Buddle 2017).
We addressed the following three research questions:
How do ground-dwelling spider species richness, abundance, composition, and structure vary at sample, site, and regional scales, in three major ecoclimatic regions in northern Canada?
Are patterns similar among the most dominant families?
What is the relative importance of environmental and spatial drivers underlying diversity patterns of spiders in northern Canada?

Materials and methods

Sampling design

This study was performed as part of the Northern Biodiversity Program, a collaborative research initiative created to document spatial and temporal arthropod diversity patterns in northern Canada (Ernst and Buddle 2013; Timms et al. 2013). This study was carried out in northern Canada at 12 sites encompassing three broad ecoclimatic regions: north boreal, subarctic, and arctic (see Ernst and Buddle 2015 for a map of study sites). We selected sites to maximize longitudinal and latitudinal coverage in each region, characterized by unique climate, soil type, and vegetation composition (Strong and Zoltai 1989). The hierarchical nested sampling design consisted of three spatial scales of diversity: sample (i.e., trap and grid), site, and regional (i.e., ecoclimatic region). In each ecoclimatic region, four sites were selected for sampling. At each site, we sampled ground-dwelling arthropods in mesic and wet natural open habitat (i.e., no canopy cover by trees) to capture a greater diversity of arthropods (Ernst et al. 2016). Mesic open sites were characterized by elevated topography and well-drained soils. The vegetation on mesic sites was a discontinuous cover of dwarf shrubs (e.g., willows (Salix spp.) and Labrador tea (Ledum spp.)) and perennial forbs like Dryas, saxifrages (Saxifraga spp.), or wood rush (Luzula spp.), with a layer of fructose lichen (Cladonia and Cladinas spp.). Open wet habitats were water saturated, with a continuous cover of moss (including sphagnum), saxifrages, and sedge-like cotton grass (Eriophorum spp.).
Each habitat (mesic and open wet) was sampled in three locations (grids) separated by at least 500 m for a total of six grids per site. Each grid consisted of 18 traps, with nine pitfall traps and nine yellow pan traps placed randomly, 15 m apart. We used pitfall traps because they collect ground-dwelling arthropods in a reliable and repeatable manner even at large spatial scales (Gotelli and Ellison 2002; Bowden and Buddle 2010b). The pitfall trap was a plastic circular container 10 cm in diameter, with an inner sampling cup (7 cm depth), covered by a square plastic corrugate to provide protection from rain. Each pan trap was bright yellow, 20 cm wide and 3 cm deep. All traps were sunk into the ground with the rim at the surface level. Propylene glycol diluted with water (2:1) was used as preservative with a small amount of surfactant to break surface tension. We emptied the traps approximately every four days. A total of 1296 traps (108 traps per site) were used over 30 degrees of latitude and 80 degrees of longitude across northern Canada. Each site was sampled for two weeks in 2010 or in 2011 during the peak of spider abundance (Table S1).
We identified all mature spiders, both males and females, to species or, in some cases where a species name could not be applied, to morphospecies (Dondale and Redner 1978; Dondale and Redner 1982; Dondale and Redner 1990; Platnick and Dondale 1992; Paquin and Dupérré 2003; Dondale et al. 2004). Nomenclature followed the Word Spider Catalog (2018), and voucher specimens were deposited at McGill’s Lyman Entomological Museum (Sainte-Anne-De-Bellevue, Québec, Canada). Data are available from the Dryad digital repository (Loboda and Buddle 2018).

Environmental variables

Vegetation

To test the influence of local factors on spatial patterns of diversity, variables related to vegetation and soil type were measured. In each grid, we measured maximum vegetation height and the depth of the active layer five times using a graduated metal rod, around randomly selected traps. Vegetation composition was visually assessed and a cover class was assigned to each category of vegetation: mosses, lichens, graminoids, forbs, and shrubs (see Table S1).

Climate

We extracted six climatic variables from the Canadian national climate data and information archive (climate.weatheroffice.gc.ca) from the weather station closest to each site. The average distance between the site and the weather station was <15 km, with the exception of the northern site, Hazen Lake, which is about 300 km away from the closest weather station. The variables selected were: mean annual temperature, maximum temperature of the warmest month, minimum temperature of the coldest month, annual precipitation, and accumulated degree days above zero and below zero. Latitude and longitude were the spatial drivers used (see Table S1).

Statistical analyses

Mature specimens were identified and pooled by trap for the two-week sampling period for each site. To calculate the completeness of the inventories, we estimated the absolute species richness in each ecoclimatic region using the nonparametric estimators Jackknife 1 and Chao 1. Completeness values were derived from the ratio between the observed and Jackknife 1 estimated richness. Individual-based rarefaction curves were used to compare the observed and estimated richness for each ecoclimatic region (Gotelli and Ellison 2002; Buddle et al. 2005).
We used ordination methods to analyze the assemblage composition. Prior to ordination analysis, singletons were removed to better detect overall composition similarities and to remove the potential effect of differential sampling effort between sites. Moreover, species abundance was standardized as the number of individuals caught per day per sampling period. We performed a non-metric multidimensional scaling ordination (NMDS) with two dimensions based on Bray–Curtis distance to determine species composition similarities where each point is a composition within a grid to visualize patterns at site and regional scales. NMDS was conducted using the metaMDS function in the vegan software package, which uses several random starting configurations to select a solution with low stress (Oksanen et al. 2016).
We used the Partition 3.0 software (Veech and Crist 2009) to additively decompose the total diversity of spiders into local diversity (the average diversity within (α1) and among (β1) traps and the diversity among grids (β2)), regional diversity (average diversity among sites (β3)) and northern diversity (average diversity among ecoclimatic regions (β4)). Partitioning diversity can be summarized as:
γ(total)=α1(trap)+β1(trap)+β2(grid)+β3(site)+β4(ecoclimatic region)
For each level, observed α and β diversities were compared with predicted α and β diversities obtained with a random distribution generated using 10 000 randomizations (Crist et al. 2003). We evaluated differences in diversity partitioning between regions by doing the analyses separately for each region.
We used variance partitioning to determine the relative influence of multiple complementary sets of environmental factors on spider composition (Peres-Neto et al. 2006). Three explanatory matrices with vegetation, climate, and spatial variables were tested. The effect of one matrix independent of the influence of others (marginal effect) and the conditional variation explained by the combined effect of several matrices were calculated. The species matrix was then transformed to the Hellinger distance, the most suitable transformation because of the high environmental heterogeneity between sites, reflected in the species matrix by a high proportion of zeros (Legendre and Gallagher 2001). A direct gradient analysis (redundancy analysis (RDA)) was performed on all data as well as separately for each region to determine which variables best explain the variation in spider composition. We used the permutation forward selection procedure to reduce the number of explanatory variables for the spider species matrix. We retained significant variables with a cumulative R2 adjusted below the R2 adjusted obtained with all variables. Monte Carlo tests with 10 000 permutations were used to determine the significance of axes of the RDA. Statistical analyses, other than additive partitioning, were done using the R software (R Core Team 2018).

Results

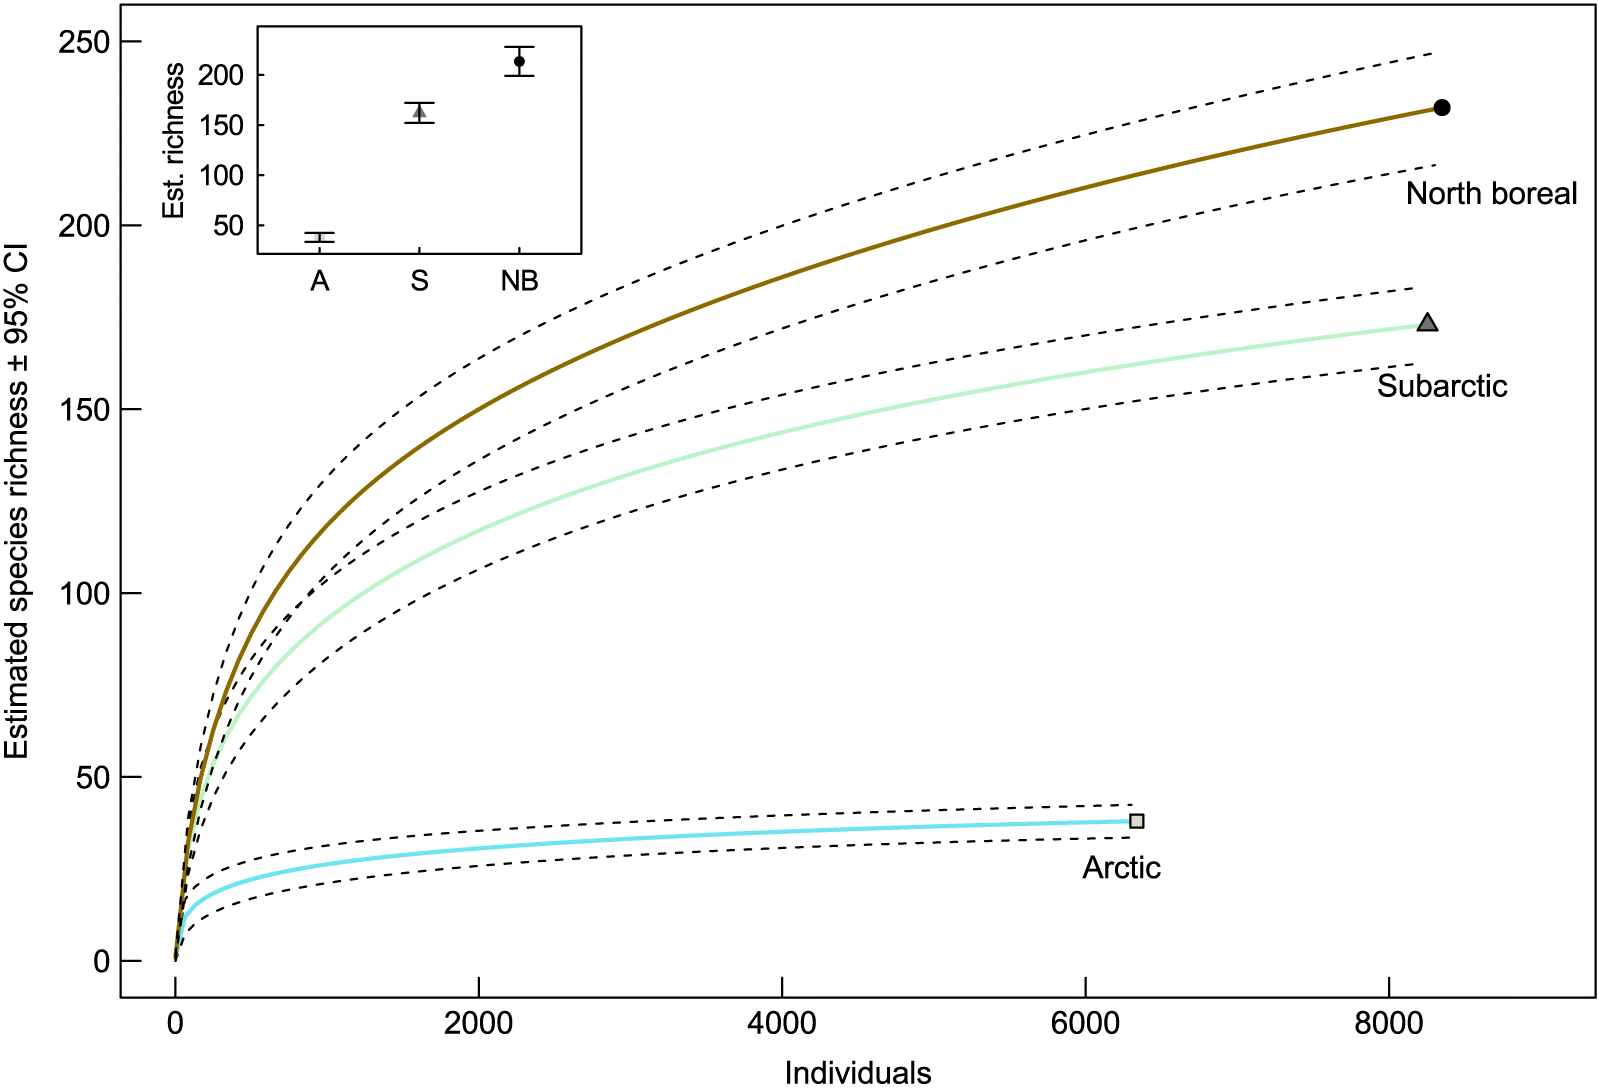
A total of 28 427 spider specimens representing 14 families was collected (Table 1); of these, 23 010 adult spiders (28% female and 72% male) were identified to species. Total species richness (γ diversity) was 305 species, with 107 (35%) spider species representing new provincial or territorial records (Table S2). In total, 68 species were singletons and 27 were doubletons, which represent respectively 22% and 9% of the total diversity. Fewer spider species were collected in the arctic (35 species) compared with the subarctic (173 species) and north boreal (232 species) ecoclimatic regions. Eight species of spiders were present in all three ecoclimatic regions (Table S2). Of the species present in the arctic, 65% were shared with another region compared with 73% in the subarctic and 46% in the north boreal ecoclimatic regions. Species rarefaction curves revealed that the arctic and subarctic ecoclimatic regions were better sampled than the north boreal region (Fig. 1). The completeness of the collection varied between 69% and 100% within site, with lower values in the north boreal region (Table 1).
Table 1.
Table 1. Observed and estimated total species richness (Chao 1 and Jackknife 1 ± confidence interval) of ground-dwelling spiders (Araneae) per site in the three ecoclimatic regions.
 ArcticSubarcticNorth boreal 
 HazenIqaluitCambridge BayBanks IslandChurchillScheffervilleTombstoneKugluktukGoose BayMoosoneeYellowknifeNorman WellsTotal
Observed total richness82222177410952358198104132305
Jackknife 18 ± 031 ± 327 ± 220 ± 2105 ± 6146 ± 775 ± 641 ± 3117 ± 7139 ± 9132 ± 6173 ± 7
Chao 18 ± 034 ± 1028 ± 819 ± 3127 ± 27152 ± 19119 ± 4441 ± 7174 ± 48191 ± 44129 ± 12181 ± 21
Completeness (%)1007482857116708569718076
Number of singletons055325292063438233968
Number of genera81617134349292251555866111
Number of families4452812861414121314
Number of mature individuals1088383350913832479212313542326155622252310227423010
% of immature individuals48671026191320131513131419
Number of active trapping days912121212910109101110126

Note: Completeness = (observed species richness)/(Jackknife 1) × 100.

Fig. 1.
Fig. 1. Individual-based rarefaction curves of ground-dwelling spider assemblages in three ecoclimatic regions (arctic, subarctic, and north boreal), in northern Canada. Solid lines indicate mean species richness and dashed lines indicate the 95% confidence intervals (95% CI) of the mean. Box plots show the estimated richness ±95% CI for each region for 6337 individuals.

Multi-scale patterns of spider diversity

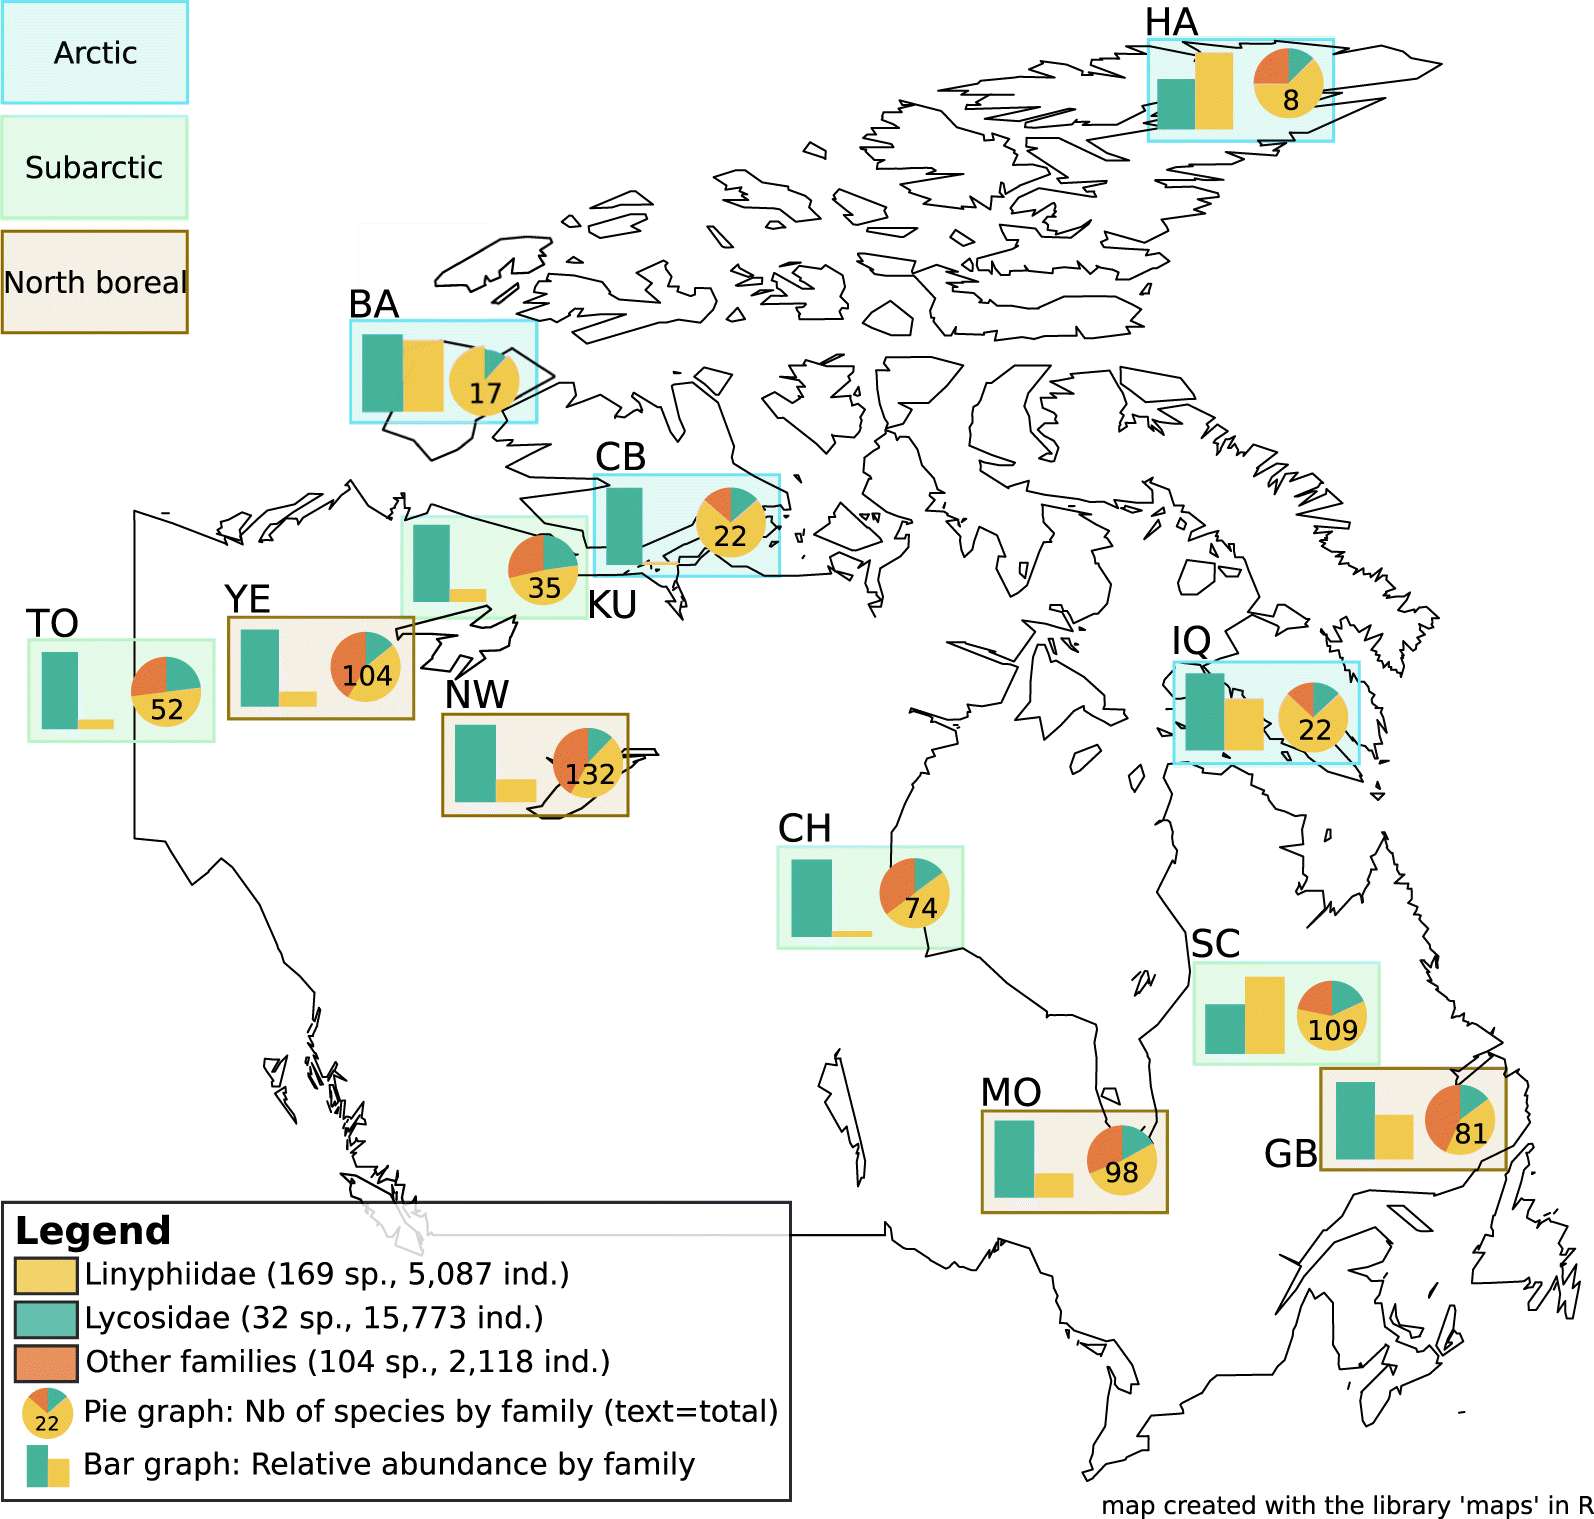
At similar latitudes, species richness was generally higher in western Canada (west of the 96° meridian) than eastern Canada (east of the 96° meridian). For example, the Norman Wells site (NW) in western Canada had a species richness of 132 at 65° latitude, whereas Iqaluit (IQ) at 62° latitude in eastern Canada had a richness of only 22 species (Fig. 2). With 169 species (55% of the total species richness), the Linyphiidae family was the most diverse family of spiders collected (Fig. 3). The most abundant family was the Lycosidae, with 15 778 individuals and 32 species, representing 67% of the total abundance (Fig. 2). The proportion of the total diversity (pie charts) and total abundance (bar charts) represented by Linyphiidae species increased from north boreal sites to arctic sites (Fig. 2).
Fig. 2.
Fig. 2. Abundance and diversity of ground-dwelling spider families in twelve sites of three ecoclimatic regions sampled in 2010 and 2011 as part of the Northern Biodiversity Program. For each site, the total number of species, a pie graph of the diversity by family, and a bar graph with the relative abundance of the two most common families of spiders (Lycosidae and Linyphiidae) are shown. Sites: HA, Hazen Lake, Nunavut; IQ, Iqaluit, Nunavut; CB, Cambridge Bay, Nunavut; BA, Banks Island, Nunavut; CH, Churchill, Manitoba; SC, Schefferville, Quebec; TO, Tombstone mountains, Yukon Territory; KU, Kugluktuk, Nunavut; GB, Goose Bay, Labrador; MO, Moosonee, Ontario; YE, Yellowknife, Northwest Territories; and NW, Norman Wells, Northwest Territories.
Fig. 3.
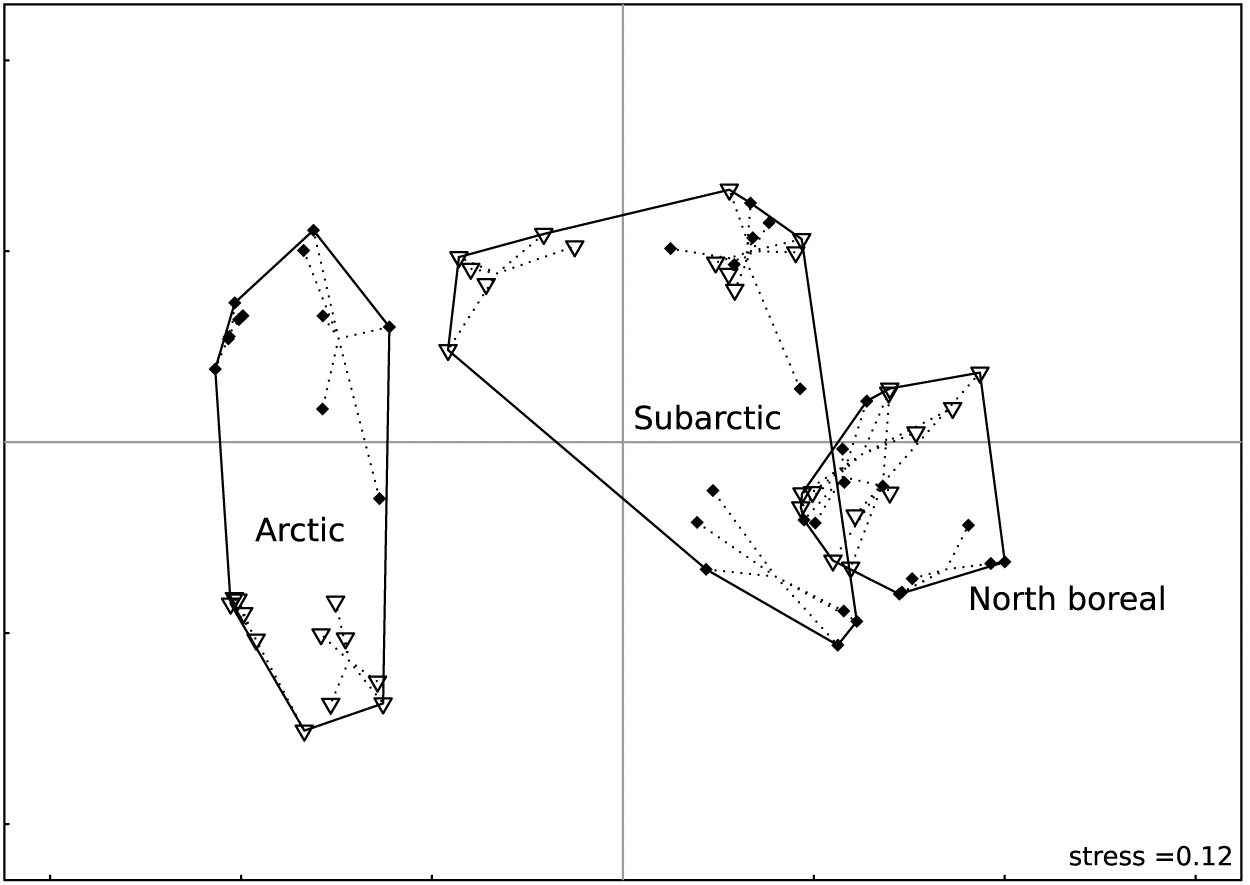
Fig. 3. Non-metric multidimensional scaling (NMDS) ordination of spider species composition of 72 grids, described by the relative abundance of 306 spider species. The ellipses depict the ecoclimatic regions.
Ecoclimatic regions showed clear differences in species composition (Fig. 3). Variation in composition between sites was higher in the arctic than in the subarctic or north boreal ecoclimatic regions (Fig. 3).
Diversity partitioning results showed that spider diversity was structured (i.e., non-random) at the regional, site, and sample scales with lower diversity than expected by chance at lower scales and higher observed diversity at larger spatial scales (Table 2). The observed values of β4 and β3 were significantly higher than expected with a random distribution (Table 2). The ecoclimatic region was the most important spatial scale in structuring diversity; β4 contributed to 50% of the total diversity of γ diversity meaning that half of the species are restricted to one ecoclimatic region. The site scale was the second most important spatial scale with β3 contributing to 30% of the total richness. Additive partitioning of diversity within each ecoclimatic region did not show differences between regions. β3 contributed to almost half of the diversity within each region (Table 2).
Table 2.
Table 2. The additive partitioning of total spider community γ diversity into α and β components at five nested spatial scales, with each component expressing their relative contributions (% observed) to total diversity.
 All regions (γ = 306)Arctic (γ = 35)Subarctic (γ = 173)North boreal (γ = 232)
 ObservedExpectedObserved vs. expected comparison% ObservedObservedExpectedObserved vs. expected comparison% ObservedObservedExpectedObserved vs. expected comparison% ObservedObservedExpectedObserved vs. expected comparison% Observed
α (within traps)5.5211.54<1.773.568.21<10.176.9113.47<3.999.2015.42<3.96
β1 (among traps)19.5559.28<6.595.9111.08<16.8922.150.04<12.7735.4564.92<15.28
β2 (among replicates)33.1885.84<11.927.089.03<20.2339.8355.64<23.0261.6972.39<26.59
β3 (among sites)84.4282.34>27.0618.456.68>52.71104.1653.86>60.21125.6679.26>54.16
β4 (among regions)163.3373>52.67

Note: The observed partitions are compared with the expected values as predicted by the null model based on 999 iterations using individual-based randomization. Observed < expected with p < 0.0001; observed > expected with p < 0.0001.

Environmental and spatial drivers of diversity patterns

The three explanatory matrices (vegetation, climate, and spatial variables) explained 59.6% of the total variation in spider composition at the regional scale. The vegetation matrix based on local measures explained 38.1% of variation in ground-dwelling spider diversity compared with 35.2% for the climate matrix. Latitude was not an important driver and the two spatial variables explained only 17.1% of the variation in diversity at a large spatial scale. Variance partitioning within each region showed similar results in different proportions. The effects of vegetation explained 61% and 46% of the variance in the arctic and north boreal ecoclimatic regions, respectively.
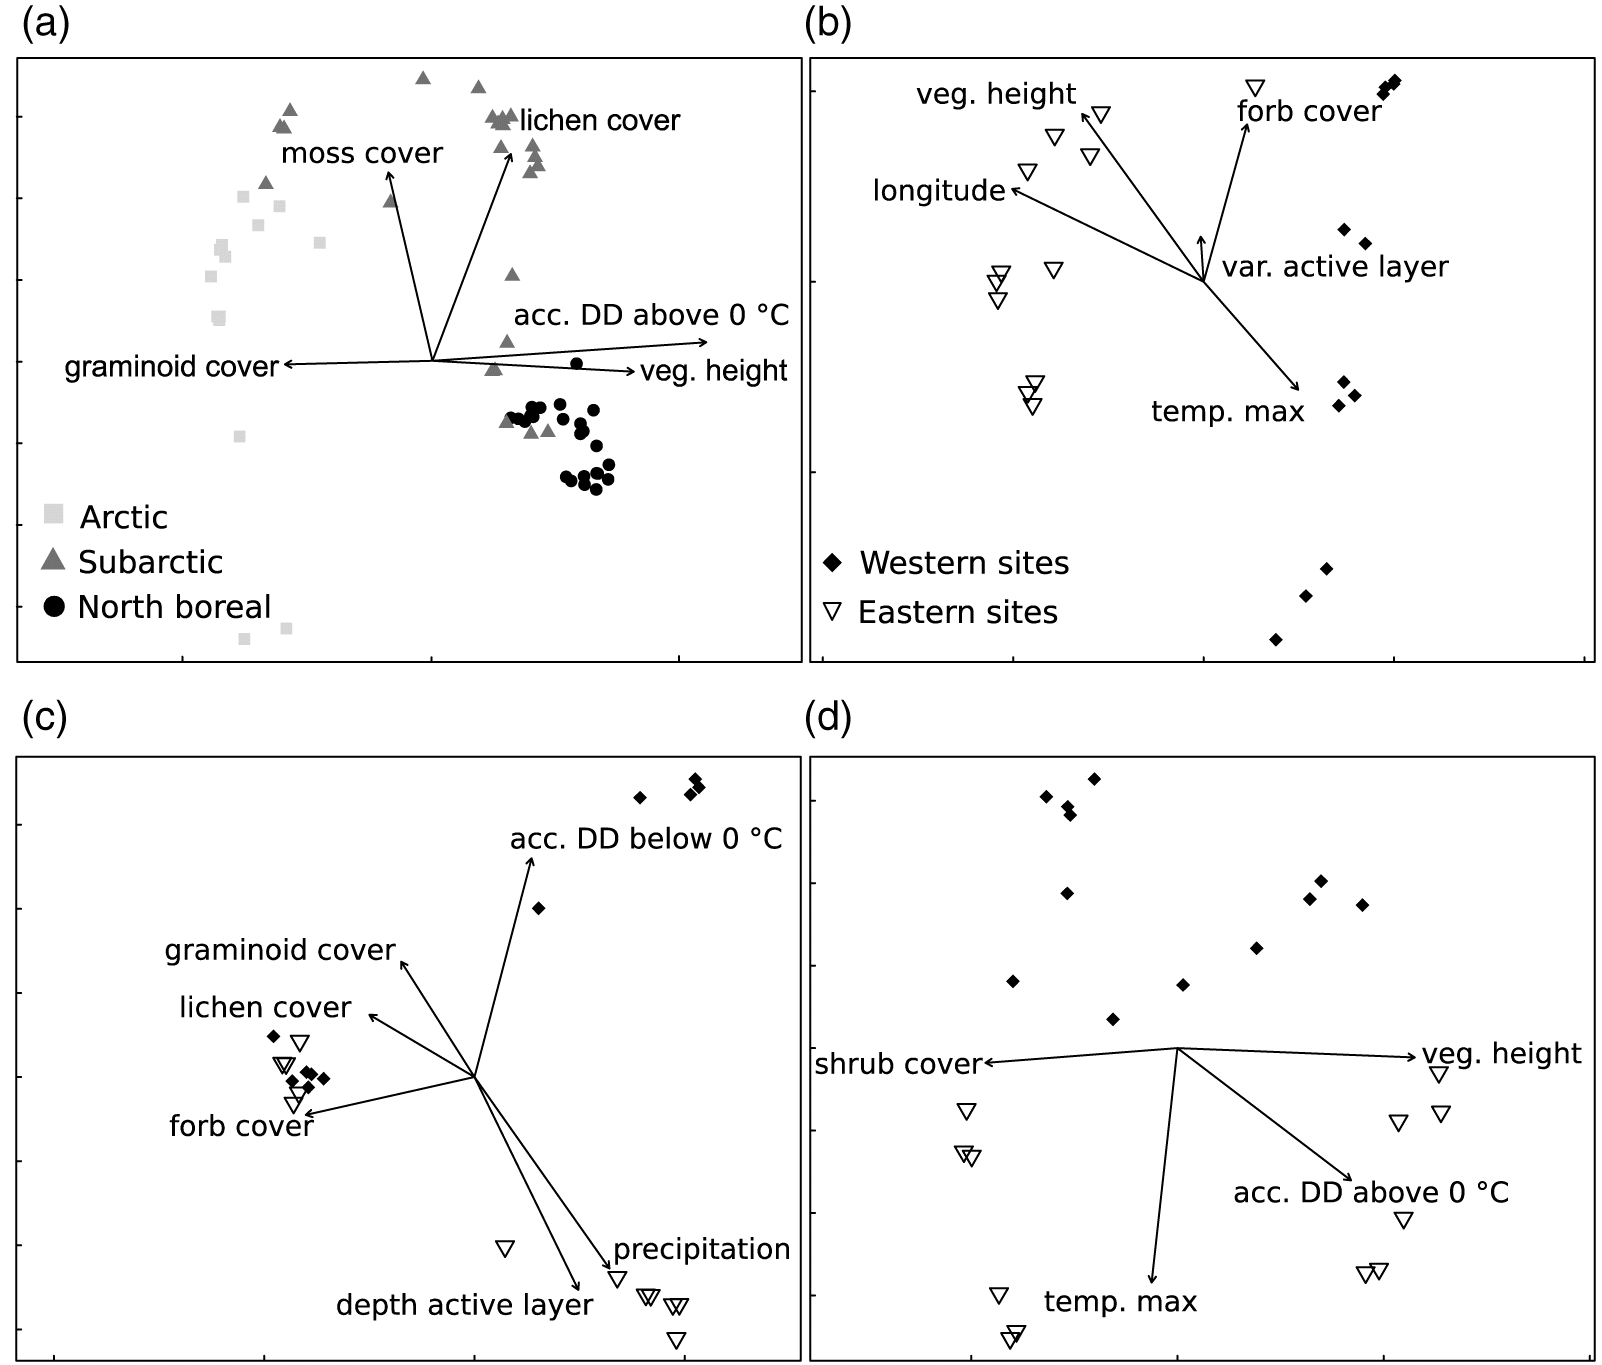
The constrained ordination was performed using all variables, as no variable was discarded by the permutation selection (Fig. 4a). The first canonical axis explained 16% of the total variance of spider composition, and the first two canonical axes combined explained 26.7% of the variance. The significant variables selected to find parsimonious models were different within each ecoclimatic region (Figs. 4b, 4c, and 4d). Variables selected in each region were a mix of several local variables and one or two climatic variables, with the exception of the arctic ecoclimatic region where longitude was also significant. For the arctic and the north boreal ecoclimatic regions, maximum temperature of the warmest month seemed to influence differences between the eastern and western sites (Figs. 4b and 4d). The first two canonical axes explained 62% of the variance in the arctic (Fig. 4b), 52% in the subarctic (Fig. 4c) and 50% in the north boreal ecoclimatic regions (Fig. 4d).
Fig. 4.
Fig. 4. Redundancy analysis (RDA) biplot of the Hellinger-transformed spider data constrained by environmental variables, scaling 2, for the (a) entire community, (b) the arctic ecoclimatic region, (c) the subarctic ecoclimatic region, and (d) the north boreal ecoclimatic region. The environmental variables selected by the forward selection are shown. veg. height, maximum vegetation height; var. active layer, standard deviation of the active layer’s depth; temp. max, maximum temperature of the warmest month of the site; acc. DD above 0 °C, degree days above zero at the site; acc. DD below 0 °C, degree day below zero at the site; precipitation = annual precipitation.

Discussion

The objective of this research was to quantify the diversity and community structure of Arctic spiders occurring from local to broad spatial scales in northern Canada, and to examine factors determining Arctic species distribution. Our study represents one of the largest standardized biodiversity studies of spiders across large geographical scales, spanning 80 degrees longitude and 30 degrees latitude. This research increased our understanding of the distribution of more than 300 spider species, a dominant arthropod taxon in Arctic ecosystems, including over 100 new provincial and territorial records. Considering the high number of new records, it is clear that baseline data on spider species distribution in Canada are incomplete. Our extensive quantitative dataset will be a benchmark for spider species distribution in northern Canada as it has already facilitated the identification of the conservation status of Canadian spider species (Canadian Endangered Species Conservation Council 2016).
One third of the spider species found in the Arctic were unique to that ecoclimatic region, but we noted great differences in composition among sites within the arctic ecoclimatic region. The unique geography of the Canadian Arctic archipelago combined with harsh climatic conditions may explain the high variation in composition between sites that were on different islands of the archipelago (Chernov 1995). These results suggest that at least some Arctic spider species have narrow geographic ranges in Canada, an attribute that might make them more at risk in a context of climate warming (CAFF 2013; IPCC 2013). However, the biogeography of the Canadian Arctic archipelago is far from being well understood even though it is the largest archipelago on Earth, with more than 36 000 islands. The study of diversity patterns within and between islands of the archipelago is necessary to complete our understanding of the respective effects of insularity, climate, and geography on biodiversity patterns in the Canadian Arctic. This might be achieved more easily than previously thought, as our results highlight how arthropod sampling in the Arctic, even over a short period of time such as two weeks, could lead to useful information on species diversity.
Despite sampling eastern sites and western sites in different years, the longitudinal pattern observed across Canada was in line with the patterns found for birds, plants, butterflies, and other insect groups in Canada (Danks 1993; Chernov 1995; Callaghan et al. 2004). This peculiar spatial pattern may be best explained by post-glacial migration from different refugia in northern Canada. Western species probably originated from the Beringian refugium or other cryptic western refugia, whereas species in eastern Canada may have originated from southern refugia after the Wisconsin glaciation (e.g., Waltari et al. 2004; Solecki et al. 2016). Moreover, some observed community dissimilarities might result from large-scale obstacles to spider dispersal. For instance, the assemblage composition in Kugluktuk was more similar to that in Churchill, which is nearly 1500 km away, than that in Tombstone Mountains, which is 1000 km away. The presence of natural biogeographic barriers like the sea of Hudson Bay (Danks 1993) plays an important role in limiting organism dispersion in Canada.
Species richness and evenness at local scales were lower than expected by chance. This suggests that biotic and abiotic factors are more important than stochastic factors in determining the richness of spiders locally. A low local turnover can be explained by the presence of biotic interactions (Wisz et al. 2013). For example, burrowing spiders in sand dunes showed reduced species density and diversity locally due to competition, and this effect was scale dependent (Birkhofer et al. 2006). Given that the Lycosidae egg sac parasitism is surprisingly high in some subarctic populations (Bowden and Buddle 2012), biotic interactions may play a greater role in structuring local diversity in the Arctic than expected. This might be explained by the important biomass of predators compared with herbivores or detritivores in the Arctic (Ernst and Buddle 2015). Experiments on spider parasitism, cannibalism (see Asmus 2017 for example), and competition will help to unravel some of the biotic interactions that have largely been forsaken in the recent literature on Arctic food webs based on molecular data (Roslin et al. 2013; Wirta et al. 2015).
Spider diversity was structured among ecoclimatic regions, characterized by unique climate, soil type, and vegetation composition (Strong and Zoltai 1989). Vegetation composition, but not climate variables, best explained variation in the diversity of spiders at a broad scale, as previously observed in other northern systems (e.g., Bowden and Buddle 2010a; Rich et al. 2013) and in other more temperate habitats at regional or local scales (e.g., Jimenez Valverde and Lobo 2007; Jimenez Valverde et al. 2010; Carvalho et al. 2011). This result may be partly due to the distance between sampling sites and weather station, which was, in one case, greater than 300 km. However, because terrestrial arthropods have strong microhabitat preferences, the strength of correlation between ground-dwelling spider diversity and climate variables may have been clearer if microclimate data were available (Suggitt et al. 2011). To better understand the drivers of arthropod species distribution, it is, therefore, essential to measure environmental factors, both abiotic and biotic, locally even when examining diversity patterns at large spatial scales.
High beta diversity richness values at broad spatial levels are consistent with other studies of forest beetles (Gering et al. 2003) and forest spiders (Larrivée and Buddle 2010). This result suggests that large-scale processes influence spider richness in northern Canada. However, unlike past work on spiders from Europe and Australia (Finch et al. 2008; Kumschick et al. 2009; Whitehouse et al. 2009), we found that latitude was a poor predictor of diversity patterns in Canada. The longitudinal extent of this study and Canada’s geography may partly explain this result. Isotherms bend northward toward the west in Canada, so that habitats in the Yukon Territory have milder climates than eastern habitats at equivalent latitudes (Danks 1993).
The relative abundance and relative richness of a dominant family of spiders showed strong spatial gradients. The relative number of Linyphiidae species increased toward the Arctic, a trend that has previously been found in Europe (Koponen 1993). However, our results are the first direct evidence of such a pattern in North America. Linyphiidae are relatively well known taxonomically in the Arctic, with 18% of total linyphiid described species in the world found north of 60° (Marusik and Koponen 2002). Their overall relative abundance is, however, low compared with the Lycosidae, which represented more than 60% of the total assemblage abundance, on average, with only 10% of total richness. We encourage the use of spiders to further study abundance and diversity patterns in space and time across the Canadian Arctic archipelago. Finally, studies of species food webs in the Arctic may help resolve how biotic interactions affect the range distributions of Arctic species.
Acknowledgements

The primary funding for this study came from a Strategic Project Grant from the Natural Sciences and Engineering Research Council of Canada (NSERC) awarded to C.M. Buddle and T. Wheeler (McGill University) and D.C. Currie (University of Toronto) for a project entitled “Ecological Structure of Northern Arthropods: Adaptation to a Changing Environment”. Logistical support was provided by the Polar Continental Shelf Program. We thank Doug Currie and the late Terry Wheeler, principal investigators of the Northern Biodiversity Program (NBP) and NBP members for collecting arthropods. We thank K. Sim, J. Bowden, D. Buckle, and S. Sylverman who helped with identification of spiders or specimen processing. We thank Parks Canada and provincial and territorial governments who provided permits to collect specimens.

References

Algar AC, Kerr JT, and Currie DJ. 2011. Quantifying the importance of regional and local filters for community trait structure in tropical and temperate zones. Ecology, 92(4): 903–914.
Asmus AL. 2017. Arthropod food webs in Arctic tundra: trophic interactions and responses to global change. Ph.D. thesis, The University of Texas at Arlington.
Beck J, Holloway JD, Khen CV, and Kitching IJ. 2012. Diversity partitioning confirms the importance of beta components in tropical rainforest Lepidoptera. The American Naturalist, 180(3): E64–E74.
Birkhofer K, Henschel JR, and Scheu S. 2006. Spatial-pattern analysis in a territorial spider: evidence for multi-scale effects. Ecography, 29(5): 641–648.
Bolduc E, Casajus N, Legagneux P, McKinnon L, Gilchrist HG, Leung M, et al. 2013. Terrestrial arthropod abundance and phenology in the Canadian Arctic: modelling resource availability for Arctic-nesting insectivorous birds. The Canadian Entomologist, 145(2): 155–170.
Bowden JJ, and Buddle CM. 2010a. Determinants of ground-dwelling spider assemblages at a regional scale in the Yukon Territory, Canada. Ecoscience, 17(3): 287–297.
Bowden JJ, and Buddle CM. 2010b. Spider assemblages across elevational and latitudinal gradients in the Yukon Territory, Canada. Arctic, 63(3): 261–272.
Bowden JJ, and Buddle CM. 2012. Egg sac parasitism of Arctic wolf spiders (Araneae: Lycosidae) from northwestern North America. Journal of Arachnology, 40(3): 348–350.
Buddle CM, Beguin J, Bolduc E, Mercado A, Sackett TE, Selby RD, et al. 2005. The importance and use of taxon sampling curves for comparative biodiversity research with forest arthropod assemblages. The Canadian Entomologist, 137(1): 120–127.
Cabra-García J, Chacón P, and Valderrama-Ardila C. 2010. Additive partitioning of spider diversity in a fragmented tropical dry forest (Valle del Cauca, Colombia). Journal of Arachnology, 38(2): 192–205.
CAFF. 2013. Arctic biodiversity assessment. In Status and trends in Arctic biodiversity. Edited by H Meltofte. Conservation of Arctic flora and fauna, Akureyri, Iceland.
Callaghan T, Björn L, Chernov Y, Chapin T, Christensen T, Huntley B, et al. 2004. Biodiversity, distributions and adaptations of Arctic species in the context of environmental change. Ambio, 33(7): 404–417.
Cameron ER, and Buddle CM. 2017. Seasonal change and microhabitat association of Arctic spider assemblages (Arachnida: Araneae) on Victoria Island (Nunavut, Canada). The Canadian Entomologist, 149(3): 357–371.
Canadian Endangered Species Conservation Council. 2016. Wild Species 2015: the general status of species in Canada. National General Status Working Group. Canadian Wildlife Service, Environment Canada, Ottawa, Ontario. 128 p.
Carvalho J, Cardoso P, Crespo LC, Henriques S, Carvalho R, and Gomes P. 2011. Determinants of beta diversity of spiders in coastal dunes along a gradient of mediterraneity. Diversity and Distribution, 17(2): 225–234.
Chernov YI. 1995. Diversity of the Arctic terrestrial fauna. In Arctic and alpine biodiversity: patterns, causes and ecosystem consequences. Ecological Studies, Vol. 113. Edited by FS Chapin III and C Körner. Springer Berlin Heidelberg. pp. 81–95.
Crist TO, Veech JA, Jon CG, and Summerville KS. 2003. Partitioning species diversity across landscapes and regions: a hierarchical analysis of α, β, and γ diversity. The American Naturalist, 162(6): 734–743.
Danks HV. 1993. Patterns of diversity in the Canadian insect fauna. Memoirs of the Entomological Society of Canada, 125: 51–74.
Dondale CD, and Redner JH. 1978. The crab spiders of Canada and Alaska: Araneae: Philodromidae and Thomisidae. Insects and Arachnids of Canada Handbook Series, Part 5. Government of Canada, Ottawa, Ontario. 255 p.
Dondale CD, and Redner JH. 1982. The sac spiders of Canada and Alaska: Araneae: Clubionidae and Anyphaenidae. Insects and Arachnids of Canada Handbook Series, Part 9. Government of Canada, Ottawa, Ontario. 194 p.
Dondale CD, and Redner JH. 1990. The wolf spiders, nurseryweb spiders, and lynx spiders of Canada and Alaska: Araneae: Lycosidae, Pisauridae, and Oxyopidae. Insects and Arachnids of Canada Handbook Series, Part 17. Government of Canada, Ottawa, Ontario. 383 p.
Dondale CD, Redner JH, Paquin P, and Levi HW. 2004. The orb-weaving spiders of Canada and Alaska: Araneae: Uloboridae, Tetragnathidae, Araneidae, Theridiosomatidae. Insects and Arachnids of Canada Handbook Series, Part 23. NRC Research Press, Ottawa, Ontario. 371 p.
Ernst CM, and Buddle CM. 2013. Seasonal patterns in the structure of epigeic beetle (Coleoptera) assemblages in two subarctic habitats in Nunavut, Canada. The Canadian Entomologist, 145(2): 171–183.
Ernst CM, and Buddle CM. 2015. Drivers and patterns of ground-dwelling beetle biodiversity across northern Canada. PLoS ONE, 10(4): e0122163.
Ernst CM, Loboda S, and Buddle CM. 2016. Capturing northern biodiversity: diversity of arctic, subarctic and north boreal beetles and spiders are affected by trap type and habitat. Insect Conservation and Diversity, 9(1): 63–73.
Finch O-D, Blick T, and Schuldt A. 2008. Macroecological patterns of spider species richness across Europe. Biodiversity and Conservation, 17(12): 2849–2868.
Fournier E, and Loreau M. 2001. Respective roles of recent hedges and forest patch remnants in the maintenance of ground-beetle (Coleoptera: Carabidae) diversity in an agricultural landscape. Landscape Ecology, 16(1): 17–32.
Gering J, Crist T, and Veech J. 2003. Additive partitioning of species diversity across multiple spatial scales: implications for regional conservation of biodiversity. Conservation Biology, 17(2): 488–499.
Gotelli NJ, and Ellison AM. 2002. Biogeography at a regional scale: determinants of ant species density in New England bogs and forests. Ecology, 83: 1604–1609.
Hansen RR, Hansen OLP, Bowden JJ, Treier UA, Normand S, and Høye TT. 2016. Meter scale variation in shrub dominance and soil moisture structure Arctic arthropod communities. PeerJ, 4: e2224.
Høye TT, and Forchhammer MC. 2008. Phenology of high-Arctic arthropods: effects of climate on spatial, seasonal, and inter-annual variation. Advances in Ecological Research, 40: 299–324.
IPCC. 2013. Climate change 2013: the physical science basis. In Contribution of working group I to the fifth assessment report of the intergovernmental panel on climate change. Edited by TF Stocker, D Qin, G-K Plattner, M Tignor, SK Allen, J Boschung, A Nauels, Y Xia, V Bex, and PM Midgley. Cambridge University Press, Cambridge, UK and New York City, New York. 1535 p.
Jimenez Valverde A, and Lobo J. 2007. Determinants of local spider (Araneidae and Thomisidae) species richness on a regional scale: climate and altitude vs. habitat structure. Ecological Entomology, 32(1): 113–122.
Jiménez-Valverde A, Baselga A, Melic A, and Txasko N. 2010. Climate and regional beta-diversity gradients in spiders: dispersal capacity has nothing to say? Insect Conservation and Diversity, 3(1): 51–60.
Koponen S. 1993. On the biogeography and faunistics of European spiders: latitude, altitude and insularity. Bulletin de la société Neuchâteloise des sciences naturelles, 116: 141–152.
Kumschick S, Schmidt-Entling MH, Bacher S, Hickler T, Entling W, and Nentwig W. 2009. Water limitation prevails over energy in European diversity gradients of sheetweb spiders (Araneae: Linyphiidae). Basic and Applied Ecology, 10(8): 754–762.
Larrivée M, and Buddle CM. 2010. Scale dependence of tree trunk spider diversity patterns in vertical and horizontal space. Ecoscience, 17(4): 400–410.
Legendre P, and Gallagher ED. 2001. Ecologically meaningful transformations for ordination of species data. Oecologia, 129(2): 271–280.
Lévesque-Beaudin V, and Wheeler TA. 2011. Spatial scale and nested patterns of beta-diversity in temperate forest Diptera. Insect Conservation and Diversity, 4(4): 284–296.
Loboda S, and Buddle CM. 2018. Data from: Small to large scale patterns of ground-dwelling spider (Araneae) diversity across northern Canada. Dryad Digital Repository.
Marusik YM, and Koponen S. 2002. Diversity of spiders in boreal and arctic zones. Journal of Arachnology, 30: 205–210.
Marques T, and Schoereder JH. 2014. Ant diversity partitioning across spatial scales: ecological processes and implications for conserving tropical dry forests. Austral Ecology, 39: 72–82.
Meltofte H, Høye TT, Schmidt NM, and Forchhammer MC. 2007. Differences in food abundance cause inter-annual variation in the breeding phenology of High Arctic waders. Polar Biology, 30: 601–606.
Oksanen J, Blanchet G, Friendly M, Kindt R, Legendre P, McGlinn D, et al. 2016. Vegan: community ecology package. R package version 2.4-1. [online]: Available from CRAN.R-project.org/package=vegan.
Paknia O, and Pfeiffer M. 2011. Hierarchical partitioning of ant diversity: implications for conservation of biogeographical diversity in arid and semi-arid areas. Diversity and Distributions, 17(1): 122–131.
Paquin P, and Dupérré N. 2003. Guide d’identification des araignées (Araneae) du Québec. Fabreries, Supplément 11. Association des entomologistes amateurs du Québec, Varennes, Québec. 251 p.
Peres-Neto PR, Legendre P, Dray S, and Borcard D. 2006. Variation partitioning of species data matrices: estimation and comparison of fractions. Ecology, 87(10): 2614–2625.
Platnick NI, and Dondale CD. 1992. The insects and arachnids of Canada, Part 19: the ground spiders of Alaska and Canada (Araneae: Gnaphosidae). Centre for Land and Biological Resources, Research Branch, Ottawa, Ontario.
R Core Team. 2018. R: a language and environment for statistical computing. R Core Team, Vienna, Austria [online]: Available from r-project.org/.
Rich ME, Gough L, and Boelman NT. 2013. Arctic arthropod assemblages in habitats of differing shrub dominance. Ecography, 36(9): 994–1003.
Roslin T, Wirta H, Hopkins T, Hardwick B, and Várkonyi G. 2013. Indirect interactions in the High Arctic. PLoS ONE, 8: e67367.
Sikes DS, Draney ML, and Fleshman B. 2013. Unexpectedly high among-habitat spider (Araneae) faunal diversity from the Arctic Long-Term Experimental Research (LTER) field station at Toolik Lake, Alaska, United States of America. The Canadian Entomologist, 145(2): 219–226.
Solecki AM, Buddle CM, and Wheeler TA. 2016. Distribution and community structure of chloropid flies (Diptera: Chloropidae) in Nearctic glacial and post-glacial grasslands. Insect Conservation and Diversity, 9(4): 358–368.
Strong W, and Zoltai SC. 1989. Ecoclimatic regions of Canada: first approximation. Ecological land classification series, no. 23. Sustainable Development Branch, Canadian Wildlife Service, Ottawa, Ontario.
Suggitt AJ, Gilingham PK, Hill JK, Huntley B, Kunin WE, Roy DB, et al. 2011. Habitat microclimates drive fine-scale variation in extreme temperatures. Oikos, 120(1): 1–8.
Summerville KS, Crist TO, Kahn JK, and Gering JC. 2003. Community structure of arboreal caterpillars within and among four tree species of the eastern deciduous forest. Ecological Entomology, 28(6): 747–757.
Timms LL, Bennett AM, Buddle CM, and Wheeler TA. 2013. Assessing five decades of change in a high Arctic parasitoid community. Ecography, 36(11): 1227–1235.
Veech J, and Crist T. 2009. PARTITION: software for hierarchical partitioning of species diversity, version 3.0 [online]: Available from users.miamioh.edu/cristto/partition.html.
Waltari E, Demboski JR, Klien DR, and Cook JA. 2004. A molecular perspective on the historical biogeography of the northern high latitudes. Journal of Mammalogy, 85(4): 591–600.
Whitehouse MEA, Hardwick S, Scholz BCG, Annells AJ, Ward A, Grundy PR, et al. 2009. Evidence of a latitudinal gradient in spider diversity in Australian cotton. Austral Ecology, 34: 10–23.
Wirta HK, Vesterinen EJ, Hamback PA, Weingartner E, Rasmussen C, Reneerkens J, et al. 2015. Exposing the structure of an Arctic food web. Ecology and Evolution, 5(17): 3842–3856.
Wisz MS, Pottier J, Kissling WD, Pelissier L, Lenoir J, Damgaard CF, et al. 2013. The role of biotic interactions in shaping distributions and realised assemblages of species: implications for species distribution modelling. Biological Reviews of the Cambridge Philosophical Society, 88(1): 15–30.
Word Spider Catalog. 2018. Word spider catalog. Version 19.0. Natural History Museum Bern, Bern, Switzerland.

Supplementary Materials

Supplementary Material 1 (PDF / 589 KB)
Supplementary Material 2 (PDF / 700 KB)

Information & Authors

Information

Published In

cover image FACETS
FACETS
Volume 3Number 1October 2018
Pages: 880 - 895
Editor: Peter G. Kevan

History

Received: 21 February 2018
Accepted: 11 June 2018
Version of record online: 20 September 2018
Corrected: 8 October 2018

Data Availability Statement

All relevant data are within the paper, the Supplementary Material, and the Dryad digital repository (https://doi.org/10.5061/dryad.t3n7883).

Key Words

  1. arctic
  2. Arthropoda
  3. biodiversity
  4. patterns
  5. spatial scale
  6. spiders

Sections

Subjects

Authors

Affiliations

Sarah Loboda [email protected]
Department of Natural Resource Sciences, Macdonald campus, McGill University, 21111 Lakeshore Road, Sainte-Anne-de-Bellevue, QC H9X 3V9, Canada
Christopher M. Buddle
Department of Natural Resource Sciences, Macdonald campus, McGill University, 21111 Lakeshore Road, Sainte-Anne-de-Bellevue, QC H9X 3V9, Canada

Author Contributions

All conceived and designed the study.
All performed the experiments/collected the data.
All analyzed and interpreted the data.
All contributed resources.
All drafted or revised the manuscript.

Competing Interests

The authors have declared that no competing interests exist.

Metrics & Citations

Metrics

Other Metrics

Citations

Cite As

Export Citations

If you have the appropriate software installed, you can download article citation data to the citation manager of your choice. Simply select your manager software from the list below and click Download.

Cited by

1. Assemblage of spider diversity in Okkarai region of Pachamalai hills, Eastern Ghats, Tiruchirappalli district, Tamil Nadu, India
2. Spider Diversification Through Space and Time
3. Circumpolar terrestrial arthropod monitoring: A review of ongoing activities, opportunities and challenges, with a focus on spiders
4. A DNA Barcoding Survey of an Arctic Arthropod Community: Implications for Future Monitoring
5. Spatial distribution of acalyptrate fly (Diptera) assemblages in Northern Canada

View Options

View options

PDF

View PDF

Get Access

Media

Media

Other

Tables

Share Options

Share

Share the article link

Share on social media