Taxonomic bias and international biodiversity conservation research
Abstract
While greater research on threatened species alone cannot ensure their protection, understanding taxonomic bias may be helpful to address knowledge gaps in order to identify research directions and inform policy. Using data for over 10 000 animal species listed on the International Union for Conservation of Nature Red List, we investigated taxonomic and geographic biodiversity conservation research trends worldwide. We found extreme bias in conservation research effort on threatened vertebrates compared with lesser-studied invertebrates in both terrestrial and aquatic habitats at a global scale. Based on an analysis of common threats affecting vertebrates and invertebrates, we suggest a path forward for narrowing the research gap between threatened vertebrates and invertebrates.
Introduction
International biodiversity conservation strategies, such as the United Nations Convention on Biological Diversity (CBD), as well as an increasing number of national and regional biodiversity policies, aim to reduce biodiversity loss and protect at-risk species and habitats. Despite the widespread adoption of such conservation policies, biodiversity continues to decline (Rands et al. 2010) and current extinction rates are about 1000 times the expected background rate (Pimm et al. 2014). The effectiveness of the CBD and other such policy instruments are dependent on a range of factors, including country-specific constraints such as funding, government involvement, social capital, ecosystems and ecosystem services, and multiple other factors that drive conservation policy (Martín-López et al. 2009). Even so, having the best available science to inform policy development and environmental decision making is assumed to be beneficial. However, widespread data deficiencies (Bland et al. 2015) and conservation research biases (Clark and May 2002) exist. Conservation efforts can improve the status of the world’s vertebrates (Hoffman et al. 2010), but less is known about invertebrates, likely due, in part, to data deficiencies and practical considerations such as lack of funding and technical limitations. While greater research on threatened species cannot ensure their protection, understanding taxonomic bias may be helpful in order to address knowledge gaps and inform policy.
Using data for over 10 000 threatened animal species, we investigated taxonomic and geographic biodiversity conservation research trends worldwide. We interpret these results in the context of refocusing conservation research priorities to fill critical data gaps and effect policy change. With concerns that understudied species may have higher risk of imperilment and extinction (McKinney 1999), there is a need to identify key knowledge gaps and biases to inform and enhance biodiversity conservation policies and actions and to provide a path forward for effective policy development.
Methods
We created a database of all animal species listed as critically endangered, endangered, or vulnerable on the International Union for Conservation of Nature (IUCN) Red List (IUCN Red List of Threatened Species 2012). Our search returned 10 615 animal species; 7227 vertebrates from the taxonomic groups Mammalia, fish classes (including Actinopterygii, Cephalaspidomorphi, Chondricthyes, Myxin, and Sacropterygii), Reptilia, Aves, and Amphibia; as well as 3388 invertebrates from the taxonomic groups Cnidaria (including Anthozoa and Hydrozoa), Crustacea, Insecta, other invertebrates (including Arachnida, Chilopoda, Diplopoda, Enopla, Onychophora, Polychaeta, and Clitellata), and Mollusca (including Bivalvia and Gastropoda).
We searched the Web of Science (WoS) citation indexing database (Thomson Reuters 2012) and tallied the number of papers on each species (Fig. 1). The most recent nomenclature for the species, as cataloged in the IUCN Red List, was used to search WoS, so previous species name changes may not have been captured in this search. To determine the number of biodiversity conservation-themed papers, we refined our search by the WoS “biodiversity conservation” subject field, in order to capture papers relevant to the fields of biodiversity and conservation (Fig. 2). We then recorded the number of papers published for threatened vertebrate and invertebrate species native to each ocean or continent (Fig. 3a). To account for variation in the number of species assessed by the IUCN Red List in each location, we calculated the ratio of biodiversity conservation papers to species listed as critically endangered, endangered, or vulnerable on the IUCN Red List in each location (Fig. 3b). Locations included the following terrestrial, freshwater, and ocean habitats: Africa, Antarctic, Arctic Sea, Asia, Atlantic Ocean, Caribbean Islands, Europe, Indian Ocean, Mediterranean and Black Sea, Mesoamerica, North America, Oceania, Pacific Ocean, and South America.
Fig. 1.
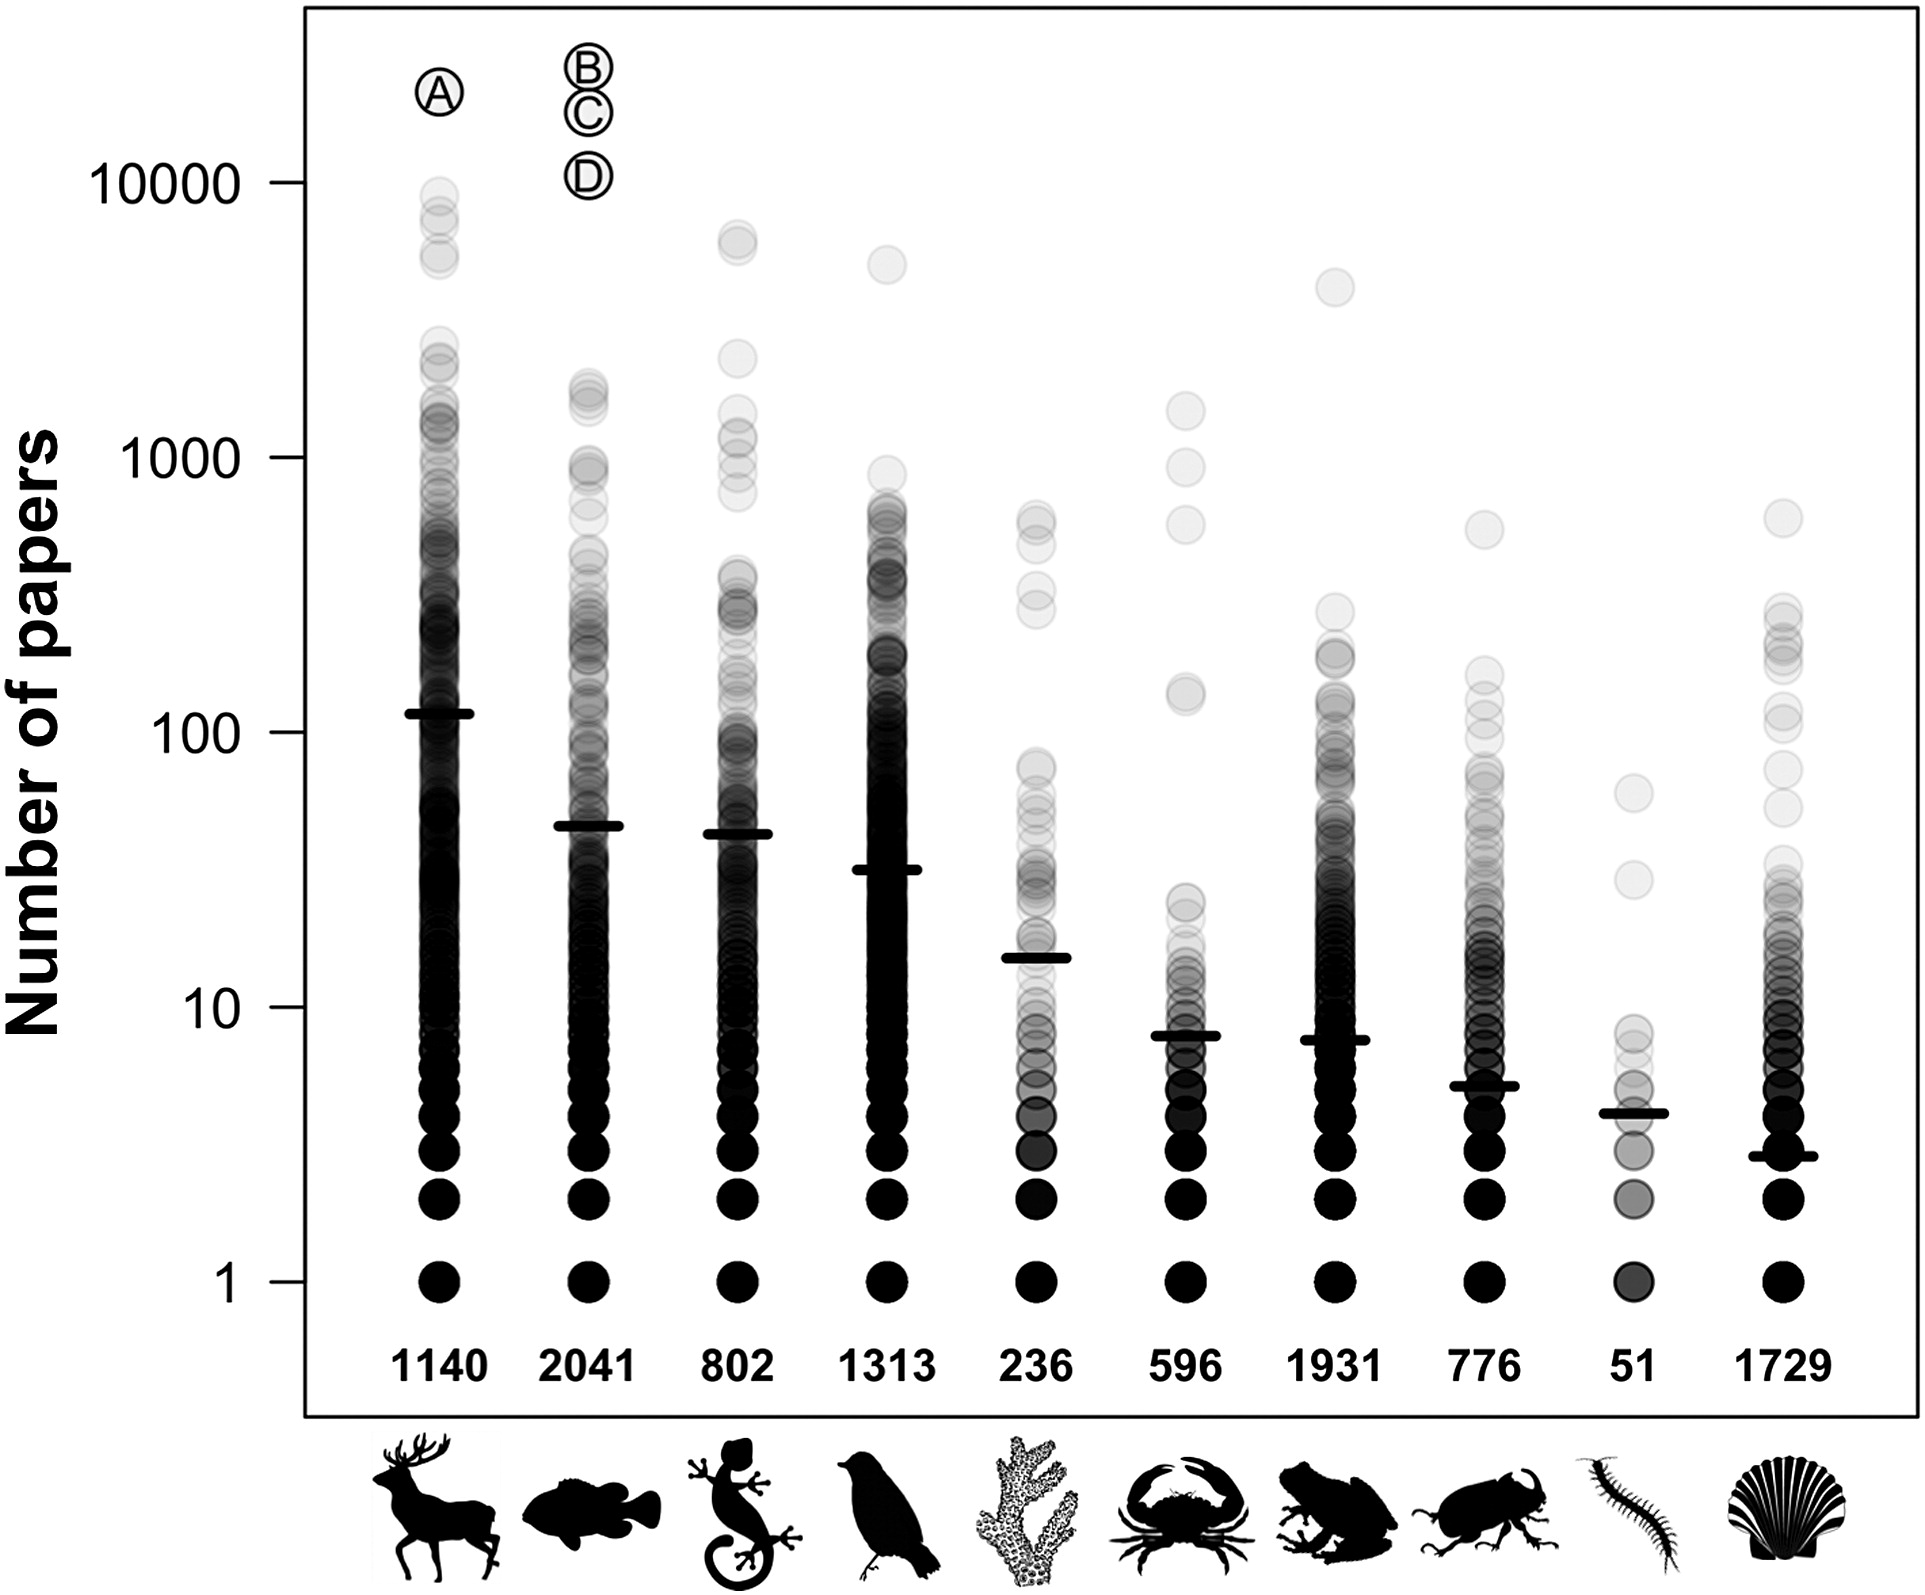
Fig. 2.
Fig. 3.
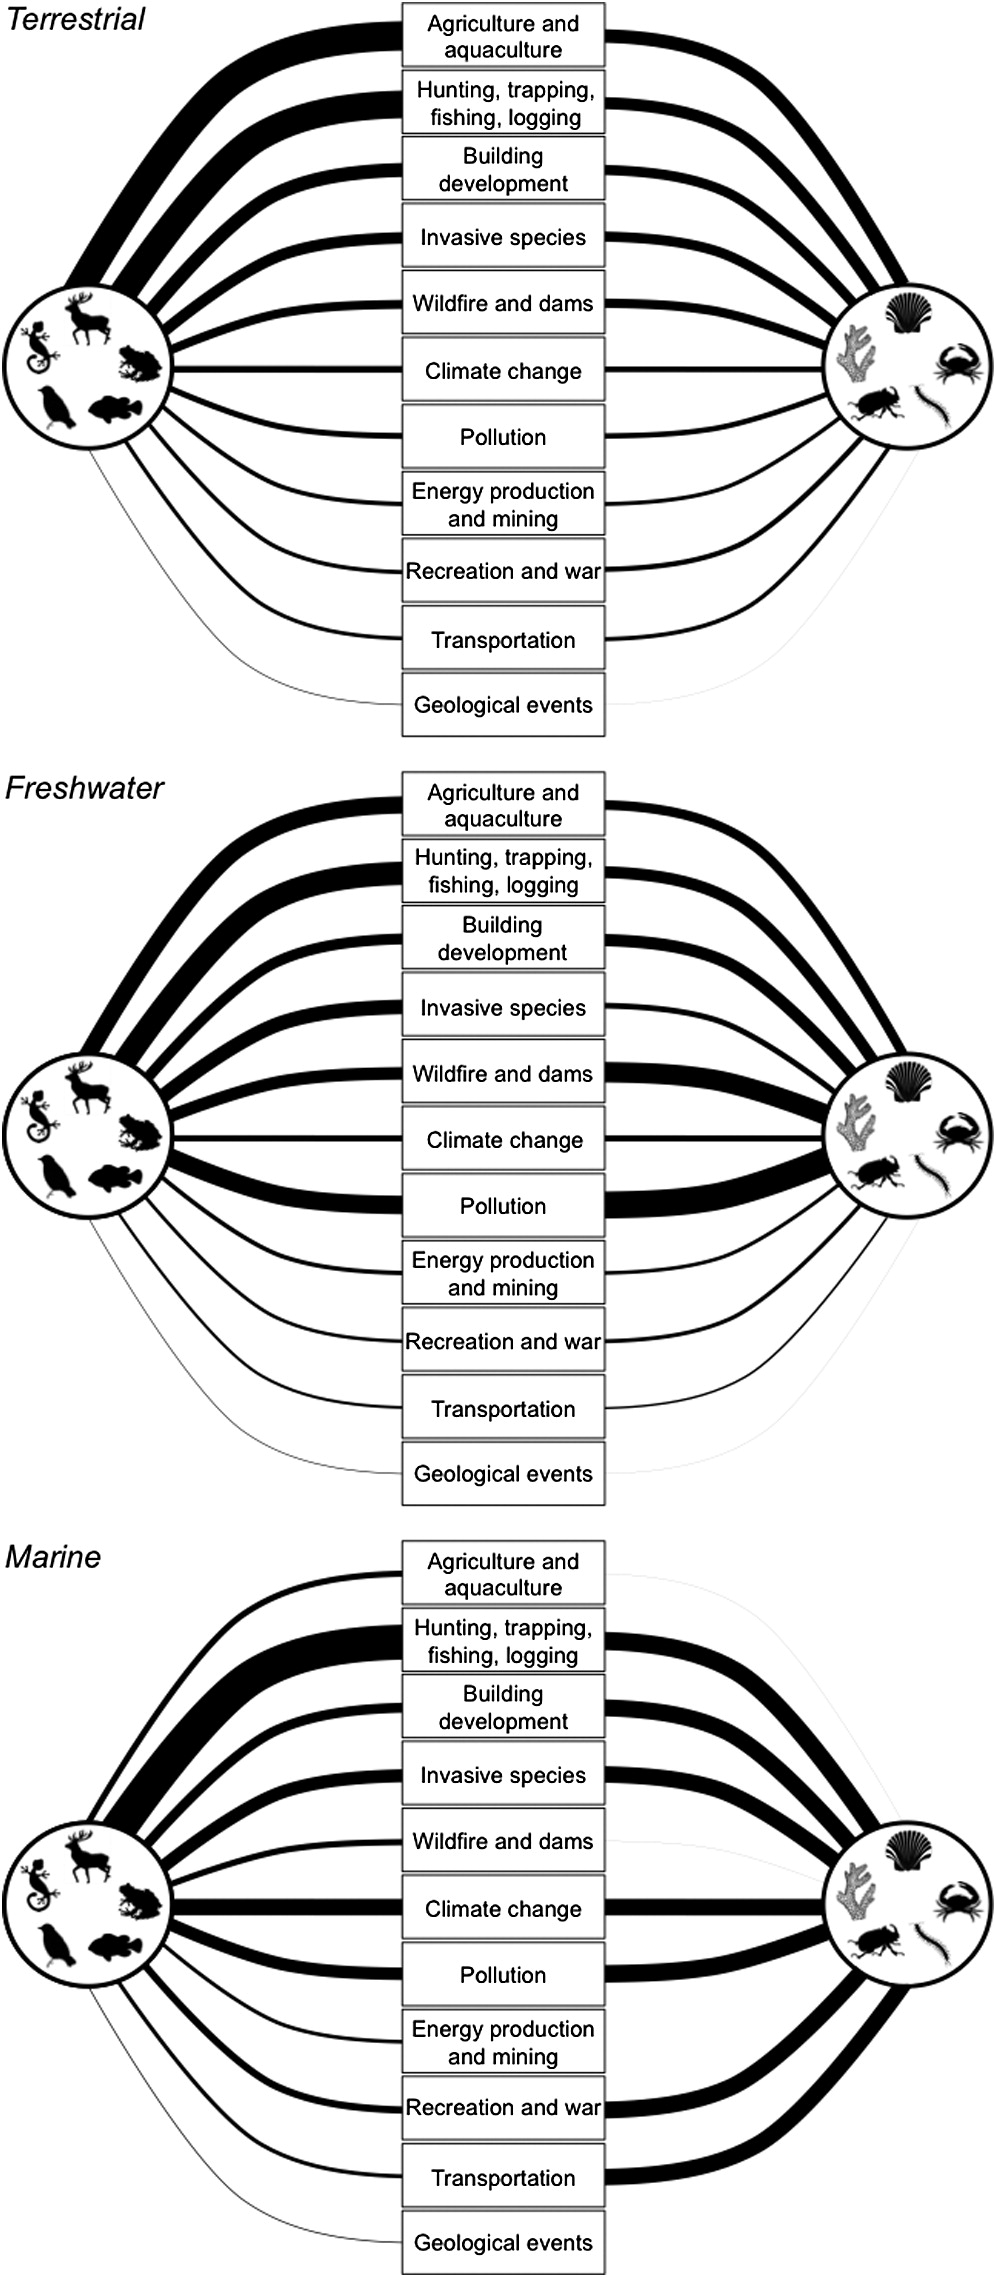
The IUCN Red List 2012 catalogs possible threats affecting each species on the Red List. We recorded each threat in our database and present the threats affecting vertebrates and invertebrates using the thickness of the connecting lines to illustrate the proportion of species affected by each threat (Fig. 4).
Fig. 4.
Results and discussion
Taxonomic trends
The criticisms that biodiversity indicators used by policymakers operating under international agreements are underdeveloped and lack sufficient data (Walpole et al. 2009) are magnified for understudied taxa. In general, charismatic animals tend to receive the most attention from the general public (Genovart et al. 2013) and conservation scientists (Bonnet et al. 2002; Lawler et al. 2006). Our analysis revealed large differences among groups in numbers of biodiversity conservation papers published per species listed on the IUCN Red List (mammals: 17.1, reptiles: 9.8, birds: 8.2, fishes: 5.9, amphibians: 0.9, and all invertebrates: 0.9; Fig. 1).
Certain mammal (e.g., tiger Panthera tigris Linnaeus, African bush elephant Loxodonta africana Blumenbach), fish (e.g., Atlantic cod Gadus morhua Linnaeus, common carp Cyprinus carpio Linnaeus; which have been introduced to many locations outside their native ranges, European eel Anguilla anguilla Linnaeus), and reptile species (e.g., leatherback Dermochelys coriacea Vandelli, hawksbill Eretmochelys imbricata Linnaeus, and green sea turtles Chelonia mydas Linnaeus) were the focus of more than 600 biodiversity conservation papers each, and emerged as outliers compared with other threatened species. Common carp, in particular, have been studied in a conservation context, not due to their declining population, but rather due to the fact that they have been introduced elsewhere and may have affected other native populations. However, even with these outliers removed, vertebrate taxa still had much higher biodiversity conservation papers published per species (mammals: 15.5, reptiles: 5.2, fish: 3.7). No invertebrate species emerged as outliers (all species had <300 papers). Although encouraging reports suggest that conservation efforts can improve the status of the world’s vertebrates (Hoffman et al. 2010), less is known about invertebrates. In fact, even in the IUCN Red List, the majority of invertebrate species remain not evaluated (IUCN Red List of Threatened Species 2012). Compared with invertebrates, we found that vertebrates had 12.3, 5.3, and 13.5-fold more biodiversity conservation papers published per species in terrestrial, freshwater, and marine habitats, respectively (Fig. 2). Such bias in conservation research has implications for scientific study, funding, and policy (Trimble and Van Aarde 2010) and raises new concerns for threatened invertebrates worldwide.
Geographic trends
Our analysis revealed that in all regions, the number of biodiversity conservation papers published on threatened invertebrates was considerably lower and less variable compared with threatened vertebrates in terrestrial, freshwater, and ocean habitats (Fig. 3). Specifically, our analysis revealed that a higher number of threatened species are native to terrestrial and freshwater habitats (11 547) compared with ocean habitat (1046). Ultimately, this result suggests that nearly all invertebrate assessments of threat status are determined using limited scientific information regardless of geographic location, whereas the quantity of information used to assess vertebrates is much greater and more variable. For example, there are large biases to conservation papers studying vertebrates in the Arctic Ocean (200.0) and Mediterranean and Black Sea (140.5).
Focus on common threats
We provide evidence for extreme bias in conservation research effort on threatened vertebrates compared with lesser-studied invertebrates in both terrestrial and aquatic habitats at a global scale. Research biases may have implications for our relative understanding of threatened species (Pawar 2003) and conservation prioritization (Hoffman et al. 2010), but also have important implications for research funding (Darwall et al. 2011) and international decision-making and policy (Martín-López et al. 2009). Although these discrepancies are not easily rectified, there may be opportunities to refocus research objectives and international policy development based on common threats (Fig. 4). We found that the threats facing well-studied vertebrates and poorly studied invertebrates tend to be proportionally similar in terrestrial and freshwater habitats. Threats in terrestrial habitats (e.g., agricultural activities, natural resource use, and habitat alteration) are proportionally similar for both vertebrate and invertebrate species. Likewise, the most prevalent threats for freshwater vertebrates (e.g., pollution, habitat modifications such as dams) are proportionally similar for freshwater invertebrates. Despite comparable threats among taxa in terrestrial and freshwater habitats, in marine habitats, threats affecting invertebrates differ considerably from those affecting vertebrates (Fig. 4; Mengerink et al. 2014). These differences must be accounted for in the design of marine protected areas (PAs) to effectively protect threatened vertebrates and invertebrates to meet global conservation targets (Le Saout et al. 2013).
Networks of PAs, developed to conserve at-risk plants and animals, are expanding worldwide and comprise more than 12% of the global land surface and nearly 1% of the oceans (Sutherland et al. 2009). International agreements, such as the United Nations CBD and World Heritage Convention, provide global frameworks for guiding the establishment and management of PAs. Yet, the effectiveness of PAs depends, at least in part, on the quality and quantity of the scientific research that is available on the at-risk species that PAs aim to protect. PAs are often established in high biodiversity regions to protect multiple species (Le Saout et al. 2013), but few PAs are established with the goal of protecting invertebrates specifically. Further complicating conservation efforts, analysis of species declines, and conservation efforts typically occur at large geographic scales, whereas analysis of recovery often focuses on specific species, populations, and regions (Hutchings et al. 2012).
An encouraging method of starting to redress taxonomic bias in conservation science is to better utilize citizen science, through crowd-sourced data and online databases, which offer continually increasing accessibility and knowledge-sharing opportunities (Pimm et al. 2014). Citizen science activities focused on invertebrates (e.g., e-butterfly.org, bumblebeewatch.org) have garnered considerable public interest and resulted in the collection of a large quantity of data in a short amount of time. Such observations, after evaluation of their reliability, can contribute to peer-reviewed research and supplement existing online databases to provide information on natural history, ecology, population trends, and estimates of geographic ranges, even for understudied taxa. That information can then be incorporated into integrative frameworks (Dawson et al. 2011) to better predict how threatened taxa may be affected by different threats. Whether data are collected through citizen science programs or traditional research programs, prioritization must occur for target species based on criteria such as availability of taxonomic expertise and likely ecological importance (Gerlach et al. 2014).
Addressing taxonomic biases alone may not result in direct conservation actions, but understanding these biases may become increasingly valuable given the likelihood of taxa- (Root et al. 2003) and region-specific (Hampe and Petit 2005) differences in how animals respond to global change. Considering that taxonomic biases can influence how we measure global change (Balmford et al. 2003), there is a need for better integration of conservation-focused research efforts at a global scale to ensure that we improve our understanding of threatened animals, particularly understudied invertebrates. This knowledge may be increasingly valuable given the recent evidence that biodiversity loss itself may exacerbate global change (Sutherland et al. 2013). Narrowing the research gap between vertebrates and invertebrates may facilitate more effective conservation policies to limit biodiversity declines (Waldron et al. 2013).
Acknowledgements
MRD was supported by a Natural Sciences and Engineering Research Council of Canada postdoctoral fellowship.
References
Balmford A, Green RE, and Jenkins M. 2003. Measuring the changing state of nature. Trends in Ecology & Evolution, 18(7): 326–330.
Bland LM, Collen B, Orme CDL, and Bielby J. 2015. Predicting the conservation status of data-deficient species. Conservation Biology, 29(1): 250–259.
Bonnet X, Shine R, and Lourdais O. 2002. Taxonomic chauvinism. Trends in Ecology & Evolution, 17(1): 1–3.
Clark JA, and May RM. 2002. Taxonomic bias in conservation research. Science, 297(5579): 191–192.
Darwall WRT, Holland RA, Smith KG, Allen D, Brooks EGE, Katarya V, et al. 2011. Implications of bias in conservation research and investment for freshwater species. Conservation Letters, 4(6): 474–482.
Dawson TP, Jackson ST, House JI, Prentice IC, and Mace GM. 2011. Beyond predictions: Biodiversity conservation in a changing climate. Science, 332(6025): 53–58.
Genovart M, Tavecchia G, Enseñat JJ, and Laiolo P. 2013. Holding up a mirror to the society: Children recognize exotic species much more than local ones. Biological Conservation, 159: 484–489.
Gerlach J, Samways MJ, Hochkirch A, Seddon M, Cardoso P, Clausnitzer V, et al. 2014. Prioritizing non-marine invertebrate taxa for Red Listing. Journal of Insect Conservation, 18(4): 573–586.
Hampe A, and Petit RJ. 2005. Conserving biodiversity under climate change: The rear edge matters. Ecology Letters, 8(5): 461–467.
Hoffmann M, Hilton-Taylor C, Angulo A, Böhm M, Brooks TM, Butchart SHM, et al. 2010. The impact of conservation on the status of the world’s vertebrates. Science, 330(6010): 1503–1509.
Hutchings JA, Butchart SHM, Collen B, Schwartz MK, and Waples RS. 2012. Red flags: Correlates of impaired species recovery. Trends in Ecology & Evolution, 27(10): 542–546.
International Union on the Conservation of Nature (IUCN) Red List of Threatened Species. 2012. Version 2012.2. Available from www.iucnredlist.org.
Lawler JJ, Aukema JE, Grant JB, Halpern BS, Kareiva P, Nelson CR, et al. 2006. Conservation science: A 20-year report card. Frontiers in Ecology and the Environment, 4(9): 473–480.
Le Saout S, Hoffmann M, Shi Y, Hughes A, Bernard C, Brooks TM, et al. 2013. Protected areas and effective biodiversity conservation. Science, 342(6160): 803–805.
Martín-López B, Montes C, Ramírez L, and Benayas J. 2009. What drives policy decision-making related to species conservation? Biological Conservation, 142(7): 1370–1380.
McKinney ML. 1999. High rates of extinction and threat in poorly studied taxa. Conservation Biology, 13(6): 1273–1281.
Mengerink KJ, Van Dover CL, Ardron J, Baker M, Escobar-Briones E, Gjerde K, et al. 2014. A call for deep-ocean stewardship. Science, 344(6185): 696–697.
Pawar S. 2003. Taxonomic chauvinism and the methodologically challenged. Bioscience, 53(9): 861–864.
Pimm SL, Jenkins CN, Abell R, Brooks TM, Gittleman JL, Joppa LN, et al. 2014. The biodiversity of species and their rates of extinction, distribution, and protection. Science, 344(6187): 987.
Rands MRW, Adams WM, Bennun L, Butchart SHM, Clements A, Coomes D, et al. 2010. Biodiversity conservation: Challenges beyond 2010. Science, 329(5997): 1298–1303.
Root TL, Price JT, Hall KR, Schneider SH, Rosenzweig C, and Pounds JA. 2003. Fingerprints of global warming on wild animals and plants. Nature, 421: 57–60.
Sutherland WJ, Adams WM, Aronson RB, Aveling R, Blackburn TM, Broad S, et al. 2009. One hundred questions of importance to the conservation of global biological diversity. Conservation Biology, 23(3): 557–567.
Sutherland WJ, Aveling R, Brooks TM, Clout M, Dicks LV, Fellman L, et al. 2013. A horizon scan of global conservation issues for 2013. Trends in Ecology & Evolution, 28(1): 16–22.
Thomson Reuters. 2012. Web of Science (WoS) citation indexing database. Available from: http://www.webofknowledge.com.
Trimble MJ, and Van Aarde RJ. 2010. Species inequality in scientific study. Conservation Biology 24(3): 886–890.
Waldron A, Mooers AO, Miller DC, Nibbelink N, Redding D, Kuhn TS, et al. 2013. Targeting global conservation funding to limit immediate biodiversity declines. Proceedings of the National Academy of Sciences of the United States of America, 110(29): 12144–12148.
Walpole M, Almond REA, Besançon C, Butchart SHM, Campbell-Lendrum D, Carr GM, et al. 2009. Tracking progress toward the 2010 biodiversity target and beyond. Science, 325(5947): 1503–1503.
Information & Authors
Information
Published In
FACETS
Volume 1 • Number 1 • January 2017
Pages: 105 - 113
Editor: Jeffrey Hutchings
History
Received: 27 March 2016
Accepted: 4 May 2016
Version of record online: 26 July 2016
Copyright
© 2016 Donaldson et al. This work is licensed under a Creative Commons Attribution 4.0 International License (CC BY 4.0), which permits unrestricted use, distribution, and reproduction in any medium, provided the original author(s) and source are credited.
Data Availability Statement
All relevant data are within the paper.
Key Words
Sections
Subjects
Authors
Author Contributions
All conceived and designed the study.
MRD, NJB, and DCB performed the experiments/collected the data.
All analyzed and interpreted the data.
All contributed resources.
All drafted or revised the manuscript.
Competing Interests
SJC is currently serving as a Subject Editor for FACETS, and MRD is employed by Canadian Science Publishing but neither was involved in review or editorial decisions regarding this manuscript.
Metrics & Citations
Metrics
Other Metrics
Citations
Cite As
Michael R. Donaldson, Nicholas J. Burnett, Douglas C. Braun, Cory D. Suski, Scott G. Hinch, Steven J. Cooke, and Jeremy T. Kerr. 2017. Taxonomic bias and international biodiversity conservation research. FACETS.
1(): 105-113. https://doi.org/10.1139/facets-2016-0011
Export Citations
If you have the appropriate software installed, you can download article citation data to the citation manager of your choice. Simply select your manager software from the list below and click Download.
Cited by
1. Global mismatches between threat mapping research effort and the potential of threat abatement actions to reduce extinction risk
2. Occupancy and N-mixture modeling applications in ecology: A bibliometric analysis
3. Rewilding in cold blood: Restoring functionality in degraded ecosystems using herbivorous reptiles
4. Using photo editing to understand the impact of species aesthetics on support for conservation
5. eDNA
for monitoring and conserving terrestrial arthropods: Insights from a systematic map and barcode repositories assessments
6. Combining camera trap surveys and IUCN range maps to improve knowledge of species distributions
7. Marine heatwaves as drivers of biological and ecological change: implications of current research patterns and future opportunities
8. Nunavik Sentinels: documenting northern insect biodiversity and supporting Indigenous youth leadership through participatory research and education
9. A systematic review of research on biodiversity in Japanese retarding basins.
10. Arachnids at the Edge: View and Perspectives, with Emphasis on Spiders and Scorpions
11. An analysis of threats to endangered animal taxa in California's freshwater systems
12. Participatory monitoring drives biodiversity knowledge in global protected areas
13. Widespread Geographical Disparities in Phytoplankton Ecology Research in the Face of Climate Change: A Review
14. Assessing artisanal fishers' attitude and perception towards electric rays conservation along Indian coast
15. Global knowledge gaps of herptile responses to land transformation
16. Decision support tools for invasive alien species management should better consider principles of robust decision making
17. The pattern and drivers of taxonomic bias in global primate research
18. The future of global river health monitoring
19. A dark side of conservation biology: Protected areas fail in representing subterranean biodiversity
20. Is invertebrate conservation in Great Britain best achieved by policies that increase species protection?
21. Loss and Damage from Climate Change: Knowledge Gaps and Interdisciplinary Approaches
22. Half century in biodiversity and conservation research in Nepal: a review
23. The Present and Future of Insect Biodiversity Conservation in the Neotropics: Policy Gaps and Recommendations
24. The more things changed, the more they stayed the same: Trends in conservation focus 2010–2019
25. Status of urban ecology in Africa: A systematic review
26. Publication trends in global biodiversity research on protected areas
27. A synthesis of priorities, patterns, and gaps in large carnivore corridor research
28. Bibliometric investigation of the integration of animal personality in conservation contexts
29. A sequential approach to reserve design with compactness and contiguity considerations
30. Patterns of community science data use in peer-reviewed research on biodiversity
31. Mapping nationally and globally at-risk species to identify hotspots for (and gaps in) conservation
32. Spider Diversity in the Fragmented Forest-Steppe Landscape of Northeastern Ukraine: Temporal Changes under the Impact of Human Activity
33. New evidence to demystify the supposed holoplanktonic life cycle in Ceriantharia (Cnidaria)
34. Done but not dusted: Reflections on the first global reptile assessment and priorities for the second
35. Rapid literature mapping on the recent use of machine learning for wildlife imagery
36. Mismatch between conservation status and climate change sensitivity leaves some anurans in the United States unprotected
37. The scope and extent of literature that maps threats to species globally: a systematic map
38. Sounding out a continent: seven decades of bioacoustics research in Africa
39. Evaluating the influence of environmental variables on fish assemblages along Tropical Andes: considerations from ecology to conservation
40. Surrogacy of bird species in systematic conservation planning and conservation assessments in Yunnan Province, China
41. The conservation of non-marine molluscs in South America: where we are and how to move forward
42. The risks and rewards of community science for threatened species monitoring
43. Quantifying research interests in 7,521 mammalian species with
h
-index: a case study
44. The aesthetic value of reef fishes is globally mismatched to their conservation priorities
45. Balancing research, monitoring, and action to recover Canada’s species at risk
46. Google Trends data reveal a sharp trend: teeth and claws attract more interest than feathers, hooves or fins
47. Identifying drivers of change in bryophyte and lichen species occupancy in Scotland
48. The Next Generation Is Here: A Review of Transcriptomic Approaches in Marine Ecology
49. Global marine litter research 2015–2020: Geographical and methodological trends
50. Epigenetics in Ecology, Evolution, and Conservation
51. Comparing predictions of IUCN Red List categories from machine learning and other methods for bats
52. Implications of taxonomic bias for human–carnivore conflict mitigation
53. Current conservation policies in the UK and Ireland overlook endangered insects and are taxonomically biased towards Lepidoptera
54. Shark and ray research in India has low relevance to their conservation
55. IUCNN
– Deep learning approaches to approximate species' extinction risk
56. Assessing the representation of species included within the Canadian Living Planet Index
57. Trends and biases in African large carnivore population assessments: identifying priorities and opportunities from a systematic review of two decades of research
58. Environmental and socioeconomic correlates of extinction risk in endemic species
59. Taxonomic and geographic bias in 50 years of research on the behaviour and ecology of galagids
60. Biases in conservation: A regional analysis of Spanish vertebrates
61. Bias assessments to expand research harnessing biological collections
62. Wooded areas promote species richness in urban parks
63. Assemblage reorganization of South African dragonflies due to climate change
64. Multinational coordination required for conservation of over 90% of marine species
65. More exposure opportunities for promoting freshwater conservation
66. Impact of an IUCN national Red List of threatened flora on scientific attention
67. Population declines among Canadian vertebrates: But data of different quality show diverging trends
68. Uncovering Trends and Spatial Biases of Research in a U.S. National Park
69. The application of reflexivity for conservation science
70. Effect and difference between the threatened and endemic status on the general public support towards wildlife species in a biodiversity hotspot
71. Re-conceptualizing the role(s) of science in biodiversity conservation
72. WildWID: An open‐source active RFID system for wildlife research
73. A novel trap design for non-lethal monitoring of dung beetles using eDNA metabarcoding
74. Determining ranges of poorly known mammals as a tool for global conservation assessment
75. Ecosystem services provided by aculeate wasps
76. Knowledge gaps and biases in the Pantanal indicate future directions for ornithological research in large wetlands
77. Insect threats and conservation through the lens of global experts
78. Insect Cultural Services: How Insects Have Changed Our Lives and How Can We Do Better for Them
79. Sociopolitical factors drive conservation planning timelines: A Canadian case study with global implications
80. Taxonomic bias in occurrence information of angiosperm species in China
81. Assessing biodiversity hotspots below the species-level in Canada using designatable units
82. Spider conservation in Europe: a review
83. Trends in Wildlife Connectivity Science from the Biodiverse and Human-Dominated South Asia
84. The challenge of biased evidence in conservation
85. Understanding and avoiding misplaced efforts in conservation
86. Exploiting common senses: sensory ecology meets wildlife conservation and management
87. How to prioritize areas for new ant surveys? Integrating historical data on species occurrence records and habitat loss
88. Is my sdm good enough? insights from a citizen science dataset in a point process modeling framework
89. Systematic map of conservation psychology
90. Drivers of taxonomic bias in conservation research: a global analysis of terrestrial mammals
91. Factors influencing taxonomic unevenness in scientific research: a mixed-methods case study of non-human primate genomic sequence data generation
92. The global diversity and distribution of lizard clutch sizes
93. Poor availability of context-specific evidence hampers decision-making in conservation
94. Fish out of water: Aquatic parasites in a drying world
95. Deploying Big Data to Crack the Genotype to Phenotype Code
96. The role of species charisma in biological invasions
97. Evaluating conservation biology texts for bias in biodiversity representation
98. Scientific knowledge on threatened species of the Brazilian Red List: freshwater fish as a case study
99. Spatial and interspecific comparisons of the reproductive biology of two species of co-occurring freshwater shrimps (Decapoda: Caridea: Palaemonidae) in the Three Gorges Reservoir, China
100. Sentiment analysis as a measure of conservation culture in scientific literature
101. Scientists' warning to humanity on insect extinctions
102. Relative costs of conserving threatened species across taxonomic groups
103. Current felid (Carnivora: Felidae) distribution, spatial bias, and occurrence predictability: testing the reliability of a global dataset for macroecological studies
104. Using ignorance scores to explore biodiversity recording effort for multiple taxa in the Caatinga
105. Taxonomic biases persist from listing to management for Canadian species at risk
106. Lichen conservation in North America: a review of current practices and research in Canada and the United States
107. Scaling from individual physiological measures to population-level demographic change: Case studies and future directions for conservation management
108. Biodiversity Impact of Green Roofs and Constructed Wetlands as Progressive Eco-Technologies in Urban Areas
109. Applying habitat and population‐density models to land‐cover time series to inform IUCN Red List assessments
110. Perceptions and representations of animal diversity: Where did the insects go?
111. Photo‐sharing platforms key for characterising niche and distribution in poorly studied taxa
112. Why is biodiversity data-deficiency an ongoing conservation dilemma in Africa?
113. European Union’s conservation efforts are taxonomically biased
114. Indigenous involvement in the Canadian species at risk recovery process
115. Hotspots of human impact on threatened terrestrial vertebrates
116. Marine reserves drive both taxonomic and functional change in coral reef invertebrate communities
117. Conservation genetics of elasmobranchs of the Mexican Pacific Coast, trends and perspectives
118. On the overlap between scientific and societal taxonomic attentions — Insights for conservation
119. Digging in: a review of the ecology and management of a threatened reptile with a small disjunct distribution – the heath skink, Liopholis multiscutata, in Victoria, south-eastern Australia
120. The status of research on the mammals of Sulawesi, Indonesia
121. Predicting plant conservation priorities on a global scale
122. Genomic data indicate ubiquitous evolutionary distinctiveness among populations of California metalmark butterflies
123. Biodiversity monitoring, earth observations and the ecology of scale
124. Hindcasting the impacts of land‐use changes on bird communities with species distribution models of Bird Atlas data
125. Persistence of methodological, taxonomical, and geographical bias in assessments of species' vulnerability to climate change: A review
126. Biodiversity and Extinction of Hawaiian Land Snails: How Many Are Left Now and What Must We Do To Conserve Them—A Reply to Solem (1990)
127. National attention to endangered wildlife is not affected by global endangerment: A case study of Canada’s species at risk program
128. Taxonomic bias in biodiversity data and societal preferences
129. Bias and perspectives in insect conservation: A European scale analysis
130. Freshwater Megafauna: Flagships for Freshwater Biodiversity under Threat
131. Terrestrial Invertebrates in the Riparian Zone: Mechanisms Underlying Their Unique Diversity
132. Nutritional physiology and ecology of wildlife in a changing world
133. Changing trends and persisting biases in three decades of conservation science
134. Conserving Megafauna or Sacrificing Biodiversity?
135. Science responses to IUCN Red Listing