Evaluation of fiber optic installation methods, a case study on micro-trenching in Alberta, Canada
Abstract
Micro-trenching is an innovative and discreet utility installation method that includes the creation of a narrow trench to lay cable or conduit in the ground. To investigate the functionality and durability of micro-trenching in cold regions, two micro-trenching technologies were employed and monitored over the course of two winters in a parking lot in Edmonton, Alberta, Canada. During construction, productivity rate and generated waste material were studied. The installation’s physical integrity and optical performance were also evaluated during the monitoring period. Physical integrity was assessed by monitoring the conduit location using ground-penetrating radar (GPR), and an optical time-domain reflectometer (OTDR) test was conducted to determine attenuation in performance. Results indicated that the installation experienced undesirable upward and downward movements in sections with high traffic load, which may be prevented with a more effective reinstatement method. However, the fiber’s optical performance was not affected.
Introduction
Fiber-to-the-premises (FTTP) and fiber-to-the-home (FTTH) initiatives in many countries have triggered fiber optic (FO) network construction for high-speed broadband (more than 100 megabits per second) (Stirling Lloyd Polychem Ltd. 2011). Currently, several direct buried methods such as open cut, mini horizontal directional drilling (Mini-HDD), and utility sharing methods are available to build FO networks. The long-term performance of fiber networks is important because of the significantly high costs of FO deployment and the massive impact of broadband network failures on communities and businesses (Crandall et al. 2007; Holt and Jamison 2009; Czernich et al. 2011). Typically, open-cut methods result in significant costs and disturbances to the community and environment (Atalah et al. 2002; CSMG 2010). Furthermore, high construction costs are associated with mini-HDD in addition to the risks of hydraulic fracturing, bore collapse, and loss of circulation, as well as issues arising from steering limitations in cohesive soils (Osbak et al. 2012). Utility sharing methods also present challenges as they require increased coordination efforts between organizations and authorities (FO network and utility owner; Jeyapalan 2007). As a result, the new and convenient installation method of micro-trenching is increasing in popularity as an option for FO cable installation.
This paper introduces the micro-trenching method and discusses two different experiments conducted to evaluate installation functionality and FO performance in cold regions two years after installation.
Micro-trenching
Micro-trenching is a new installation method used for the distribution of communication infrastructure (commonly FO cables) in roadways. In this method, cables or conduits are placed into a trench no greater than 20 mm wide and 120–300 mm deep (DCMS 2011).
The first step in micro-trenching is creating the trench in the pavement using an appropriate cutter. Trench position is one of the most important concerns in this method, and a trench located along vehicles’ wheel path poses a high risk (DCMS 2011). Therefore, to provide added stability, micro-trenches should preferably be located close to the cement curb and along the edge of the road instead of in the direct path of traffic (Network Strategies 2008; Liteaccess Technologies Inc. 2010). After the trench has been cut, it must be cleaned with high-pressure water and dried with compressed air and a blowpipe (ITU 2003).
The second step of the micro-trenching process is installing a cable or conduit inside the trench. The cable must be strong enough to withstand external loads and temperature changes. It is sheltered in metallic tubing covered by a polyethylene (PE) jacket. According to the International Telecommunication Union (ITU 2003), a retaining strip, such as a PE strip, is laid over the cable to stabilize it inside the trench. Then, a water-repulsive material, such as a rubber strip, is placed over the retaining strip for mechanical and thermal protection (ITU 2003). Different types of conduit can also be used for cable protection against frost, operational loads, and construction activity (GM Plast 2013; TeraSpan 2013).
The third and final step of the micro-trenching process is surface reinstatement. As micro-trenches cannot be sufficiently compacted due to their small size, traditional asphalt mixes cannot be used for trench reinstatement. Moreover, the reinstatement material must flow freely to the bottom of the trench, impede water penetration, provide bonding to trench sides, and provide stability under traffic load (Stirling Lloyd Polychem Ltd. 2011). According to the ITU (2003), hot liquid bitumen is a suitable reinstatement material for this method and can be applied to the micro-trench with a properly sized nozzle.
In some road types, it might not be feasible to carry out surface reinstatement and maintain the road’s long-term reliability at the same time. Micro-trenching disturbs the structural matrix of roads that have been aged over decades, resulting in rapid deterioration. Applying micro-trenching in granular material can be challenging and may result in aggregate congestion in the trench that impedes the overall cleanliness of the excavation. It is more appropriate to employ micro-trenching as an installation technique in roads or sidewalks with a compact base (ITU 2003; DCMS 2011).
Micro-trenching provides considerable cost savings as it reduces surface restoration and installation time (Dura-Line 2016). Despite its multiple advantages, several issues are associated with micro-trenching due to its shallow installation, including potential damage to pavement due to trenching, differential thermal expansions of trench backfill and existing pavement materials, and the frost-heave effect in cold regions. Also, future pavement maintenance activities, such as milling and recycling, can damage buried FO cables. In addition to physical risks, the FO cable installed via micro-trenching may be subject to decreased performance due to environmental factors, temperature change, water seepage, and bending radius incurred during construction.
According to TeraSpan (D. Dofher, personal communication, 2013), several key hazards and risks are associated with micro-trenching. One such risk is reconstruction or future pavement maintenance activities; however, the risk can be greatly reduced through use of the “call before you dig” program, where a designated damage-prevention centre will identify existing buried utilities and their locations prior to planned construction or excavation. Another risk is old asphalt milling and overlaying, which are typical maintenance procedures for asphalt pavements. The micro-trench must be located well below the milling level so there is no possibility that this process will cause any damage to embedded cables.
Objectives
Despite the advantages of micro-trenching, it is seldom used in cold regions because of the possible risks associated with it. The following research was conducted in Edmonton, Alberta, Canada, to evaluate the performance of two common micro-trenching installation methods (shallow and deep) after being subjected to cold weather, freeze/thaw cycles, and traffic loading. To investigate the performance of installed FO cables, ground-penetrating radar (GPR) and optical time-domain reflectometer (OTDR) tests were conducted in different seasons.
Field installation
Project location and installation layouts
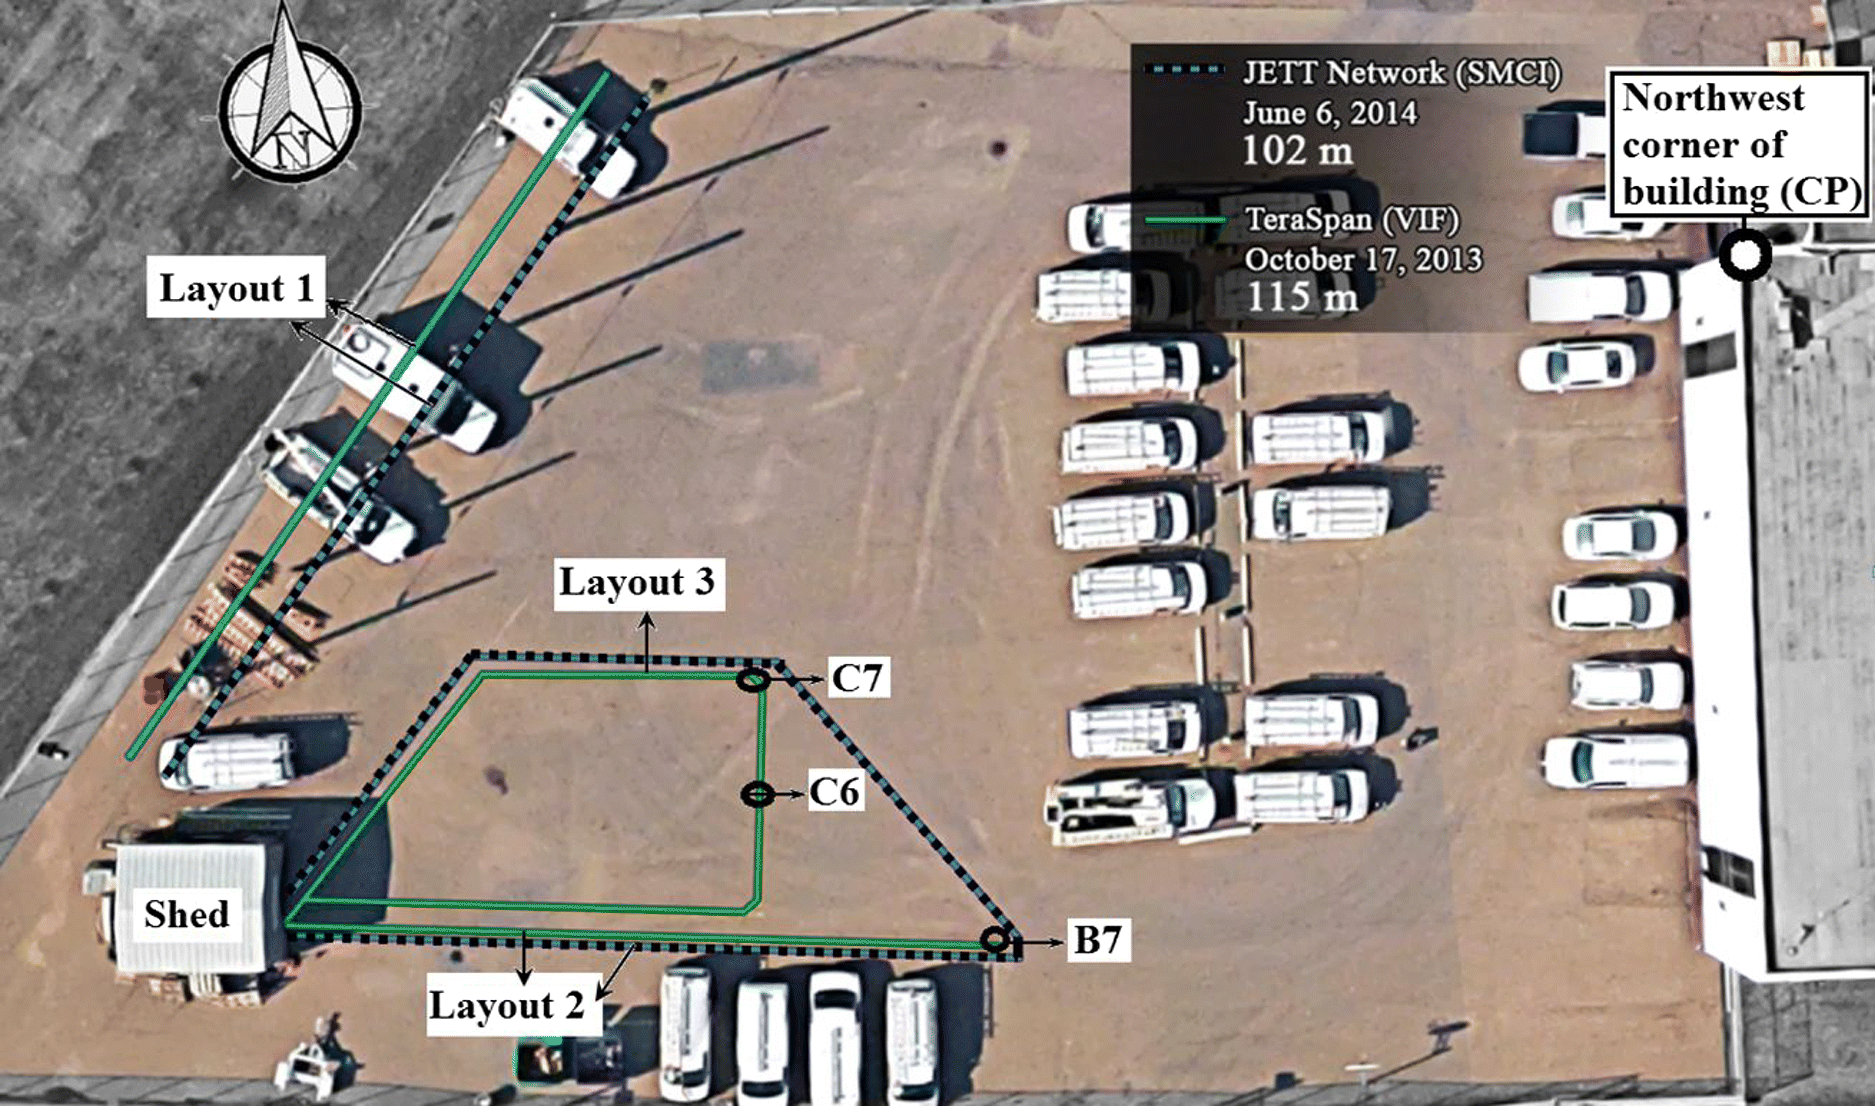
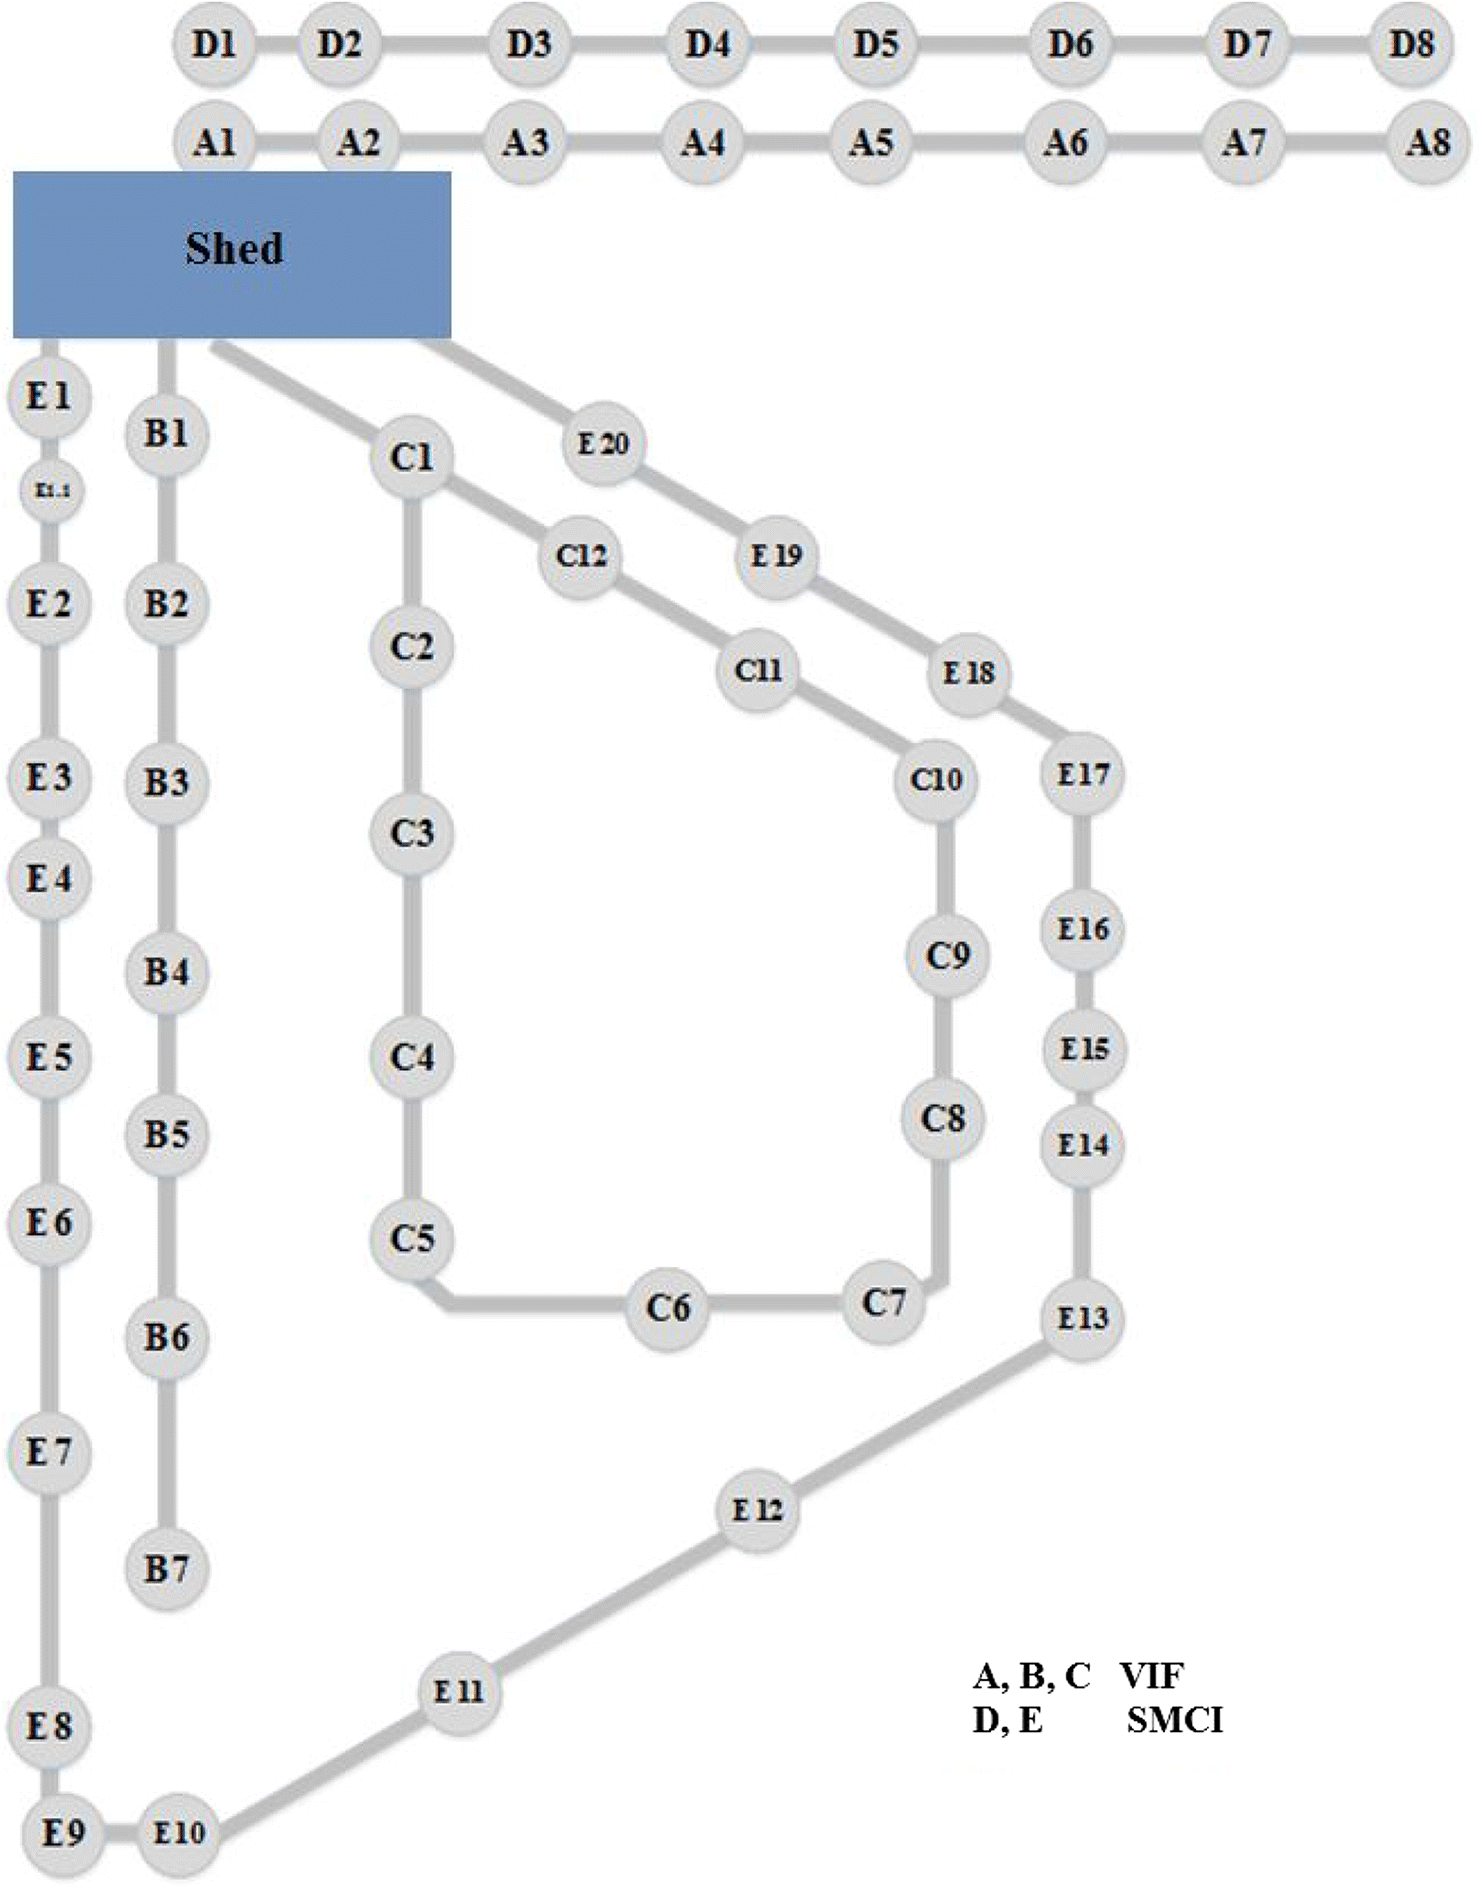
Two micro-trenching technologies, vertical inlaid fiber (VIF) and surface micro-cable inlay (SMCI), were used for installation in this experiment. The test installation was located at 2920 66 St NW, Edmonton, Alberta, in a parking lot belonging to a TELUS Communications operational building. TeraSpan conducted the first installation VIF on 17 October 2013. JETT Networks conducted the second installation SMCI on 6 June 2014. Details of the installation layouts (Fig. 1) are as follows:
•
VIF technology
1.
30 m straight layout without traffic load
2.
30 m straight layout located in the direct path of traffic
3.
55 m loop layout located in the direct path of traffic
•
SMCI technology
1.
30 m straight layout without traffic load
2.
72 m loop layout in the direct path of traffic
All the layouts were monitored with GPR to investigate the influence of cold weather conditions, traffic load, and bends (if applicable) on the conduit movements, and the layouts were tested with OTDR to determine the cable’s physical integrity. The loop layouts also provide information about the cable’s optical performance in traffic areas.
Fig. 1.
VIF technology
This technology uses vertical deflecting conduit (VDC) (Fig. 2a), which consists of two robust, slim conduit halves fastened together by a zipper tool to form a channel that encloses the FO cable. FO cables can be zipped, pulled, or blown into the conduits (TeraSpan 2013).
Fig. 2.
VIF installation begins by marking the target layout with spray paint along the path of a thread between predetermined points. Next, the trench is cut using a Husqvarna 6600 concrete cutter. After cutting is completed, the trench is cleaned using a shovel and metal hook, and the trench corners are smoothed using a small saw and metal hook.
The cable and wire tracer are inserted into the channels of the VDC and zipped up. After the conduit is zipped, it is laid in a vertical position inside the trench. The last step in the installation procedure is surface reinstatement. The trench is first filled with a layer of sand, followed by a layer of cold asphalt. A 100 lb packing wheel is then used for compaction to provide a fine finish on the pavement’s surface.
SMCI technology
This technology uses micro-cabling systems road cable, consisting of a rugged central copper tube that includes packages of 12 optical fibers. To impede water penetration, thixotropic gel is used to fill the cable, and a PE sheath covers the cable for identification purposes and corrosion resistance (Fig. 2b). A copper and PE coating provides sufficient protection and resistance for the cable (JETT Networks, n.d.).
The installation procedure for SMCI technology begins similarly to VIF; once measured, the layout is marked using a thread and spray paint. The trench is wet cut using a Husqvarna FS 4800 D. A vacuum and blower are then used to clean and dry the trench. With this technology, cable installation consists of three phases: laying FO cable in the trench, placing a layer of foam spacer over the cable, and placing a rubber strip over the spacer to secure the cable and foam spacer in the trench. The spacer is round and made from flexible closed cell foam to deter movement caused by freeze/thaw cycles and protect the cable from moisture and water ingress. The rubber strip is a heat- and chemical-resistant neoprene that holds and fixes the cable and foam spacer in place (Fig. 2b).
Surface reinstatement starts by filling the trench with a layer of play sand, which is uniformly graded and with a small particle size, followed by sealing the trench with hot bitumen to prevent water ingress. To reduce the hot bitumen’s stickiness before cooling down, the reinstated surface is coated with sand.
Installation specification
Installation specifications for the VIF technology and a cross section of the SMCI technology are provided in Table 1 and Fig. 3, respectively.
Fig. 3.
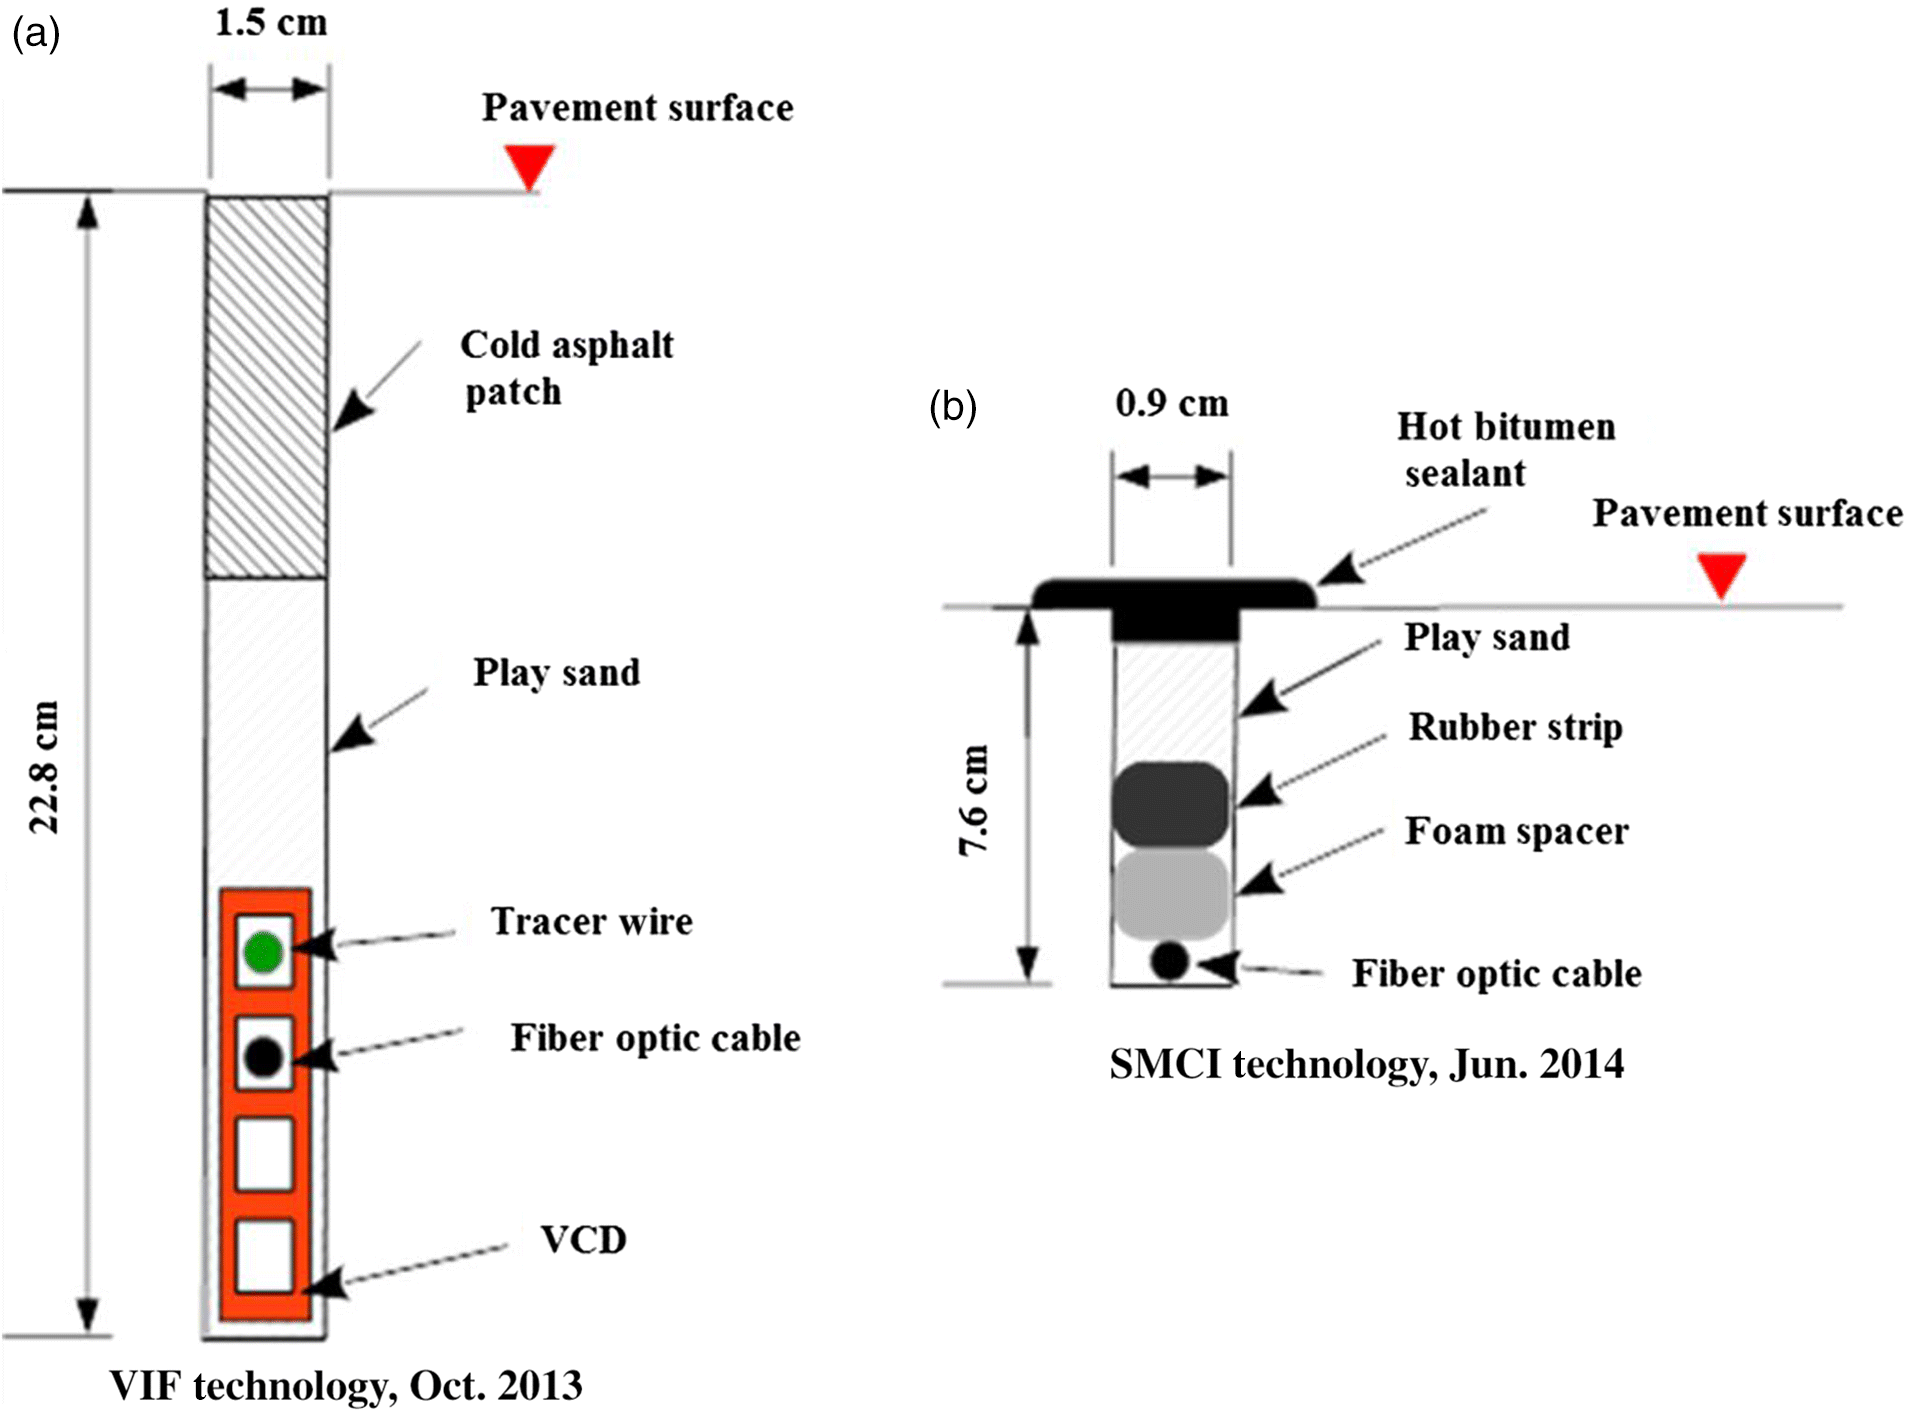
Table 1.
| Description | VIF technology | SMCI technology |
|---|---|---|
| Trench depth (cm) | 22 | 7.6 |
| Trench width (cm) | 1.5 | 0.9 |
| VDC thickness (cm) | 5.2 | N/A |
| FO cable thickness (cm) | 0.6 | 0.6 |
| Foam spacer thickness (cm) | N/A | 1 |
| Rubber strip thickness (cm) | N/A | 1.2 |
| Sand layer thickness (cm) | 7.2 | 3.8 |
| Hot bitumen sealer thickness (cm) | N/A | 1.27 |
| Cold asphalt layer thickness (cm) | 9 | N/A |
| Existing asphalt thickness (cm) | Almost 9 | Almost 9 |
Note: VDC, vertical deflecting conduit; FO, fiber optic; VIF, vertical inlaid fiber; SMCI, surface micro-cable inlay.
Installation monitoring results
The collected data from different construction and operational phases of the abovementioned installations enabled researchers to quantify different parameters including productivity rate and generated waste material, as well as physical integrity and the fiber’s optical performance.
Construction phase
Activity duration and productivity rate
Some activities in the micro-trenching process were completed with different crew sizes; therefore, the durations were normalized assuming a two-person crew. An exception was made for cutting the trench, as this step was completed with one cutter that required only a single person for operation. Table 2 contains the normalized durations and time distribution of activities for both installation technologies.
Table 2.
| VIF technology | SMCI technology | |||||
|---|---|---|---|---|---|---|
| Activity | Project length (m) | Activity duration (h) | Time distribution (%) | Project length (m) | Activity duration (h) | Time distribution (%) |
| Marking the layouts | 115 | 0.9 | 4.91 | 102 | 0.57 | 8.02 |
| Cutting the trench | 115 | 2.5 | 13.13 | 102 | 0.58 | 8.25 |
| Cleaning the trench and smoothing the corners | 115 | 7.2 | 38.57 | 102 | 3.38 | 47.88 |
| Cable installation | 115 | 2.1 | 11.43 | 102 | 0.97 | 13.68 |
| Reinstatement | 115 | 6.0 | 31.96 | 102 | 1.57 | 22.17 |
| Total | 115 | 18.67 | 100 | 102 | 7.07 | 100 |
Note: VIF, vertical inlaid fiber; SMCI, surface micro-cable inlay.
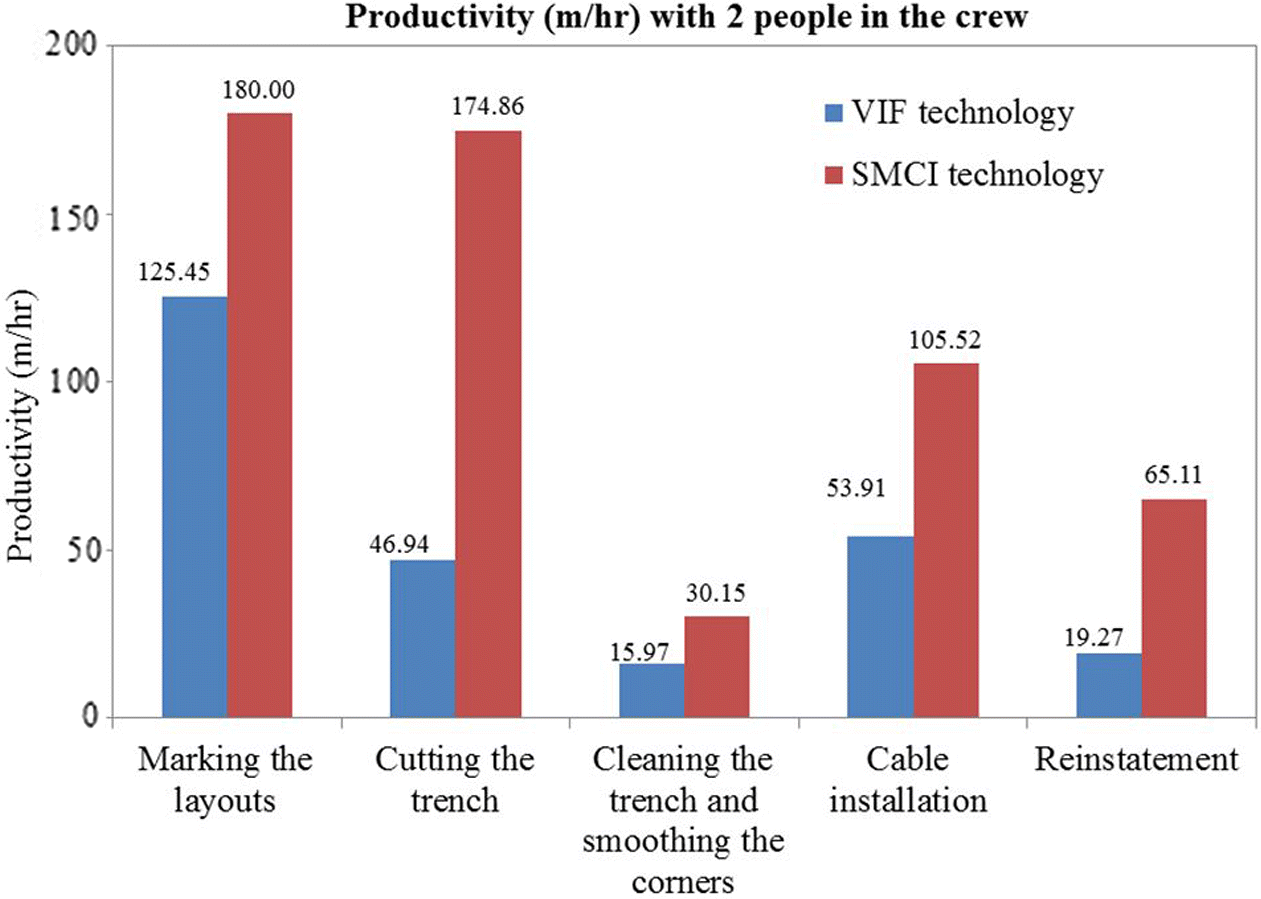
Figure 4 represents the measured productivity of each micro-trenching activity for both installation technologies using a two-person crew. For both technologies, marking the layout had the highest productivity rate among all activities, whereas cleaning the trench had the lowest productivity rate because it was the most time-consuming activity. Furthermore, the productivity rates of SMCI technology were significantly higher than VIF technology, which was due to the shallower depth of SMCI installations. Shallower depth results in less waste material, less required reinstatement material, and easier creation and reinstatement of the trench. The total micro-trenching productivity associated with VIF and SMCI technologies with a two-person crew was 6.2 and 14.4 m/h, respectively, and considering an 8-h workday, productivity rate was approximately 50 and 115 m/d, respectively. In total, the productivity of SMCI technology was approximately two times that of VIF technology. It should be noted that as the estimated productivities are only based on two pilot installations, they are not representative of micro-trenching productivity in general; however, the information could be valuable for comparisons with other micro-trenching techniques.
Fig. 4.
Generated waste
The excavation waste generated during this project consisted of soil and asphalt material. The volume of generated waste of both technologies was calculated using trench dimensions. The total approximate generated waste estimated was 0.42 and 0.07 m3 or 3586 and 710 cm3/m for VIF and SMCI installations, respectively.
Operational phase
To investigate performance and functionality of the installation technologies used in this study, GPR inspection and an OTDR test were performed.
GPR results
GPR is an electromagnetic, time-dependent technique that provides high-resolution images of shallow ground subsurfaces and can estimate the location and depth of buried objects. This equipment operates by scattering electromagnetic waves through material, which allows it to locate shallow underground objects via radio waves (Daniels 2000; Sensors & Software 2013).
The GPR system used was the Noggin250® made by Sensors & Software Inc. The unit operated at a frequency of 250 MHz, and both the transmitter and receiver were contained in a single unit. The unit incorporated an electronic encoder wheel and was connected to a real-time kinematic GPS system, allowing precise measurements of distances and locations. This unit was connected to a digital video logger (DVL) that captured and displayed the data, which could be viewed in real time and transferred to a laptop or PC.
In VIF technology, the tracer wire, inserted in the channels of VDC, is a copper-coated wire used to make the conduit more detectable by GPR when determining the location and its movement. To monitor the primary location of the conduit in the micro-trench after each installation, the first GPR inspections were conducted one month after the installations were completed. To investigate the effect of freeze/thaw cycles on the conduit movement, GPR inspections were continued after each winter. Figure 5 shows the GPR-inspected points in both the VIF and SMCI installations on 8 November 2013, 12 May 2014, 30 July 2014, and 4 May 2015.
Fig. 5.
To investigate the physical integrity of the installation, conduit location was detected using GPR. Figures 6a–6c show the conduit profile of Layouts 1(A), 2(B), and 3(C) for VIF technology. It must be noted that the conduit profilewas obtained using its depth relative to the surface. In Layout 3(C), the loop is unfolded, and the conduit profile is provided. Points C5, C7, and C10 were located in the bends of the layout (the intersection of straight lines).
Fig. 6.
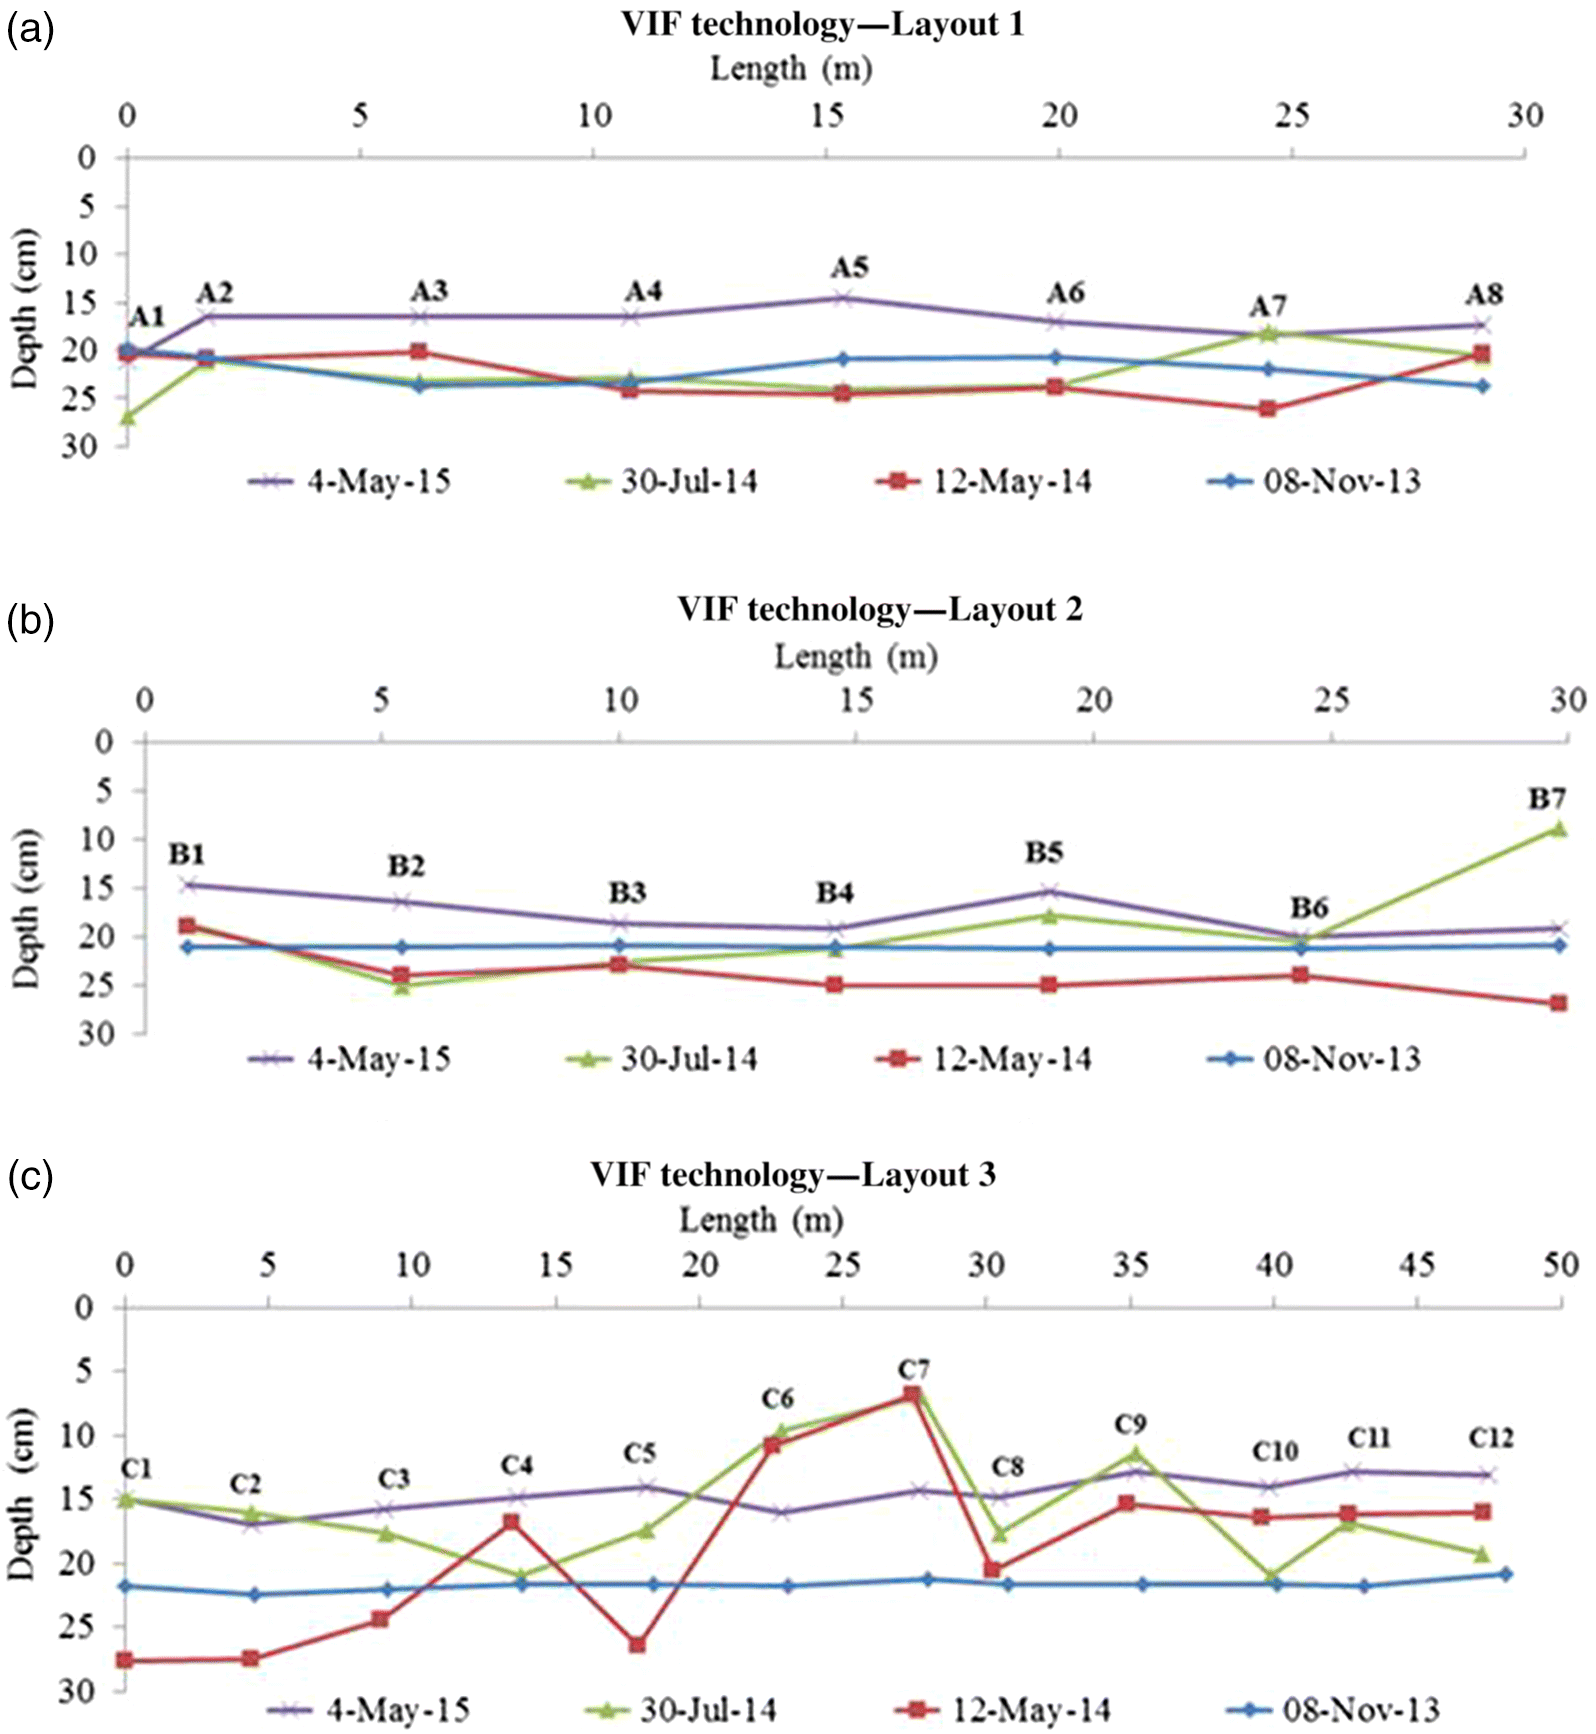
Figures 6a and b show that both Layouts 1 and 2 were in relatively good condition with little vertical displacement toward the surface, except at point B7, which had a shallow depth of 8.8 cm according to the GPR inspection in July 2014. However, it moved downward and now has a depth of 19 cm according to a recent GPR inspection. In addition, in the northeast corner of Layout 3 (loop layout), the conduit depth was significantly shallower than its initial depth in July 2014. In Fig. 6c, it can be seen that C7 and C6, with respective depths of 7 and 9.7 cm according to the GPR inspection in July 2014, were the shallowest points of the conduit profile in Layout 3 and had respective approximate displacements of 14 and 12 cm toward the surface. However, C6 and C7 moved downward and their current depths are 16 and 14 cm, respectively, according to recent GPR inspections. These three points (C6, C7, and B7) were in a more direct path of traffic compared with other points, as depicted in Fig. 1.
Recent GPR inspections demonstrated that although the three layouts showed no significantly shallow points, the installations have moved upward from their installed depth (November 2013). Layout 3(C) has an average depth of 14.55 cm (compared with 21.5 cm in November 2013); this value is 17.4 cm for Layout 1(A) and Layout 2(B) (compared with 21.5 cm in November 2013).
It can also be concluded that traffic load causes increased conduit movement in layouts with bends compared with strictly straight layouts. In loop layouts, the conduit had increased upward and downward movements, which may have been the result of stresses induced in the bent portions of the layout.
To validate movements measured with GPR, three specific points (C6, C7, and B7) were excavated, and the locations of the conduit were measured manually. Table 3 shows the GPR measurements versus the observed depths in the excavated sections in July 2014. The observed depths matched the GPR results; this verified that GPR measurements were reliable and correct. The consistent, approximate 1.5 cm difference between the GPR results and the observed depths occurs because the GPR measures the depth of the wire tracer within the conduit channel, whereas the observed depth measures the depth of the top of the conduit.
Table 3.
| Point ID | GPR depth (wire tracer depth) (cm) | Observed depth (top of the conduit) (cm) |
|---|---|---|
| C6 | 9.7 | 8.0 |
| C7 | 7.0 | 5.5 |
| B7 | 8.8 | 6.0 |
Note: GPR, ground-penetrating radar.
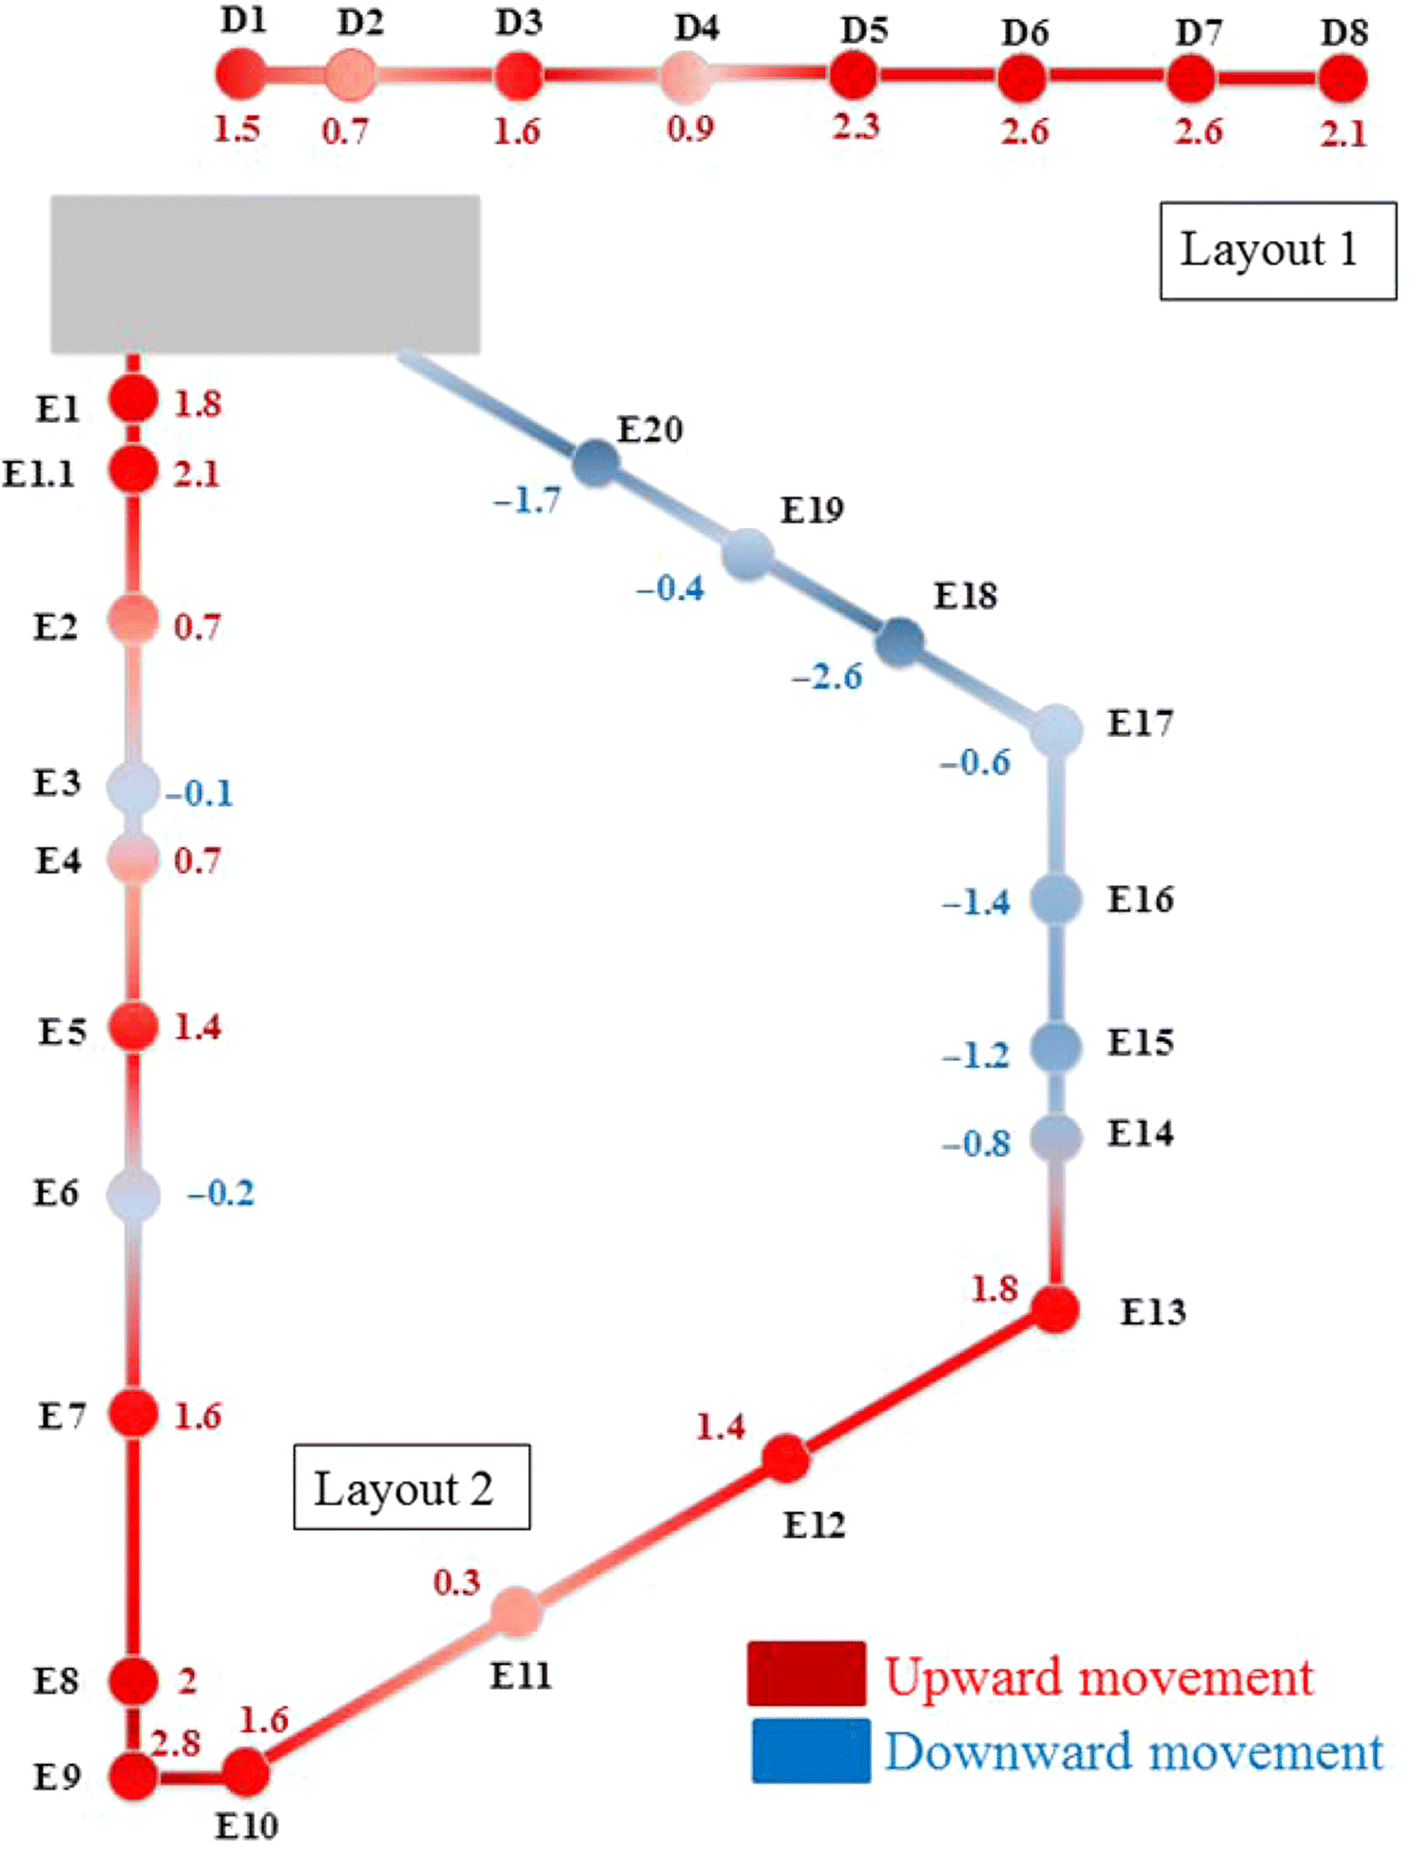
Figures 7a and b show the conduit profile of Layouts 1(D) and 2(E) for SMCI technology. It must be noted that the conduit profile was obtained using its depth relative to the surface. In Layout 2(E), the loop is unfolded, and the conduit profile is provided. Points E9, E10, E13, and E17 were located in the bends of the layout (the intersection of straight lines).
Fig. 7.
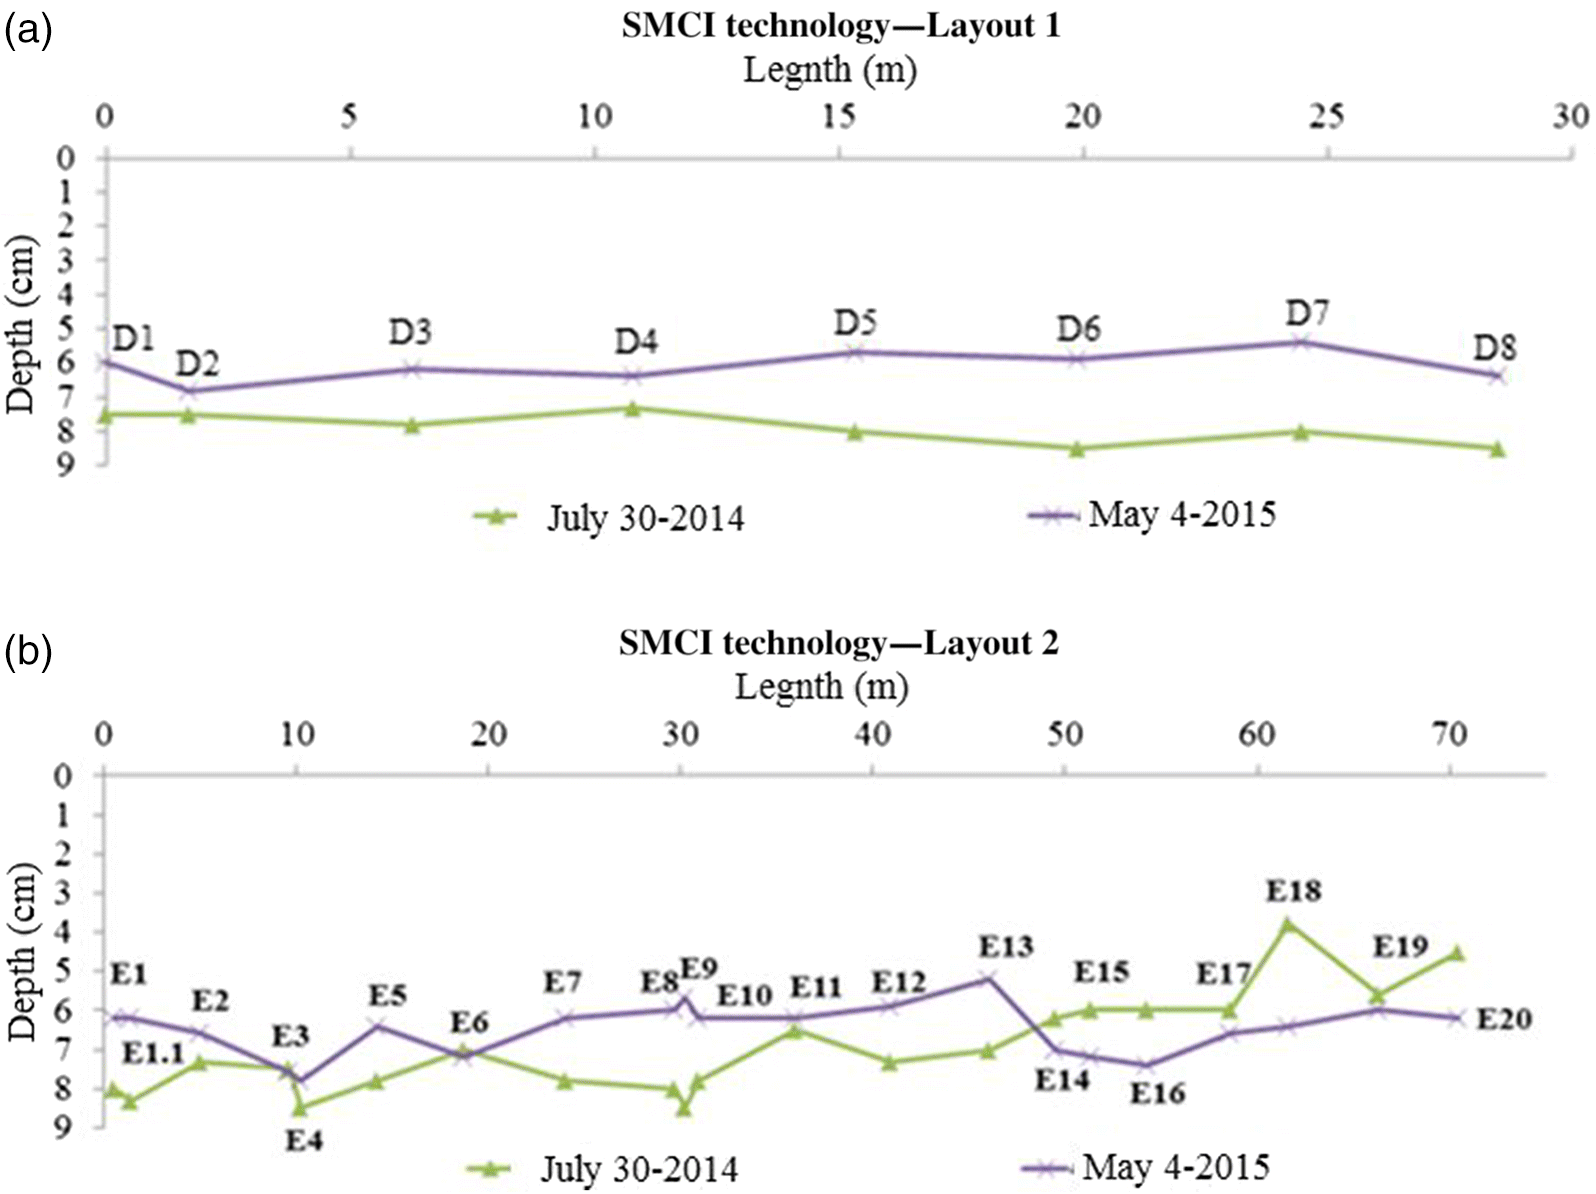
The GPR results indicated that there was minimal fluctuation in the upward and downward movements in these installations; however, the installations had an average upward movement toward the surface of 1.7 cm in the straight layout (D) and 0.44 cm in the loop layout (E). The low fluctuation suggests that using a rubber strip and foam spacer to stabilize the cable in the trench is a promising technique, but the installation needs to be inspected for several years to draw stronger conclusions about its effectiveness.
Figures 8a–8c and 9 show the seasonal movement of the conduits for both the VIF and SMCI installations from November 2013 to May 2014 (winter), May 2014 to July 2014 (summer), and July 2014 to May 2015 (winter). Negative signs indicate downward movement of the conduits, whereas positive signs indicate upward movement, both of which were measured in centimeters.
Fig. 8.
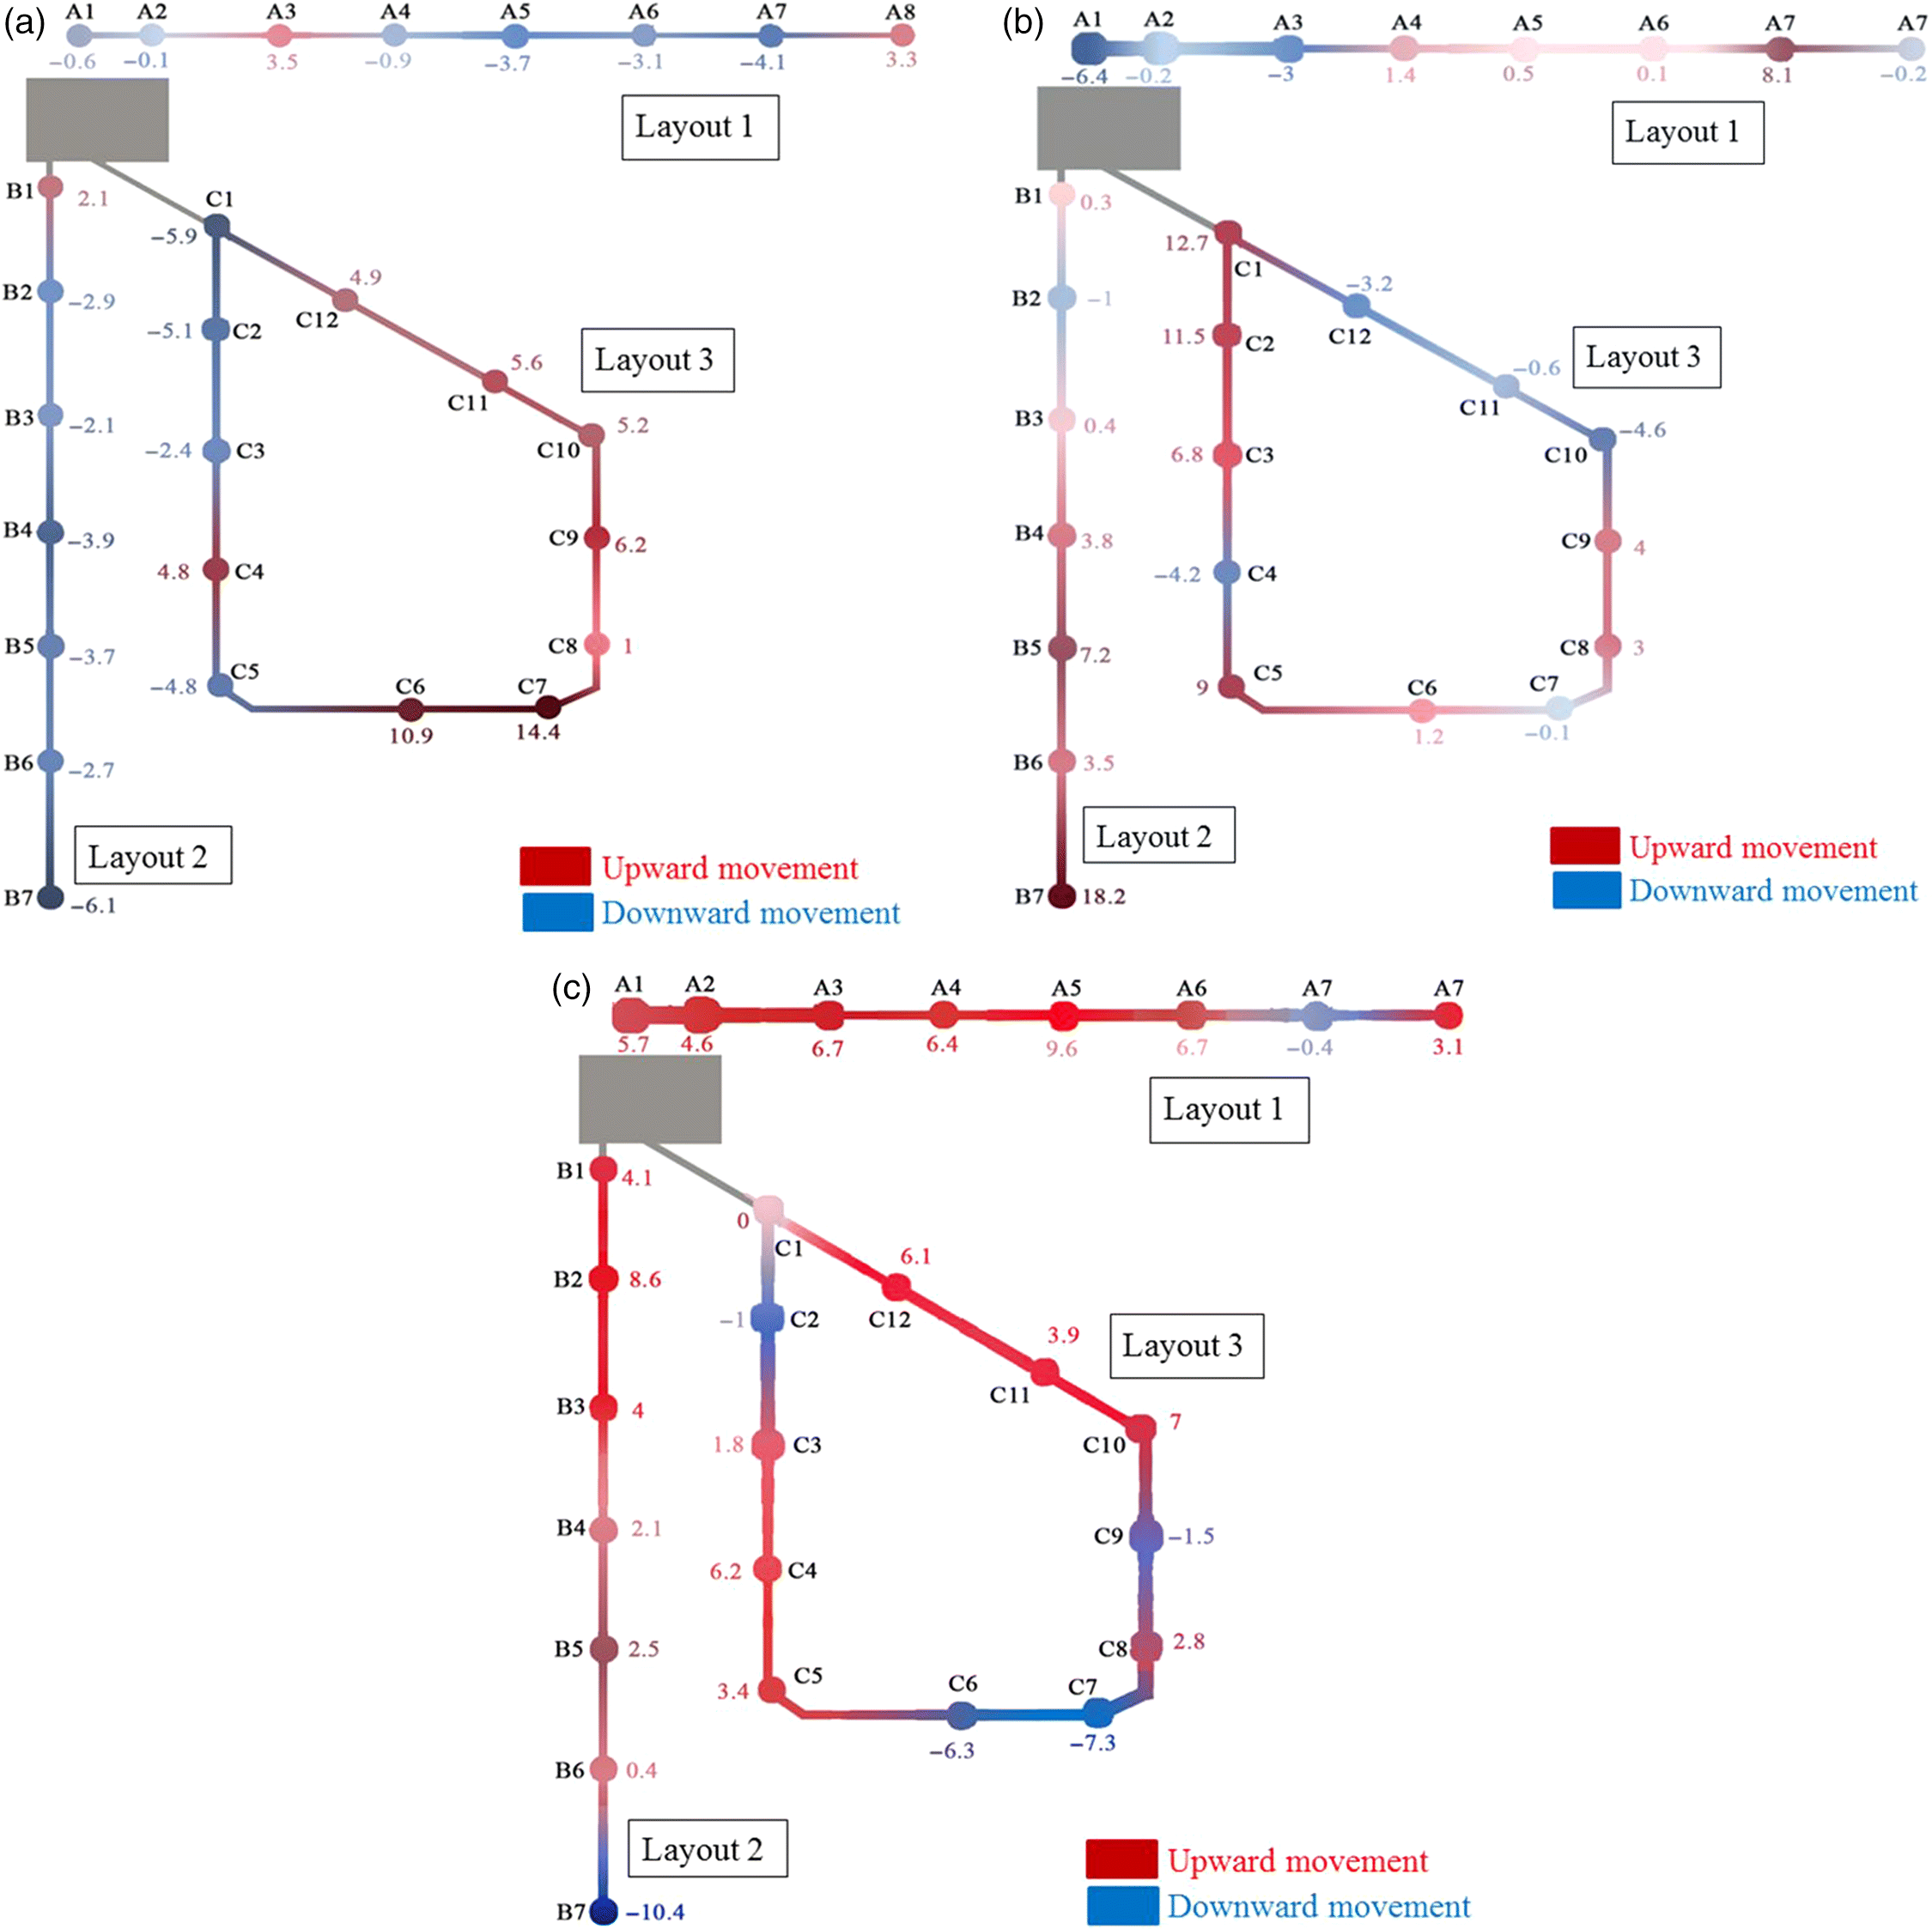
Fig. 9.
In the VIF installations in winter 2014 (Fig. 8a), Layouts 1(A) and 2(B) experienced downward movements of up to 6 cm, with the exception of points A3, A8, and B1. The straight section of the loop layout (C) experienced the same movement, with the exception of C4. Conversely, C10–C12 had upward movements of approximately 5 cm. In addition to A3, A8, B1, and C4, these points followed a different trend due to conduit rigidity. When a portion of the conduit rose toward the surface, the other sections sank to maintain conduit stability. In addition, the northeast corner of the loop layout (C6, C7, C8, and C9) had lifted significantly toward the surface.
In the summer of 2014 (Fig. 8b), conduit in Layouts 1(A) and 2(B) moved toward the surface, most significantly at B7 with an upward movement of 18 cm; however, A1 and A3 in Layout 1 experienced downward movements of 6 and 3 cm, respectively. The straight section of Layout 3(C) experienced similar conditions, with an upward movement of 6–12 cm toward the surface at all points except C4. The conduit had little movement in C6 and C7 as maximum movement occurred in winter, and the asphalt layer impeded further upward movement. C10 through C12 and C4 moved downward in response to upward movement in other sections of the loop due to conduit rigidity and stability maintenance.
In winter 2015 (Fig. 8c), Layouts 1(A) and 2(B) moved toward the surface up to 9.6 cm, except at point B7, which had a downward movement of 10 cm. In addition, in Layout 3(C), the conduit moved upward up to 7 cm, except at points C6 and C7, which had a downward movement of 6 and 7 cm, respectively. Points C6 and C7 had the shallowest depths according to the July 2014 GPR inspection.
In the SMCI installation in winter 2015 (Fig. 9), Layout 1(D) and the straight section of Layout 2(E) moved toward the surface up to 2.8 cm. However, the other section of the loop Layout 2(E) had a slight downward movement up to 2.6 cm.
According to TeraSpan (2013), the shallow depth observed at the selected points is an installation-related issue. Specifically, certain points may not have been excavated as deeply due to obstacles within the ground or hard ground surface conditions. As a result, the conduit could not be placed deeply enough, and compression on either side of the spot creates potential for upward movement. The only solution for this issue is to ensure that the trench is clean and the depth is consistent along the installation length (TeraSpan, personal communication, 2014).
The quality of the micro-trench’s reinstatement plays an important role in preventing vertical movement of the cable or conduit. Based on the research results from the VIF installation, using sand and cold asphalt above the installed conduit is not a viable solution for trench reinstatement in cold regions. The material used in this step must flow easily inside the trench and stabilize the conduit in its place, thereby preventing future vertical displacement. Additional research is suggested to focus on reinstatement modification toward better stabilizing the conduit in the trench and, ultimately, preserving road strength.
OTDR result
OTDR is an instrument used for investigating the integrity of the FO cables and measuring optical power loss associated with FO cables due to different elements such as splices, cable, or connectors (The Fiber Optic Association 2014). This instrument provides a graphical display of optical loss of the system, which is referred to as a signature trace (Corning Cable Systems 2002). The optical trace is useful for visual purposes and troubleshooting (Corning Cable Systems 2009).
To investigate the optical performance of FO cable in the loop layout, an EXFO FTB-1 OTDR was used several times following the project’s installation. The OTDR tested the cables with a 1310 nm wavelength and 50 ns pulse width. Fiber span refers to the length of fiber that the OTDR investigates (Corning Cable Systems 2009). Several OTDR tests were performed, and the span losses of fibers are provided in Table 4.
Table 4.
| Fibers | 20 November 2013 (−18 °C) | 6 January 2014 (−10 °C) | 22 January 2014 (−8.7 °C) | 29 April 2014 (18 °C) |
|---|---|---|---|---|
| 1 | 0.258 | 0.246 | 0.253 | 0.246 |
| 2 | 0.245 | 0.289 | 0.176 | 0.243 |
| 3 | 0.245 | 0.251 | 0.257 | 0.243 |
| 4 | 0.258 | 0.233 | 0.239 | 0.253 |
| 5 | 0.260 | 0.241 | 0.239 | 0.253 |
| 6 | 0.222 | 0.235 | 0.23 | 0.239 |
| 7 | 0.258 | 0.238 | 0.236 | 0.240 |
| 8 | 0.249 | 0.265 | 0.272 | 0.239 |
| 9 | 0.237 | 0.241 | 0.243 | 0.245 |
| 10 | 0.249 | 0.215 | 0.238 | 0.269 |
| 11 | 0.250 | 0.259 | 0.22 | 0.226 |
| 12 | 0.221 | 0.228 | 0.245 | 0.247 |
Note: OTDR, optical time-domain reflectometer.
According to TELUS Communications regulations, 0.5 dB/km is the maximum allowable loss in a fiber span. In this project, the total length of fiber was 0.7048 km; therefore, the maximum allowable span loss is 0.7048 × 0.5 = 0.3524. The total span losses equate to less than 0.3524, which means the current cable performance is acceptable.
Summary and conclusions
Micro-trenching is a new, less-invasive FO deployment method used in business districts and congested urban areas as the environmental impacts and community disruption associated with its operations are significantly lower than those of traditional installation methods. However, due to its shallow depth, installations may be easily impacted and damaged by thermal expansion/contraction, ground freeze/thaw cycles, and frost heave.
To investigate micro-trenching’s viability in cold regions, a pilot installation was performed with two micro-trenching technologies (VIF and SMCI) in October 2013 and June 2014, respectively. Installations will be monitored over several years to evaluate the techniques’ viability.
In both technologies, cleaning the trench and smoothing its corners were the most time-consuming activities, followed by trench reinstatement. Overall, SMCI technology had a higher productivity rate than VIF technology. However, the risk of FO damage when using SMCI technology is greater due to the shallow installation depth.
Both GPR inspections and OTDR tests were performed for VIF technology beginning in November 2013. Although monitoring of the installation is an ongoing process that requires several years for accurate performance evaluation, results gathered from 2013 to 2015 for VIF technology suggest that optical performance has not changed. However, according to the GPR results of May 2014, the conduit has risen to 14 cm at point C7, which is located in the traffic zone. Comparing this value to the initial installation depth of 22 cm, 65% vertical movement of the conduit occurred in the trench. Upward and downward movements also occurred in the loop layout, which may be caused by the induced stress associated with bends in the conduit within the layout. At most points, the conduit moved downward in cold weather conditions and rose in the summer, possibly due to the thermal expansion of the conduit. In VIF technology, a comparison of the initial and recently obtained GPR results indicates that the whole installation moved upward 3–7 cm; for SMCI technology, this value ranges between 0.44 and 1.7 cm.
Monitoring the results suggests that the SMCI method of using a foam spacer and rubber strip to fix the cable in the trench is an effective technique. The significant conduit movements confirm that the reinstatement procedure is critical to micro-trenching installations, especially in cold regions. Reinstatement material should be fine enough to easily fill the narrow trench; however, it must also hold the conduit and cable in place to prevent upward movement. The results of this study suggest that both of the investigated reinstatement methods were not sufficiently reliable for widespread FTTH installation, and improved reinstatement methods are required to stabilize the conduit in the trench and preserve road strength.
It should be noted that these research results are limited to monitoring only two micro-trenching installation methods. Additional research is needed to identify the best micro-trenching installation methods and backfilling materials for cold region applications.
Acknowledgements
The authors would like to thank TELUS Communications and MITACS for their financial and in-kind support in this research. TeraSpan and Jett Networks are also acknowledged for conducting field installations and their technical contributions. The authors’ appreciation is also extended to Dr. Mahmood Salimi and Dr. Yolanda Alberto Hernandez for their academic guidance and Ms. Delaina Lawson for editorial review of this paper.
References
Atalah A, Chang-Jin C, and Osburn K. 2002. Comparison study of installing fiber optic cable in university campuses using trenchless techniques relative to open cut. In Pipelines Division Specialty Conference 2002, Cleveland, Ohio, ASCE, pp. 1–17.
Corning Cable Systems. 2002. “Ghost” reflections on the optical time domain reflectometer (OTDR) [online]: Available from csmedia.corning.com/CableSystems//Resource_Documents/application_engineering_notes_rl/AEN050.pdf.
Corning Cable Systems. 2009. OTDR testing basics [online]: Available from csmedia.corning.com/CableSystems/%5CResource_Documents%5Capplication_engineering_notes_rl%5CAEN134.pdf.
Crandall RW, Lehr W, and Litan R. 2007. The effects of broadband deployment on output and employment: a cross-sectional analysis of US data. Issues in Economic Policy, no. 6, pp. 2–35 [online]: Available from brookings.edu/wp-content/uploads/2016/06/06labor_crandall.pdf.
CSMG. 2010. Economics of shared infrastructure access [online]: Available from stakeholders.ofcom.org.uk/binaries/consultations/wla/annexes/csmg.pdf.
Czernich N, Falck O, Kretschmer T, and Woessmann L. 2011. Broadband infrastructure and economic growth. The Economic Journal, 121(552): 505–532.
Daniels JJ. 2000. Ground penetrating radar fundamentals. Department of Geological Sciences, The Ohio State University, Columbus, Ohio.
Department for Culture Media & Sport (DCMS). 2011. Microtrenching and street works: an advice note for local authorities and communications providers, UK government [online]: Available from gov.uk/government/publications/microtrenching-and-street-works-an-advice-note-for-local-authorities-and-communications-providers.
Dura-Line. 2016. Recommended procedures for conduit microtrenching and restoration. Technical Bulletin DCEB-10002. 21 pp.
GM Plast. 2013. Micro trenching with flatliner [online]: Available from gm-plast.dk/_upload/catalog_products_files/2/microtrenching.pdf.
Holt L, and Jamison M. 2009. Broadband and contributions to economic growth: lessons from the US experience. Telecommunications Policy, 33(10): 575–581.
International Telecommunication Union (ITU). 2003. SERIES L: Construction, installation and protection of cables and other elements of outside plant. Micro-trench installation technique. ITU-T Recommendation L.49, 5 pp [online]: Available from www.itu.int/rec/T-REC-L.49-200303-I/en.
JETT Networks. n.d. JETT networks fiber optics solutions. JETT Networks Communication Technologies, Vancouver, British Columbia, Canada [online]: Available from jett.ca/index.php?/Fibre-Optic-Content/jett-tel-fibre-optics-solutions.html.
Jeyapalan JK. 2007. The pipe is there: using existing infrastructure to speed FTTH deployment, North American water, gas, sewer and electric utilities should be getting into the fiber network business, as they are in Europe. Here’s why. Broadband Properties. pp. 61–70 [online]: Available from broadbandproperties.com/2007issues/march07issues/jey_mar.pdf.
Liteaccess Technologies Inc. 2010. Micro-trenching gives big returns for broadband. Liteaccess Technologies Inc., Richmond, British Columbia [online]: Available from cdn-3.psndealer.com/e2/dealersite/images/calditchwitch/microtrenching%20article.pdf.
Network Strategies. 2008. Micro-trenching: can it cut the cost of fibre to the home? Network Strategies, Auckland, New Zealand [online]: Available from strategies.nzl.com/wpapers/2008019.htm.
Osbak M, Akbarzadeh H, Bayat A, and Murray C. 2012. Investigation of horizontal directional drilling construction risks. No-Dig Show 2012. North American Society for Trenchless Technology, Nashville, Tennessee, pp. 1–7 [online]: Available from member.nastt.org/products/product/2012-e-4-01.pdf.
Sensors & Software. 2013. What is GPR [online]: Available from sensoft.ca/FAQ.aspx.
Stirling Lloyd Polychem Ltd. 2011. Highway maintenance, micro-trenching product in action: Shetland fiber optic network. Stirling Lloyd Polychem Ltd., Knutsford, UK.
TeraSpan. 2013. Vertical inlaid fiber (VIF). TeraSpan Networks, Vancouver, British Columbia, Canada [online]: Available from teraspan.com/vif.php.
The Fiber Optic Association. 2014. Optical time domain reflectometer (OTDR) [online]: Available from thefoa.org/tech/ref/testing/OTDR/OTDR.html.
Information & Authors
Information
Published In

FACETS
Volume 2 • Number 2 • January 2017
Pages: 642 - 659
Editor: Bushra Waheed
History
Received: 11 August 2016
Accepted: 23 June 2017
Version of record online: 17 August 2017
Copyright
© 2017 Vaseli et al. This work is licensed under a Creative Commons Attribution 4.0 International License (CC BY 4.0), which permits unrestricted use, distribution, and reproduction in any medium, provided the original author(s) and source are credited.
Data Availability Statement
All relevant data are within the paper.
Key Words
Sections
Subjects
Authors
Author Contributions
All conceived and designed the study.
All performed the experiments/collected the data.
All analyzed and interpreted the data.
All contributed resources.
All drafted or revised the manuscript.
Competing Interests
The authors have declared that no competing interests exist.
Metrics & Citations
Metrics
Other Metrics
Citations
Cite As
Hediyeh Vaseli, Leila Hashemian, Alireza Bayat, Leon Gay, Ian Williams, and Jordan Melzer. 2017. Evaluation of fiber optic installation methods, a case study on micro-trenching in Alberta, Canada. FACETS.
2(): 642-659. https://doi.org/10.1139/facets-2016-0043
Export Citations
If you have the appropriate software installed, you can download article citation data to the citation manager of your choice. Simply select your manager software from the list below and click Download.
Cited by
1. Justification of the possibility of laying cable communication lines at the side of roads
2. Field study on understanding effects of micro-trenching on structural performance of asphaltic pavement