Responses to chemical and physical stressors are commonly expected among organisms residing near the Athabasca oil sands. Physiological effects have been observed in fishes during field studies; but further effects associated with development are not clear or consistent among species. For instance, data from a fish fence in 2009 show declines in the relative abundances of some species, including Arctic grayling (Thymallus arcticus). In contrast, increases were seen in white sucker (Catostomus commersoni). This divergence suggests incomplete understanding of the status of fishes residing near the oil sands. However, an important challenge limiting understanding is the lack of reliable baseline or reference data. To overcome this challenge, we used iterative normal ranges and a historical data set (electrofishing surveys done from 1987 to 2014) to determine if changes have occurred in fishes captured in the lower Athabasca River. These analyses revealed clear increases in the lengths of white sucker and walleye (Sander vitreus) and their relative abundances during the spawning season. The occurrence of these changes may be associated with overwintering location, but reduced fishing pressure in Lake Athabasca, eutrophication, or a cumulative effect may explain the form of changes detected in this study.
Introduction
Environmental concerns pervade oil sands activities in northern Alberta (Schindler 2010). Much of the focus of studies to evaluate the concerns has targeted chemical stressors accumulating in various environmental media (Kelly et al. 2009; Kurek et al. 2013). Among chemical stressors, oil sands constituents, including polyaromatic compounds (PACs) and metals, have been found in snow close to mines (Kelly et al. 2009, 2010) and may migrate into local waterbodies where effects in aquatic organisms may occur. Recent work suggests loads of total metals are higher in tributaries during freshet in years with low pH snowmelt (<6.5; Alexander et al. 2017). Loading of PACs in the sediments of local and regional lakes (Kurek et al. 2013) and depositional areas of some local rivers (Evans et al. 2016) has also increased over time suggesting the influence of local oil sands activity. Although the accumulation of oil sands constituents has been observed in various environmental media, the association with biological effects in the local aquatic environment is less clear. Acute toxicity and changes in the physiology of early life stages of fish after exposure to oil sands constituents have been observed in laboratory experiments (Colavecchia et al. 2006). Acute toxicity to early life stages of fish may be a relevant indicator, but documenting changes using this measurement can be challenging in field settings. Changes in fish associated with chemical stressors have also been observed during field studies, but the detected differences are largely limited to the induction of biochemical markers of exposure, occurrence of PACs in fish muscle, PAC biotransformation products, and changes in reproductive physiology (Tetreault et al. 2003; Ohiozebau et al. 2016, 2017; Arens et al. 2017).
Although biota in the oil sands region show biochemical and physiological indications of exposure, the full extent of effects in aquatic organisms in response to anthropogenic loading of metals or PACs is not currently known. Documenting change in field studies using reproductive physiology in adults may, in many cases, be simpler than acute toxicity to early life stages of fish, but the consequences of either may emerge over time as reduced abundance of fish captured during field surveys (Gibbons and Munkittrick 1994). Although documenting declines in relative abundance may be rare in the oil sands region, some work has shown this response in some species (RAMP 2010; Schwalb et al. 2015). Declines in abundance of three migratory species, mountain whitefish (Prosopium williamsoni), longnose sucker (Catostomus catostomus), and Arctic grayling (Thymallus arcticus) were documented using data from a series of fish fences in the Muskeg River (RAMP 2010; Schwalb et al. 2015). The declines first appeared between 1977 and 1995, but also persisted until 2009, the most recently reported data from a fish fence in the Muskeg River (Schwalb et al. 2015). In contrast to chemical exposure, these changes were attributed to altered hydrology and increased landscape disturbance (Schwalb et al. 2015), another concern in the oil sands region. Although the declines in these three species were clear when compared with the data from 1976/1977, until 2006 they were also accompanied by reduced abundance of white sucker (Catostomus commersoni). In contrast to mountain whitefish, longnose sucker, and Arctic grayling, the declines in white sucker reversed in 2009. In that year, the largest recorded upstream migration of white sucker into the Muskeg River was observed (RAMP 2010; Schwalb et al. 2015). These findings suggest heterogenous and complex dynamics among fish populations utilizing the Athabasca River and its tributaries near the oil sands mines. The contrasting results further suggest additional work is needed to identify or clarify the status of aquatic organisms residing in the oil sands region.
Studies addressing the ongoing and growing need for information on the status of biota in the oil sands region are underway (AEMERA and ECCC 2016). Despite the intense effort across multiple media and receptors similar to other monitoring programs, studies in the oil sands are affected by persistent and widespread challenges. A primary difficulty in ecological monitoring is the lack of information describing the undisturbed baseline conditions. This information is necessary for a widely discussed and ideal design, before-after-control-impact (BACI; Smokorowski and Randall 2017). Where data to fulfill the BACI design or its variants are not available, other study types such as paleolimnology may be employed (Kurek et al. 2013). If paleolimnology or other techniques based on environmental archives are not appropriate for the focus of a study, such as riverine fishes, other approaches are needed. A common alternative design uses reference and exposure sites sampled only during the “after” period, but identifying effects with these designs can be challenging (Munkittrick et al. 2002). In the absence of data to fulfill a BACI design, a desire to examine certain ecological receptors, and uncertainty in the realtionships between reference and exposure locations, additional approaches are required to rigorously examine data.
Recently, the general concept of adaptive monitoring has been proposed to accommodate and overcome several challenges commonly affecting ecological monitoring, including cases with uncertain reference and missing baseline data (Arciszewski et al. 2017). The analyses in adaptive monitoring program often focus first on changes at a given location over time reducing the primary reliance of analyses on reference sites (Arciszewski and Munkittrick 2015). In place of a robust estimate of an undisturbed baseline, an initial estimate can be derived, often from the first three years of data at a site. The initial estimate is made without assuming the existing conditions are acceptable, but does assume organisms can respond in measurable ways to new, modified, or progressively influential stressors (Arciszewski and Munkittrick 2015; Arciszewski et al. 2017). This initial estimate of existing data, commonly set at 95%, is used to define a range of values predicted to occur in the future, assuming conditions influencing the biological attributes have remained stable over time. Statistically unexpected observations suggest that the predicted range is erroneous (i.e., the observed difference originates from uncaptured normal variation), the observed difference is attributable to the built-in error rate (α), or the drivers affecting the measured endpoint are changing. If a statistically unexpected difference is identified, confirmation of changes is sought to reduce inference errors and provide confidence in the conclusions (Hodson et al. 1996). In addition to confirmation, supporting evidence from parallel studies or more detailed, specific, and future studies may also be initiated to explore any hypothesized causes of the changes observed. In contrast, if no likely differences are observed, a new estimate of an expected range of observations is derived, including the new information (Arciszewski et al. 2017).
Although adaptive monitoring is intended for prospective studies, the process and tools can also be applied retrospectively. An historical data set that has not been thoroughly examined following an adaptive approach and that may contain valuable information on the state of fishes in the Athabasca River is known as the “fish inventory”. The inventory was a boat electrofishing program initiated by Syncrude in the spring of 1987 (Hatfield Consultants Partnership et al. 2016). Fall and summer collections were added in 1989 and 1990, respectively (Hatfield Consultants Partnership et al. 2016). In 1997, the fish inventories were embedded in the Regional Aquatics Monitoring Program (RAMP; Hatfield Consultants Partnership et al. 2016). Collections for the fish inventory continued until 2014. During recent reviews, the relevance and capabilities of the program were criticized (Main 2010), and like many historical data sets, the fish inventory is necessarily constrained. Consequently, any analyses using these data have important limitations, including the questions that can be addressed, the strength of the conclusions drawn, and the additional sources of information that can be accessed. Despite this, the fish inventory data have some beneficial attributes. Data records from the inventory are extensive. Records include effort, individuals and species captured, and length and weight for many individuals. Subsets of fish were also aged and some were sexed. Although collections started 20 years after the first commercial development, oil sands production in the first year of the fish inventory (1987) was less than 14% of production in the final year of sampling (2014; CAPP 2016). The increase in production from 1987 to 2014 included both the expansion of existing developments and opening of new mines and in situ facilities (Fig. 1). Sites used in the inventory also span the length of the Athabasca River in the minable area of the oil sands. The duration, period of coverage, volume of data, and spatial coverage of the fish inventory data may outweigh the absence of detailed baseline information collected prior to any development.
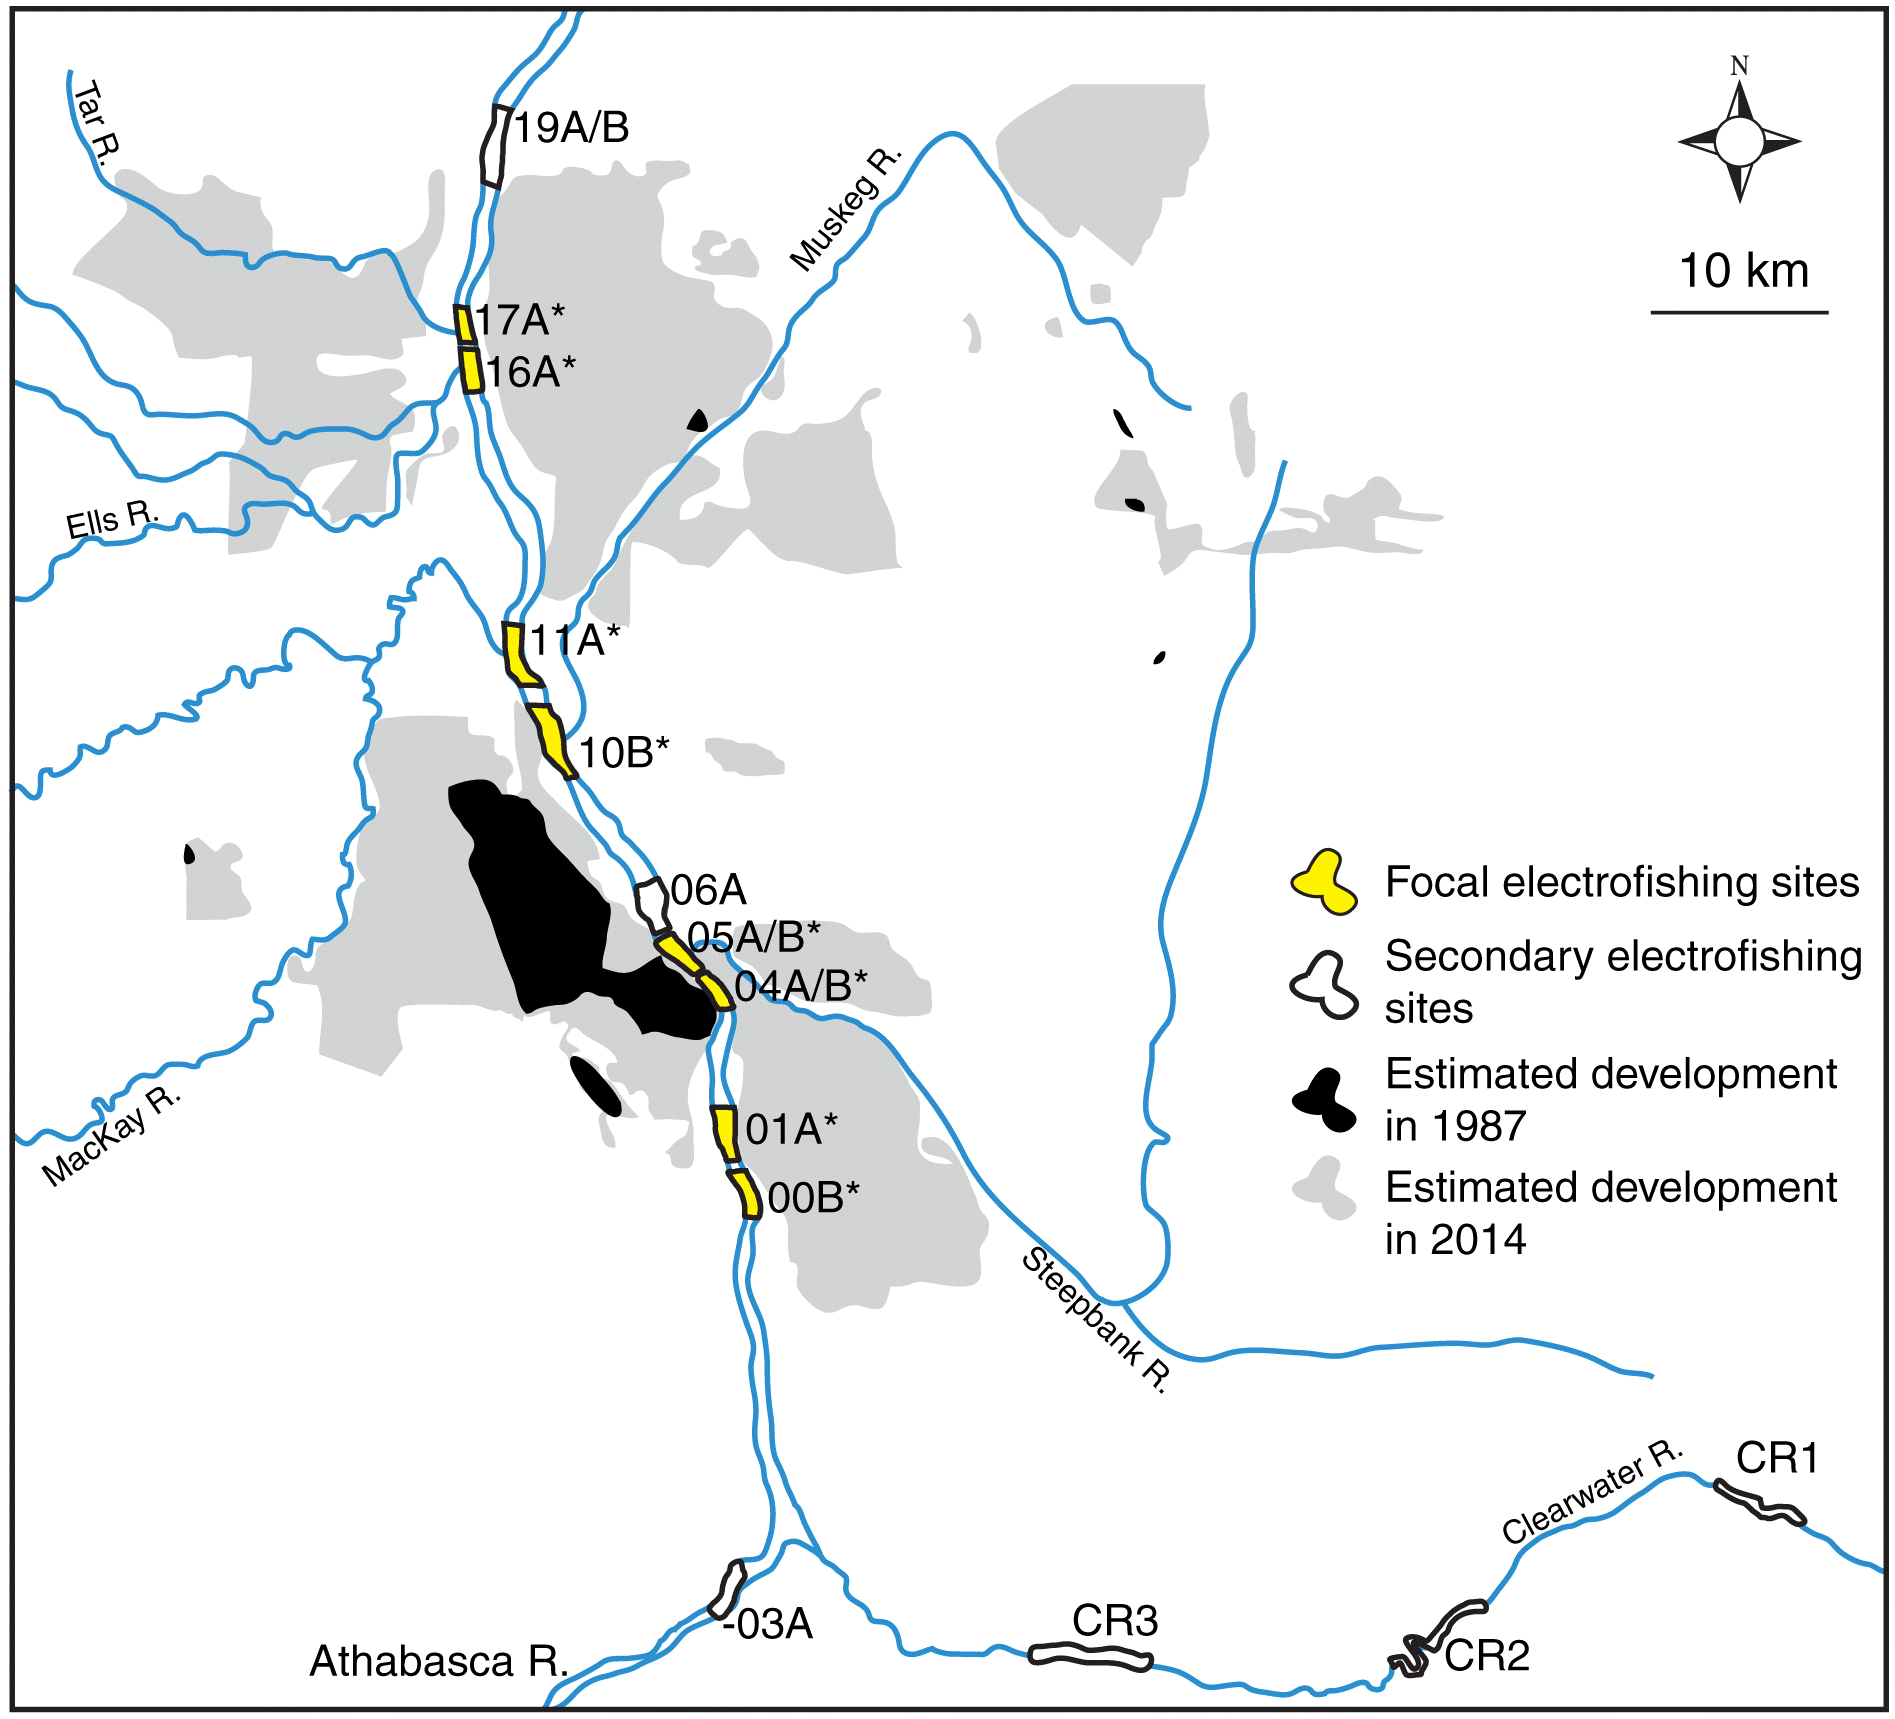
Fig. 1.
Fig. 1. Fish inventory locations and approximate extent of oil sands facilities in 1987 and 2014. Focal electrofishing sites examined are marked with asterisks. xxA locations were sampled along the western shore of the Athabasca River; xxB locations were sampled along the eastern shore of the Athabasca River. Historical map data (30 December 1987 and 30 December 2014): Google, Landsat/Copernicus.
The intention of this paper is to determine if any evidence of changes in fishes residing in the Athabasca River near oil sands facilities is present in the fish inventory data. Based on the initial analyses on white sucker and walleye, hypotheses to explain the observations, including reduced fishing pressure and eutrophication, were formed. To scrutinize and explore these hypotheses, additional data including other species, relative abundance, commercial fishing records, nutrient concentrations, and discharge were sought.
Methods
Fish inventory data set
The fish inventories of the Athabasca River were done during the spring (May–early June), summer (late June–August), and fall (September–October) irregularly between 1987 and 2002. Fish inventories were done in most spring, summer, and fall seasons between 2003 and 2014. At its peak, boat electrofishing was used to sample fishes at study reaches from upstream of Fort McMurray (-03B) to downstream of the Calumet River (19A, 19B; Fig. 1). Until 2003, fishing reaches were not strictly standardized, but did occur in roughly similar locations, including near the mouths of tributaries. After 2003, the locations were standardized with fixed starting and ending coordinates based on approximations of earlier reaches (Hatfield Consultants Partnership et al. 2016). The focus of the program has also evolved over time, limiting the ability to analyze data for some of the species. Prior to 2003, collections primarily focused on key indicator resource species, including walleye (Sander vitreus), white sucker, northern pike (Esox lucius), goldeye (Hiodon alosoides), and lake whitefish (Coregonus clupeaformis). In contrast, collections after 2002 extended equal priority to small-bodied fishes, such as slimy sculpin (Cottus cognatus), and increased the number of study reaches; 06A, -03B, 19A, 19B. Sites in the Clearwater River were added in 1999 (Fig. 1). Before 2003, large-bodied species accounted for an average of 82% of individuals captured each year and an average of 59% per year afterwards. As expected from a program of similar magnitude and history, other small changes occurred throughout the program, including changes in specific electrofishing gear and the proficiency of crew members. The primary contractors also changed between 2002 and 2003. Details on fish collection permits, including permit numbers, are not available. All collection complied with relevant permitting guidelines, including proper handling of the fish.
Several new locations were added to the Athabasca River inventory over time. To remove the possibility of detecting changes related to the inclusion of new locations, this analysis used sites sampled in the first official year of RAMP, 1997: 00B, 01A, 04A, 04B, 05A, 05B, 10B, 11A, 16A, and 17A (Table S1). In the fish inventory, the focus was on a community survey and sample sizes for each species per fishing reach were small each year. To overcome this limitation, individuals of each fish species from all focal locations within the sampling years were pooled into a single sampling unit that encompassed the Athabasca River downstream of Fort McMurray to the Tar River (Table S2). This decision was supported by the lack of any migratory barriers in the study area and the lack of known and specific exposure histories of individual fish in various locations in the Athabasca River. All raw data for the fish inventory are available online (ramp-alberta.org).
Fork length (FL), body weight (BW), and condition
Although many retrospective options are available to examine this large data set, including analysis of the fish community data obtained with an electrofisher, the main initial focus of the current analysis was to examine changes in FL (cm; ±0.1), BW (kg; ±0.001–0.01), and condition (100 × (BW/FL3)) of white sucker and walleye. Age data are also available for some walleye and white sucker. During RAMP, analyses of length distributions were included, but these were omitted in annual reports in favour of age distributions after 2009 (RAMP 2011). Length and weight have not been thoroughly examined for changes since 2009; although, condition was statistically compared using ANCOVA throughout RAMP (Hatfield Consultants Partnership et al. 2016). The focus of the analyses here is on adult fish, and lower size limits were used to exclude juveniles. Data selection rules were also used to ensure that any patterns observed in the mean measurements and conclusions were not driven by extreme outliers and suspicious records, including (likely) data entry errors. For instance, three white suckers with weight >4 kg were found in the records; the weight of these fish was >1 kg more than the next heaviest white sucker. No such outliers occurred in the walleye data set, but in both species unlikely values for condition were also used to exclude suspicious data. Analyses of white sucker were limited to fish >25 cm, <4 kg, and condition values between 0.5 and 2.5. Selection rules for walleye were: >20 cm and condition values between 0.5 and 2.5. Although sex was reported for 53% of white sucker and walleye, most of this fraction is male (84%). Sex ratios could not be thoroughly and reliably examined for effects on the observed patterns. Examining changes within a sex is also not reliable with the inventory data set because of bias in identifying the sex of larger fish.
Although FL and BW were recorded for most large-bodied fishes captured, white sucker and walleye were selected for several reasons. These fish species were collected with consistent priority and at consistent locations over time during the inventories. White sucker has been successfully used in many studies of pulp mill effluent (Arciszewski et al. 2015) and is a commonly used sentinel species in the Canadian Environmental Effects Monitoring program (Munkittrick et al. 2002). Walleye also has special management status in Alberta (Colby 2012). Length, BW, and condition of other species were also examined following the initial analyses of white sucker and walleye. Additional analyses done on other species and in other seasons are presented in Supplementary Material 1.
Tolerance intervals
Iterative predictions of length, weight, and condition of white sucker and walleye were made by defining a normal range of variation (Kilgour et al. 1998). In this study, the normal range of variation was defined using tolerance intervals (Kilgour et al. 2017). Tolerance intervals are commonly used in manufacturing (Montgomery 2009), but have also recently been applied to biological data in several configurations, including assessing differences in means (Kilgour et al. 2017). Tolerance intervals are conventionally used to provide the outer limits of a specified confidence γ (e.g., 90%) within which a specified proportion β (e.g., 95%) of future observations that are expected to occur. In practice, they describe variability bands of percentiles and are markers of the uncertainty of an estimate. In the case of a central 95% confidence interval (CI), tolerance intervals describe the variation, or 95% CIs of the 2.5 and 97.5 percentiles.
Using a non-central t distribution and following NIST/SEMATECH (2003), conventional tolerance intervals (also described as limits) of expected values delineating a central confidence region are computed as
(1)
where
(2)
where tγ,n−1,δ is the critical t-value of a non-central t distribution, δ is the non-centrality parameter
(3)
and Zp is the Z-score of percentile p from the standard normal distribution: N(0,1).
Commonly, tolerance intervals are calculated as the outer limits only using γ = 0.95 for the 97.5 percentile of a reference data set and its inverse for the 2.5 percentile. Following Kilgour et al. (2017), a second set of thresholds, the inner limits, can also be computed using γ = 0.05. Together, these inner (ITL) and outer tolerance intervals (OTL) can be computed for each percentile defining the central 95% confidence region (i.e., 2.5th and 97.5th). Here these limits were calculated for unweighted observed means, not individual fish. In the current configuration, tolerance limits were used to provide 90% confidence of the coverage of the 95% CI of future means. The 2.5 and 97.5 percentiles were also calculated by setting k = 1.96. Tolerance limits were calculated using scripts in Base R, and a generic script is provided in Supplementary Material 1.
The predicted bounds (the ITL, percentile proper, and OTL) are also referred to as thresholds. The thresholds were computed using previous annual means and applied as triggers to test the likely occurrence of subsequently measured means. For example, the annual means of white sucker length collected in the first three years, y1–y3, are used to predict the fourth year of data, y4. If the mean of y4 was within the range defined by the ITLs of the 2.5th and 97.5th percentiles (calculated from the annual means of y1, y2, y3), the data are considered typical (or “normal”) and added to the “set” used to define the initial normal range. A new estimate of normal using the means from y1 to y4 is then used to predict y5. In contrast, if the mean from y4 is outside the expected range defined from y1 to y3, an unexpected observation (i.e., the exceedance of a trigger) is noted, and the normal range is fixed. The annual mean of a measurement of fishes from y5 is then tested for a second exceedance (i.e., confirmation) against y1–y3. A minimum of three exceedances is used as a rule of thumb for a sufficiently rare difference (Arciszewski and Munkittrick 2015). This iterative process was used to flag potentially relevant differences in length, weight, and condition of white sucker and walleye.
In the iterative approach described, the first predictions of length, weight, and condition were made for walleye in 1991 and the first predictions of length in white sucker in 1998. Only one white sucker was weighed in 1989. This single fish was included with the data for the next year of record, 1996, for the calculation of the tolerance intervals of weight and condition for white sucker. Consequently, the first predictions of weight and condition in white sucker were delayed until 1999. Although the data were collected using differing methods and may not be directly comparable, lengths of walleye and white sucker from the 1970s for the Athabasca Oil Sands Environmental Research Program (AOSERP) are presented for comparative purposes. AOSERP data were not used in the calculation of the triggers. In the source material, lengths of white sucker and walleye are presented as pooled means within a size range; an overall mean and its standard deviation were calculated from the data summaries available for qualitative comparison (Wallace and McCart 1984).
In this analysis, the various thresholds associated with each endpoint, except walleye condition, were adjusted based on the occurrence of data inside the range of normal variation. Walleye condition was, however, treated as a special case. The lack of variability in mean annual condition between 1987 and 1996 constrained these triggers and five subsequent means (1997–2003) were flagged as exceedances. The tolerance limits were fixed for the remainder of the measurements of walleye condition.
Age and growth
Other analyses were performed and additional data were obtained to further scrutinize the findings for the size of fishes collected in the Athabasca River. In addition to length and weight, age was recorded for some individual walleye and white sucker. These data were used to explore possible changes in other demographic factors of white sucker and walleye in the Athabasca River. Based on the results of changes in length in both species, the data for age and growth were pooled into “before 2007” and “after 2006” categories to further examine the relevance of changes, most notably changes in length, between 2006 and 2007. Age and length can be used to estimate growth, also called length-at-age, through regressing length against age (Gibbons and Munkittrick 1994). Differences in slope (pslope) and the intercept (pintercept) of length-at-age were compared within species between the periods using log10 transformed data and ANCOVA. Age was also compared between the periods within species using log10 transformation and ANOVA. No fish were removed for these analyses. Statistical analyses of age and length-at-age were performed using Systat 13.
Relative abundance
Changes in the relative abundances of fishes, estimated as the catch per unit effort (CPUE), were also explored. As CPUE always provides a value, it could be used to compute triggers per species, inventory reach, and year, to further evaluate the possibility of changes in resident and transient fishes within the Athabasca watershed. CPUE was calculated for all individuals captured, not just adults. All fish were included because few fish were excluded following procedures to control for the possible influence of capturing 0 and 1+ age fish of large-bodied species after 2003. One example procedure tested set the minimum size criterion for collections done after 2002 to the minimum size individual for each species collected prior to 2003.
To evaluate the improbability of changes in relative abundance that coincided with changes in fish size and condition, the 95% CI (upper and lower confidence limits, UCL and LCL, respectively) and the median of the upper 95th percentile of CPUE measurements before 2007 were calculated for each species and each site. Electrofishing surveys in the spring of 1987 and 1989 included multiple passes at each reach sampled. For these years, a mean CPUE was calculated for each reach. The thresholds for CPUE were not adjusted over time. The 95% CI of the 95th percentile was calculated using a log10(x + 1) transformation and a parametric bootstrap using 100 000 iterations. The LCL, median, and UCL of the 95th percentile of CPUE are presented in figures for comparative purposes, but emphasis is placed on differences that exceed the UCL. Representative species (walleye, white sucker, northern pike, and lake whitefish) and various reaches were selected to show the various apparent patterns. Expected future observations for CPUE were calculated for a site using all data collected before 2007 to determine if this cutoff detected changes in relative abundances. Bootstrapping procedures were performed using Base R (generic script provided in Supplementary Material 1).
Exploratory and supporting analyses
Other data for white sucker were available for comparison with patterns observed in the Athabasca mainstem over time and the possible explanations of the changes, including an effect of technique drift over time or an effect associated with fishes with suspected spawning migrations from Lake Athabasca to the Fort McMurray area (Bond and Berry 1980a, 1980b). Among these additional and cursory examinations, exploratory analyses were also performed on length, BW, and condition of other species, such as northern pike, lake whitefish, and trout-perch (Percopsis omiscomaycus; Figs. S1–S3). These species showed little evidence of changes in length and the data are presented in Supplementary Material 1. Relative abundances of longnose sucker and goldeye captured in the spring and fall inventories at representative locations were also examined using bootstrapped percentiles (Fig. S4).
Although not unequivocal, another exploratory comparison was used to inform two follow-up questions that emerged after examining changes primarily in the FL of white sucker. Data from the Clearwater were examined to determine if similar changes identified in the FL of white sucker captured in the Athabasca mainstem also occurred elsewhere. Although sampling in the Clearwater River began in 1999 following the same protocols as the Athabasca inventory, white sucker were not captured until 2003 (Hatfield Consultants Partnership et al. 2016). Similar to other analyses in this work, data from the Clearwater sites were also pooled within years. Data during the overlapping period of these inventories, 2003–2014, were visually compared for the occurrence of similar temporal patterns in the lengths of white sucker between these rivers. Similar patterns in the Clearwater and Athabasca rivers suggest a widespread change in white sucker including sampling bias or another source of variation. Differences in the length of white sucker in the Clearwater and Athabasca inventories over time suggest little effect of sampling bias and heterogenous exposure histories of the fishes between the rivers.
Additional data sets were used to explore the influence of environmental and anthropogenic factors on changes in the size of white sucker and walleye in the Athabasca mainstem over time. The influence of discharge on estimates of relative abundance was evaluated statistically. Mean daily discharge data for the Athabasca River downstream of Fort McMurray (station 07DA001) were obtained from Environment and Climate Change Canada (wateroffice.ec.gc.ca/) for the dates the fish inventory occurred. CPUE was also computed for all locations sampled in the Athabasca River per season (spring and fall) and year (Tables S3 and S4). All fishes captured at the focal fishing reaches were counted for each year, corrected for total effort, and regressed against mean daily discharge using least squares regression by season (spring and fall) and period (before 2007 and after 2006). Regressions were performed using Systat 13.
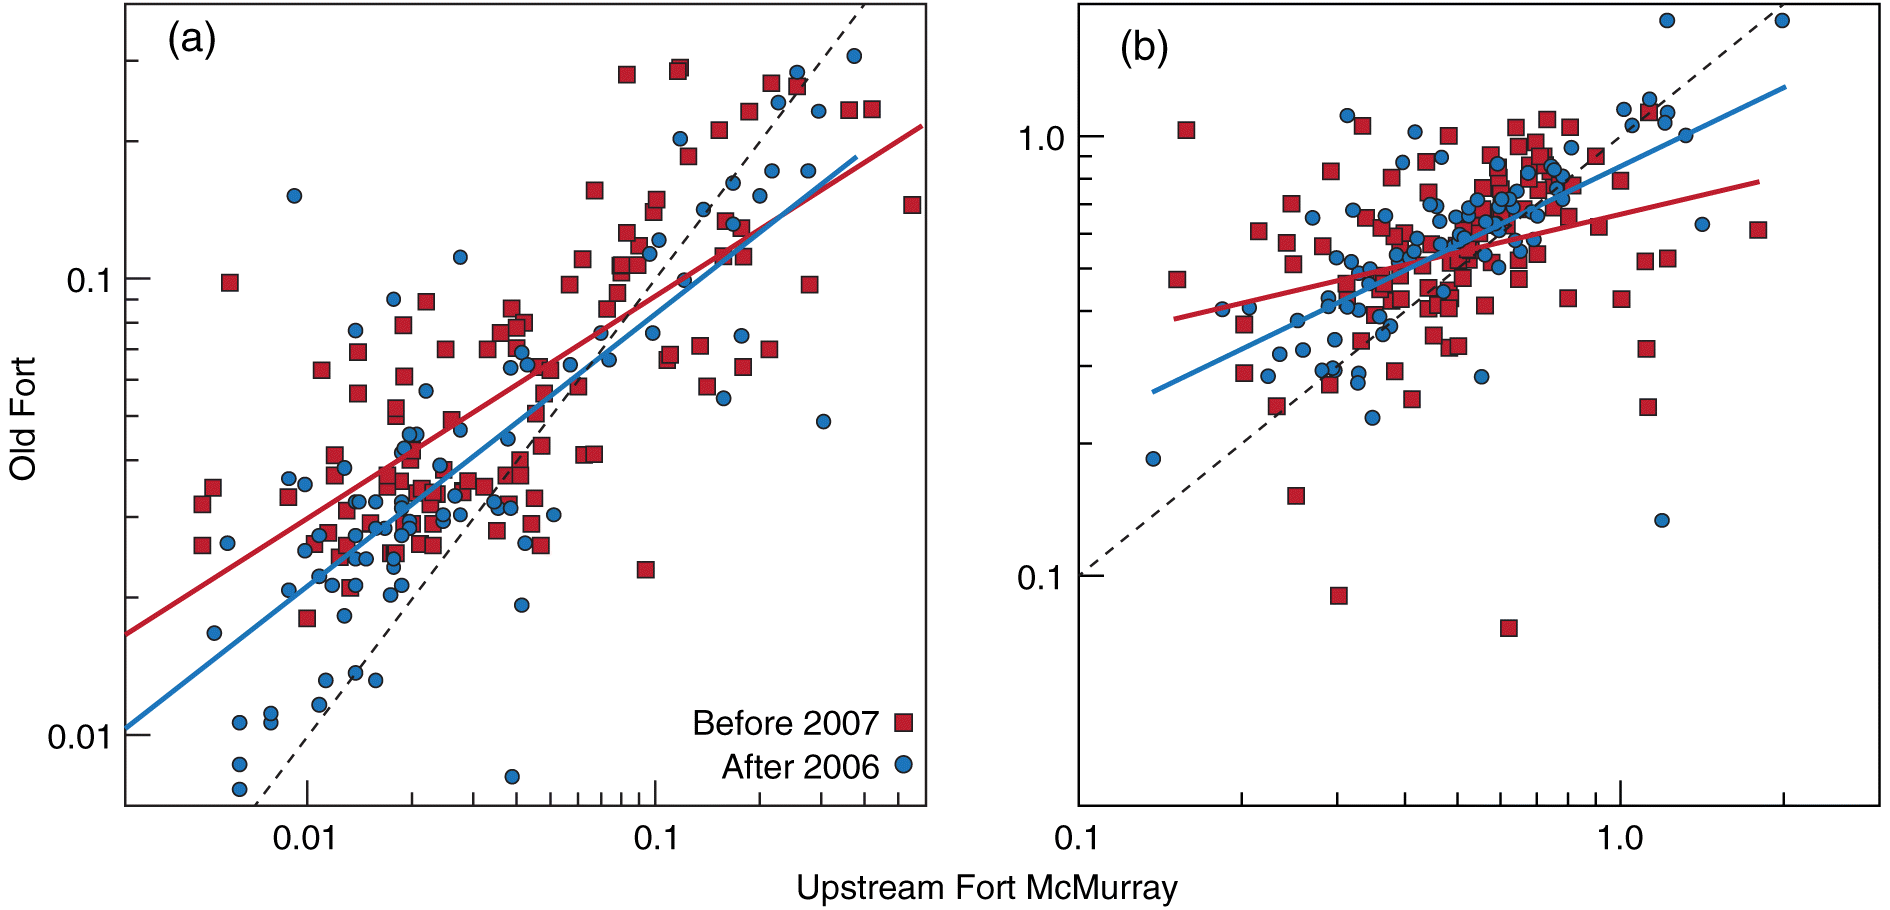
In addition to exploring the RAMP data set further, other data were sought to evaluate the hypothesized explanations of the patterns observed in length and abundance. The possible influence of nutrient enrichment was examined using measurements of total nitrogen (TN) and total phosphorus (TP) at two Long-Term River Network sampling locations in the Athabasca that straddle the oil sands area: Upstream Fort McMurray and Old Fort. Samples between 1988 and 2014 for these locations were obtained from Alberta Environment and Parks (AEP; ems.alberta.ca/reports/viewreport5.aspx). The spatial relationships between Old Fort and Upstream Fort McMurray were compared for each variable (TN and TP) within a calendar month between the periods (i.e., before 2006 and after 2007). This analysis assumed that comparisons within a calendar month of samples often collected on adjacent days between the locations is a reasonable facsimile of a dedicated study examining changes in a parcel of water passing the two locations in the Athabasca River. The spatial correspondence of TP and TN between locations was compared using least squares regression. The spatial relationships within variables between the periods were compared using ANCOVA. TN and TP were log10 transformed prior to statistical analysis. A single censored value of TP (January 1995) was removed prior to regression. Regressions were performed using Systat 13.
Two additional explanations have emerged and were examined here: changes in fishing pressure and increased oil sands production. Records of fish harvesting in Lake Athabasca between 1988 and 2014 were obtained from AEP (A. Paul, personal communication, 2016). Oil sands production between 1988 and 2014 was obtained from CAPP (2016). Records of fish harvesting and oil sands production were not evaluated statistically and are presented for comparative purposes only.
Results
Walleye
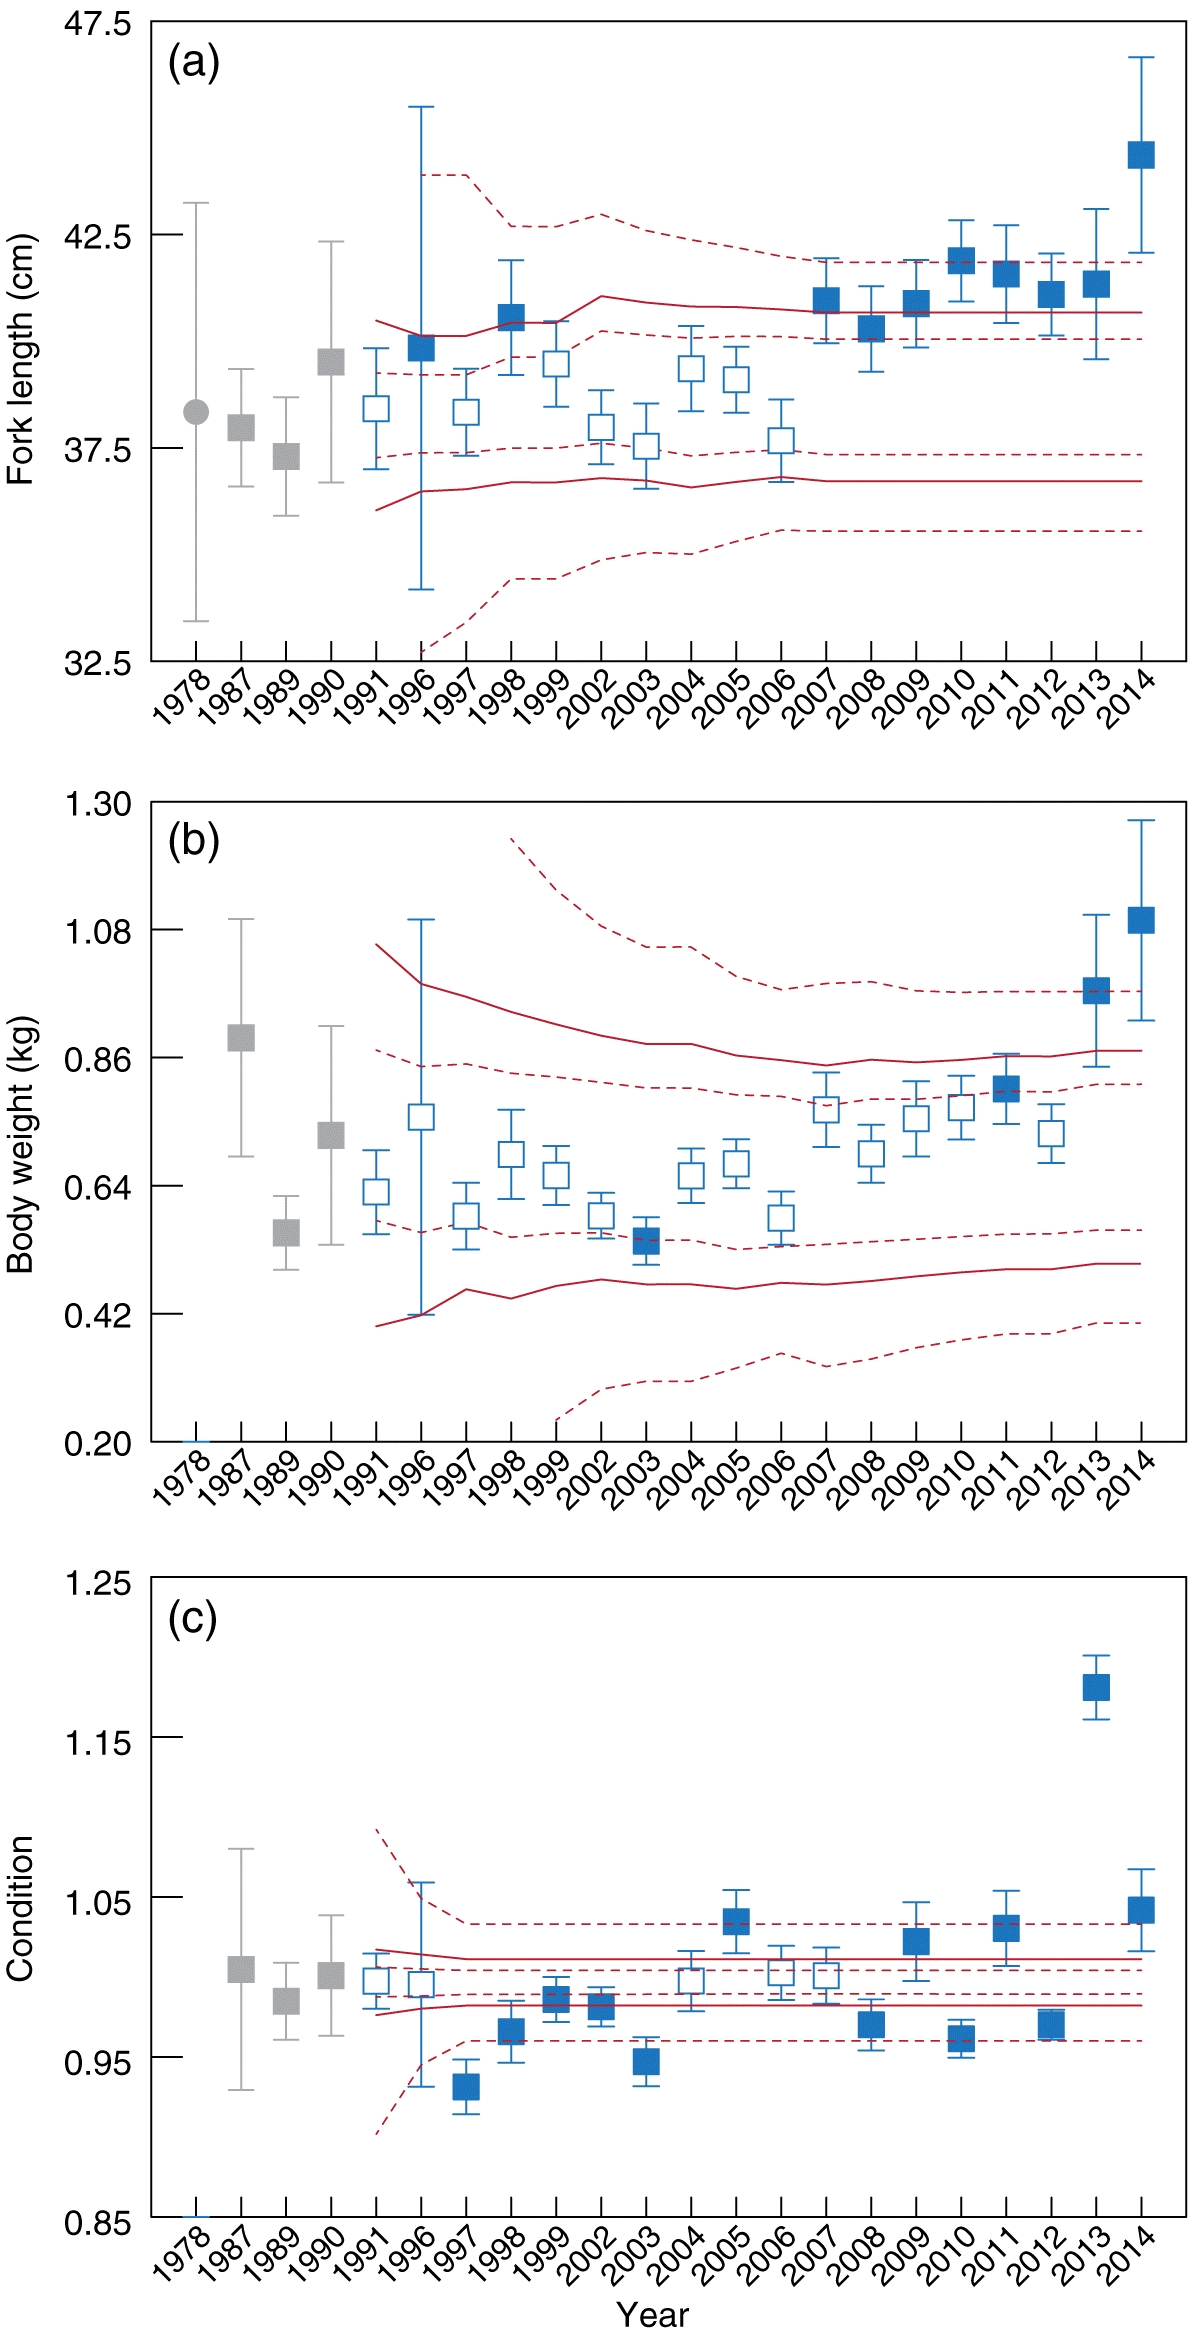
The first three years of walleye data were collected in 1987, 1989, and 1990. Tolerance intervals generated using these data suggested that the fish were longer than expected (an exceedance of the ITL of the 97.5 percentile) in the spring of 1996. A second exceedance of the 97.5 percentile proper followed in 1998 (Fig. 2a). No other exceedances were observed until 2007 suggesting that the earlier exceedances were the result of an inadequate description of background variation. After 2006, mean walleye length was always above the ITL or the 97.5 percentile, and the fish became progressively longer over time. In 2014, the mean length of adult walleye was above the OTL of the 97.5 percentile, showing a large departure from prediction (Fig. 2a) and suggesting a relevant change. The mean spring length of walleye captured during the AOSERP program in 1978 was within the range of expected means predicted from data collected in 1987, 1989, and 1990, the first years used to calculate triggers, suggesting little change in mean annual walleye length from 1978 to 2006.
Fig. 2.
Fig. 2. Mean fork length (±2 SE, cm), body weight (kg), and condition of walleye captured in the annual spring fish inventory in the Athabasca mainstem near the development area. Solid red lines show the estimated 2.5th and 97.5th percentiles; dashed red lines show the inner and outer tolerance intervals of the respective percentiles. Gray squares = baseline years; gray circle in (a) = 1978 Athabasca Oil Sands Environmental Research Program data (Wallace and McCart 1984; not included in baseline calculations). Open symbols = data within normal range; solid symbols = exceedance of a trigger.
The mean spring BW of walleye examined from 1987 to 2014 showed fewer changes compared with mean length (Fig. 2b). The ITL of the 2.5 percentile was exceeded in 2003, but this change was not observed a second time. The ITL of the 97.5 percentile was exceeded in 2011, but not in 2012. In 2013 the mean weight of walleye exceeded the estimated 97.5 percentile, whereas the OTL was exceeded in 2014 also suggesting an increase in size in walleye. In addition, a moderate upwards drift of the tolerance intervals for walleye weight was observed between 2007 and 2014.
The condition of walleye captured in the spring showed similar values from 1987 to 1996 (Fig. 2c). Between 1997 and 2003, walleye condition was lower than expected. This suggests an improbable decline, but the relevance of these exceedances of the defined normal range, as well as others that followed, including 2005 and every year from 2008 to 2014, is difficult to ascribe because the range encompassed by the triggers is narrow. These findings suggest that tolerance intervals did not perform well for walleye condition.
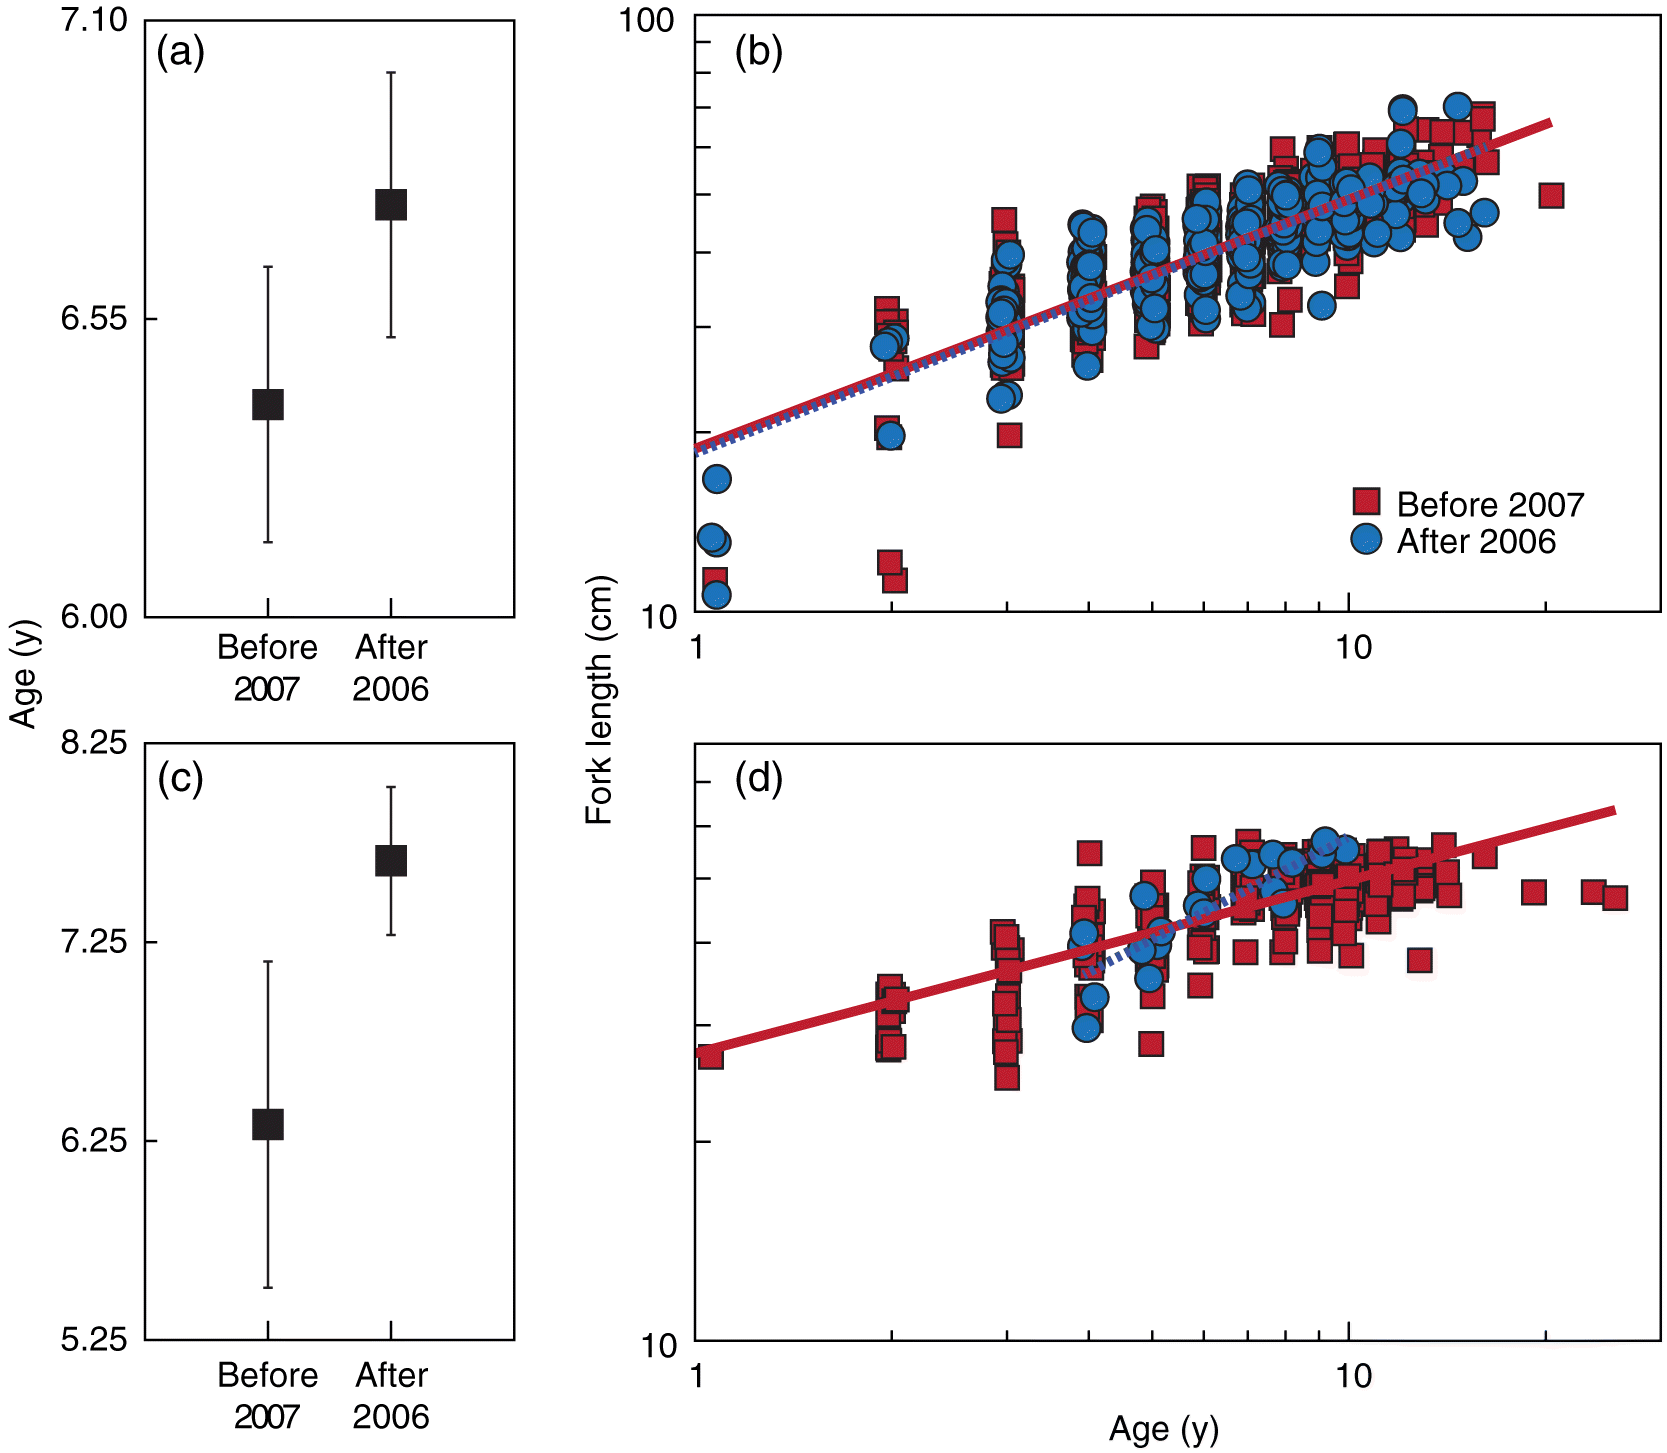
The age and growth of walleye were also examined during this study. The age of walleye did not differ statistically between the periods (p = 0.054; Fig. 3a). The growth of walleye, estimated as length-at-age, was also not statistically different between the periods (pslope = 0.787; pintercept = 0.693; Fig. 3b).
Fig. 3.
Fig. 3. Mean age (y ± 2 SE) and length-at-age (estimated growth) of walleye (a, b) and white sucker (c, d) captured before 2007 and after 2006 during the Athabasca fish inventory.
White sucker
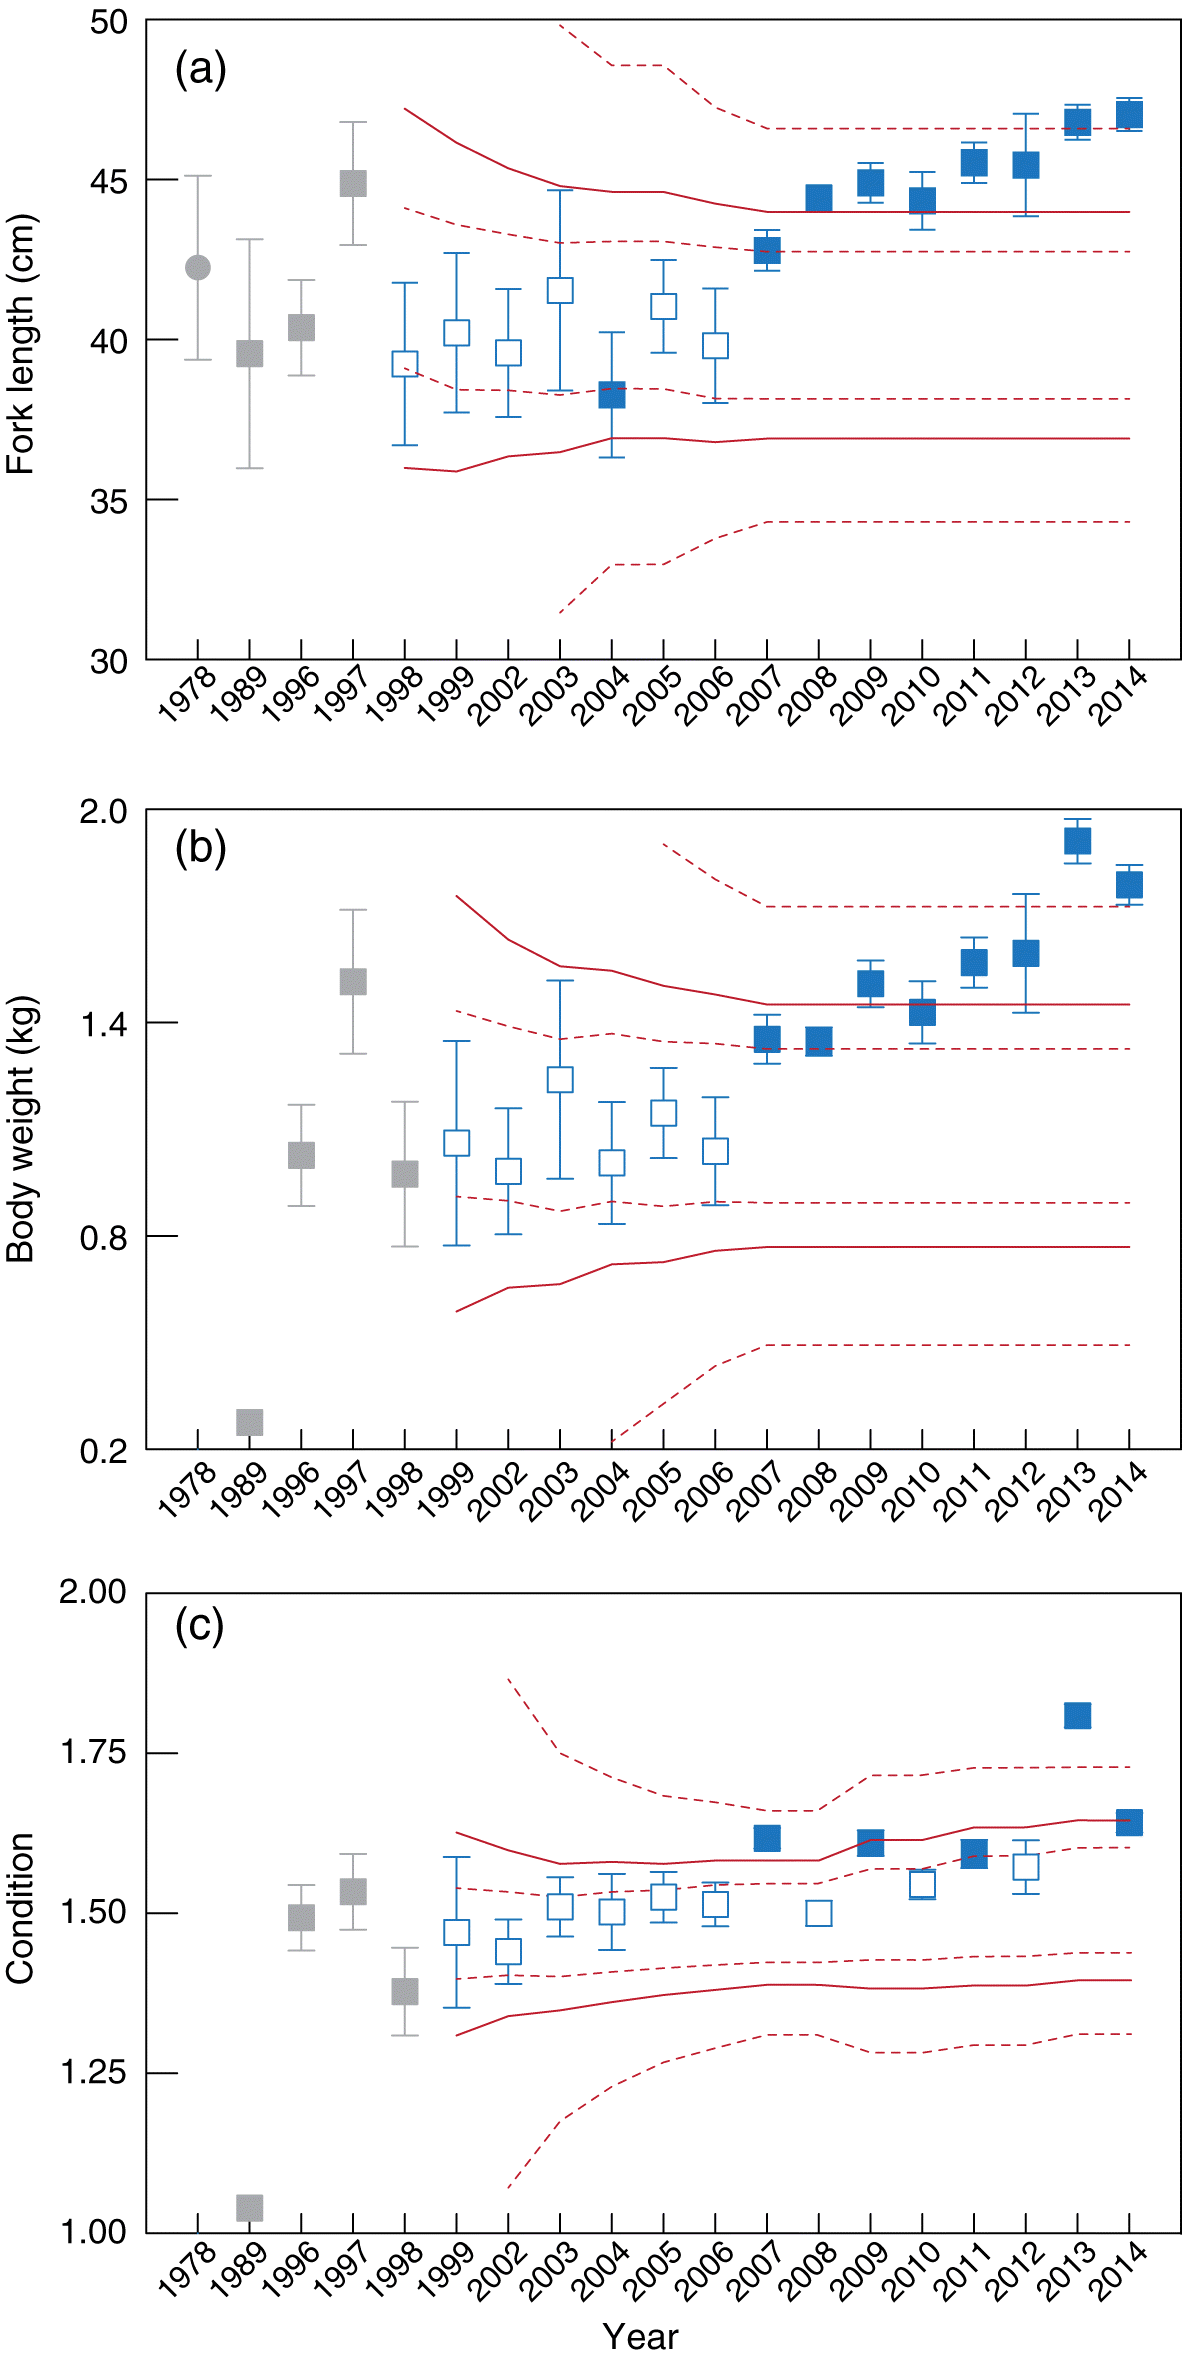
Among white sucker collected in the Athabasca River, mean length was within the expected range between 1998 and 2003 (Fig. 4a). In 2004, the mean length of white sucker collected in the spring was below the ITL of the 2.5 percentile; this change was not observed again in 2005 suggesting that this difference is attributable to uncaptured or stochastic background variation. After 2006, the mean length of white sucker exceeded, at minimum, the ITL of the 97.5 percentile (Fig. 4a) in every year examined. From 2008 to 2012, the mean length of white sucker captured in the Athabasca River exceeded the estimated 97.5 percentile, suggesting a rare increase in size. In 2013 and 2014, the mean length of white sucker exceeded the OTL estimated from fish captured at the same locations before 2007. In contrast, the mean length of white sucker captured during the AOSERP program was within the range predicted from fish captured in 1989, 1996, and 1997 suggesting little change from the 1970s to 2006.
Fig. 4.
Fig. 4. Mean fork length (±2 SE, cm), body weight (kg), and condition of white sucker captured in the annual spring fish inventory in the Athabasca mainstem near the development area. Solid red lines show the estimated 2.5th and 97.5th percentiles; dashed red lines show the inner and outer tolerance intervals of respective percentiles. Gray squares = baseline years; gray circle in (a) = 1978 Athabasca Oil Sands Environmental Research Program data (Wallace and McCart 1984; not included in baseline calculations). Open symbols = non-triggered; solid symbols = exceedance of a trigger.
As observed in the mean spring length, no differences were observed in the weight of white sucker until the mid-2000s. The mean BW of white sucker exceeded triggers in 2007 and drifted farther from normal over time (Fig. 4b). In 2013 and 2014, the mean BW of white sucker exceeded the OTL of the 97.5 percentile suggesting an improbably large change.
No unusual changes were found between 1999 and 2006 for the condition of white sucker. Unlike for length and weight, inconsistent changes were observed for the condition of white sucker after 2006. After 2006, annual means of the condition of white sucker alternated inside and outside the range defined at minimum by the ITL of the 97.5 percentile, except in 2013 and 2014 (Fig. 4c). Similar to the finding for walleye condition, this pattern of measured means inside and outside the normal range suggests that tolerance intervals did not perform well for this measurement. The age of white sucker did not differ statistically between the periods (p = 0.237; Fig. 3c). The growth of white sucker, estimated as length-at-age, was statistically different between the periods (pslope = 0.002; Fig. 3d), but this statistical difference is likely related to the few white sucker aged (n = 21) before 2007 relative to after 2006 (n = 311).
CPUE
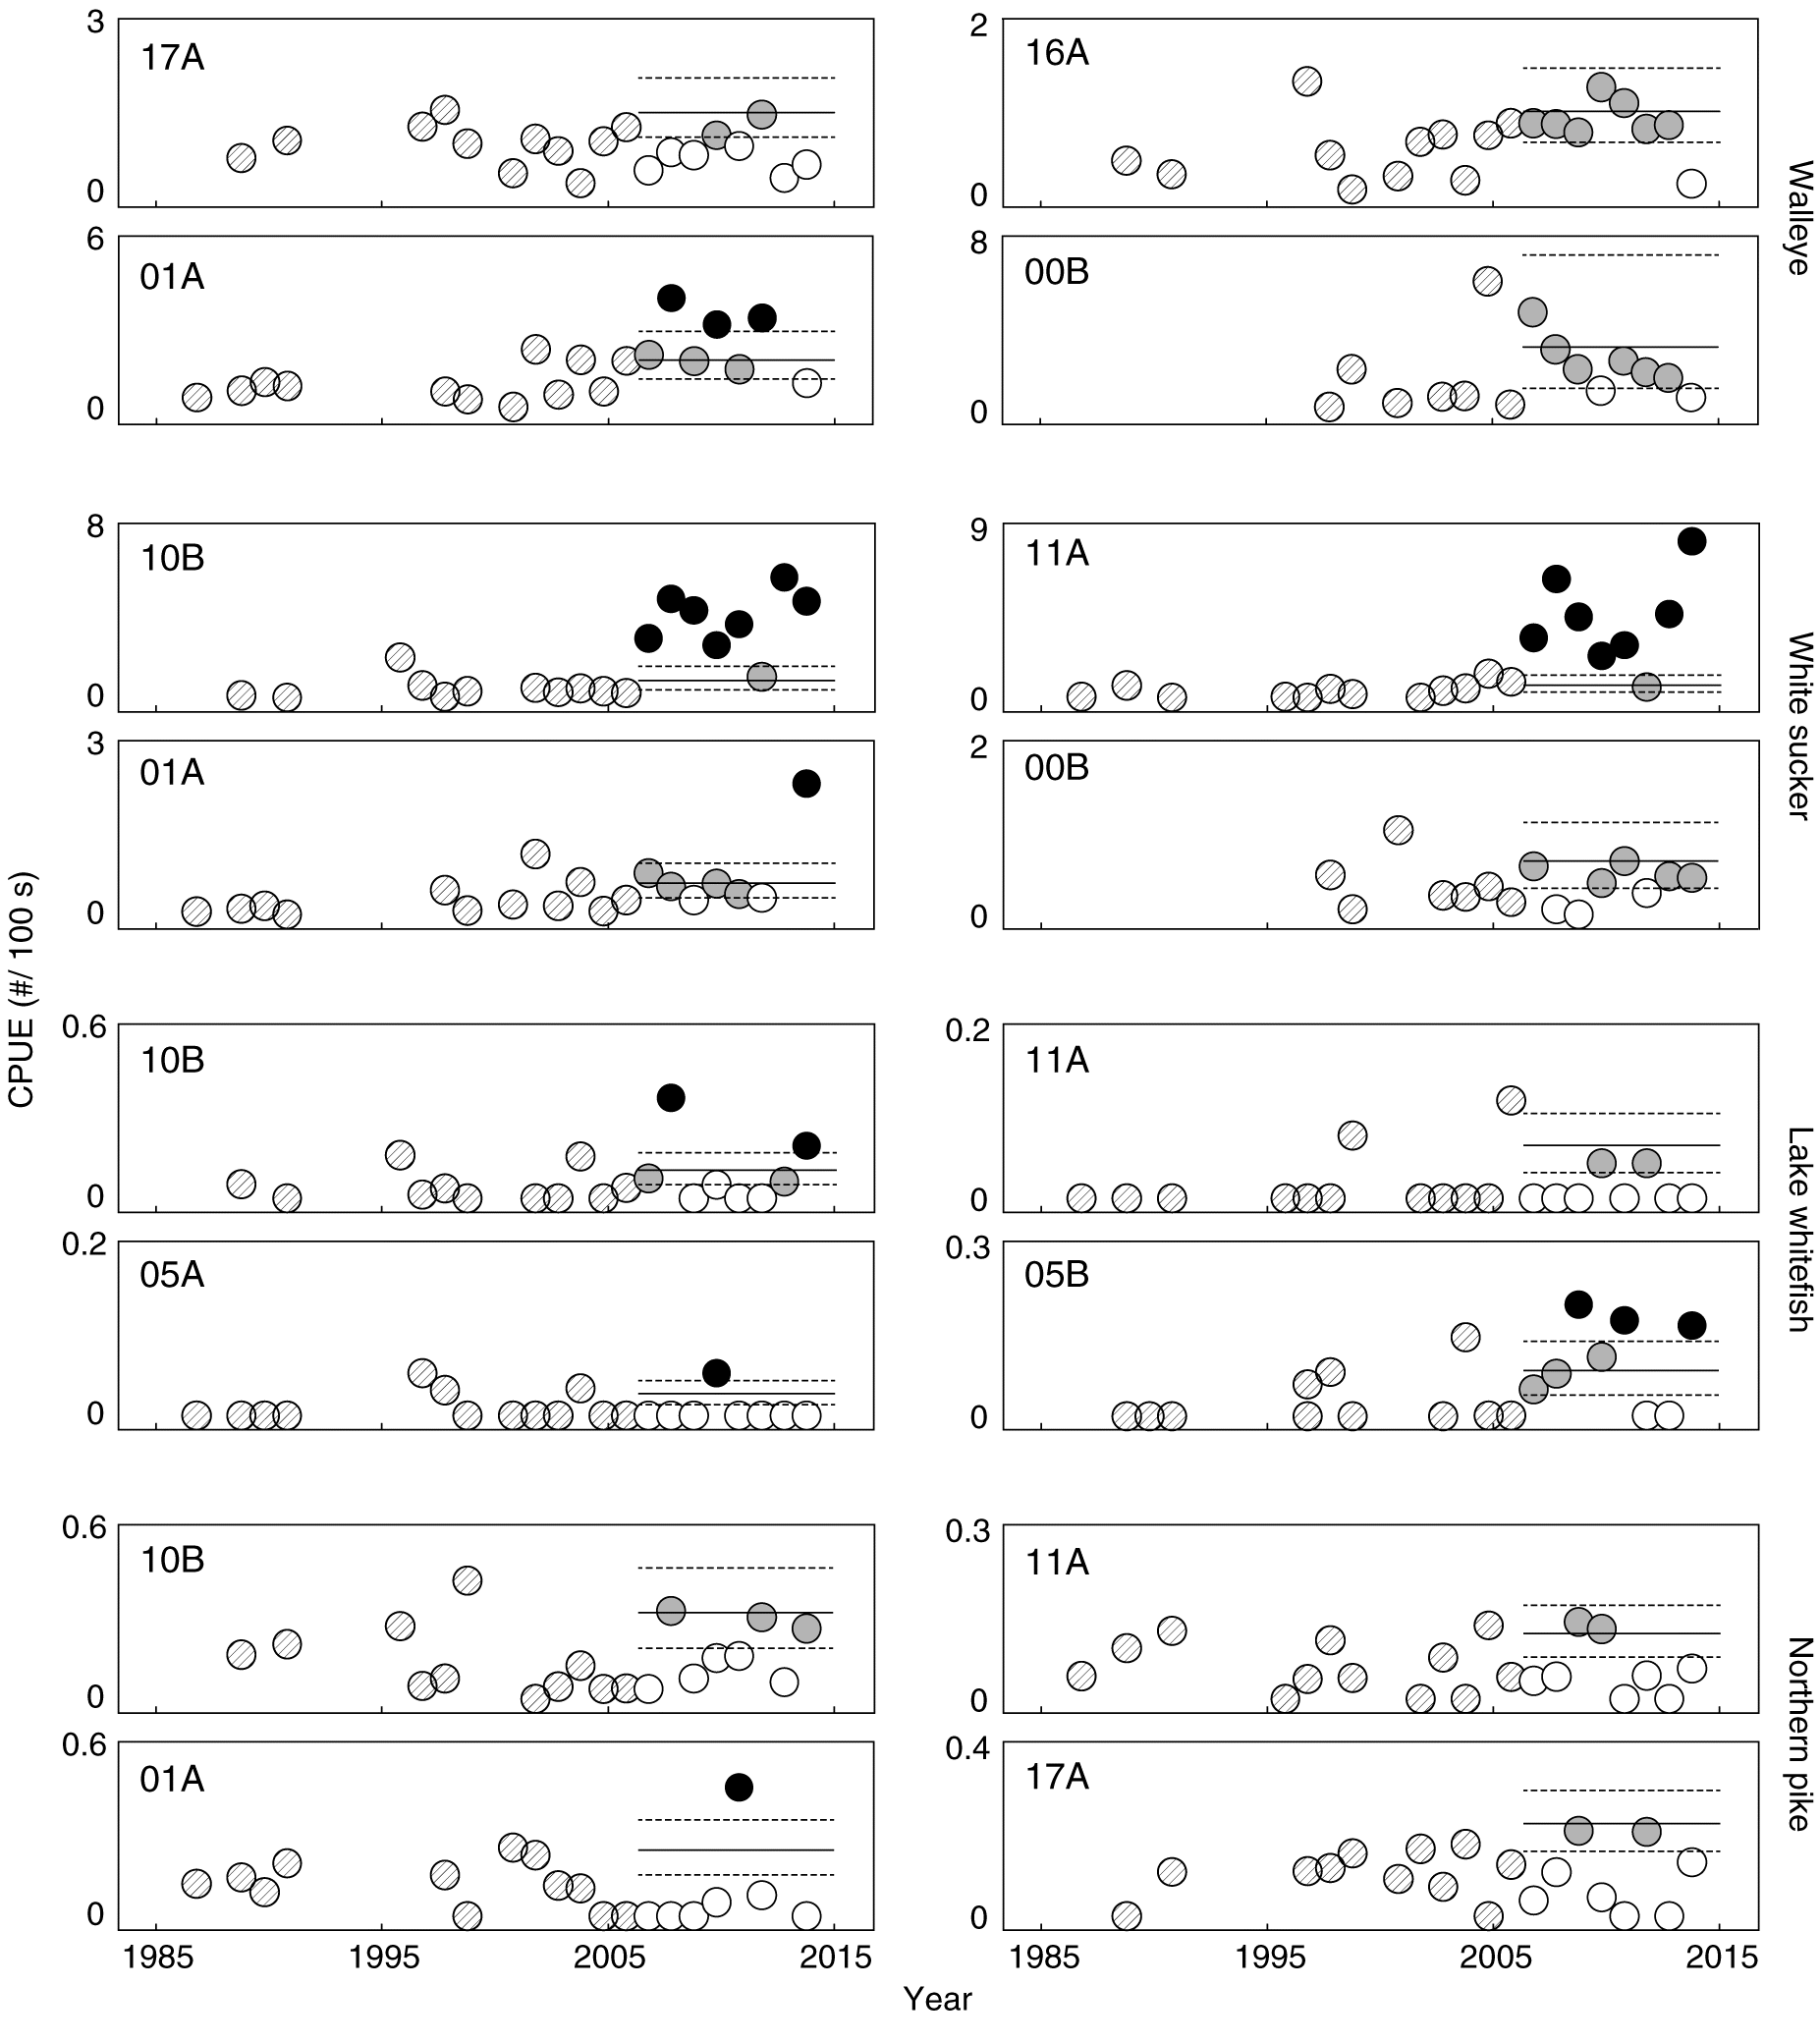
Based on the changes observed in walleye and white sucker length, weight, and condition, additional analyses were done using CPUE. Over time, the relative abundance of walleye captured in the spring changed little at most reaches in the Athabasca River (Fig. 5). Representative reaches showed increases above the UCL of the 95th percentile compared with collections prior to 2005 near the southern extent of mining (01A) and no notable changes over time at 17A, a site downstream of most development. At two remaining locations examined in detail here, 16A and 00B, the abundance of walleye frequently occurred above the LCL of the 95th percentile in the spring and the fall. This suggests that there may have been an increased abundance of fish at these locations during the spring, but this specific evidence is uncertain. Similarly, catch rates of walleye did show some changes above the UCL of the 95th percentile at some locations in the fall, but the possible changes occurred less frequently than in the spring (Fig. 6).
Fig. 5.
Fig. 5. Relative abundances of walleye, white sucker, lake whitefish, and northern pike catch per unit effort (CPUE) (fish per 100 s of electrofishing) in the spring per year at representative locations in the Athabasca River. Horizontal lines represent expected variability (95% CI) of the 95th percentile calculated using data for each site collected before 2007. Circles with diagonal line shading are measurements taken before 2007; open circles suggest no difference relative to before 2007; grey circles suggest a possible change relative to before 2007; black circles suggest a likely change relative to before 2007.
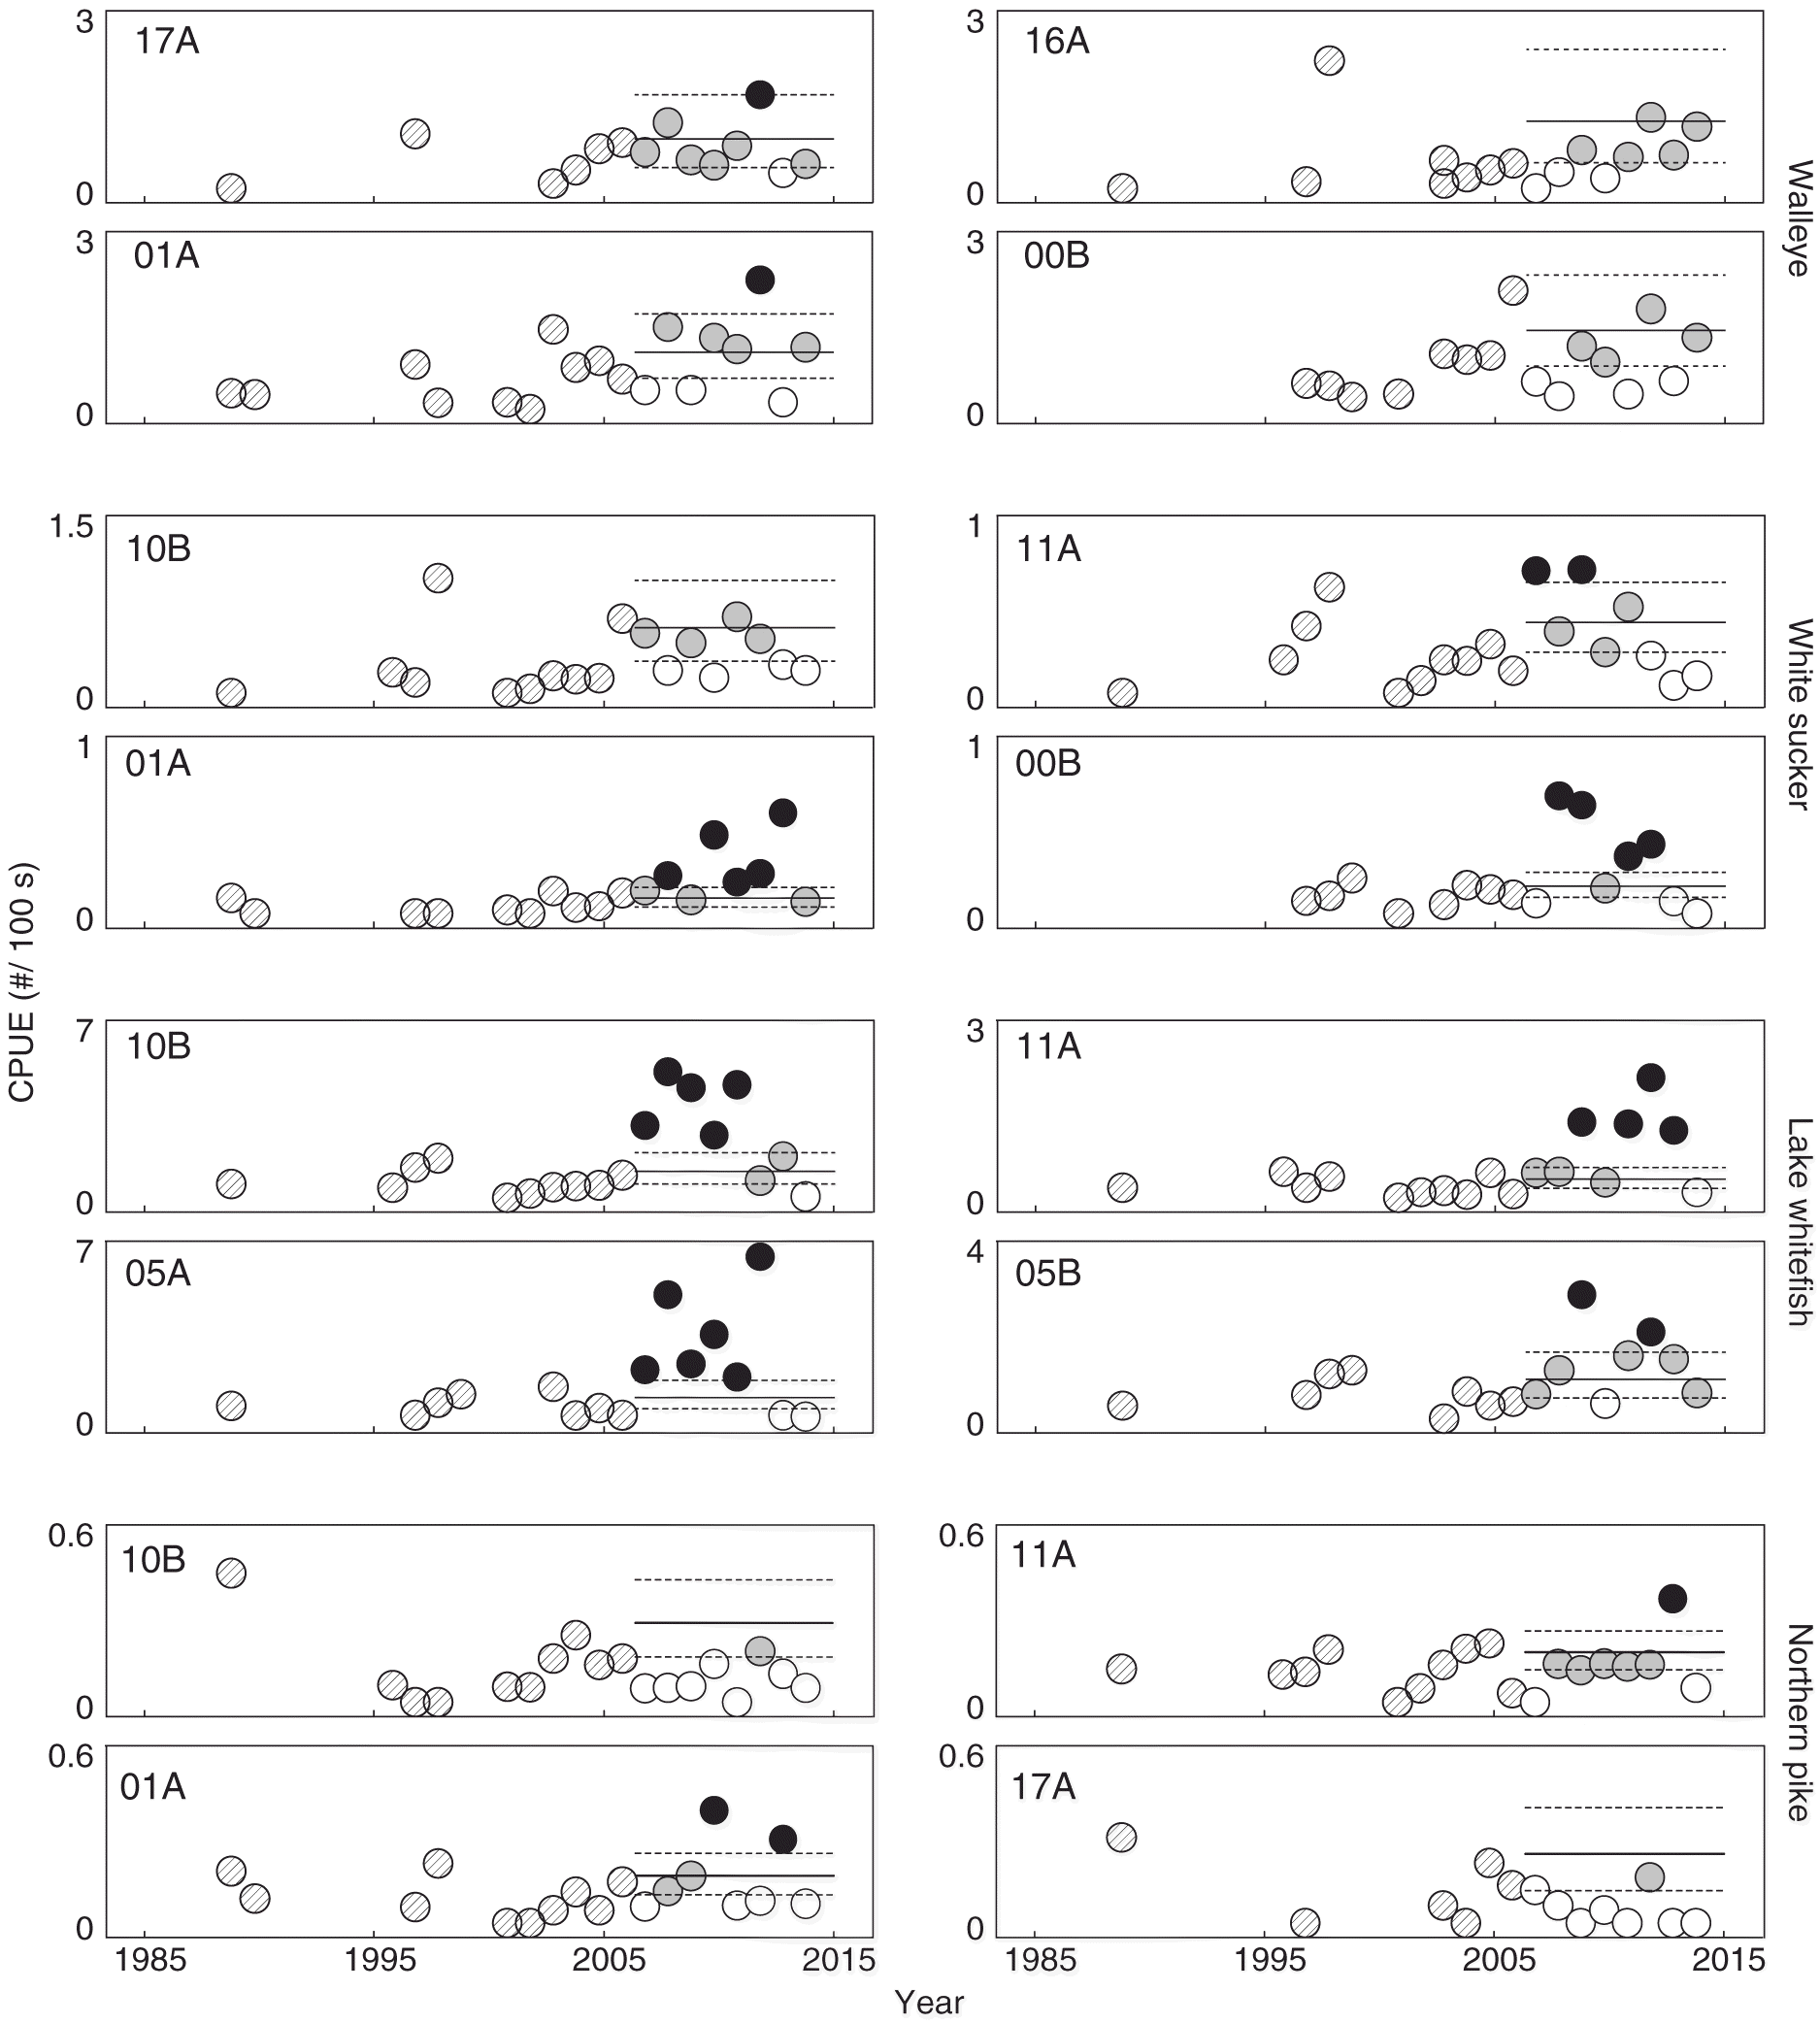
Fig. 6.
Fig. 6. Relative abundances of walleye, white sucker, lake whitefish, and northern pike catch per unit effort (CPUE) (fish per 100 s of electrofishing) in the fall per year at representative locations in the Athabasca River. Horizontal lines represent expected variability (95% CI) of the 95th percentile calculated using data for each site collected before 2007. Circles with diagonal line shading are measurements taken before 2007; open circles suggest no difference relative to before 2007; grey circles suggest a possible change relative to before 2007; black circles suggest a likely change relative to before 2007.
Similar to walleye, the relative abundance of white sucker in the spring showed non-uniform patterns among fishing reaches (Fig. 5). Notable and likely increases above the UCL of the 95th percentile in CPUE were observed at inventory reaches near the confluences of the Muskeg and MacKay rivers after 2006 (11A and 10B), whereas a possible increase above the UCL was detected at locations farther upstream, such as 01A. Each example location selected to show changes in the CPUE of white sucker had increases above the LCL. Interestingly, the site-specific triggers for relative abundance revealed some subtle increases in white sucker above the UCL in the fall, such as 11A, 01A, and 00B (Fig. 6). These increases are small when compared with the absolute increases at 11A and 10B in the spring, but are large when compared with the historical data for a given location.
Lake whitefish were also caught more commonly at most study locations in the fall (e.g., 10B and 05A) after 2006 than in previous years (Fig. 6). Lake whitefish, similar to white sucker, also showed some increases in their non-spawning season at some locations, such as 10B and 05B (Figs. 5, 6). These possible changes in the relative abundance of lake whitefish in the spring are, however, smaller and less frequent than changes observed in the fall. The relative abundances of other species such as northern pike did not differ substantially over time (Figs. 5, 6); some increases in abundance above the UCL of the 95th percentile were observed in northern pike, but they were not consistent and the abundance of these fish was still relatively low. Similar to walleye and white sucker, increases above the LCL were frequently encountered in lake whitefish (site 05B) and northern pike (site 10B). There is also evidence of possible increases in longnose sucker at 00B after 2011 in the spring and fall and goldeye at multiple locations in the spring and fall (Fig. S4). Patterns of change in the relative abundance data for walleye, white sucker, lake whitefish, northern pike, longnose sucker, and goldeye suggest an association with spawning behaviour.
Exploratory and supporting analyses
Pooling the data from the Clearwater River shows a divergence in the size of white sucker compared with the Athabasca River since 2006 (Fig. S5), and suggests that the changes described here in the Athabasca River after 2007 are not likely regional, an effect of alterations in fishing techniques and crew capabilities, or a result of the introduction of sampling bias over time. Using CPUE in the spring and fall seasons between the periods, there were no statistical relationships between discharge and CPUE (p ≥ 0.182; Fig. S6). Between the periods, TP and TN measured within a calendar month and regressed between locations were each statistically significant (TP: p < 0.001; r2 ≥ 0.527; TN: p < 0.001; r2 ≥ 0.203; Fig. 7). Across both periods, measurements of both TP and TN were higher at Old Fort than at Upstream Fort McMurray suggesting inputs of nutrients between the sampling locations. However, the relationship among locations within each variable, tested by comparing slopes using ANCOVA, was statistically different between the periods for TN (p = 0.005), but not TP (p = 0.075).
Fig. 7.
Fig. 7. Comparison of total phosphorus (TP) (a; mg/L) and total nitrogen (TN) (b; mg/L) measured since 1987 in the Athabasca River upstream of Fort McMurray (UFM; AB07CC0030) and downstream of oil sands development at Old Fort (OF; AB07DD0010/AB07DD0105) where TP or TN were measured at both locations in the same calendar month. Solid lines show long-term regressions; dashed line shows expected 1:1 line. Raw data available at ems.alberta.ca/reports/viewreport5.aspx.
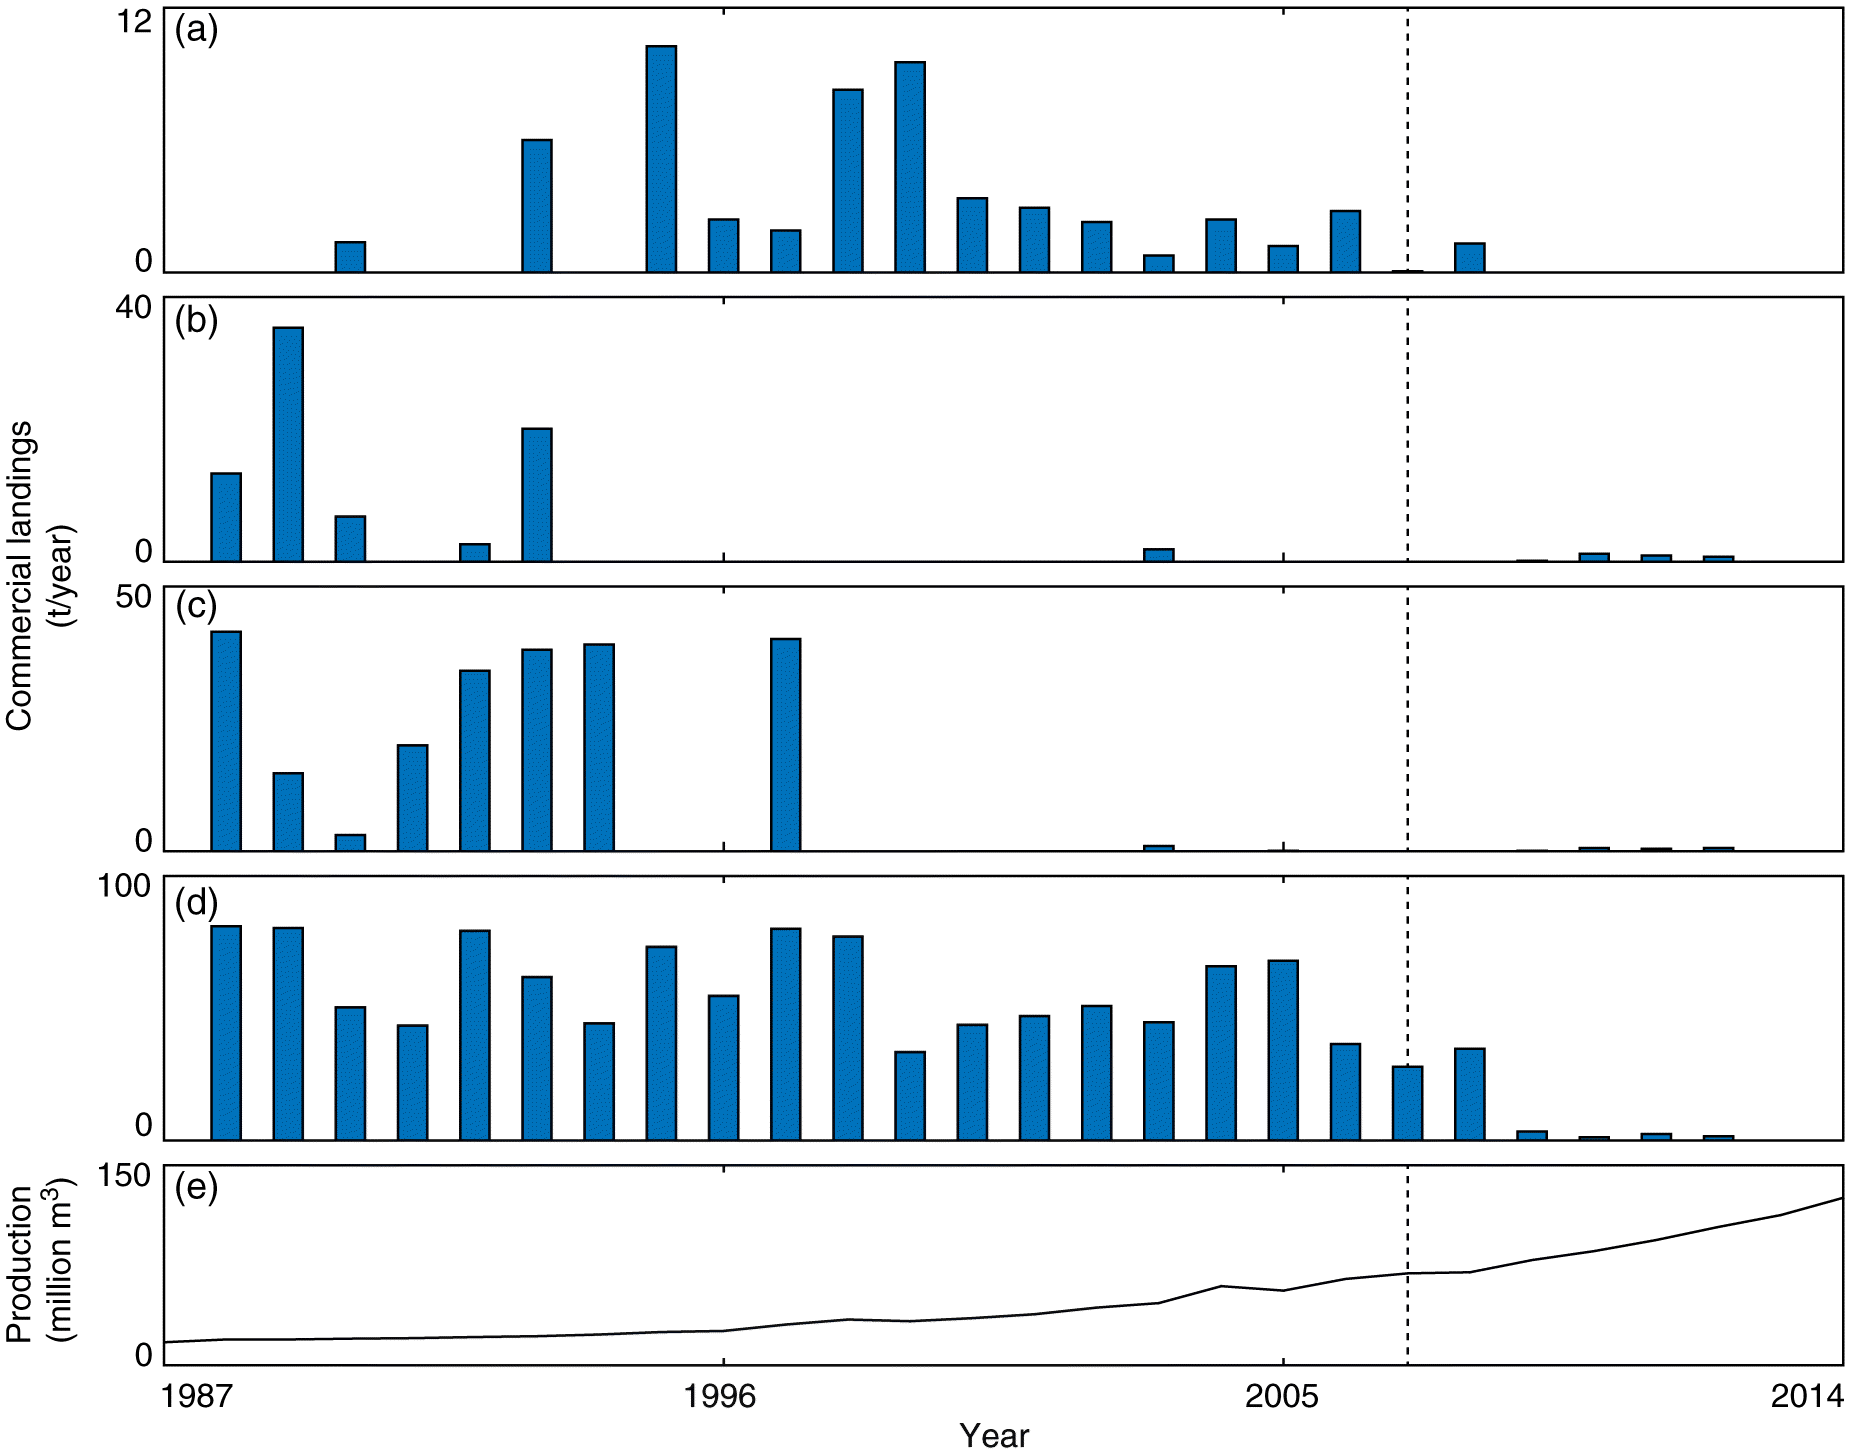
The increase in the size of white sucker and walleye, and increases in the abundances of white sucker, walleye, and lake whitefish also coincide with both increasing oil sands production and a decline in reported commercial catches in Lake Athabasca (Fig. 8). Records from the spring and summer commercial fishing season indicate that catches of walleye in Lake Athabasca declined from a maximum of 80 tonnes in 1997 to 1.6 tonnes in 2012 (Fig. 8); the largest decline occurred between 2008 and 2009. Other declines in commercial catch also occured in walleye, including a drop between 1998 and 1999. Lower catches were also apparent in other species, including goldeye, lake whitefish, and northern pike, but the onset of declines in these species varied from the early 1990s to the later 2000s (Fig. 8).
Fig. 8.
Fig. 8. Reported landings of goldeye (a), lake whitefish (b), northern pike (c), and walleye (d) in spring/summer commercial fisheries in Lake Athabasca between 1988 and 2012. Catch data provided by Andrew Paul (Alberta Environment and Parks); no catch data are available prior to 1988 or after 2012. (e) Total oil sands production (million m3) between 1987 and 2014; data available from CAPP (2016).
Discussion
Successfully detecting environmental change with monitoring is affected by many factors, including the availability of data from an undisturbed baseline period and the study designs selected (Smokorowski and Randall 2017). Where a baseline data set is missing or deficient, the capability to detect change is compromised and alternative approaches are required. Here, techniques to evaluate environmental change used statistically defined and adaptive thresholds (Arciszewski et al. 2017). Based on an adaptive baseline range of data, white sucker and walleye in the oil sands area of the Athabasca River have been longer than expected since at least 2007. The earliest confirmed evidence was observed in 2009. Given the suggestion from the bootstrapped thresholds for CPUE that the relative abundances of several species may also be also increasing, the differences we detected further suggest that some changes potentially relevant for resident and transient fish populations have occurred in the lower Athabasca watershed in the last decade.
In contrast to effects suggesting exposure to oil sands constituents or watershed development, a more general hypothesis arose to explain a majority of our results: the overwintering location of fish species. For instance, the largest changes in the relative abundances of walleye and white sucker appear to be spatially and temporally non-random; they occur in the spawning season near respective spawning areas (Bond 1980; Bond and Berry 1980a, 1980b). Lake whitefish also have a higher relative abundance in the fall near suspected spawning areas (Bond and Berry 1980a, 1980b). Many species showing changes in the fish inventory data, including white sucker, walleye, lake whitefish, and goldeye have suspected upstream spawning migrations from Lake Athabasca (Bond 1980; Bond and Berry 1980a, 1980b). Telemetry studies done using walleye and lake whitefish during RAMP support this contention (RAMP 1999).
Similarly, overwintering location may explain the differing conclusions between this study and analyses from the fish fences (RAMP 2010; Schwalb et al. 2015). Among the fishes showing persistent declines in 2009 compared with the earliest fences, Arctic grayling likely overwinter in the Athabasca River (Bond 1980). Mountain whitefish may overwinter in both the Athabasca and Clearwater rivers upstream of Fort McMurray (Bond 1980), but are also rare in the inventory (Tables S3 and S4). The final species showing a persistent decline in fish fence data, longnose sucker, also shows a pattern of changes in length in the fish inventories, albeit muted and delayed when compared with white sucker (Fig. S9). The occurrence of attributes of overwintering in the Athabasca River and Lake Athabasca suggest a life cycle in longnose sucker inhabiting the Athabasca basin that includes both behaviours. This contention is supported by radio-telemetry studies done during RAMP, which suggest the longnose sucker migrating from Lake Athabasca spawn in the mainstem, whereas those spawning in tributaries overwinter in the Athabasca River (RAMP 2002). Furthermore, until 2006 white sucker showed similar declines in the fish fence data when compared with Arctic grayling, mountain whitefish, and longnose sucker. Patterns in the relative abundance of white sucker compared with the others diverged in 2009. This suggests that some alterations in some of the factors affecting the relative abundances of fishes in the lower Athabasca basin occurred within the last decade, and indicate the importance of considering ecology in monitoring studies of migratory species (Arens et al. 2017). More specifically, changes occur most frequently in species that migrate from Lake Athabasca into the oil sands area to spawn.
In the fish inventory data, clear changes were observed in several migratory species (white sucker, walleye, and lake whitefish) and emerged in a specific form (increased size and (or) relative abundance). Among the interpretive frameworks used to evaluate the results of fish health studies, increased size and relative abundance can be associated with more food per individual (Gibbons and Munkittrick 1994). If demographic factors, such as changing sex ratios, are not important, more energy available per individual fish may be attributed to eutrophication. Evidence from other studies suggests a possible role of eutrophication. Increases in N and P over time have been observed in the Athabasca River in earlier work (Dubé and Wilson 2013). Results from RAMP have also suggested intermittent nutrient enrichment in benthic invertebrates in the Peace–Athabasca delta and some tributaries, including the Ells, Muskeg, MacKay, lower Clearwater, and Firebag rivers (RAMP 2010, 2011, 2012). Furthermore, white sucker has shown responses associated with changes in nutrient loading elsewhere (Arciszewski et al. 2015) and other work also suggests that walleye populations in Alberta may be sensitive to eutrophication (Mogensen et al. 2014) suggesting the plausibility of this effect.
If eutrophication is occurring in the Athabasca River, the nutrients could originate from multiple sources. Nutrients may arise from the Athabasca watershed upstream of Fort McMurray, but nutrients may also enter the Athabasca River within the study area. The spatial relationships in TN and TP support both routes. Although the upstream nutrient load is not likely related to the oil sands, nutrient inputs between the locations of the water sampling may derive from atmospheric deposition of nitrogenous compounds emitted primarily from stacks and mine fleets (Fenn et al. 2015; Lynam et al. 2015; McLinden et al. 2016). Total N deposition in the oil sands region estimated for current development is 165 eq/ha per year (Cho et al. 2017) and may be associated with increased productivity in local waterbodies (Hazewinkel et al. 2008). Summers et al. (2016) suggested, however, that warming, rather than nutrient enrichment, is driving increased productivity in local lakes, which may have a role in explaining some of our results. Inconsistencies in the deposition of nitrogenous compounds on the landscape and transportation to watercourses over time may also explain some noise in TN among stations compared with TP.
The discharge of sewage may also be affecting productivity in the Athabasca River. The mean daily loading of TP from the Fort McMurray wastewater treatment plant rose from 10 to 15 kg/d from 2011 to 2014 (Regional Municipality of Wood Buffalo 2012a, 2015). Other possible sources of nutrients from wastewater are industrial facilities, communities, and work camps. Although detailed information on the treatment types and discharge volume or chemical characterization from these additional sources was not sought, a surrogate measurement, such as the shadow population, may be informative. The shadow population, including those living in work camps increased from 3500 to 40 000 between 2000 and 2012 (Regional Municipality of Wood Buffalo 2010, 2012b), including a specific one-year increase from 10 442 to 18 572 from 2006 to 2007 (Regional Municipality of Wood Buffalo 2010). This increase in population indirectly suggests an increase in wastewater production and may further explain some noise in the relationship of TN among the water chemistry locations.
Although an expected response of fishes to eutrophication does explain some observations, others are not consistent with this explanation. No differences are apparent in length, weight, and condition of walleye or white sucker collected in the fall (Figs. S10, S11) and there is no substantive evidence of increases in growth, estimated as length-at-age, in these species (Fig. 3). Signals of eutrophication do not appear in all species and are missing from small-bodied species residing throughout the study area year-round, including trout-perch, lake chub (Couesius plumbeus), and flathead chub (Platygobio gracilis; Fig. S3). Although detecting change in the fish inventory data set using small-bodied species is challenging, the clearest patterns are focused in fishes that overwinter in Lake Athabasca. There may be some role of eutrophication, but nutrients are not likely the key driver in explaining the changes we observed in walleye and white sucker. Other factors, either alone or in combination with nutrient enrichment, are likely responsible for the changes observed here.
An effect of mortality may also explain some of the observations presented here, but may occur to specific life stages. First, emergence of more food per individual may be related to the increased mortality of juveniles (Gibbons and Munkittrick 1994). A predicted effect of exposure to oil sands constituents is acute toxicity, especially in early life stages (Colavecchia et al. 2006). Regionally, juvenile white sucker are also likely predated by walleye (Arens et al. 2015). Unfortunately, the changes in the relative abundances of juvenile fishes, including white sucker, cannot be estimated from the inventory data; collections before and after 2003 did not equally emphasize small fish. However, an effect of mortality on juveniles would likely eventually emerge as declines in the abundance of adults. Furthermore, an expected pattern of responses and subsequent observations, if juvenile mortality occurred in the oil sands region, is increased growth rates of survivors along with reduced abundance (Gibbons and Munkittrick 1994). In the fish inventory data, walleye and white sucker showed no substantive evidence of a change in growth rate, and the relative abundances of both species has increased over time. An increase in relative abundance suggests a mechanism other than increased juvenile mortality.
An increase in the relative abundances of some species during spawning runs may instead be related to the reduced mortality of adults. The reduction of adult mortality, especially in potamodromous species, may be associated with a decrease in downstream fishing pressure in Lake Athabasca. Reduced effort in commercial fisheries explains changes observed in goldeye, lake whitefish, and walleye. The increased relative abundance of white sucker is more difficult to explain. The non-commercial catch of white sucker may have declined (Balagus et al. 1993), but the higher relative abundance of this species may also be related to a possible collateral effect of the decreased harvesting of walleye. Gillnets used for walleye in Lake Athabasca are 10.2 cm (Paul 2013). Gillnets with 10.2 cm mesh sizes were also used to collect fishes, including northern pike, walleye, and white sucker from Lake Athabasca and the Peace–Athabasca delta for tissue analyses during the Northern River Basins Study (Balagus et al. 1993). Although by-catch data were not found for Lake Athabasca, 10.2 cm gillnets have also efficiently captured walleye, white sucker, longnose sucker, and northern pike where those species co-occur (Arciszewski et al. 2015). Furthermore, a reduction in fishing effort may have coincided with a slight effect of nutrient enrichment.
If reduced mortality of adult fishes migrating from Lake Athabasca is responsible for the upstream changes, the reasons for a change in commercial harvest are not clear. The notable increases in the relative abundances suggest that the stocks were likely healthy during the fish inventory and when fishing pressure decreased. This suggests the reported reductions in catch rates were not related to the health of the fishery but could instead be linked to sociological factors, including rising fears and uncertainties of consuming fish caught locally (Tolton et al. 2012; Ohiozebau et al. 2017), changing demographics and vocations of members of local communities (Balagus et al. 1993; Parlee 2015), some other reason, or a combination of factors. However, all commercial fisheries in Alberta lakes were closed in August 2014 (AEP 2014). Any relationship between the closure decision and the data presented here is not clear.
Finally, there is another possibility to explain the observations presented here. The patterns we observed could be attributed to a change in sampling methodology. The inventory protocols expanded in 2003, but these later collections biased the data against the patterns we observed. The change in fishing protocol after 2002 increased the emphasis on collecting small fishes, including both small-bodied species and juveniles of large-bodied species. In relative numbers, larger white sucker and walleye have become more common over time, suggesting that the change in emphasis after 2002 did not affect the sampling of these species. Furthermore, if the changes we observed in the Athabasca mainstem were related to sampling methods, we would also expect similar changes in the Clearwater River over the same sampling period; this pattern, however, was not observed (Fig. S4).
Although the evidence for an effect of overwintering location and spawning migrations seems clear, not all observations suggest a direct and simple connection. Mysteriously, possible increases in CPUE were observed in some species in non-spawning seasons. Although these changes in the relative abundances during the non-spawning seasons may be important, the influence of low relative abundances observed during many sampling campaigns between 1987 and 2006 on the calculation of the bootstrapped thresholds affects their clear interpretation. Corresponding to the difficulty of identifying real change in monitoring data (Arciszewski et al. 2017), some changes in the relative abundances of some species in some seasons at some locations may also be statistical anomalies or may be due to the minor influence of juveniles of these species.
Although decisions to pool fish length data from consistently sampled reaches overcame the low sample sizes in the initial years, the detection of changes via the development of triggers was also clearly beneficial. However, understanding the performance of tools in various scenarios is necessary. For instance, normal ranges may not behave as expected in some cases (Kilgour and Somers 2017). In three of six endpoints examined using tolerance intervals (white sucker length and weight and walleye length) the tools and their application performed well. In the remaining endpoints, walleye weight and condition and white sucker condition, tolerance intervals, and more likely, the processes used for their application, including adapting triggers, did not perform well. Tolerance intervals configured as adaptive triggers may drift where observations are close to, but do not exceed a trigger (e.g., walleye weight) or where measurements alternate inside and outside triggers (e.g., white sucker condition). More generally, a lack of variability in annual means may also generate triggers that are likely too sensitive. This likely occurred in walleye condition. In the instances where tolerance intervals may not be appropriate, such as when fewer than three years of data are available, data are non-normal, or little variation in means is apparent in initial years of collection, an alternative approach, such as weighted means, nonparametric bootstrapping (Barrett et al. 2015), or alterations in the number of observations expected above thresholds (Arciszewski and Munkittrick 2015) may be useful to detect unexpected observations and further account for unequal sample sizes each year (Fig. S12). An important challenge in the use of normal ranges is when early data reflect a specific (and potentially uncommon, but also unknown) exposure scenario. This can be especially problematic during the initial years of a monitoring program. In these instances, relying on OTLs may be one of the few options available for understanding the occurrence of change. However, ecological considerations are also likely important in the development and application of thresholds. In this work, the exact timing of the fish collections relative to spawning within each year may also explain the unusual behavior of annual means of the condition of white sucker relative to the estimated normal ranges.
Conclusions
Monitoring programs are often limited by the absence of information on the relevance of the differences inevitably encountered (Munkittrick et al. 2009). Here, thresholds calculated for fish size using tolerance intervals and for relative abundance using parametric bootstrapping identified several unusual observations after 2006. Our work suggests that some potamodromous species likely overwintering in Lake Athabasca are thriving. The form of changes observed suggests a role of either eutrophication or reduced fishing pressure in Lake Athabasca. Although some influence of increased nutrients on fish may be occurring, an effect of reduced fishing pressure in Lake Athabasca is likely a predominant driver in the changes detected. An effect of reduced fishing pressure has not been previously considered in the oil sands region. Although the origins may not be explicitly known, the patterns we detected are difficult to ignore. If this approach was in place during the original collections, focused studies examining the increasing size would have been initiated in 2009.
Acknowledgements
No external funding was provided for this work. We would like to thank the COSIA Monitoring Priority Area Steering Committee and other industry representatives for valuable comments provided during the preparation of this manuscript. Thank you to Rod Hazewinkel at Alberta Environment and Parks for providing the wastewater reports for the Fort McMurray wastewater facility. We greatly appreciate the insights provided by two anonymous and kind reviewers for improving the interpretation of the data.
Alexander AC, Chambers PA, and Jeffries DS. 2017. Episodic acidification of 5 rivers in Canada’s oil sands during snowmelt: a 25-year record. Science of the Total Environment, 599: 739–749.
Arciszewski TJ, and Munkittrick KR. 2015. Development of an adaptive monitoring framework for long-term programs: an example using indicators of fish health. Integrated Environmental Assessment and Management, 11(4): 701–718.
Arciszewski TJ, McMaster ME, Portt C, and Munkittrick KR. 2015. Detection of food limitation in health of white sucker (Catostomus commersoni) 5 years after the closure of a bleached kraft pulp mill. Water Quality Research Journal of Canada, 50(2): 152–166.
Arens CJ, Hogan NS, Kavanagh RJ, Mercer AG, Van Der Kraak GJ, and van den Heuvel MR. 2015. Sublethal effects of aged oil sands-affected water on white sucker (Catostomus commersonii). Environmental Toxicology and Chemistry, 34(3): 589–599.
Arens CJ, Arens JC, Hogan NS, Kavanagh RJ, Berrue F, Van Der Kraak GJ, et al. 2017. Population impacts in white sucker (Catostomus commersonii) exposed to oil sands-derived contaminants in the Athabasca River. Environmental Toxicology and Chemistry, 36(8): 2058–2067.
Balagus P, de Vries A, and Green JE. 1993. Northern River Basins Study project. Report No. 20: collection of fish from the traditional winter fishery on the Peace-Athabasca Delta, February, 1993. Prepared for the Northern River Basins Study under project 3118-B2, Edmonton, Alberta [online]: Available from barbau.ca/content/northern-river-basins-study-project.
Barrett TJ, Hille KA, Sharpe RL, Harris KM, Machtans HM, and Chapman PM. 2015. Quantifying natural variability as a method to detect environmental change: definitions of the normal range for a single observation and the mean of m observations. Environmental Toxicology and Chemistry, 34(5): 1185–1195.
Bond W. 1980. Fishery resources of the Athabasca River downstream of Fort McMurray, Alberta. Vol. I. Alberta Oil Sands Environmental Research Program, Edmonton, Alberta.
Bond W, and Berry D. 1980a. Fishery resources of the Athabasca River downstream of Fort McMurray, Alberta. Vol. II. Alberta Oil Sands Environmental Research Program, Edmonton, Alberta.
Bond W, and Berry D. 1980b. Fishery resources of the Athabasca River downstream of Fort McMurray, Alberta. Vol. III. Alberta Oil Sands Environmental Research Program, Edmonton, Alberta.
Cho S, Vijayaraghavan K, Spink D, Jung J, Morris R, and Pauls R. 2017. Assessment of regional acidifying pollutants in the Athabasca oil sands area under different emission scenarios. Atmospheric Environment, 156: 160–168.
Colavecchia MV, Hodson PV, and Parrott JL. 2006. CYP1A induction and blue sac disease in early life stages of white suckers (Catostomus commersoni) exposed to oil sands. Journal of Toxicology and Environmental Health, Part A, 69(10): 967–994.
Dubé MG, and Wilson JE. 2013. Accumulated state assessment of the Peace-Athabasca-Slave River system. Integrated Environmental Assessment and Management, 9(3): 405–425.
Evans M, Davies M, Janzen K, Muir D, Hazewinkel R, Kirk J, et al. 2016. PAH distributions in sediments in the oil sands monitoring area and western Lake Athabasca: concentration, composition and diagnostic ratios. Environmental Pollution, 213: 671–687.
Fenn ME, Bytnerowicz A, Schilling SL, and Ross CS. 2015. Atmospheric deposition of nitrogen, sulfur and base cations in jack pine stands in the Athabasca Oil Sands Region, Alberta, Canada. Environmental Pollution, 196: 497–510.
Gibbons WN, and Munkittrick KR. 1994. A sentinel monitoring framework for identifying fish population responses to industrial discharges. Journal of Aquatic Ecosystem Health, 3(3): 227–237.
Hatfield Consultants Partnership, Kilgour & Associates, and Western Resource Solutions. 2016. Regional Aquatics Monitoring in support of the Joint Oil Sands Monitoring Plan 2015 Final Program Report [online]: Available from ramp-alberta.org/ramp/results/report.aspx.
Hazewinkel RR, Wolfe AP, Pla S, Curtis C, and Hadley K. 2008. Have atmospheric emissions from the Athabasca Oil Sands impacted lakes in northeastern Alberta, Canada? Canadian Journal of Fisheries and Aquatic Sciences, 65(8): 1554–1567.
Hodson P, Munkittrick K, Stevens R, and Colodey A. 1996. A tier-testing strategy for managing programs of environmental effects monitoring. Water Quality Research Journal of Canada, 31(2): 215–224.
Kelly EN, Short JW, Schindler DW, Hodson PV, Ma MS, Kwan AK, et al. 2009. Oil sands development contributes polycyclic aromatic compounds to the Athabasca River and its tributaries. Proceedings of the National Academy of Sciences of the United States of America, 106(52): 22346–22351.
Kelly EN, Schindler DW, Hodson PV, Short JW, Radmanovich R, and Nielsen CC. 2010. Oil sands development contributes elements toxic at low concentrations to the Athabasca River and its tributaries. Proceedings of the National Academy of Sciences of the United States of America, 107(37): 16178–16183.
Kilgour BW, and Somers KM. 2017. Challenges with the use of normal ranges in environmental monitoring. Integrated Environmental Assessment and Management, 13: 444–446.
Kilgour BW, Somers KM, and Matthews DE. 1998. Using the normal range as a criterion for ecological significance in environmental monitoring and assessment. Écoscience, 5: 542–550.
Kilgour BW, Somers KM, Barrett TJ, Munkittrick KR, and Francis AP. 2017. Testing against “normal” with environmental data. Integrated Environmental Assessment and Management, 13(1): 188–197.
Kurek J, Kirk JL, Muir DCG, Wang X, Evans MS, and Smol JP. 2013. Legacy of a half century of Athabasca oil sands development recorded by lake ecosystems. Proceedings of the National Academy of Sciences of the United States of America, 110(5): 1761–1766.
Lynam MM, Dvonch JT, Barres JA, Morishita M, Legge A, and Percy K. 2015. Oil sands development and its impact on atmospheric wet deposition of air pollutants to the Athabasca Oil Sands Region, Alberta, Canada. Environmental Pollution, 206: 469–478.
McLinden CA, Fioletov V, Krotkov NA, Li C, Boersma KF, and Adams C. 2016. A decade of change in NO2 and SO2 over the Canadian oil sands as seen from space. Environmental Science & Technology, 50(1): 331–337.
Mogensen S, Post JR, and Sullivan MG. 2014. Vulnerability to harvest by anglers differs across climate, productivity, and diversity clines. Canadian Journal of Fisheries and Aquatic Sciences, 71(3): 416–426.
Munkittrick KR, McGeachy SA, McMaster ME, and Courtenay SC. 2002. Overview of freshwater fish studies from the pulp and paper environmental effects monitoring program. Water Quality Research Journal of Canada, 37(1): 49–77.
Ohiozebau E, Tendler B, Hill A, Codling G, Kelly E, Giesy JP, et al. 2016. Products of biotransformation of polycyclic aromatic hydrocarbons in fishes of the Athabasca/Slave River system, Canada. Environmental Geochemistry and Health, 38(2): 577–591.
Ohiozebau E, Tendler B, Codling G, Kelly E, Giesy JP, and Jones PD. 2017. Potential health risks posed by polycyclic aromatic hydrocarbons in muscle tissues of fishes from the Athabasca and Slave Rivers, Canada. Environmental Geochemistry and Health, 39(1): 139–160.
Paul AJ. 2013. Environmental flows and recruitment of walleye (Sander vitreus) in the Peace–Athabasca Delta. Canadian Journal of Fisheries and Aquatic Sciences, 70(2): 307–315.
Regional Aquatics Monitoring Program (RAMP). 1999. Report on oil sands Regional Aquatics Monitoring Program (RAMP) 1998. Prepared by Golder Associates, Calgary, Alberta [online]: Available from ramp-alberta.org/ramp/results/report.aspx.
Regional Aquatics Monitoring Program (RAMP). 2002. Oil sands Regional Aquatics Monitoring Program (RAMP) 2001: volume 1: chemical and biological monitoring. Prepared by Golder Associates, Calgary, Alberta [online]: Available from ramp-alberta.org/ramp/results/report.aspx.
Regional Aquatics Monitoring Program (RAMP). 2010. 2009 technical report. Prepared by Hatfield Consultants Partnership, North Vancouver, British Columbia [online]: Available from ramp-alberta.org/ramp/results/report.aspx.
Regional Aquatics Monitoring Program (RAMP). 2011. 2010 technical report. Prepared by Hatfield Consultants Partnership, North Vancouver, British Columbia [online]: Available from ramp-alberta.org/ramp/results/report.aspx.
Regional Aquatics Monitoring Program (RAMP). 2012. 2011 technical report. Prepared by Hatfield Consultants Partnership, North Vancouver, British Columbia [online]: Available from ramp-alberta.org/ramp/results/report.aspx.
Schwalb AN, Alexander AC, Paul AJ, Cottenie K, and Rasmussen JB. 2015. Changes in migratory fish communities and their health, hydrology, and water chemistry in rivers of the Athabasca oil sands region: a review of historical and current data. Environmental Reviews, 23(2): 133–150.
Smokorowski KE, and Randall RG. 2017. Cautions on using the Before-After-Control-Impact design in environmental effects monitoring programs. FACETS, 2(1): 212–232.
Summers JC, Kurek J, Kirk JL, Muir DCG, Wang X, Wiklund JA, et al. 2016. Recent warming, rather than industrial emissions of bioavailable nutrients, is the dominant driver of lake primary production shifts across the Athabasca Oil Sands Region. PLoS ONE, 11(5): e0153987.
Tetreault GR, McMaster ME, Dixon DG, and Parrott JL. 2003. Using reproductive endpoints in small forage fish species to evaluate the effects of Athabasca oil sands activities. Environmental Toxicology and Chemistry, 22(11): 2775–2782.
Tolton JL, Young RF, Wismer WV, and Fedorak PM. 2012. Fish tainting in the Alberta oil sands region: a review of current knowledge. Water Quality Research Journal of Canada, 47(1): 1–13.
Wallace RR, and McCart PJ. 1984. The fish and fisheries of the Athabasca River Basin: their status and environmental requirements. Alberta Environment, Edmonton, Alberta.
All relevant data are within the paper, the Supplementary Material, online (raw data for the fish inventory are available from ramp-alberta.org; mean daily discharge data for the Athabasca River downstream of Fort McMurray (station 07DA001) are available from Environment and Climate Change Canada (wateroffice.ec.gc.ca/); total phosphorus and total nitrogen data for the Athabasca river (AB07CC0030, AB07DD0010, AB07DD0105) are available from ems.alberta.ca/reports/viewreport5.aspx), available from Alberta Environment and Parks (catch data), and available from CAPP (2016) (oil sands production data).
HMK and JEL performed the experiments/collected the data.
TJA and KRM analyzed and interpreted the data.
HMK contributed resources.
All drafted or revised the manuscript.
Competing Interests
JEL is employed by Suncor Energy, a sponsor of much of the original data collection; KRM reviewed earlier monitoring programs (source of the data); TJA, BWK, and HMK were employed as consultants for the original program; TJA and KRM were employed by an oil sands organization at the time of manuscript preparation.
Metrics & Citations
Metrics
Other Metrics
Citations
Cite As
Tim J. Arciszewski, Kelly R. Munkittrick, Bruce W. Kilgour, Heather M. Keith, Janice E. Linehan, and Mark E. McMaster. 2017. Increased size and relative abundance of migratory fishes observed near the Athabasca oil sands. FACETS.
2(): 833-858. https://doi.org/10.1139/facets-2017-0028
Export Citations
If you have the appropriate software installed, you can download article citation data to the citation manager of your choice. Simply select your manager software from the list below and click Download.
Cited by
1. A critical review of the ecological status of lakes and rivers from Canada's oil sands region
2. Paleolimnological assessment of past hydro-ecological variation at a shallow hardwater lake in the Athabasca Oil Sands Region before potential onset of industrial development
3. Exploring the Influence of Industrial and Climatic Variables on Communities of Benthic Macroinvertebrates Collected in Streams and Lakes in Canada’s Oil Sands Region
4. Historical control data in ecotoxicology: Eight years of tests with the copepod Acartia tonsa
5. Challenges and Benefits of Approaches Used to Integrate Regional Monitoring Programs
6. Potential Influence of Sewage Phosphorus and Wet and Dry Deposition Detected in Fish Collected in the Athabasca River North of Fort McMurray
7. Long‐Term Studies of Fish Health before and after the Closure of a Bleached Kraft Pulp Mill in Northern Ontario, Canada
8. Fish Performance Indicators Adjacent to Oil Sands Activity: Response in Performance Indicators of Slimy Sculpin in the Steepbank River, Alberta, Adjacent to Oil Sands Mining Activity
9. The interactive effects of climate change and land use on boreal stream fish communities
10. Current knowledge of seepage from oil sands tailings ponds and its environmental influence in northeastern Alberta
11. Developing Triggers for Environmental Effects Monitoring Programs for Trout‐Perch in the Lower Athabasca River (Canada)
12. Advances in science and applications of air pollution monitoring: A case study on oil sands monitoring targeting ecosystem protection
13. Multiple threats and stressors to the Athabasca River Basin: What do we know so far?
14. Developing and applying control charts to detect changes in water chemistry parameters measured in the Athabasca River near the oil sands: A tool for surveillance monitoring