Fathead minnow exposed to environmentally relevant concentrations of metformin for one life cycle show no adverse effects
Abstract
Metformin is a glucose-lowering drug taken for diabetes. It is excreted by humans in urine and detected in municipal wastewater effluents and rivers. Fathead minnows (Pimephales promelas) were exposed over a life cycle to measured concentrations of metformin: 3.0, 31, and 322 μg/L. No significant changes were observed in survival, maturation, growth, condition factor, or liver size. Relative ovary size of females exposed to 322 μg/L metformin was significantly larger than controls. There was no induction of vitellogenin in plasma of minnows, and gonad maturation was not statistically different from controls. The start of breeding was delayed by 9–10 d in the mid- and high metformin treatments (statistically significant only in the mid-concentration), but numbers and quality of eggs were not statistically different from controls. There were no effects of metformin on survival or growth of offspring. Exposure to metformin at environmentally relevant concentrations (i.e., 3.0 and 31 μg/L metformin) caused no adverse effects in fathead minnows exposed for a life cycle, with the exception of a delay in time to first breeding (that did not impact overall egg production). The results of the study are important to help understand whether metformin concentrations in rivers and lakes can harm fishes.
Graphical Abstract
1. Introduction
Metformin (MW 129.16, CAS #657-24-9, Fig. 1) is a drug used for treating noninsulin-dependent diabetes. It decreases blood glucose levels by decreasing hepatic glucose production, decreasing intestinal absorption of glucose and improving insulin sensitivity by increasing peripheral glucose uptake and utilization (Drugbank 2017). Metformin is taken by humans at doses of about 500–1000 mg daily and is excreted by the kidneys as unchanged compound in urine (Drugbank 2017). No metabolites have been identified in humans, and metformin does not undergo hepatic metabolism or biliary excretion. Approximately 90% of the drug is eliminated in 24 h in those with healthy renal function. Metformin can be degraded by microbes in municipal wastewater treatment plants to guanylurea (Fig. 1) (Scheurer et al. 2009; Trautwein and Kümmerer 2011; Trautwein et al. 2014), but efficiency of this process varies, so metformin is often present at detectable levels in municipal wastewater effluents (MWWE) and surface waters.
Fig. 1.
A recent study conducted in Lake Michigan showed that metformin was detected at 1.2 μg/L (mean) up to 3.8 μg/L (max) in MWWE (Blair et al. 2013). Concentrations of metformin in nearby surface waters (1.6–3.2 km from MWWE source) ranged from 0.1 to 0.2 μg/L (Blair et al. 2013). Recently, metformin was detected in 40% of source waters in a survey of 25 drinking water treatment plants in the United States (Glassmeyer et al. 2017). A recent paper by Sarma et al. (2017) reviewed metformin concentrations in MWWEs and river waters. Surveys have found metformin in 66%–97% of river sites in the United States (Bradley et al. 2016, 2017). Metformin was detected in MWWE at 19.8 μg/L and in upstream river water at 2.3 μg/L in southwest England (Petrie et al. 2016), in MWWEs in Germany at 2.2–21 μg/L, and in river waters at 0.130–1.7 μg/L (Scheurer et al. 2009). Metformin was detected 99% of the time in 217 river waters in China, with maximum concentrations at 5.8 μg/L (Yao et al. 2018). Predicted concentrations for 54 pharmaceutical drugs in Swedish rivers showed metformin concentrations were consistently the highest of all pharmaceuticals detected (Lindim et al. 2019).
There is little published data on the concentrations of metformin in MWWEs or surface waters in Canada. Previously metformin was detected at a mean concentration of 70 μg/L in one MWWE (range 41–123 μg/L, Hamilton MWWE, sampled February–March 2009 (Parrott, unpublished data)). In Canadian effluents, MWWE concentrations of metformin ranged from 0.84 to 0.97 μg/L (Kim et al. 2014). Concentrations of metformin in eastern Canada (Nova Scotia) were up to 10.6 μg/L in MWWEs and up to 1.5 μg/L in downstream river water (Annapolis River) (Ghoshdastidar et al. 2015). Metformin was detected at concentrations of up to 10 μg/L (mean concentrations were 2.8 μg/L) in waters of the Grand River, Ontario (de Solla et al. 2016). The maximum concentration of metformin in surface water samples in coastal aquatic environments of Canada, the United States, and Europe was 59 μg/L (Tao et al. 2018).
There are some studies of the short-term effects of metformin in laboratory fish that indicate changes in genes coding for reproductive hormones. Fathead minnow (Pimephales promelas) mixed-sex juveniles (age 70–80 d post-hatch (dph)) exposed to 1, 10, or 100 μg/L metformin for 7 d had significantly increased whole-body mRNA coding for four genes (vitellogenin, estrogen receptor alpha, gonadotropin releasing hormone 3, and CYP3A). However, changes were not seen in these same genes in livers of adult male minnows (although some trends were evident) (Crago et al. 2016).
Longer fish exposure studies of metformin have been conducted that show decreased fish growth or hormone alterations. Embryo-larval Japanese medaka (Oryzias latipes) exposed to metformin for 28 d (1–100 μg/L) had decreased length at exposures of ≥10 μg/L and decreased weight at exposures of ≥3.2 μg/L (Ussery et al. 2018). Similar 28-d exposures of medaka to guanylurea (1–100 ng/L) caused decreased weight and length at the lowest exposure concentration (Ussery et al. 2019). After life cycle (165 d) exposure of medaka to 3.2 μg/L metformin there were no significant differences in weights or lengths of fish (although males weighed 12% less than control males), but female medaka had significantly increased 11-ketotestosterone in their livers compared with control females (Ussery et al. 2018). Trends of decreased weights of males were also detected in medaka exposed for a life cycle to guanylurea/metformin mixture (7.5 μg/L/3.2 μg/L) but these were not significant although mixture-exposed males weighed 11% less than control males (Ussery et al. 2019). In fathead minnow studies, adult male fish exposed for 28 d to 40 μg/L metformin had increased mRNA for vitellogenin (VTG, an egg-yolk protein precursor), but no increases in VTG plasma protein concentrations (Niemuth et al. 2015).
A life cycle exposure of fathead minnows to metformin was conducted, exposing fish to 40 μg/L for over 10 months (Niemuth and Klaper 2015). The study observed intersex in male testes and reduced reproduction in fathead minnow (Pimephales promelas) that were exposed from the juvenile stage (30 dph) through adulthood to metformin in static tanks renewed every 3–4 d (Niemuth and Klaper 2015; Niemuth et al. 2015; Klaper and Niemuth 2016).
These studies have come under question (Sumpter et al. 2016) because of the limited nature of the exposures (only one concentration was tested) and the finding of intersex in control male fathead minnows. In addition, metformin is not structurally similar to known estrogen agonists, so the observed intersex (oocytes in testes of male fathead minnows exposed to metformin) was surprising. Given the number of questions arising from the life cycle study (Sumpter et al. 2016), it was important to repeat the exposures at several concentrations over a whole life cycle, from the egg stage to breeding adult, in a flow-through exposure system.
The objective of this research was to assess the effects of chronic exposure of fathead minnows to three concentrations of metformin in a flow-through exposure over a full life cycle, including effects on F1 offspring. The metformin exposures of fathead minnows began at the embryo stage and continued for 5.5 months, assessing growth of fish, maturation, and breeding success. The survival and growth of F1 larvae were also monitored. Concentrations of VTG in plasma of adult fish were assessed, along with testes and ovary maturity using histology, and rigorous assessment of male testes for any evidence of ovo-testis.
In this study, the concentration range for the metformin life cycle exposure was selected to represent concentrations detected in the environment. The concentrations in the lowest metformin treatment (3.0 μg/L nominal) were chosen to be consistent with the concentrations of metformin detected in local rivers: A mean of 3 μg/L was the average concentration of metformin detected the Grand River, Ontario, Canada (de Solla et al. 2016). The middle metformin concentration (30 μg/L nominal) was chosen to represent the concentration of metformin at the end of a typical MWWE discharge pipe. Finally, the highest metformin concentration (300 μg/L nominal) was 10× the MWWE metformin concentration, which would be a realistic “worst-case” concentration of metformin in MWWE, which may occur with population increases, more people taking metformin, and (or) ineffective wastewater treatment.
2. Materials and methods
2.1. Flow-through exposures
Peristaltic pumps were used to deliver metformin to tanks of fathead minnow in a flow-through exposure lasting 177 d. Exposure was to metformin-HCl (metformin hydrochloride C4H11N5–HCl, MW165.62, Pharmaceutical Secondary Standard Certified Reference Material). Flows to each 12 L tank were 24 L per day. Full details of the exposure methods are in Supplementary Material 1.
2.2. Analysis of metformin
Metformin was measured every two weeks in each of the 20 individual exposure aquaria. Samples were filtered and an aliquot of 180 μL was diluted with 20 μL of either a diluted labelled solution of dimethyl D6 metformin hydrochloride or 15N4 guanylurea hydrochloride. The resulting sample was directly injected onto a Waters Xevo TQS tandem quadrupole mass spectrometer coupled to an Acquity ultra high performance liquid chromatograph. The limit of detection (LOD) for metformin was 0.0088 μg/L. The limit of quantification (LOQ) for metformin was 0.029 μg/L. The LOD and LOQ for guanylurea, the main metformin breakdown product, were 1.3 μg/L and 5.4 μg/L, respectively. Details of the metformin analysis are found in Supplementary Material 1 and Supplementary Material 2 Figs. S1–S4.
2.3. Fathead minnow exposures
All fathead minnow exposures to metformin and sampling/euthanasia methods were approved under animal use protocol #1848 reviewed by the Department of Fisheries and Oceans/Environment Canada Joint Animal Care Committee for the Canada Centre for Inland Waters (Burlington, Ontario, Canada), This committee is operated under Canadian Council of Animal Care approval.
Detailed methods for fathead minnow exposures are found in Supplementary Material 1. Briefly, each tank contained 30 fathead minnow eggs <12 h post-fertilization (sources Aquatox, Aberfoyle, Ontario, Canada and Ontario Ministry of the Environment Lab, Etobicoke, Ontario, Canada), 10 in each of 3 egg cups. Exposure temperature was controlled at 25 °C by water bath surrounding aquaria. Photoperiod was 16 h light and 8 h dark with dawn and dusk dimming. Dilution water for the metformin was fish lab water, which was municipal water for the City of Burlington, Ontario, Canada, that was dechlorinated by charcoal filtration, followed by filtration for particulates, and UV sterilization. Water temperature, dissolved oxygen, pH, conductivity, and ammonia were measured once a week in all fish exposure aquaria. Larval fish were fed 2× per day newly hatched brine shrimp. As fish grew, diet was switched to 2-d-old hatched brine shrimp, with additional frozen and thawed brine shrimp added as fish grew (as described in Supplementary Material 2 Table S3).
Random culling of fish over time maintained appropriate densities for remaining fish to grow. At 78 dph, three breeding tiles were added to each tank to promote maturation of males and breeding/spawning behaviours. Eggs were counted and assessed for stage of development, deformities, and fertilization. Breeding was monitored until 168 dph. Up to 100 fertilized eggs from each batch were placed in screen-bottomed egg cups in separated flow-through aquaria containing clean lab water (aerated) and observed until hatch, or until 9 and 16 dph. For the entire experiment over 192 700 eggs were counted and observed (31 780 to 46 495 eggs from metformin treatments, which had 4 replicates, and 75 666 eggs from the control treatment, which had eight replicates).
At 169–172 dph, all of the adult fish from the controls and metformin-exposure aquaria were sampled and dissected. Methods for dissection are described in Supplementary Material 1. Concentrations of VTG in individual fish plasma samples were determined using a TECO Cyprinid Vitellogenin ELISA kit. Gonad sampling and processing methods were based on published methods (Ankley 2006; Tetreault et al. 2011). Methods for scoring and counting of gonads were based on Ankley (2006). Female tissues were imaged at 50× magnification. Oocytes were categorized as primary, cortical alveolar, early vitellogenic, late vitellogenic, or atretic and the number of each counted. Male tissues were scanned at 200× magnification for the presence of testis-ova (male testicular tissue with female oocytes present) and each sample staged as follows: stage 0—underdeveloped, stage 1—early spermatogenic, stage 2—mid spermatogenic, stage 3—late spermatogenic. On average about 20–25 slides were assessed per male fish. Details of the sampling, preservation and histological scoring of gonads are found in Supplementary Material 1.
2.4. Statistical analyses
Data were analyzed using Systat 11.0 (Systat Software Inc., San José, California, USA). Data were checked for normality by sex and by treatment (control, 3.0, 31, 322 μg/L metformin) for growth parameters, and by treatment for egg production and reproductive parameters (i.e., egg viability and hatching success) using the Shapiro–Wilk normality test. In about 90% of the cases, (i.e., 86% of the survival data, 92% of the growth data, 90% of the mature fish sampling data, 92% of the data on egg production and 95% of the data on egg quality, 91% of the data on larval survival and growth, 81% of the female oocyte stage data) the data were distributed normally, so analysis of variance (ANOVA) was performed using untransformed data. Mean VTG concentrations in plasma and mucous of adult fish were not normally distributed (33% of data were normal), so log VTG concentrations were used for statistics (once logged, the VTG data were 87.5% normal).
Growth parameters of length (mm), weight (g), condition factor (CF), liver-somatic index (LSI), gonadosomatic index (GSI), ovipositor area of females (mm2), male index, tubercle index, and log VTG were assessed for each sex for differences among treatments using ANOVA. This statistical analysis approach was also used to assess F1 parameters (i.e., % hatch, % larval deformities, % larval survival, larval lengths and weights at 9 and 16 dph) for differences among treatments. Significant differences from control treatments were assessed using two-sample t tests (separate variances, Bonferroni’s adjusted probabilities) to determine levels of significance. All p values for these tests are shown in the text, figures, and tables. Where ANOVA p values are used, they are indicated in the text.
Raw data for testes histological scores, when assessed for normality using Shapiro–Wilk normality test, were not normal. Individual tank mean scores were 0% normal (0 of 20 tank mean testes scores were normal), and treatment means were only 50% normal (2 of 4 treatment means were normal). In these cases, nonparametric statistics were used to compare ranked mean values. Kruskal–Wallis one-way ANOVA on ranked treatment means was used to assess treatments, followed by Kolmogorov–Smirnov two-sample test of two-sided probabilities which is a multiple-comparison-protected test of ranked treatment means to control means. In these cases the p values reported in the text were from Kolmogorov–Smirnov two-sample test (of two-sided probabilities when ranked treatment means were compared with ranked control means).
For the assessment of eggs and fry produced by the parent fish exposed to metformin, the data were summarized in two ways. Percentages of unfertilized eggs and dead eggs as well as % normal eggs (healthy eggs that were assumed viable) and % bad eggs were assessed in each batch of eggs and averaged per tank. These fertilization and egg quality data were also assessed by summing the incidence of these in all eggs laid in a given tank and dividing by the total number of eggs assessed for that tank. These values provided another way for the reproductive parameters to be analyzed per replicate tank and gave an overall assessment of the success of reproduction and hatch for that treatment.
3. Results
3.1. Exposures
Water quality parameters were stable during the flow-through exposures. Mean temperatures ranged from 24.9 to 25.1 °C, mean dissolved oxygen ranged from 7.8 to 7.9 mg/L, mean pH ranged from 8.15 to 8.23, mean conductivity ranged from 334 to 336 μS/cm, and mean free ammonia ranged from 0.0 to 2.5 μg/L. None of the water quality values differed between the controls and any of the three metformin exposure concentrations. Mean (± standard deviation) dilution water hardness was 129 ± 5 mg/L, and mean total alkalinity was 91 ± 4 mg CaCO3/L. All water quality data are summarized in Supplementary Material 2 Tables S4 and S5.
Measured concentrations of metformin in fish exposure aquaria were about 100%–107% of nominal concentrations (mean = 103.5% ± standard deviation 3.5%). Table 1 summarizes the mean concentrations of metformin in each exposure aquarium, and the overall means for each treatment. Target nominal concentrations for the metformin were based on concentrations of metformin in rivers, in MWWE, and 10× MWWE. All metformin measurements are shown in Supplementary Material 2 Table S6. No guanylurea (the major breakdown product of metformin) was detected in the exposure aquaria. The detection limit for guanylurea was 1.3 μg/L, and all exposure water samples were analyzed for guanylurea. There was never any guanylurea detected in the exposure solutions.
Table 1.
| Tank mean measured metformin | Treatment mean measured metformin | |||||
|---|---|---|---|---|---|---|
| Tank number | Mean (μg/L) | SD | n | Mean (μg/L) | SD | n |
| Controls | ||||||
| 1 | BDL | — | 13 | 0.0082 | 0.0053 | 8 |
| 3 | BDL | — | 13 | — | — | — |
| 7 | BDL | — | 13 | — | — | — |
| 10 | BDL | — | 13 | — | — | — |
| 11 | 0.0203 | 0.0323 | 13 | — | — | — |
| 13 | BDL | — | 13 | — | — | — |
| 16 | 0.0108 | 0.0122 | 13 | — | — | — |
| 19 | BDL | — | 12 | — | — | — |
| 3.0 μg/L nominal metformin | ||||||
| 4 | 2.490 | 0.458 | 13 | 3.013 | 0.433 | 4 |
| 9 | 2.830 | 0.717 | 13 | — | — | — |
| 15 | 3.430 | 0.385 | 13 | — | — | — |
| 17 | 3.300 | 0.365 | 13 | — | — | — |
| 30 μg/L nominal metformin | ||||||
| 5 | 33.50 | 5.31 | 13 | 30.83 | 1.79 | 4 |
| 8 | 29.70 | 5.46 | 13 | — | — | — |
| 12 | 30.10 | 3.75 | 13 | — | — | — |
| 20 | 30.00 | 3.91 | 13 | — | — | — |
| 300 μg/L nominal metformin | ||||||
| 2 | 317.0 | 30.3 | 13 | 322.50 | 29.0 | 4 |
| 6 | 304.0 | 34.2 | 13 | — | — | — |
| 14 | 365.0 | 52.9 | 13 | — | — | — |
| 18 | 304.0 | 32.1 | 13 | — | — | — |
Note
Mean and SD measured concentrations for each treatment The n value for each tank shows the number of times metformin was measured in that tank. The n value for each treatment shows the number of replicate aquaria metformin mean concentrations that were used to calculate the overall treatment mean. For controls, values of nondetect were assigned a value of one-half the metformin LOD (LOD = 0.0088, one-half LOD = 0.0044 μg/L) to calculate the mean. BDL, below detection limit; LOD, limit of detection.
3.2. Mishaps during the 6-month test
During the life cycle exposure to metformin, a leak in the header tank (containing clean lab water, no toxicant) dripped down from a dusty top shelf/surface to contaminate two flow-through tanks. Two aquaria were affected before the leak was discovered and fixed (see Supplementary Material 2 Fig. S5 for tank set up and position of tanks affected by the leak). In the two affected tanks some larval and juvenile fish died, and so tanks 9 (3.0 μg/L metformin) and 19 (control tank) were removed from the survival-over-time data. (The reader is referred to Supplementary Material 2 Table S7a for a statistical assessment of survival over time with tanks 9 and 19 included). The remaining fish in these two affected tanks appeared to grow and breed normally, and so these two tanks were included in the growth data and in the reproductive phase of the life cycle study.
3.3. Source of fathead minnow eggs
In this life cycle experiment, two sources of fathead minnow eggs were mixed. This was done to ensure genetic diversity among the minnows, and to reduce the possibility of siblings mating during the reproductive phase of the life cycle test. Extra eggs from each source were separately grown in clean water in another flow-through system until adulthood. After the life cycle metformin exposure, a skewed sex ratio was observed in the eggs sourced from one supplier (kept in clean water for growing out). The sex ratio was 72% male in the eggs sourced from the Ontario Ministry of the Environment and Energy. Only 4 breeding tiles from this supplier were used in the life cycle test (1/3 of the eggs for the life cycle exposure to metformin were sourced from this supplier), and so 4 sets of fathead minnow parents (i.e., 4 breeding tiles) produced these eggs. In the eggs sourced from the usual supplier, Aquatox (14 breeding tiles, which made up 2/3 of the eggs used in the life cycle test), the sex ratio was normal, i.e., 50% male. Because some of the eggs (4 of 14 tiles) were sourced from a 72% male biased colony, there was a skewed-towards-male sex ratio in the life cycle exposure. The calculated expected sex ratio as 56% male, 44% female in the overall study, which likely affected some of the maturation and breeding data, and there were fewer females than desired in some of the replicate tanks.
3.4. Survival and growth
Life cycle exposures to the metformin did not affect survival of fish. There were no effects on egg mortality or fry hatching at the beginning of the life cycle exposures. Fathead minnow eggs exposed to metformin successfully hatched, and larval survival was not statistically different from the control treatment, as illustrated in Fig. 2 (see Supplementary Material 2 Table S7b). Overall, control fish survival was 89% from the fertilized egg stage until 172 dph, while fish exposed to metformin had an overall survival of 84%, 92%, and 90% for treatments 3.0, 31, and 322 μg/L (measured concentrations), respectively. Decreases in survival (of 8%) at 106 dph and afterwards for metformin 3.0 μg/L (light green triangles) in Fig. 2 were not significant (p ≥ 0.324) compared with control survival (blue open circles). When survival over time data were also assessed with the two accidentally contaminated tanks included (tank 9 which was a 3 μg metformin/L tank, and tank 19 which was a control tank), there were no differences in survival (ANOVA p > 0.142). Supplementary Material 2 Table S7a provides a statistical assessment and re-calculated means for survival over time with tanks 9 and 19 included. Whether these tanks were included or not made no differences to the conclusions: There were no significant differences in survival over time between the controls and any metformin treatment.
Fig. 2.
There were few effects of the metformin on growth of the fish over time. Mean weight (mg), length (mm), and CF of metformin-exposed fish that were sampled at 30, 64 and 78 dph did not differ from those of controls, as shown in Table 2 (see Supplementary Material 2 Table S8 for individual replicate weight and length details). The only significant differences seen were at 30 dph where fish exposed to metformin (31 μg/L) had significantly greater lengths (21.4 mm, p = 0.038) compared to control fish length (19.6 mm), and at 64 dph where metformin-exposed females (322 μg/L) had significantly higher condition factors (CF = 0.906, p = 0.033) compared to control fish condition factors (CF = 0.864).
Table 2.
| Metformin (μg/L) | n | Weight (mg) | SD | Total length (mm) | SD | Condition factor | SD |
|---|---|---|---|---|---|---|---|
| 30 dph | |||||||
| Controls | 7 | 59.9 | 10.1 | 19.6 | 1.0 | 0.734 | 0.032 |
| 3.0 | 4 | 62.8 | 15.5 | 20.0 | 1.7 | 0.715 | 0.062 |
| 31 | 4 | 72.4 | 14.2 | 21.4* | 1.1 | 0.714 | 0.032 |
| 322 | 4 | 60.1 | 3.1 | 19.8 | 0.6 | 0.706 | 0.027 |
| 64 dph | |||||||
| Controls | 8 | 423.7 | 69.6 | 36.1 | 1.7 | 0.864 | 0.031 |
| 3.0 | 3 | 421.2 | 92.5 | 35.3 | 2.8 | 0.916 | 0.032 |
| 31 | 4 | 436.0 | 70.4 | 36.0 | 2.3 | 0.879 | 0.039 |
| 322 | 4 | 465.9 | 31.3 | 36.9 | 0.8 | 0.906† | 0.024 |
| 78 dph | |||||||
| Controls | 8 | 616.5 | 109.6 | 40.4 | 2.2 | 0.898 | 0.048 |
| 3.0 | 3 | 664.0 | 58.9 | 40.6 | 1.0 | 0.984 | 0.059 |
| 31 | 4 | 610.3 | 78.3 | 40.6 | 1.8 | 0.902 | 0.077 |
| 322 | 4 | 634.9 | 101.4 | 40.3 | 1.9 | 0.950 | 0.048 |
Note
Fish were randomly sampled at 30, 64, and 78 dph and measured individually, then grouped by replicate tanks for statistical analyses. Bold values with asterisks were significantly different from controls (as assessed by two sample t tests using Bonferroni’s adjusted p value with separate variance). The number of fish sampled from each tank was 4–9 at 30 dph, 3–7 at 64 dph, and 2–3 at 78 dph. n, the number of replicate tanks used to calculate each mean value; dph, days post-hatch.
*
p = 0.038.
†
p = 0.033.
3.5. Maturation and sex characteristics
There were no effects of exposure to the metformin on maturation of the fish during the life cycle test (Supplementary Material 2 Table S9) (Fig. 3). From their external characteristics, only a few fish were mature by 64 dph, with 2% of fish identified as either males or females at this time. At 78 dph, 13% of the fish were mature and breeding tiles were added to the exposure tanks to promote maturation. By 92 dph, 50% of fish were mature (and could be classified externally as males or females), and by 106 dph, 78% of the fish were mature. There were no differences in the % mature fish per tank in the metformin treatments versus the controls (p ≥ 0.226). The one exception was at 92 dph, when 3.0 μg/L metformin-exposed fish (light green triangle) were significantly more mature compared to control fish (blue open circles) (see asterisk, p = 0.005, Fig. 3).
Fig. 3.
At the end of the exposure period, when fish were sampled at 169–172 dph, there were no differences in growth of the mature males. Weight, length, and condition factors were not statistically different between control males and males from all metformin treatments (Table 3). Internal organ sizes relative to body weight (as represented by LSI and GSI) were also not statistically different between control males and males from all metformin treatments.
Table 3.
| Measured metformin concentration (μg/L) | Wet weight (g) | Total length (cm) | Condition factor | Liver-somatic index | Gonado-somatic index | Male index | Tubercle index |
|---|---|---|---|---|---|---|---|
| Males | |||||||
| Controls | 3.20 (0.36) | 6.01 (0.22) | 1.48 (0.08) | 2.48 (0.51) | 1.29 (0.16) | 6.4 (0.9) | 1.2 (0.8) |
| 3.0 | 3.02 (0.14) | 5.95 (0.10) | 1.43 (0.03) | 2.39 (0.32) | 1.11 (0.17) | 6.8 (1.1) | 1.0 (1.0) |
| 31 | 3.45 (0.57) | 6.08 (0.28) | 1.51 (0.08) | 2.87 (0.67) | 1.38 (0.19) | 8.2* (1.2) | 2.4 (1.0) |
| 322 | 3.11 (0.56) | 5.93 (0.33) | 1.47 (0.05) | 2.20 (0.40) | 1.11 (0.20) | 7.1 (1.7) | 1.6 (0.8) |
| Measured metformin concentration (μg/L) | Wet weight (g) | Total length (cm) | Condition factor | Liver-somatic index | Gonado-somatic index | Ovipositor area (mm2) | |
| Females | |||||||
| Controls | 1.81 (0.24) | 5.27 (0.13) | 1.23 (0.08) | 3.82 (0.55) | 13.37 (3.23) | 1.28 (0.16) | |
| 3.0 | 1.74 (0.14) | 5.18 (0.20) | 1.26 (0.13) | 3.50 (0.44) | 15.27 (1.41) | 1.45 (0.23) | |
| 31 | 1.71 (0.16) | 5.23 (0.15) | 1.20 (0.05) | 3.41 (0.56) | 13.39 (0.42) | 1.13 (0.09) | |
| 322 | 1.66 (0.09) | 5.14 (0.13) | 1.22 (0.03) | 3.83 (0.21) | 16.54† (1.46) | 1.48‡ (0.10) | |
Note: Values in table are means (standard deviation). n was 8 replicate tanks for controls and 4 replicate tanks for each metformin concentration. Bold values with asterisks were significantly different from controls (as assessed by two sample t tests using Bonferroni’s adjusted p value with separate variance).
*
p = 0.045.
†
p = 0.041.
‡
p = 0.023.
There were trends of decreased weight of mature female fish exposed to metformin. Adult females sampled at the end of the exposure (169–172 dph) mean weights were: controls (1.81 g), 3.0 μg/L metformin (1.74 g), 31 μg/L metformin (1.71 g), and 322 μg/L metformin (1.66 g) (Table 3). The highest metformin exposure concentration had females that weighed 8% less than controls, but these differences in body weight of females were not statistically-significant (p = 0.144). Although the females from 322 μg/L metformin had body weights that were 8% smaller than controls, their relative gonad (ovary) sizes were significantly larger than controls (Table 3, Fig. 4).
Fig. 4.
Females exposed to metformin had 23% increased ovary weights (relative to their body weights). The highest metformin treatment (322 μg/L) had females with significantly larger relative ovary size (16.5% body weight was ovary) compared to control females (with 13.4% body weight as ovary, p = 0.041, Table 3). Raw data for each replicate tank are presented in Supplementary Material 2 Tables S10 and S11. Raw data for each female fish are in Supplementary Material 3.
Mature male sex characteristics were unaffected by metformin, with the exception of males from the 31 μg/L metformin exposure concentration, that had 28% enhanced male sex characteristics (male index = 8.2) compared to control fish (control male index = 6.4, p = 0.045). Males from the highest metformin concentration (322 μg/L) had male indexes that were 11% elevated as well, but these were not significantly different from controls (p = 0.097) (Table 3). See Supplementary Material 2 Tables S10 and S11 for all data by replicate tank. Raw data for each male fish are in Supplementary Material 3. Female fathead minnows exposed to the highest metformin concentration (322 μg/L) had 16% larger ovipositors (p = 0.023) compared with control fish. Mean ovipositor areas of female control fish and metformin-exposed female fish ranged from 1.13 to 1.48 mm2 (Table 3).
Some metformin-exposed fish began breeding later than controls. Breeding began in the control treatments at 89 dph (this was when the first of eight replicate tanks in the controls produced a clutch of 20 or more eggs). The mean time to first breeding was 97 dph for controls. (This was the average day post-hatch when breeding first occurred for the 8 replicate tanks.) In the metformin treatments, the first breeding began at 94, 104, and 95 dph for fish from the 3.0, 31, and 322 μg/L metformin treatments, respectively. Mean time to first breeding for the metformin treatments was 102, 107, and 106 dph for fish from the 3.0, 31, and 322 μg/L metformin treatments, respectively (Table 4). All egg production data for each replicate tank are shown in Supplementary Material 4. Based on other fathead minnow life cycle tests run previously in the same laboratory (Parrott and Bennie 2009; Parrott and Balakrishnan 2017; Parrott and Metcalfe 2017), the time-to-first-breeding was within the normal range for fish from the control treatments. There were 9–10 d delays in mean time to first breeding in the top two metformin exposure concentrations, but these were significant (p = 0.003) only for the 31 μg/L metformin-exposed fish (and not for the 322 μg/L metformin exposure concentration, p = 0.208) compared with controls.
Table 4.
| Metformin (μg/L) | n | Mean day post-hatch that breeding started | SD |
|---|---|---|---|
| Controls | 8 | 97.3 | 5.6 |
| 3.0 | 4 | 101.5 | 6.0 |
| 31 | 4 | 107.3* | 3.3 |
| 322 | 4 | 106.3 | 11.2 |
*
The bold value with an asterisk was significantly different (p = 0.003) from controls (as assessed by a two-sample t test using Bonferroni’s adjusted p value with separate variance).
3.6. Egg production and effects in offspring
Fish from all metformin treatments produced similar numbers of eggs in relation to the controls. Cumulative egg production over time was very similar for the controls and metformin treatments, when plotted per female fish (Fig. 5). See Supplementary Material 2 Table S12 for all breeding data per replicate tank).
Fig. 5.
When individual tanks were assessed, the variability in egg production was apparent. This was in part due to some tanks with fewer females. There was a trend of lower mean total egg production per tank and lower mean eggs per female in the 322 μg/L metformin treatment (Fig. 6) (Supplementary Material 2 Table S12), although these differences were not significantly different from fish in the control (i.e., p = 0.584, and p = 0.741, respectively for total eggs and eggs per female for Bonferroni’s adjusted p using separate variances). Total egg production per 4 replicates was 37 833 for controls and 46 495, 38 834, and 31 780 for fish exposed to the 3.0, 31, and 322 μg/L metformin, respectively. There were no statistically significant differences in mean egg production per female across all treatments, with 2485 for control fish, 2826, 2141, and 2021 for fish exposed to the 3.0, 31, and 322 μg/L metformin treatments. Mean clutch sizes were not statistically different (p ≥ 0.302) and ranged from 208 to 215 eggs per clutch. Mean number of clutches per treatment were also not statistically different between controls and the three metformin exposure concentrations (ANOVA p = 0.987, Table 5).
Fig. 6.
Table 5.
| Measured metformin (μg/L) | n | Clutch size (eggs per clutch) | SD | Mean % normal eggs | SD | Mean % unfertilized eggs | SD | Mean % dead eggs | SD | Mean % bad eggs | SD |
|---|---|---|---|---|---|---|---|---|---|---|---|
| Controls | 8 | 215.4 | 64.7 | 69.7 | 5.4 | 6.4 | 4.9 | 8.8 | 3.3 | 15.1 | 5.3 |
| 3.0 | 4 | 220.7 | 41.6 | 76.7* | 0.9 | 7.8 | 3.2 | 5.1† | 0.6 | 10.3 | 2.6 |
| 31 | 4 | 221.8 | 62.1 | 74.3 | 3.5 | 5.2 | 2.9 | 7.4 | 1.5 | 13.1 | 3.1 |
| 322 | 4 | 208.0 | 57.7 | 73.7 | 6.4 | 6.7 | 7.0 | 6.1 | 2.0 | 13.5 | 2.6 |
| Measured metformin (μg/L) | n | Mean # clutches | SD | % Normal eggs (total per tank) | SD | % Unfertilized eggs (total per tank) | SD | % Dead eggs (total per tank) | SD | % Bad eggs (total per tank) | SD |
| Controls | 8 | 41.5 | 14.0 | 72.2 | 6.4 | 4.9 | 2.7 | 9.4 | 3.3 | 14.3 | 5.4 |
| 3.0 | 4 | 52.5 | 16.5 | 76.9 | 2.0 | 7.6 | 3.4 | 5.4‡ | 0.8 | 10.6 | 2.3 |
| 31 | 4 | 41.0 | 13.2 | 76.6 | 1.6 | 4.0 | 1.8 | 6.8 | 0.8 | 13.6 | 1.7 |
| 322 | 4 | 33.3 | 27.0 | 76.7 | 5.3 | 5.3 | 4.9 | 6.2§ | 1.1 | 13.0 | 4.4 |
Note: Eggs were hatched in clean (control) water in egg cups in flow-through aquaria. Values in table are means and standard deviation (SD). n is the number of replicate tanks for each treatment. Bold values with asterisks were significantly different from controls (as assessed by two sample t tests using Bonferroni’s adjusted p value with separate variance).
*
p = 0.008.
†
p = 0.016.
‡
p = 0.012.
§
p = 0.034.
There were no negative effects in F1 offspring egg quality produced by parent fish exposed to metformin for a life cycle. The percent unfertilized eggs ranged from 4% to 8% and did not differ between controls and metformin treatments (Table 5). The percent of normal eggs increased in the low metformin exposure, with 3.0 μg/L metformin producing higher % of normal eggs (76.7%, p = 0.008) compared with controls (normal eggs = 69.7%). Two metformin treatments had lower % of dead fertilized eggs compared with controls: Mean number of dead eggs (calculated as the mean of every egg batch) and % dead eggs per tank (calculated using tank totals) were significantly reduced in offspring from parent fish exposed to 3.0 and 322 μg/L metformin (p = 0.012–0.034, see Table 5, bold values with asterisk). All data per replicate tank are shown in Supplementary Material 2 Table S13.
There were no differences in the hatch success or deformities of F1 offspring. Embryo hatching success and fry deformity rates from parent fish exposed to metformin were not statistically different from those of controls (Table 6). The % hatch and % fry deformities all showed no differences across treatments (see Supplementary Material 2 Table S14 for details by replicate tank of all parameters assessed in eggs and hatched fry) (Table 6).
Table 6.
| Measured concentration of metformin (μg/L) | n | % Hatch (hatchability), mean (SD) | % Viable hatch hatch success), mean (SD) | % Severely deformed, mean (SD) | % Mild-moderate deformed, mean (SD) | Time to hatch (d), mean (SD) | |
|---|---|---|---|---|---|---|---|
| Controls | 8 | Mean | 96.43 (1.04) | 94.08 (1.63) | 2.35 (1.10) | 2.87 (1.74) | 5.21 (0.18) |
| 3.0 μg/L | 4 | Mean | 97.36 (1.45) | 93.88 (2.82) | 3.39 (2.68) | 4.19 (3.43) | 5.13 (0.06) |
| 31 μg/L | 4 | Mean | 95.95 (1.19) | 92.53 (2.52) | 3.55 (1.69) | 4.44 (2.79) | 5.20 (0.19) |
| 322 μg/L | 4 | Mean | 93.99 (2.97) | 91.61 (3.33) | 2.44 (1.29) | 2.96 (2.10) | 5.17 (0.22) |
All fertilized and healthy eggs (or a subset of 100 eggs from egg batches over 100) from each egg batch were placed in egg cups to assess hatching success and time to hatch. Hatching was monitored for a total of 17 700 eggs from the 8 replicate control aquaria, and 10 690, 9130, and 7560 eggs from the 3.0, 31, and 322 μg/L metformin treatments, respectively (having 4 replicate aquaria in each). For eggs produced by parent fish exposed to metformin for a life cycle, the time to hatch of F1 eggs was 5.1–5.2 d, not statistically different from control fish (p ≥ 0.812) (Table 6).
There were no significant differences in hatchability (i.e., % embryos that hatched) or hatching success (i.e., % of embryos that hatched into viable fry) (p ≥ 0.199). Hatching success of eggs was high and ranged from 92% to 94%. Percentages of fry with deformities were also not statistically different across the controls and metformin treatments (Table 6). Percentages of newly hatched fry with severe deformities was about 2%–4%, and mild to moderate deformities about 3%–4% (Table 6). The percentages of deformed fry at hatch (both severe deformities, and those with mild to moderate deformities) was not statistically different between controls and all metformin treatments (p ≥ 0.644). See Supplementary Material 2 Table S14 for data from all replicate tanks.
There were no changes in survival or growth of F1 larvae produced by parent fish exposed to metformin. Survival was very good (above 80%, Fig. 7) from the egg stage until 16 dph for all F1, with no significant differences among controls and metformin treatments (p > 0.844). As shown in Table 7, growth at 9 and 16 dph was not statistically different among controls and all metformin treatments (0.066 < p > 0.935). All data for growth of F1 in metformin replicate aquaria are shown in Supplementary Material 2 Table S15).
Fig. 7.
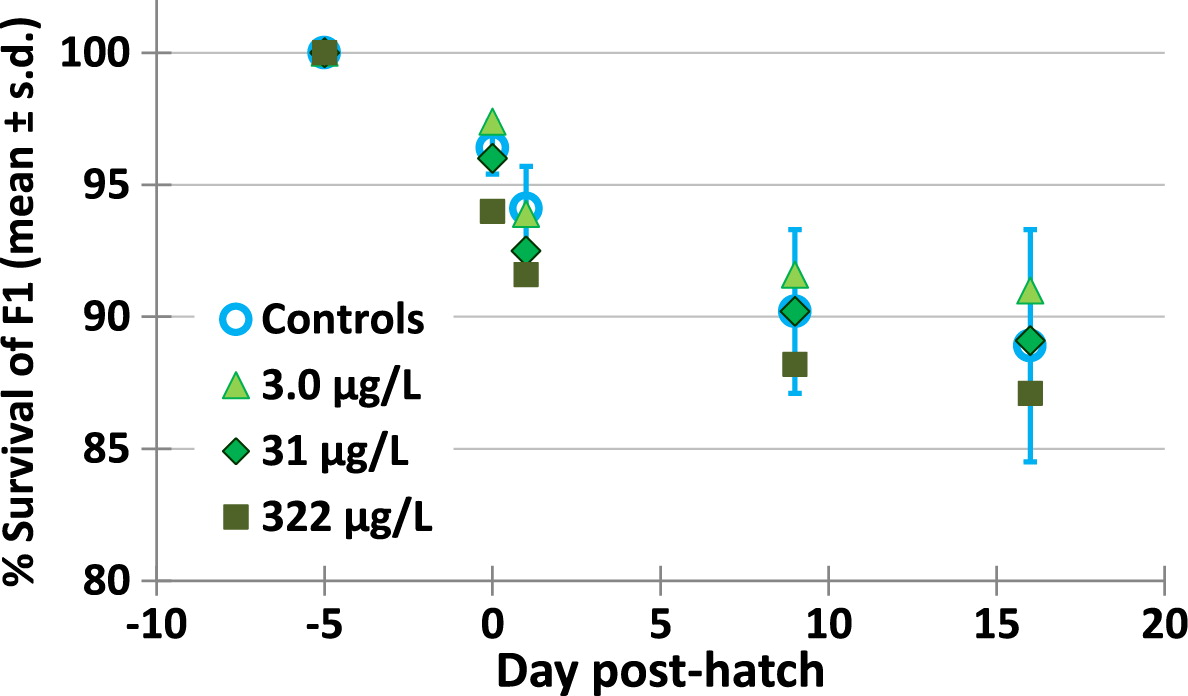
Table 7.
| Measured concentration of metformin (μg/L) | % Survival from egg to 9 dph, mean (SD) | Wet weight (mg), mean (SD) | Total length (mm), mean (SD) | Condition factor, mean (SD) |
|---|---|---|---|---|
| 9 dph | ||||
| Controls | 90.2 (3.1) | 4.28 (0.76) | 9.29 (0.46) | 0.515 (0.029) |
| 3.0 | 91.6 (3.9) | 4.44 (0.23) | 9.45 (0.24) | 0.516 (0.031) |
| 31 | 90.2 (2.5) | 4.63 (0.69) | 9.53 (0.33) | 0.527 (0.027) |
| 322 | 88.2 (3.7) | 4.01 (0.51) | 9.27 (0.37) | 0.492 (0.006) |
| Measured concentration of metformin (μg/L) | % Survival from egg to 16 dph, mean (SD) | Wet weight (mg), mean (SD) | Total length (mm), mean (SD) | Condition factor, mean (SD) |
| 16 dph | ||||
| Controls | 88.9 (4.4) | 15.69 (2.28) | 12.98 (0.52) | 0.699 (0.035) |
| 3.0 | 91.0 (4.2) | 15.46 (1.03) | 12.97 (0.37) | 0.706 (0.016) |
| 31 | 89.1 (3.3) | 15.32 (2.09) | 13.10 (0.56) | 0.674 (0.013) |
| 322 | 87.1 (4.2) | 13.99 (1.74) | 12.66 (0.44) | 0.680 (0.017) |
Note: Fish were sampled at 9 d post-hatch (dph) and 16 dph. For parent fish, there were eight replicate tanks for controls, and four for each replicate metformin treatment. Survival and growth were assessed four times (in four batches of fertilized eggs) for each replicate tank.
3.7. Vitellogenin in plasma
Plasma VTG in adult male fathead minnows was not affected by metformin exposure for a life cycle. Mean plasma VTG in male fish ranged from 0.77 to 1.9 μg/mL (Fig. 8) and there were no significant differences among metformin treatments and controls (statistics done on log VTG plasma, p ≥ 0.469). Full data for VTG in plasma of male fish are found in Supplementary Material 2 Table S16.
Fig. 8.
Life cycle exposure to metformin did not affect VTG in female fathead minnow blood plasma. Mean plasma VTG in female fish ranged from 12 500 to 13 300 μg/mL (see Supplementary Material 2 Table S16) which was over 6000 times the VTG in male plasma, as expected. There were no significant differences among metformin treatments and controls (statistics done on VTG in plasma, ANOVA p = 0.964). Full data for VTG in plasma of female fish are found in Supplementary Material 2 Table S16.
3.8. Gonad histology
Assessment of gonads of male and female fish showed no differences in metformin-exposed fish and controls. Male testes were scored from 0 to 3, with 3 being fully mature male gonads. Mean ± standard deviation (SD) maturity stages for male gonads were 2.3 ± 0.3, 2.4 ± 0.2, 2.6 ± 0.2 for 3.0, 31, and 322 μg/L metformin, respectively, which were not statistically different from the maturation stages of controls (2.5 ± 0.3, Kolmogorov–Smirnov p = 0.875 for all three pairwise comparisons). On average 22 ± 5 slides were assessed per male fish (min 11, max 34 slides per fish). Out of over 1400 slides scanned, representing 69 males, no oocytes were observed in any male testes examined. All data for male testes maturity scoring by replicate tank are found in Supplementary Material 2 Table S17a.
Female gonads were scored by counts and proportions of oocytes at various stages of maturation. For each fish an average of 288 ± 119 oocytes were counted (min 50, max 838). There were no differences from controls and the three metformin treatments in any parameter monitored (all ANOVA p > 0.533) for percentages of primary, cortical alveolar, early vitellogenic, late vitellogenic, and atretic oocytes (Fig. 9). Scores for atretic oocyte severity had ANOVA p = 0.207, and comparison of 3.0 μg/L metformin to controls showed the differences were not significant (Bonferroni’s p = 0.131). Overall % mature oocytes (early vitellogenic + late vitellogenic) were similar among treatments with 24.1% ± 3.7%, 25.5% ± 6.3%, 27.0% ± 2.8% for 3.0, 31, and 322 μg/L metformin treatments, respectively, which were not statistically different from controls (24.7% ± 7.6%, ANOVA p = 0.906). All data for female ovary scoring by replicate tank are shown in Supplementary Material 2 Table S17b.
Fig. 9.
A summary of all statistically different changes seen in the metformin life cycle exposure is found in Supplementary Material 2 Table S18.
4. Discussion
This experiment exposed fathead minnows for a life cycle to metformin, an anti-diabetic drug, at concentrations typically detected in rivers (3.0 μg/L) and MWWE discharges (31 μg/L) and to an artificially high concentration (10× MWWE, 322 μg/L). The exposures lasted 5.5 months, and fish spent their entire life cycle, growing, maturing, and breeding in water containing metformin. During the exposures, effects on survival, growth, deformities, maturation, egg production, hatch success of eggs, and growth of the F1 larval fish were assessed. Also examined were an indicator of exposure to estrogens (VTG, in plasma) and male and female gonad maturation stages via histology. Entire male gonads were serially sectioned and examined histologically for the presence of any oocytes. These fathead minnow life cycle metformin exposures were accompanied by rigorous assessment of metformin exposure concentrations in each tank every 2 weeks.
4.1. Metformin exposure concentrations
Concentrations of metformin were close to nominal concentrations over the 5.5-month exposure of fathead minnows. There was no observed degradation of metformin to guanylurea or nitrate/nitrite in the flow-through aquaria, which is not surprising as 24 L of fresh metformin solution flowed through each tank daily. Experimental biodegradation studies in the lab show that metformin is oxidized to guanylurea, which breaks down to nitrate (Roche 2015a, 2015b in Straub et al. (2019)). Laboratory degradation studies show that the oxidation to guanylurea is slow (occurring over days 7–21), and guanylurea breakdown to nitrate occurs over days 35–56 (Roche et al. 2015a, 2015b in Straub et al. (2019)). Metformin breakdown to guanylurea is efficient in municipal wastewater treatment plants with conventional activated sludge (Kosma et al. 2015), with degradation slower under anaerobic conditions (Tisler and Zwiener 2019). Although breakdown of metformin occurs efficiently in municipal wastewater treatment plants, once in a river system, the breakdown of metformin may be slower.
4.2. Survival and maturation
There were no significant changes in survival of fish exposed over a full life cycle to the metformin at environmentally relevant concentrations (i.e., 3.0 and 31 μg/L) or at higher concentrations (i.e., 322 μg/L metformin). Other researchers have seen similar results, with no effects on survival of Japanese medaka exposed for 133 d to metformin concentrations up to 360 μg/L (Lee et al. 2019). Rainbow trout sac fry showed no changes in survival after 108-d exposure to metformin through their juvenile stages (from 48 d post-fertilization (dpf) to 156 dpf) (Jacob et al. 2018).
Exposure to the metformin did not negatively affect the maturation of the fathead minnows over time. Juvenile fish exposed to all three metformin treatments developed sex characteristics at the same rate as control fish. Exposure to 31 μg/L metformin increased the secondary sex characteristics (i.e., male index) of adult male minnows sampled at the end of the life cycle test (Table 3). By contrast, other researchers have reported that exposure to metformin decreased (but not significantly) male secondary sex characteristics in fathead minnows (Niemuth and Klaper 2015).
4.3. Growth
Life cycle exposure to high concentrations of metformin caused trends of decreased body weight of female adult fathead minnows. There were dose-responsive trends of decreased weight of female fish sampled at the end of the life cycle test, but these were nonsignificant (Table 3). At the end of the exposures, female fish exposed to 3.0, 31, and 322 μg/L metformin weighed 96%, 94%, and 92% of control female mean weights, respectively.
The 8% decreases in weight of females observed in this study are consistent with effects observed by others. Most studies of metformin’s effects in fish report reduced fish wet weight. Fathead minnows exposed to 40 μg/L metformin for 360 d had decreased weight and condition factor compared with control males (Niemuth and Klaper 2015). Rainbow trout exposed (at 7 °C) to metformin from 48 dpf until 156 dpf had decreased wet weights at 10 and 100 μg/L, but not at 1000 μg/L, despite similar metformin uptakes into fish at 100 and 1000 μg/L (42 and 56 ng/g wet weight, respectively) (Jacob et al. 2018). Other researchers have shown low concentrations of metformin (3.2 μg/L) can decrease larval Japanese medaka growth (from the egg stage to 28 dph), and much longer exposures (egg stage to 165 dph) caused trends of lower growth, but these were not significant in the adult medaka (Ussery et al. 2018). However, some long-term exposures of metformin show no changes in fish growth: a two-generation study of Japanese medaka (lasting 360 d), exposed to 40, 120, or 360 μg/L metformin caused no changes in growth or in relative organ size (GSI and LSI) of parental fish or offspring (Lee et al. 2019).
4.4. Gonad size and oocyte stages
Despite trends of 8% lower body weights of female fathead minnows exposed to high concentrations of metformin, their ovary weights were 23% larger than the control fish. Females exposed to metformin tended to weigh less, but that they had larger gonads (Fig. 4). Whether this was influenced by the sometimes uneven numbers of females per tank was examined. However, it appeared there was no relationship of female body weight to the number of females per tank (data not shown). Life cycle (19-week) exposure of female medaka to metformin caused no significant change in GSI (Lee et al. 2019). No other studies reporting metformin’s effects on female ovary size in fishes were found in the literature.
The significance of the 23% increased ovary size of female fish exposed to 322 μg/L metformin appears to be low, as there were no overall effects on egg production, egg quality, or F1 survival and growth. In addition, there were no metformin-related changes in the stages of oocytes in ovaries. Relative percentages of oocyte stages in the control and metformin-exposed females were similar to that found in control fathead minnows in other labs (Jensen et al. 2001).
4.5. Breeding
Life cycle metformin exposure caused delays in breeding in fathead minnows. The 31 μg/L metformin treatment significantly delayed the start of breeding by 10 d, and the 322 μg/L delayed the start of breeding by 9 d (but this delay was statistically not significant). In previous studies with fathead minnow exposed to MWWE for a life cycle, similar delayed time to first egg production (delayed by 20–30 d) was observed, but in those studies the delays were accompanied by significantly reduced cumulative egg production in some MWWE treatments (Parker et al. 2014). In the case of the present life cycle exposure to metformin, breeding was delayed by 9–10 d, but the overall egg production per female was unaffected.
A 9–10 d delay in first breeding could be biologically significant to wild fish, especially in colder climates where minnow breeding times are brief. In Canadian northern lakes, fathead minnows grew and matured faster, and breeding time was earlier (Danylchuk and Tonn 2006) presumably so that larval fish had adequate time to reach sizes that could better survive the harsh winter conditions (Sogard 1997; Hurst 2007). Delays in spawning would shorten the time larval fish had to reach these optimal weights. Delayed spawning may also affect larval fish growth and survival due to limits on food availability. Larval minnows may not have adequate food of the correct size available (Laurich et al. 2003; Nunn et al. 2012) if they hatch later, and this would also affect their abilities to reach body sizes that would over-winter successfully (Sogard 1997; Hurst 2007).
4.6. Vitellogenin
Concentrations of VTG in plasma of male and female fathead minnows were not affected by metformin exposure for a life cycle. Mean plasma VTG in male fish ranged from 0.77 to 1.9 μg/mL and in female fish ranged from 12 500 to 13 300 μg/mL (Fig. 8). The concentrations of VTG in fathead minnows in the present metformin exposure compared well with concentrations of VTG measured in plasma of mature control fathead minnows by other researchers in several labs (Table 8).
Table 8.
| Age of fish (dph) | Males—VTG in plasma (μg/mL) | Weight of males (g) | Females—VTG in plasma (μg/mL) | Weight of females (g) | Reference |
|---|---|---|---|---|---|
| 169–172 | 0.77–1.9 | 3.1–3.5 | 12 500–13 300 | 1.7–1.8 | This study |
| 180 | 0.632 | GSI 1.1 | 9690 | GSI 11.5 | Brain et al. (2018) |
| — | 0.25 | Shappell et al. (2018) | |||
| 35 000 | Frankel et al. (2017) | ||||
| 12 | 19 500 | Villeneuve et al. (2017) | |||
| 210 | <200 | 3.5 | 14 000 | 1.5 | Armstrong et al. (2016) |
| 135–180 | 3.5 | 24 500 | 1.6 | Fort et al. (2015) | |
| 12 500–20 500 | Kugathas et al. (2013) | ||||
| 1.58 | 18 000 | Villeneuve et al. (2010) | |||
| 135–180 | 4.1 | 4.2 | 17 400 | 1.6 | Watanabe et al. (2007) |
Note: Ages and weights of fish are shown for comparison. VTG, vitellogenin (μg/mL); dph, days post-hatch; GSI, gonadosomatic index.
4.7. Egg production
Life cycle exposure to 3.0, 31, or 322 μg/L metformin caused no significant changes in egg production compared with control fish (Fig. 5). There were no statistically significant differences in mean egg production per female across all treatments, with 2485 for control fish, 2826, 2141, and 2021 for fish exposed to the 3.0, 31, and 322 μg/L metformin treatments. Fathead minnow breeding groups typically have variable egg production (Jensen et al. 2001; Watanabe et al. 2007). However, when the egg production per female in each tank/replicate was examined, a few tanks did produce fewer than 1500 eggs per female (Fig. 6). In the present experiment several tanks had fewer females than the desired 4–5, which may have influenced the egg production even after the lower number of females was accounted for. Figure 10 shows that there appears to be a good relationship (r2 = 0.72) for control fish between number of eggs per female and the number of females per tank. Thus, the control tanks with fewer females produced lower numbers of eggs per female, even when per-female egg production was assessed. Because each tank had 8 fish, tanks with low numbers of females had higher numbers of males and (or) immature fish that turned out to be males. The relationship in Fig. 10 may be caused by the increased number of males/immature males in the tank chasing the three dominant males that occupy and defend their nests (breeding tiles) or chasing the females; male fathead minnows often chase and compete with others in the tank (McMillan and Smith 1974; Salierno and Kane 2009; Villeneuve et al. 2010). This may explain the lower number of eggs per female in two of the 322 μg/L metformin tanks (Fig. 10, orange arrows), but it does not explain the low numbers of eggs per female for the 31 μg/L metformin tank (Fig. 10, black arrow).
Fig. 10.
4.8. Comparing these results to other life cycle exposures of metformin
A previous life cycle study with fathead minnows exposed to metformin showed decreased reproduction (Niemuth and Klaper 2015), although in that study the exposure was from the juvenile (30 dph) to the adult stage, not from egg to adult as in the present study. The Niemuth and Klaper (2015) study also observed VTG induction and intersex in male minnows, and this is discussed below. Other differences between these two life cycle exposures of fathead minnows to metformin include the age of the breeding fathead minnows, which were 320–360 dph in the Niemuth and Klaper (2015) study, and 90–168 dph in the present study. Also, the previous study was static renewal (with metformin-exposure solutions renewed every 3–4 d) compared with the present study’s flow-through design (where 24 L per day flowed through each 12 L tank). The fish diets were also different in the two studies. Brine shrimp (newly hatched then frozen) was the only food provided to fish in the present study, compared to mainly Tetramin tropical fish food in the Niemuth and Klaper (2015) study. Two other fish life cycle studies have shown no effects of metformin on Japanese medaka reproduction (up to 360 μg/L for 133 d, (Lee et al. 2019), and 3.2 μg/L metformin for 165 d (Ussery 2018), despite the observation of some changes in gene expression in both of these metformin-medaka studies.
In the present life cycle exposure to metformin there was no incidence of intersex in any of the 69 mature male fish, despite over 1400 testes slides being assessed (20–25 slides per male). The diameter of primary oocytes in fathead minnows is about 60–120 μmol/L, while late vitellogenic oocytes are over 500 μmol/L (Jensen et al. 2001). So each male testis in the present study was sampled into sections of 4–5 μm thickness (with no more than 28–35 μm spacing between groups of sections) to maximize the potential to detect any oocytes present. Previous life cycle exposures to metformin have observed high incidences (84%) of males with testis-ova in 40 μg/L metformin, as well as 13% testis-ova in control males (Niemuth and Klaper 2015). It is unknown whether older control male fathead minnow, such as those assessed in the Niemuth and Klaper (2015) study, develop testis-ova. Studies of control male Japanese medaka (raised in distilled tap water) show 0% incidence of intersex at 6 months of age, but 11.1% incidence of intersex at 9 months of age (Grim et al. 2007). Another possible cause of intersex in control fish is the presence of endocrine-active substances (such as phytoestrogens) in flake-food diets (Grim et al. 2007).
Generally testis-ova condition is less common in fathead minnows than other commonly used fish test species, as demonstrated by the absence of a photo of this condition in a detailed gonadal histology atlas of fathead minnow (Ankley 2006). It would be valuable to assess whether other labs have observed intersex (testis-ova) in control fathead minnow males, and if so, whether the presence of testis-ova increases with the age of the males or may be influenced by the type of feed, as it was in Japanese medaka (Grim et al. 2007).
4.9. Egg quality and survival/growth of F1
There were no differences in egg quality, % fertilization, or hatching success in eggs of fathead minnows exposed to metformin. This is similar to Lee et al. (2019) who saw no effect on fecundity, hatching rate, or larval abnormalities in a two-generation exposure of Japanese medaka to 40, 120, and 360 μg/L metformin (Lee et al. 2019). Metformin exposure of parent fathead minnows for a life cycle caused no changes in growth or survival of their F1 offspring up to 16 dph (when hatched in clean water flow-through conditions). There are no published literature studies of F1 survival and growth from life cycle metformin-exposed parent fish.
5. Conclusions
Fathead minnows exposed to environmentally relevant concentrations of metformin found in rivers and MWWE (3.0 and 31 μg/L, respectively) and to 10 times these concentrations (322 μg/L) showed no significant changes in survival, growth, maturation, reproduction, and offspring hatching success and growth. The perplexing exception was female fish that had significantly (approx. 23%) larger ovaries in 322 μg/L metformin compared with controls. There were some delays (9–10 d) in mean time to first breeding, and these were significant for the middle concentration (31 μg/L) of metformin, with similar (but nonsignificant) trends for the highest concentration of metformin. Despite breeding delays, the metformin-exposed fish produced statistically similar numbers of eggs to controls. Overall, the study results show that exposures to metformin at environmentally relevant concentrations did not adversely affect survival, growth, or reproductive capacity of this model fish test species.
Acknowledgements
The study could not have been competed without the dedication and excellence of Alicia Mehlenbacher who runs the aquatic lab where the fish were held. We are grateful to Kathleen Stevack of Ontario Ministry of the Environment and Parks for donation of some of the fathead minnow eggs to start the exposures. Jane Pappas of Health Canada provided valuable feedback on the study and review of the manuscript.
References
Ankley GT. 2006. Histopathology guidelines for the fathead minnow (Pimephales promelas) 21-day reproduction assay. US EPA Publication, Duluth, Minnesota.
Armstrong BM, Lazorchak JM, Jensen KM, Haring HJ, Smith ME, Flick RW, et al. 2016. Reproductive effects in fathead minnows (Pimphales promelas) following a 21 d exposure to 17α-ethinylestradiol. Chemosphere, 144: 366–373.
Blair BD, Crago JP, Hedman CJ, and Klaper RD. 2013. Pharmaceuticals and personal care products found in the great lakes above concentrations of environmental concern. Chemosphere, 93(9): 2116–2123.
Bradley PM, Journey CA, Button DT, Carlisle DM, Clark JM, Mahler BJ, et al. 2016. Metformin and other pharmaceuticals widespread in wadeable streams of the southeastern United States. Environmental Science and Technology Letters, 3(6): 243–249.
Bradley PM, Journey CA, Romanok KM, Barber LB, Buxton HT, Foreman WT, et al. 2017. Expanded target-chemical analysis reveals extensive mixed-organic-contaminant exposure in U.S. Streams. Environmental Science and Technology, 51(9): 4792–4802.
Brain RA, Schneider SZ, Anderson JC, Knopper LD, Wolf JC, and Hanson ML. 2018. Extended fish short term reproduction assays with the fathead minnow and Japanese medaka: no evidence of impaired fecundity from exposure to atrazine. Chemosphere, 205: 126–136.
Crago J, Bui C, Grewal S, and Schlenk D. 2016. Age-dependent effects in fathead minnows from the anti-diabetic drug metformin. General and Comparative Endocrinology, 232: 185–190.
Danylchuk AJ, and Tonn WM. 2006. Natural disturbance and life history: consequences of winterkill on fathead minnow in boreal lakes. Journal of Fish Biology, 68(3): 681–694.
de Solla SR, Gilroy ÈAM, Klinck JS, King LE, McInnis R, Struger J, et al. 2016. Bioaccumulation of pharmaceuticals and personal care products in the unionid mussel Lasmigona costata in a river receiving wastewater effluent. Chemosphere, 146: 486–496.
Drugbank. 2017. Metformin. [online]: Available from Drugbank.Ca/drugs/db00331.
Fort DJ, Mathis M, Fort CE, Fort HM, and Bacon JP. 2015. Application of endocrine disruptor screening program fish short-term reproduction assay: reproduction and endocrine function in fathead minnow (Pimephales promelas) and killifish (Fundulus heteroclitus) exposed to Bermuda pond sediment. Environmental Toxicology and Chemistry, 34(6): 1283–1295.
Frankel T, Yonkos L, and Frankel J. 2017. Exposure effects of levonorgestrel on oogenesis in the fathead minnow (Pimephales promelas). Environmental Toxicology and Chemistry, 36(12): 3299–3304.
Ghoshdastidar AJ, Fox S, and Tong AZ. 2015. The presence of the top prescribed pharmaceuticals in treated sewage effluents and receiving waters in southwest Nova Scotia, Canada. Environmental Science and Pollution Research, 22(1): 689–700.
Glassmeyer ST, Furlong ET, Kolpin DW, Batt AL, Benson R, Boone JS, et al. 2017. Nationwide reconnaissance of contaminants of emerging concern in source and treated drinking waters of the United States. Science of the Total Environment, 581–582: 909–922.
Grim KC, Wolfe M, Hawkins W, Johnson R, and Wolf J. 2007. Intersex in Japanese medaka (Oryzias latipes) used as negative controls in toxicologic bioassays: a review of 54 cases from 41 studies. Environmental Toxicology and Chemistry, 26(8): 1636–1643.
Hurst TP. 2007. Causes and consequences of winter mortality in fishes. Journal of Fish Biology, 71(2): 315–345.
Jacob S, Dötsch A, Knoll S, Köhler HR, Rogall E, Stoll D, et al. 2018. Does the antidiabetic drug metformin affect embryo development and the health of brown trout (Salmo trutta f. Fario)? Environmental Sciences Europe, 30(1): 48.
Jensen KM, Korte JJ, Kahl MD, Pasha MS, and Ankley GT. 2001. Aspects of basic reproductive biology and endocrinology in the fathead minnow (Pimephales promelas). Comparative Biochemistry and Physiology Part C: Toxicology & Pharmacology, 128(1): 127–141.
Kim M, Guerra P, Shah A, Parsa M, Alaee M, and Smyth SA. 2014. Removal of pharmaceuticals and personal care products in a membrane bioreactor wastewater treatment plant. Water Science and Technology, 69(11): 2221–2229.
Klaper RD, and Niemuth NJ. 2016. On the unexpected reproductive impacts of metformin: a need for support and new directions for the evaluation of the impacts of pharmaceuticals in the environment. Chemosphere, 165: 570–574.
Kosma CI, Lambropoulou DA, and Albanis TA. 2015. Comprehensive study of the antidiabetic drug metformin and its transformation product guanylurea in Greek wastewaters. Water Research, 70: 436–448.
Kugathas S, Runnalls TJ, and Sumpter JP. 2013. Metabolic and reproductive effects of relatively low concentrations of beclomethasone dipropionate, a synthetic glucocorticoid, on fathead minnows. Environmental Science and Technology, 47(16): 9487–9495.
Laurich LM, Zimmer KD, Butler MG, and Hanson MA. 2003. Selectivity for zooplankton prey by fathead minnows and brook sticklebacks. Wetlands, 23(2): 416–422.
Lee JW, Shin YJ, Kim H, Kim H, Kim J, Min SA, et al. 2019. Metformin-induced endocrine disruption and oxidative stress of Oryzias latipes on two-generational condition. Journal of Hazardous Materials, 367: 171–181.
Lindim C, de Zwart D, Cousins IT, Kutsarova S, Kühne R, and Schüürmann G. 2019. Exposure and ecotoxicological risk assessment of mixtures of top prescribed pharmaceuticals in Swedish freshwaters. Chemosphere, 344–352.
McMillan VE, and Smith RJF. 1974. Agonistic and reproductive behaviour of the fathead minnow (Pimephales promelas rafinesque). Zeitschrift für Tierpsychologie, 34(1): 25–58.
Niemuth NJ, and Klaper RD. 2015. Emerging wastewater contaminant metformin causes intersex and reduced fecundity in fish. Chemosphere, 135: 38–45.
Niemuth NJ, Jordan R, Crago J, Blanksma C, Johnson R, and Klaper RD. 2015. Metformin exposure at environmentally relevant concentrations causes potential endocrine disruption in adult male fish. Environmental Toxicology and Chemistry, 34(2): 291–296.
Nunn AD, Tewson LH, and Cowx IG. 2012. The foraging ecology of larval and juvenile fishes. Reviews in Fish Biology and Fisheries, 22(2): 377–408.
Parker WJ, Pileggi V, Seto P, Chen X, Ogunlaja M, Van Der Kraak G, et al. 2014. Impact of activated sludge configuration and operating conditions on in vitro and in vivo responses and trace organic compound removal. Science of the Total Environment, 490: 360–369.
Parrott JL, and Balakrishnan VK. 2017. Life-cycle exposure of fathead minnows to environmentally relevant concentrations of the β-blocker drug propranolol. Environmental Toxicology and Chemistry, 36(6): 1644–1651.
Parrott JL, and Bennie DT. 2009. Life-cycle exposure of fathead minnows to a mixture of six common pharmaceuticals and triclosan. Journal of Toxicology and Environmental Health, Part A: Current Issues, 72(10): 633–641.
Parrott JL, and Metcalfe CD. 2017. Assessing the effects of the antidepressant venlafaxine to fathead minnows exposed to environmentally relevant concentrations over a full life cycle. Environmental Pollution, 229: 403–411.
Petrie B, Youdan J, Barden R, and Kasprzyk-Hordern B. 2016. Multi-residue analysis of 90 emerging contaminants in liquid and solid environmental matrices by ultra-high-performance liquid chromatography tandem mass spectrometry. Journal of Chromatography A, 1431: 64–78.
Salierno JD, and Kane AS. 2009. 17α-ethinylestradiol alters reproductive behaviors, circulating hormones, and sexual morphology in male fathead minnows (Pimephales promelas). Environmental Toxicology and Chemistry, 28(5): 953–961.
Sarma SSS, García-García G, Nandini S, and Saucedo-Campos AD. 2017. Effects of anti-diabetic pharmaceuticals to non-target species in freshwater ecosystems: A review. Journal of Environmental Biology, 38(SI6): 1249–1254.
Scheurer M, Sacher F, and Brauch HJ. 2009. Occurrence of the antidiabetic drug metformin in sewage and surface waters in Germany. Journal of Environmental Monitoring, 11(9): 1608–1613.
Shappell NW, Feifarek DJ, Rearick DC, Bartell SE, and Schoenfuss HL. 2018. Do environmental factors affect male fathead minnow (Pimephales promelas) response to estrone? Part 2. Temperature and food availability. Science of the Total Environment, 610–611: 32–43.
Sogard SM. 1997. Size-selective mortality in the juvenile stage of teleost fishes: a review. Bulletin of Marine Science, 60(3): 1129–1157.
Straub JO, Caldwell DJ, Davidson T, D’Aco V, Kappler K, Robinson PF, et al. 2019. Environmental risk assessment of metformin and its transformation product guanylurea. I. Environmental fate. Chemosphere, 216: 844–854.
Sumpter JP, Scott AP, and Katsiadaki I. 2016. Comments on Niemuth, N.J. and Klaper, R.D. 2015. Emerging wastewater contaminant metformin causes intersex and reduced fecundity in fish. Chemosphere 135, 38–45. Chemosphere, 165: 566–569.
Tao Y, Chen B, Zhang BH, Zhu ZJ, and Cai Q. 2018. Occurrence, impact, analysis and treatment of metformin and guanylurea in coastal aquatic environments of Canada, USA and Europe. Advances in Marine Biology, 81: 23–58.
Tetreault GR, Bennett CJ, Shires K, Knight B, Servos MR, and McMaster ME. 2011. Intersex and reproductive impairment of wild fish exposed to multiple municipal wastewater discharges. Aquatic Toxicology, 104(3–4): 278–290.
Tisler S, and Zwiener C. 2019. Aerobic and anaerobic formation and biodegradation of guanyl urea and other transformation products of metformin. Water Research, 149: 130–135.
Trautwein C, and Kümmerer K. 2011. Incomplete aerobic degradation of the antidiabetic drug metformin and identification of the bacterial dead-end transformation product guanylurea. Chemosphere, 85(5): 765–773.
Trautwein C, Berset J-D, Wolschke H, and Kümmerer K. 2014. Occurrence of the antidiabetic drug metformin and its ultimate transformation product guanylurea in several compartments of the aquatic cycle. Environment International, 70(Suppl. C): 203–212.
Ussery E. 2018. The ecotoxicological effects of metformin and its metabolite, guanylurea, on Japanese medaka (Oryzias latipes). Ph.D. thesis, for the Faculty of Science Applied Bioscience Program at the University of Ontario Institute of Technology. 158 p.
Ussery E, Bridges KN, Pandelides Z, Kirkwood AE, Bonetta D, Venables BJ, et al. 2018. Effects of environmentally relevant metformin exposure on Japanese medaka (Oryzias latipes). Aquatic Toxicology, 205: 58–65.
Ussery E, Bridges KN, Pandelides Z, Kirkwood AE, Guchardi J, and Holdway D. 2019. Developmental and full-life cycle exposures to guanylurea and guanylurea–metformin mixtures results in adverse effects on Japanese medaka (Oryzias latipes). Environmental Toxicology and Chemistry, 38(5): 1023–1028.
Villeneuve DL, Garcia-Reyero N, Martinović D, Mueller ND, Cavallin JE, Durhan EJ, et al. 2010. II: effects of a dopamine receptor antagonist on fathead minnow dominance behavior and ovarian gene expression in the fathead minnow and zebrafish. Ecotoxicology and Environmental Safety, 73(4): 478–485.
Villeneuve DL, Jensen KM, Cavallin JE, Durhan EJ, Garcia-Reyero N, Kahl MD, et al. 2017. Effects of the antimicrobial contaminant triclocarban, and co-exposure with the androgen 17β-trenbolone, on reproductive function and ovarian transcriptome of the fathead minnow (Pimephales promelas). Environmental Toxicology and Chemistry, 36(1): 231–242.
Watanabe KH, Jensen KM, Orlando EF, and Ankley GT. 2007. What is normal? A characterization of the values and variability in reproductive endpoints of the fathead minnow, Pimephales promelas. Comparative Biochemistry and Physiology Part C: Toxicology & Pharmacology, 146(3): 348–356.
Yao B, Yan S, Lian L, Yang X, Wan C, Dong H, et al. 2018. Occurrence and indicators of pharmaceuticals in Chinese streams: a nationwide study. Environmental Pollution, 236: 889–898.
Supplementary materials
Supplementary Material 1 (PDF / 223 KB)
- Download
- 223.88 KB
Supplementary Material 2 (PDF / 1.60 MB)
- Download
- 1.60 MB
Supplementary Material 3 (PDF / 515 KB)
- Download
- 515.16 KB
Supplementary Material 4 (PDF / 904 KB)
- Download
- 904.68 KB
Information & Authors
Information
Published In
FACETS
Volume 6 • Number 1 • January 2021
Pages: 998 - 1023
Editor: Jeff C. Clements
History
Received: 23 November 2020
Accepted: 27 February 2021
Version of record online: 22 June 2021
Copyright
© 2021 Her Majesty the Queen in right of Canada. This work is licensed under a Creative Commons Attribution 4.0 International License (CC BY 4.0), which permits unrestricted use, distribution, and reproduction in any medium, provided the original author(s) and source are credited.
Data Availability Statement
All relevant data are within the paper and in the Supplementary Material.
Key Words
Sections
Subjects
Plain Language Summary
Lab fish exposed to a diabetes drug show few effects
Authors
Author Contributions
JLP conceived and designed the study.
GP, KS, SC, HK, MG, and CS performed the experiments/collected the data.
JLP and MA analyzed and interpreted the data.
JLP and MA contributed resources.
All drafted or revised the manuscript.
Competing Interests
The authors have declared that no competing interests exist.
Funding Information
We are grateful for generous funding from the Chemicals Management Plan of Health Canada. The authors declare that they have no conflicts of interest related to the reporting of these results.
Metrics & Citations
Metrics
Other Metrics
Citations
Cite As
Joanne L. Parrott, Grazina Pacepavicius, Kallie Shires, Stacey Clarence, Hufsa Khan, Madelaine Gardiner, Cheryl Sullivan, and Mehran Alaee. 2021. Fathead minnow exposed to environmentally relevant concentrations of metformin for one life cycle show no adverse effects. FACETS.
6(): 998-1023. https://doi.org/10.1139/facets-2020-0106
Export Citations
If you have the appropriate software installed, you can download article citation data to the citation manager of your choice. Simply select your manager software from the list below and click Download.
Cited by
1. Are Fish Populations at Risk? Metformin Disrupts Zebrafish Development and Reproductive Processes at Chronic Environmentally Relevant Concentrations
2. Effects of Metformin and its Metabolite Guanylurea on Fathead Minnow (
Pimephales promelas
) Reproduction
3. Embryotoxicity Produced by the Mixture of Aluminum, Metformin and Penicillin on Common Carp (Cyprinus carpio): a Study of Interactions
4. Metformin disrupts Danio rerio metabolism at environmentally relevant concentrations: A full life-cycle study