Identification of infectious agents in early marine Chinook and Coho salmon associated with cohort survival
Abstract
Recent decades have seen an increased appreciation for the role infectious diseases can play in mass mortality events across a diversity of marine taxa. At the same time many Pacific salmon populations have declined in abundance as a result of reduced marine survival. However, few studies have explicitly considered the potential role pathogens could play in these declines. Using a multi-year dataset spanning 59 pathogen taxa in Chinook and Coho salmon sampled along the British Columbia coast, we carried out an exploratory analysis to quantify evidence for associations between pathogen prevalence and cohort survival and between pathogen load and body condition. While a variety of pathogens had moderate to strong negative correlations with body condition or survival for one host species in one season, we found that Tenacibaculum maritimum and Piscine orthoreovirus had consistently negative associations with body condition in both host species and seasons and were negatively associated with survival for Chinook salmon collected in the fall and winter. Our analyses, which offer the most comprehensive examination of associations between pathogen prevalence and Pacific salmon survival to date, suggest that pathogens in Pacific salmon warrant further attention, especially those whose distribution and abundance may be influenced by anthropogenic stressors.
Introduction
As climate change and other human activities have altered marine environments, a concurrent increase in the incidence of infectious-agent-mediated mortality has been observed across numerous marine taxa (Tracy et al. 2019; Behringer et al. 2020) including corals (Bruno et al. 2007), sea stars (Miner et al. 2018), and mammals (Sanderson and Alexander 2020). These mortality events can cause abrupt changes to the abundance, demographics, and evolution of infected species as well as widespread changes to the structure and function of ecosystems where they occur (Preston et al. 2016). Most well-studied marine epizootics involve relatively immobile organisms in the intertidal zone or megafauna, including pinnipeds, that are readily observable above water. Outbreaks occurring in less easily observed organisms like marine fishes may therefore be under-documented (Bakke and Harris 1998).
Coincident with increased observations of marine disease outbreaks (over the last three decades; Behringer et al. 2020), declines in Pacific salmon (Oncorhynchus spp.) population abundance have become widespread across the southern distributions of multiple species (Zimmerman et al. 2015; Welch et al. 2021). Chinook salmon (Oncorhynchus tshawytscha) in this region have steadily declined, raising concerns of local extirpation of both salmon populations (COSEWIC 2019) and other species that rely on salmon, including resident killer whales (Orcinus orca) (Wasser et al. 2017). Coho salmon (Oncorhynchus kisutch) in some regions have also experienced persistently low survival, for example, some populations in the Salish Sea have demonstrated declines since the 1980s (Zimmerman et al. 2015). Low salmon abundance has severely curtailed Indigenous, recreational, and commercial fisheries (Fisheries and Oceans Canada 2020).
A growing consensus among researchers suggests early marine residence as the period where survival has changed most dramatically (although this likely varies regionally, see Michel 2019), and the hypothesized mechanisms driving this change include altered climatic regimes (Mantua et al. 2010; Hertz et al. 2016), interspecific competition (Kendall et al. 2020), predation (Nelson et al. 2018), primary productivity impacts on growth (Duffy and Beauchamp 2011; Daly and Brodeur 2015), and carryover effects from freshwater (Chasco et al. 2021; Wilson et al. 2021a). A potential role of infectious agents in the multi-decadal decline of Pacific salmon has not been investigated in detail.
Mass mortality of marine resident salmonids caused by infectious agents has been documented in aquaculture settings as a result of outbreaks of disease such as Infectious Salmon Anemia (ISA) in Norway (Rimstad and Mjaaland 2002) and Piscirickettsia salmonis in Chile (Rozas and Enríquez 2014). Monitoring pathogens in wild salmon in the marine environment is uncommon and moribund individuals are nearly impossible to obtain (Bakke and Harris 1998). Therefore, we have no measure of whether ISA, P. salmonis, or any other pathogens impact wild salmon marine survival, aside from a large body of literature indicating that sea lice (Lepeoptheirus salmonis), a readily visible external macroparasite, may cause quantifiable decreases in wild salmon survival (Krkošek et al. 2011; Vollset et al. 2018). Several studies have inferred pathogen-associated mortality in wild salmon by observing truncation in the distribution of pathogen loads (Jacobson et al. 2008; Tucker et al. 2018), temporal changes in pathogen prevalence for a population (Tucker et al. 2018), and body condition indices (Sandell et al. 2015). However, we are not aware of any published studies relating marine population infection metrics to population-level survival estimates for salmonids outside of aquaculture.
In this study, we quantify associations between infectious agents and the early marine survival of Chinook and Coho salmon populations along the Pacific coast of British Columbia. The goal of our exploratory analysis was to identify which pathogens, if any, had the strongest associations with cohort survival, as a first step upon which future, more targeted, studies could be based. Specifically, we quantified pathogen prevalence (percentage of a group infected) and load (intensity of infection) using high-throughput quantitative polymerase chain reaction (ht-qPCR) and related (i) pathogen prevalence to cohort survival and (ii) pathogen load to individual body condition (deviations from the length–mass relationship). By conducting these analyses across two host species, two seasons, and dozens of different pathogens, we sought to identify pathogens demonstrating multiple associations with survival and condition.
Methods
Methods overview
To explore associations between pathogens and both cohort survival and mass deviations, we used a 10-year dataset of Chinook and Coho salmon collected during early marine life along the British Columbia Coast that were assayed for 59 infectious agents using ht-qPCR. For cohort survival, we related coded-wire-tag (CWT) based estimates of survival to the prevalence of each pathogen while accounting for the potential confounding influence of broad-scale oceanographic conditions (Pacific decadal oscillation (PDO)), stock of origin, and ocean entry year (OEY). Deviations in mass (after accounting for length) were modeled in relation to average infection intensity for each pathogen while accounting for the influence of temperature during early marine life (sea surface temperature (SST)), stock, and OEY. These analyses were run separately for two seasons, spring–summer and fall–winter, for reasons described below. The unit of analysis for the cohort survival model was the stock–OEY group estimate of prevalence, whereas for the mass deviation model it was the individual fish. In total, our analyses resulted in eight sets of model results for each infectious agent occurring with sufficient prevalence to run models (19 agents). Such a large number of exploratory comparisons is expected to result in some spurious correlations, so we focused our inference on pathogens with associations that were the most consistent across host species and seasons. This work was the culmination of the second phase of the Strategic Salmon Health Initiative (SSHI; psf.ca/what-we-do/strategic-salmon-health-initiative), a large-scale, multi-organization effort to identify Pacific salmon pathogens with the potential to result in population-level impacts.
Juvenile salmon sampling
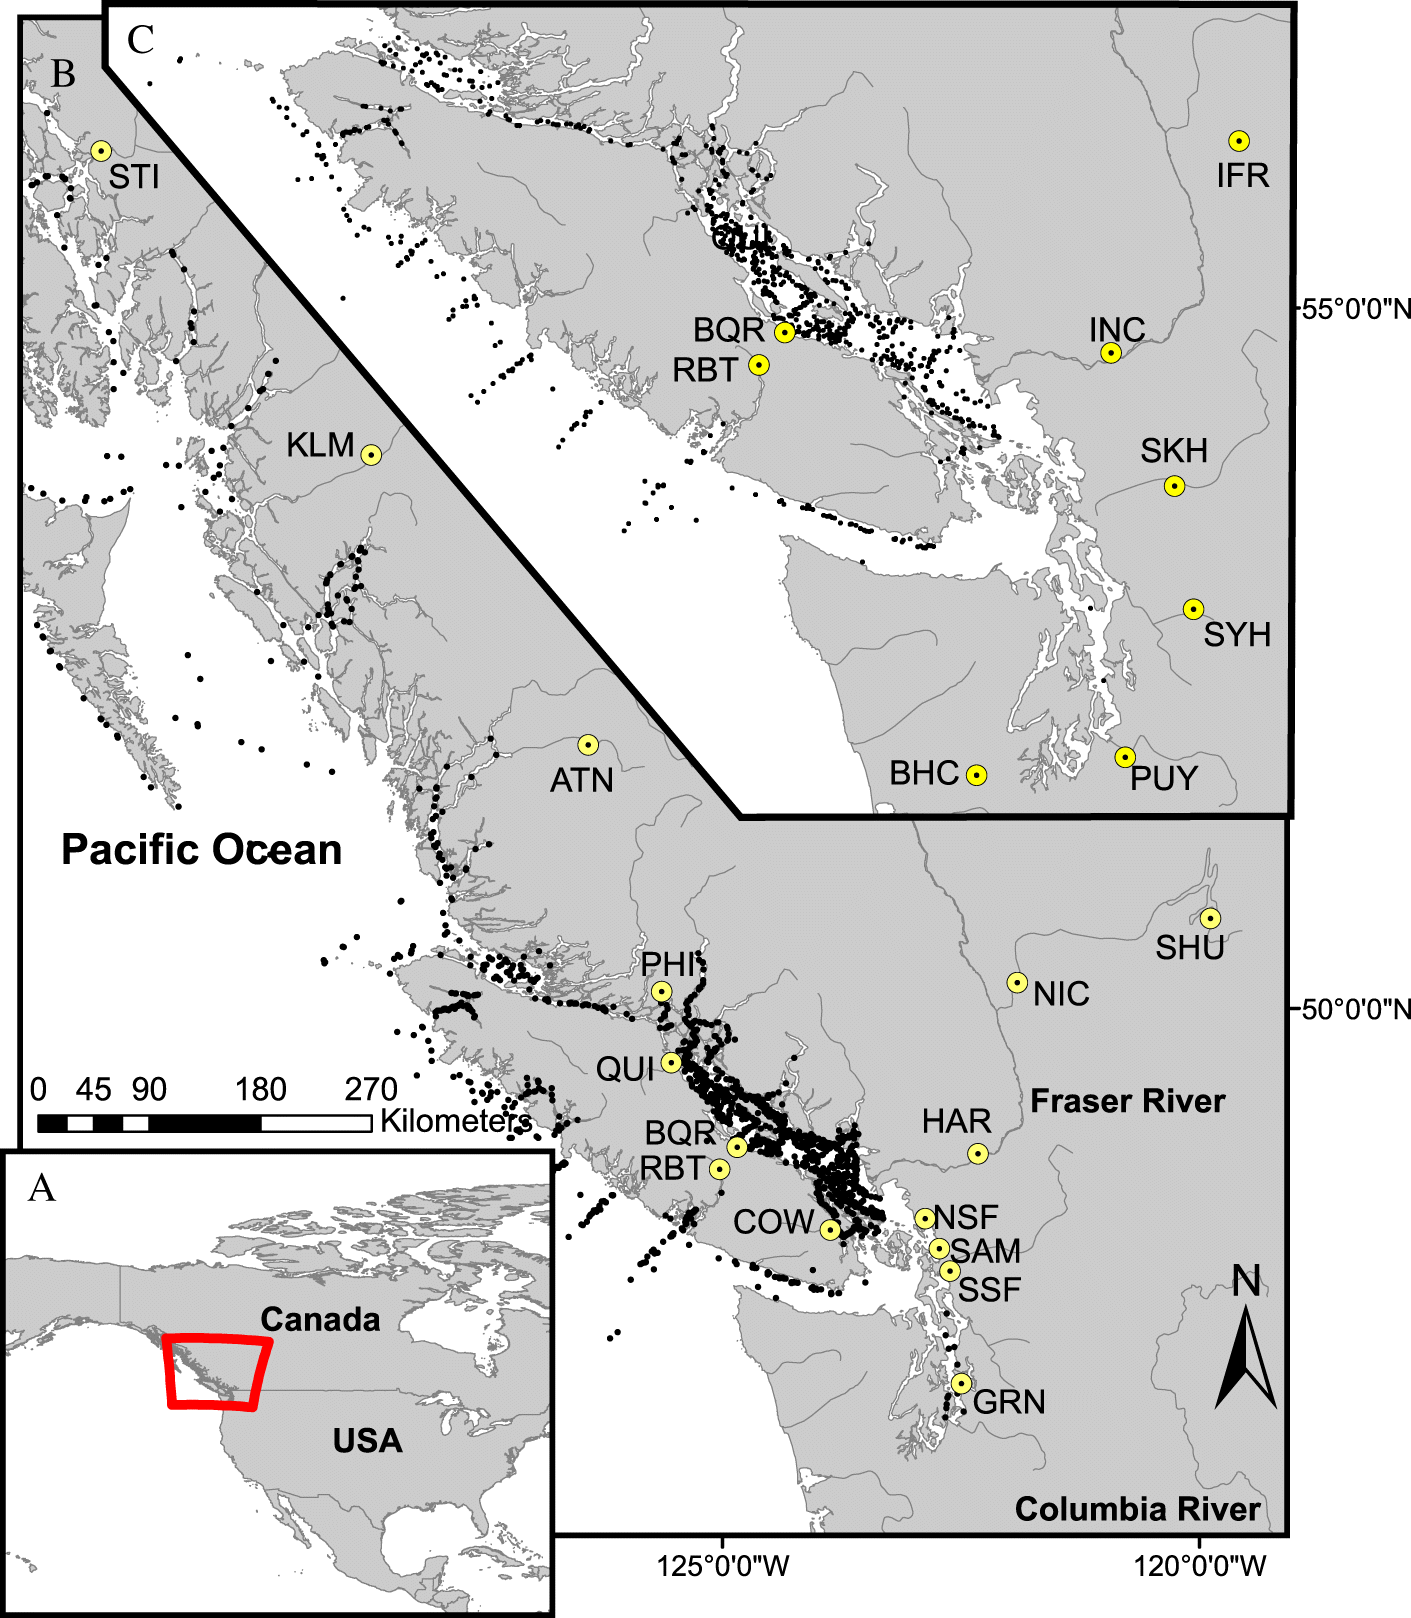
Chinook (n = 5719) and Coho (n = 2059) salmon in their first year of ocean residence (from April through March of the following year) were collected opportunistically during several Fisheries and Oceans Canada research programs from 2008 to 2018 (scientific fishing permit MECTS # 2014-502-00249). Methods used to capture salmon included mid-water trawl (Chinook = 75%; Coho = 91%), purse seine (8%; 4%), and beach seine (17%; 5%). Samples were collected as far north as Fredrick Sound, Alaska (56° N) and as far south as mid-Puget Sound, Washington (56° N; Fig. 1). If still alive upon net retrieval, fish were euthanized in buffered MS-222. A tissue sample was taken from the operculum and preserved in 95% ethanol for genetic stock identification (GSI; Beacham et al. 2006, 2017). Fish were either dissected in the field or frozen at 80 °C after capture and subsequently dissected in the lab. If dissected in the field, tissue samples including gill, brain, liver, head kidney, and heart, were placed in RNAlater (Qiagen, MD, USA) for 24 hours at (4 °C) and then frozen at –80 °C.
Fig. 1.
Genetic stock identification
Genetic stock identification determines the probability of assignment to a population grouping from a baseline of individuals (Beacham et al. 2006). For Chinook, analyses were run with a baseline composed of individuals from 295 stocks (Beacham et al. 2006, specific stock count dependent on the year the analysis was run and the version of the baseline used) utilizing cBayes to estimate stock compositions and individual assignments (Neaves et al. 2005). For Coho, analyses were run with a baseline comprising 321 stocks (Beacham et al. 2020 MGL SNP panel version v1.0.0) utilizing Rubias (Anderson et al. 2008). Eighty-four percent of Chinook and 76% of Coho had assignment probabilities exceeding 0.5, a threshold indicative of regional accuracy (Beacham et al. 2006; Tucker et al. 2018). We considered this threshold appropriate for accurate assignment to conservation units (CU), defined as groupings of populations with similar ecology, life history, and genetics (DFO 2009). For those below 0.5, 77% of Chinook and 89% of Coho were assigned to multiple stocks that were either from the same or adjacent CUs. To avoid assigning survival data to stocks with incorrectly assigned individuals, we chose to group individuals by CU (Supplementary Material 1, Table S2). We also chose to exclude Columbia River-origin Chinook and Coho salmon from our analyses due to their brief residence in our study area (Trudel et al. 2009). Previous samples analyzed over the course of the SSHI have indicated that Columbia River-origin salmon display notably different pathogen profiles from fish originating from British Columbia and Puget Sound (unpublished data; Wang 2018).
Seasonal division
Population distributions, diets, and infectious agent profiles for Chinook and Coho salmon have been shown to vary significantly over the course of the first year of marine life (Jacobson et al. 2008; Duffy et al. 2010; Tucker et al. 2012, 2018). For example, most ocean-type Chinook salmon inhabit nearshore environments for the first months of their ocean residence before reaching a sufficient size to move to more pelagic environments and switch to a more piscivorous diet (Teel et al. 2014; Chittenden et al. 2018), and both diet and habitat may control exposure to some infectious agent taxa (Losee et al. 2014; Kocan 2019). In addition, it is possible that infection-mediated mortality caused by some pathogens is seasonal and associations could be obscured if pathogen prevalence or load is calculated annually as opposed to seasonally. Thus, we divided samples into the spring–summer (April through August; n: Chinook = 2883, Coho = 1062; average fork length ± SD: Chinook = 124.0 ± 49.4, Coho = 172.2 ± 36.4) and fall–winter (September through March; n: Chinook = 2836, Coho = 997; average fork length ± SD: Chinook = 199.9 ± 48.6, Coho = 267.8 ± 34.4) sample periods (sample size precluded further seasonal division).
Molecular methods
Tissue samples were pooled for each individual and screened for the presence of 59 infectious agent taxa (Table 1; Supplementary Material 1, Table S1) using ht-qPCR on the Fluidigm Biomark Dynamic Array™ microfluidics platform (Fluidigm, San Francisco, CA, USA) at the Pacific Biological Station, Nanaimo, British Columbia, Canada. This platform has been analytically validated for quantitative infectious agent profiling in salmon tissue (Miller et al. 2016) and applied to multiple studies of infectious agents in Pacific salmon (e.g., Miller et al. 2014; Thakur et al. 2018; Tucker et al. 2018). Infectious agent taxa were chosen based on knowledge of their presence in Canada or evidence of their association with disease worldwide (Miller et al. 2016). Assays, using taqman probes (Supplementary Material 1, Table S1), were designed to target both RNA and DNA. Herein, we assume that RNA/DNA copy number is representative of infection intensity. Not all of the same agent assays were used over the course of the qPCR runs (113 dynamic arrays run over the course of six years), as some new assays were developed (Mordecai et al. 2019, 2021a) and others were removed after no positive detections across previous studies (see assay percentages in Table 1). Detailed molecular methods are provided in Supplementary Material A.
Table 1.
| % Chinook positive | % Coho positive | ||||
|---|---|---|---|---|---|
| Scientific name | Taxonomic class or family (viruses) | Spring–summer, n = 2883 | Fall–winter, n = 2836 | Spring–summer, n = 1062 | Fall–winter, n = 997 |
| Renibacterium salmoninarum | Actinobacteria | 2.3 (100) | 0.4 (100) | 1.3 (100) | 0.7 (100) |
| Rickettsia-like organism | Alphaproteobacteria | 3.8 (100) | 6.0 (99) | 2.1 (100) | 0.2 (100) |
| Candidatus Branchiomonas cysticola | Betaproteobacteria | 76.4 (98) | 85.9 (98) | 97.1 (100) | 95.6 (100) |
| Candidatus Piscichlamydia salmonis | Chlamydiae | 0.8 (100) | 0.2 (100) | 1.5 (97) | 0.4 (95) |
| Candidatus Syngnamydia salmonis | Chlamydiae | 27.2 (98) | 17.1 (98) | 17.7 (99) | 13.9 (99) |
| Flavobacterium psychrophilum | Flavobacteriia | 7.9 (98) | 7.4 (98) | 3.1 (99) | 1.7 (99) |
| Tenacibaculum maritimum | Flavobacteriia | 2.8 (62) | 11.6 (62) | 4.8 (98) | 11.1 (98) |
| Aeromonas hydrophila | Gammaproteobacteria | 0 (40) | 0 (46) | NA (0) | NA (0) |
| Aeromonas salmonicida | Gammaproteobacteria | 0 (100) | 0 (100) | 0 (100) | 0 (100) |
| Moritella viscosa | Gammaproteobacteria | 0 (3) | 0 (9) | NA (0) | NA (0) |
| Vibrio anguillarum | Gammaproteobacteria | 0 (100) | 0 (100) | 0 (100) | 0 (100) |
| Vibrio salmonicida | Gammaproteobacteria | 0 (100) | 0 (100) | 0 (100) | 1.8 (99) |
| Yersinia ruckeri | Gammaproteobacteria | 0 (63) | 0 (64) | 0 (100) | 0 (100) |
| Piscirickettsia salmonis | Gammaproteobacteria | 0.3 (99) | 1.8 (100) | 0.2 (100) | 0.6 (100) |
| Dermocystidium salmonis | Mesomycetozoea | 0.1 (100) | 0 (100) | 0.6 (100) | 0 (100) |
| Ichthyophonus hoferi | Mesomycetozoea | 11.8 (99) | 23.6 (98) | 10.7 (100) | 8.7 (99) |
| Sphaerothecum destruens | Mesomycetozoea | 1.2 (100) | 2.6 (100) | 2.4 (100) | 4.5 (100) |
| Facilispora margolisi | Microsporea | 5.0 (98) | 11.8 (98) | 5.0 (99) | 7.2 (98) |
| Loma salmonae | Microsporea | 18.5 (99) | 30.4 (98) | 38.2 (99) | 47.7 (98) |
| Paranucleospora theridion (syn. Desmozoon lepeophtherii) | Microsporea | 62.2 (97) | 67.0 (96) | 65.5 (97) | 78.8 (98) |
| Ceratonova shasta | Myxosporea | 24.4 (99) | 22.7 (99) | 10.7 (100) | 5.9 (100) |
| Kudoa thyrsites | Myxosporea | 6.2 (100) | 6.1 (99) | 3.2 (100) | 2.8 (100) |
| Myxobolus arcticus | Myxosporea | 33.8 (99) | 30.8 (98) | 14.9 (99) | 13.0 (99) |
| Myxobolus cerebalis | Myxosporea | 0 (37) | 0 (36) | NA (0) | NA (0) |
| Myxobolus insidious | Myxosporea | 0.6 (100) | 0.3 (100) | 3.0 (100) | 3.0 (100) |
| Parvicapsula kabatai | Myxosporea | 16.1 (99) | 1.1 (100) | 10.2 (100) | 4.2 (100) |
| Parvicapsula minibicornis | Myxosporea | 33.5 (98) | 36.8 (97) | 40.8 (98) | 36.5 (97) |
| Parvicapsula pseudobranchicola | Myxosporea | 26.2 (97) | 79.5 (97) | 36.5 (96) | 76.9 (97) |
| Tetracapsuloides bryosalmonae | Myxosporea | 12.6 (99) | 12.0 (99) | 11.8 (100) | 2.0 (100) |
| Gyrodactylus salaris | Monogenea | 0 (40) | 0 (46) | NA (0) | NA (0) |
| Nanophyetus salmincola | Trematoda | 0.8 (100) | 2.8 (100) | 2.8 (100) | 2.6 (100) |
| Cryptobia salmositica | Kinetoplastida | 0.2 (100) | 0.1 (100) | 2.0 (100) | 2.1 (100) |
| Ichthyophthirius multifiliis | Oligohymenophorea | 14.7 (90) | 8.0 (91) | 5.1 (96) | 4.5 (98) |
| Neoparamoeba perurans | Discosea | 0.1 (100) | 0.6 (100) | 0 (100) | 0.5 (100) |
| Spironucleus salmonicida | Trepomonadea | 0 (40) | 0 (46) | NA (0) | NA (0) |
| Cutthroat trout virus 2 | Hepeviridae | <0.1 (63) | 0 (62) | 0 (100) | 0 (100) |
| Salmon alphavirus | Togaviridae | 0 (40) | 0 (46) | NA (0) | NA (0) |
| Infectious pancreatic necrosis virus | Birnaviridae | 0 (40) | 0 (46) | NA (0) | NA (0) |
| Piscine myocarditis virus | Totiviridae | 0 (40) | 0 (46) | NA (0) | NA (0) |
| Salmon Pescarenavirus 1 | Arenaviridae | 5.0 (62) | 6.5 (61) | 0.3 (100) | 0.2 (100) |
| Salmon Pescarenavirus 2 | Arenaviridae | 0.5 (59) | 0.3 (52) | 0.4 (100) | 0.2 (100) |
| Salmon herpesvirus | Alloherpesviridae | 0 (40) | 0 (46) | NA (0) | NA (0) |
| Infectious salmon anemia virus | Orthomyxoviridae | 0 (40) | 0 (46) | NA (0) | NA (0) |
| Rainbow trout orthomyxovirus | Orthomyxoviridae | 0 (63) | 0 (62) | 0 (100) | 0 (100) |
| Viral encephalopathy and retinopathy virus | Nodaviridae | 0 (100) | 1.1 (100) | 0 (100) | 0.1 (100) |
| Erythrocytic necrosis virus | Iridoviridae | 15.1 (99) | 20.7 (99) | 6.7 (100) | 10.3 (99) |
| Atlantic Salmon Paramyxovirus | Paramyxoviridae | 0 (37) | 0 (36) | NA (0) | NA (0) |
| Infectious hematopoietic necrosis virus | Rhabdoviridae | 0.1 (100) | 0.1 (100) | 0 (100) | 0 (100) |
| Viral hemorrhagic septicemia virus | Rhabdoviridae | 1.1 (100) | 0.5 (99) | 1.0 (100) | 0.8 (99) |
| Atlantic Salmon Calicivirus | Caliciviridae | 0.1 (63) | 0.4 (63) | 0.2 (100) | 0.4 (100) |
| Pacific salmon nidovirus | Coronaviridae | 9.6 (60) | 0.2 (54) | 0.7 (100) | 0 (100) |
| Salmon gill pox virus | Poxviridae | 0 (63) | 0 (63) | 0 (74) | 0 (86) |
| Pacific salmon parvovirus | Parvoviridae | 0.4 (95) | 0.5 (94) | 0.5 (100) | 0 (100) |
| Chinook aquareovirus | Reoviridae | 0 (63) | 0 (62) | 0 (100) | 0 (100) |
| Piscine orthoreovirus | Reoviridae | 5.3 (100) | 5.0 (100) | 9.6 (100) | 2.3 (100) |
| Putative Narna-like virus | Unclassified Narnaviridae | 0 (63) | 0 (63) | NA (0) | NA (0) |
| Putative RNA virus 1 | Unclassified | 0.3 (60) | 3.6 (54) | 0.8 (100) | 0.7 (100) |
| Putative toti-like virus | Unclassified Totiviridae | 0 (62) | 0 (62) | 0 (100) | 0 (100) |
Note: Agent names in boldface were detected in this study. The percent of the assayed samples that tested positive for each season are given with the percent of the total sample that was assayed in parentheses. Primer and probe sequences are available in Supplementary Material 1, Table S1. To best describe the taxonomic group of each agent we listed species by class for prokaryotic and eukaryotic agents or by (expected) family for viruses.
Statistical analyses
We conducted two distinct analyses to investigate the influence of infectious agents on the survival and condition of Chinook and Coho salmon: (i) multi-level models of CWT-derived cohort survival in relation to pathogen prevalence and (ii) multi-level models of mass deviations in relation to average pathogen load. Multi-level models (linear mixed effects models) were fit in a Bayesian framework to quantify variability in effects across population groupings and to account for shared year effects. We included variables representative of oceanographic conditions (PDO) and SST in our models (described below) to account for the well-known association between water temperature and survival (Mantua and Hare 2002; Miller et al. 2013; Gosselin et al. 2018) and to enable direct comparisons of the magnitude of temperature and pathogen effects. For both survival and mass deviation analyses, separate models were fit for each infectious agent, in each host species, in each season. The same parameters were estimated across pathogens for each model type (i.e., no model selection was conducted).
Pathogen associations with variation in cohort survival
Cohort survival was estimated using CWT data matched to CUs (as determined by GSI; Fig. 2; Supplementary Material 1, Table S2). CWT are small, serial-engraved strips of metal that are implanted in juvenile salmon snouts (Johnson 1990). Many studies of marine survival in Pacific salmon populations, especially those from the Columbia River north to British Columbia, rely on survival estimates determined by recoveries of CWT from hatchery-origin fish. Some such studies have revealed considerable heterogeneity in survival estimates across large spatial scales, with populations in close proximity showing more similar patterns in survival (Zimmerman et al. 2015; Ruff et al. 2017). For Chinook salmon, we matched CUs (sometimes multiple) to CWT survival data based on assignments used previously (Supplementary Material 1, Table S2; DFO 2018; Brown et al. 2020). Because CWTs are used as indicator stocks for management units (as opposed to CUs) for Coho salmon, we determined these matches for this species based on proximity between locations of CWT origin (typically hatcheries) and CUs (Supplementary Material 1, Table S2).
Fig. 2.
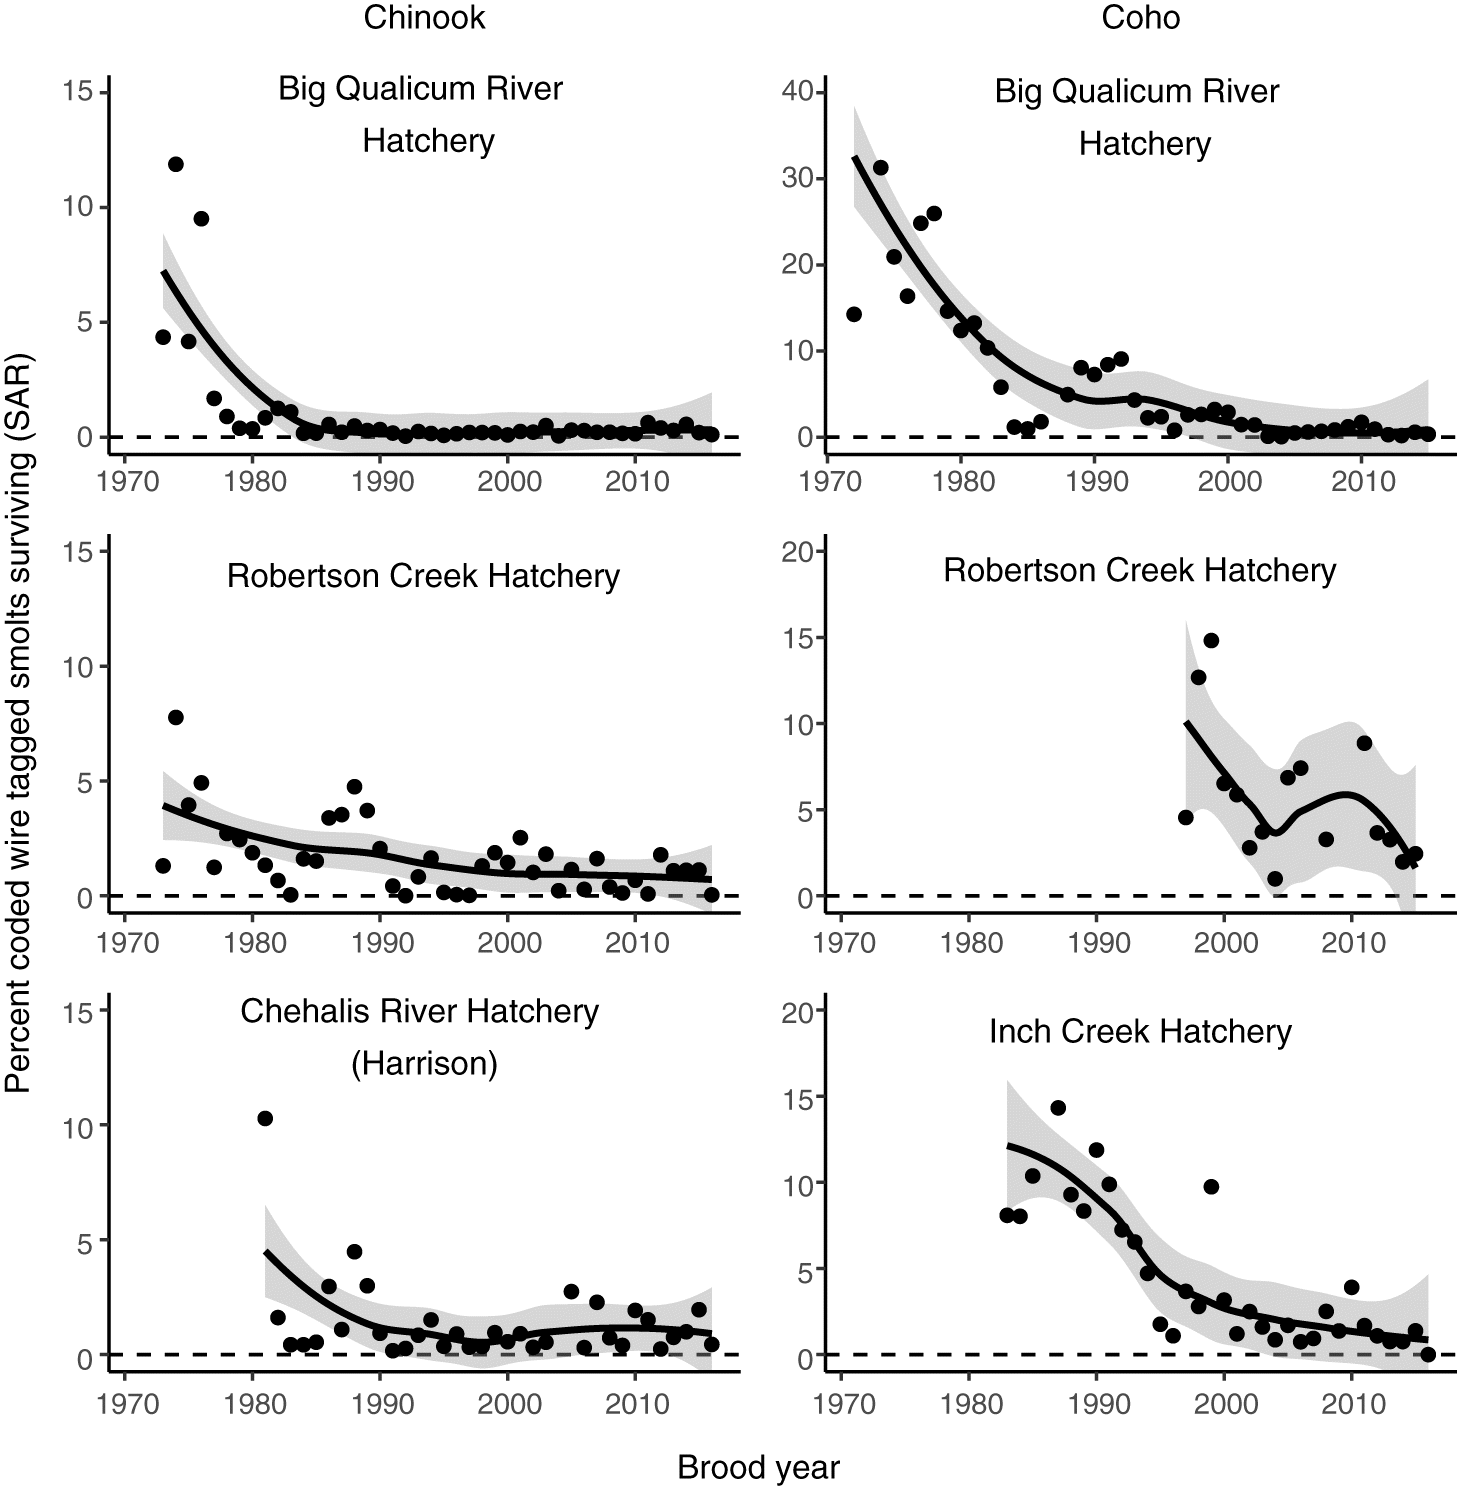
For both Chinook and Coho salmon we used previously calculated estimates of smolt-to-adult returns (SAR; Fig. 2) based on CWT data. Because hatchery fish are released into freshwater prior to seaward migration, SAR estimates include survival during freshwater migration, in addition to marine residence and return spawning migration. However, survival cannot be disaggregated amongst these periods. For Coho salmon, an updated version of the dataset used by Zimmerman et al. (2015) was acquired through the Salish Sea Marine Survival Project (marinesurvivalproject.com/). We acquired SAR estimates for Interior Fraser Coho (IFR, Supplementary Material 1, Table S2) from Arbeider et al. (2020). The estimates in these datasets were based on CWTs recovered from age 3 Coho salmon caught in fisheries and returning to hatcheries and spawning grounds. To generate a SAR estimate, CWT recoveries from fisheries and escapement were expanded by the fraction of the total catch and escapement sampled, summed, and divided by the number of CWT smolts released from the corresponding brood year. The approaches to estimate SAR for both salmon species assume perfect detection of CWTs in sampled fish and no CWT loss from surviving fish. For Chinook, we used SAR estimates generated by the Pacific Salmon Commission Chinook Technical Committee’s (CTC) Exploitation Rate Analysis (ERA; Chinook Technical Committee 2019, pers. comm. Gayle Brown, CTC), as described in Welch et al. (2021). The Chinook SAR estimates we used were calculated similarly to the Coho SAR estimates, but include a term for fisheries-related incidental mortality (Welch et al. 2021). We note that the Chinook SAR estimates are not part of an official CTC product and are different from the commonly applied early marine survival metric generated by the ERA (also known as age 2(3) survival). The CTC’s early marine survival estimate specifically calculates survival before Chinook are captured in fisheries, and we instead elected to use the SAR estimate for consistency with our Coho SAR estimates. Furthermore, because pathogen-mediated mortality for some agents in our study is not well understood, we aimed to avoid limiting the potential period of impact to the early marine phase. Although an important distinguishing feature of the early marine survival estimate is that it accounts for natural mortality, the SAR estimate we used and the early marine survival estimate are highly correlated (for our dataset, R2 = 0.81).
Associations between infectious agent prevalence and cohort survival were estimated as:where Si is cohort survival (SAR) for observation i (one observation is a CWT stock, season, and ocean entry year combination given a minimum sample size of ≥10 fish, to estimate pathogen prevalence; Supplementary Material 1, Tables S3, S4), PDOi is Pacific decadal oscillation, IAPi is infectious agent prevalence, γy(i) is a random effect representing variation in survival among ocean entry years (y), and subscript s indicates among CWT stock variation in the influence of PDO and IAP on survival (i.e., random intercept and slope). We treated IAPi, our key predictor of interest, as a beta random variable to account for sampling error in observations: and are the number of positive and negative, respectively, screening results for salmon from stock i. Adding 1 to both values implies that this beta prior for IAPi is effectively an update of a flat B (1,1) conjugate beta prior, with as the number of binomial successes and as the number of trials that provide information about IAPi (Bolker 2008). The PDO is a variable representative of large-scale ocean temperature regimes that is often correlated with salmon marine survival (Rupp et al. 2012; Dale et al. 2017; Gosselin et al. 2018). The PDO was standardized by centering and dividing by two standard deviations (Gelman 2008). We assumed a random slope for PDO, varying by stock, because PDO could have very different implications for a stock with marine rearing in a relatively cold location (e.g., West Coast Vancouver Island) compared with another rearing in a warm location (e.g., Strait of Georgia). We assumed a random slope for infectious agent prevalence, varying bystock, because immune-system evolution and variation in resistance to certain pathogens is a known feature of local adaptation in salmonids (Ching 1984; Dionne et al. 2007; Wellband and Heath 2013). Note that for Chinook salmon we did not distinguish between ocean and stream life history types, but most CWT–CU matches with adequate sample size (≥10 fish) were dominated by ocean type populations (i.e., migrated to sea in their first year of life), except Atnarko, Nicola, Kitsumkalum, and Stillaguamish (Fig. 1; Supplementary Material 1, Table S2 (all stock acronyms and full names can be found here)). For Coho, we assumed that all juvenile fish spent one year in freshwater prior to their first marine year. A random intercept for stock was included to account for among stock variation in survival (Zimmerman et al. 2015; Ruff et al. 2017) and a random intercept for ocean entry year was included to account for interannual variation in ocean conditions not represented by other model terms.
(1)
Pathogen associated mass deviation
Parameters describing body condition, such as Fulton’s K (Heincke 1908; Bacon et al. 2009) and residuals from length–weight relationships (Miller et al. 2013; Daly and Brodeur 2015; Dale et al. 2017) are sometimes used as a proxy for survival or physiological condition and examined for correlations with environmental variables or even infections (Sandell et al. 2015). Such metrics can be representative of an individual’s health or condition at the time of capture and have been correlated with adult returns (Miller et al. 2013), swimming ability (Wilson et al. 2021b), and predator selectivity (Tucker et al. 2016). We used “mass deviation” in this study with the intent of representing physiological impacts on a time scale relevant to the measured pathogen loads, while cohort survival spans the entire life cycle. To identify pathogens that were associated with mass deviations, we investigated the relationship between pathogen load (number of copies of pathogen RNA/DNA per normalized sample) and individual mass after accounting for the effect of overall length on mass. Our approach assumes that having a mass below average for a given fork length (negative mass deviation) represents suboptimal condition. It is important to note that body condition measures are not necessarily correlated with cohort survival—the relationship to survival can be confounded by unrelated ecological factors (Dale et al. 2017). Associations between infectious agent load and mass deviation were estimated as:Where Mi is mass for observation (fish)i, FLi is fork length, IALi is infectious agent load raised to the power z (estimated by the model), SSTi is the sea surface temperature anomaly at the capture location, γy(i) is a random effect representing among year variation in mass, and the subscript j represents joint adaptive zone (JAZ; DFO 2009). The power transform for IAL not only allows for the IAL effect to take a nonlinear form, as would a log transformation, but also allows the shape of the transformation to be informed by the data. SST (1 km, monthly resolution) was acquired from the NASA Multi-scale Ultra-high Resolution Sea Surface Temperature dataset (coastwatch.pfeg.noaa.gov/erddap/griddap/jplMURSST.html). SST was input to the model as a space–time anomaly, meaning that for each fish sampled, the temperature at the location and month of capture was relative to the average temperature in the capture month at that location across the study years (positive SST anomaly means warmer than average for that location). We used JAZ, which is an aggregation of CUs rearing in adjacent freshwater and marine habitats (DFO 2009), instead of CWT stocks as the population grouping. This enabled utilization of a larger dataset than in the cohort survival analysis while providing a categorization more coarse than CUs (Supplementary Material 1, Tables S5, S6). As in eq. 1, we assumed random slopes for the pathogen and SST variables, varying by population grouping (JAZ). Random effects for JAZ and OEY influencing the intercept were also included. In initial model fits we included a term for age at ocean entry (Chinook only, ocean versus stream type life history) but inclusion did not explain any additional variation in mass deviations and so we chose to omit the term for consistency between species.
(2)
For both the survival and mass deviation dependent variables, we also fit models for composite infection predictor variables intended to represent the combined effects of multiple infections (i.e., coinfections, Kotob et al. 2017). For each fish, we tallied all infectious agent taxa detected (“total pathogen taxa”). We also calculated relative infectious agent burden (RIB), where the infection load (copies RNA/DNA) for a given pathogen in a fish is divided by the maximum load for that pathogen in the population, and then these proportions are summed across all pathogens (Bass et al. 2019). Both cohort survival and mass deviation models were run for both composite variables, and models were identical as described above except that the composite variables took the place of IAP (cohort survival models) and IAL (mass deviation models). For cohort survival models, both total pathogen taxa and RIB were averaged estimates for a given observation. No power transform was applied to these coinfection variables in the mass deviation models.
Model fitting and inference
We fit the models in eqs. 1 and 2 in a Bayesian estimation framework via Markov Chain Monte Carlo (MCMC) sampling in JAGS (Plummer 2003) through R version 3.6.2 (R Core Team 2019) with the “rjags” and “postpack” packages (Plummer 2019; Staton 2020). Data and example code are publicly available through Dryad (https://doi.org/10.5061/dryad.9kd51c5hf). Our aim was to use minimally informative priors: we used sufficiently wide uniform distributions (bounded by 0 and 2) on all standard deviation parameters (i.e., for residuals and random effects) as well as for the exponent z and highly diffuse normal distributions (mean zero with variance of 1 × 10⁶) for coefficients. MCMC sampling was conducted with the same criteria for all models: three sampling chains, 10 000 burn-in samples per chain, and 50 000 post burn-in samples per chain. To assess model convergence, we visualized trace plots and checked that R^ was less than 1.1. If R^ exceeded 1.1, models were run again without the random slope on the SST variable (R^ only exceeded 1.1 in mass deviation models). If model criteria were still not met for a given host species, season, and pathogen combination, that model was removed from the results.
Because we fit eight models for each pathogen (2 host species × 2 seasons × 2 model types), resulting in 22 sets of eight model results (19 pathogens, SST subsampled from all pathogen models and combined, and two coinfection variables), we would expect some relationships to arise based on chance alone (i.e., false positives or Type I errors). Therefore, while we report on the pathogens with the strongest associations with survival and mass deviations in each host–season–model combination, we chose to primarily focus our interpretation on pathogens with the most consistently negative associations across models. To enable comparing results across models for a given pathogen, we calculated the posterior probability (PP) that each model coefficient of interest was below zero (i.e., probabilistic expression of the evidence for a negative association with survival or condition). Although we were primarily interested in negative associations (PP closer to 1) between survival and pathogen prevalence, positive associations (PP closer to 0) are also possible.
PDO was included in every cohort survival model and SST anomaly was included in every mass deviation model, but in both cases we desired an overall mean for these predictors for the sake of comparison with coefficients and posterior distributions of pathogens. Therefore, we randomly sampled the posterior distributions for PDO/SST anomaly from each pathogen model 5000 times and combined these samples to create species–season–model PDO/SST anomaly posterior distributions (Supplementary Material 1, Figures S3, S4).
To compare the ability of pathogens to explain variability relative to that of PDO/SST and the model random effects, we quantified the partial R2 for each model term (fixed and random effects) as described in Ives (2019). A partial R2 allows estimation of how much variance a given model term accounts for:where is the residual variance from the full model (e.g., eq. 1) and is the variance from the reduced model (the full model without the variable for which we would like to know the partial R2). Note that negative partial R2 values can occur, especially in the case of small datasets when the variance explained by a predictor is low (Ives 2019; Rights and Sterba 2020).
(3)
Results
For the spring-summer period, a total of 1653 Chinook and 342 Coho salmon were considered in the cohort survival analysis, consisting of 9 and 6 CWT stock groupings, respectively (Supplementary Material 1, Tables S3, S4). For the fall–winter period, 1865 Chinook and 425 Coho were considered, which consisted of 12 and 6 CWT stock groupings, respectively. In total, these samples made up 62% of the SSHI dataset for Chinook and 38% for Coho. In the mass at length analyses we considered 2463 Chinook and 725 Coho (24 and 19 JAZs, respectively; Supplementary Material 1, Tables S5, S6) in spring–summer and 2711 Chinook and 847 Coho (25 and 21 JAZs, respectively) in fall–winter. These samples accounted for 90% of the SSHI dataset for Chinook and 78% for Coho.
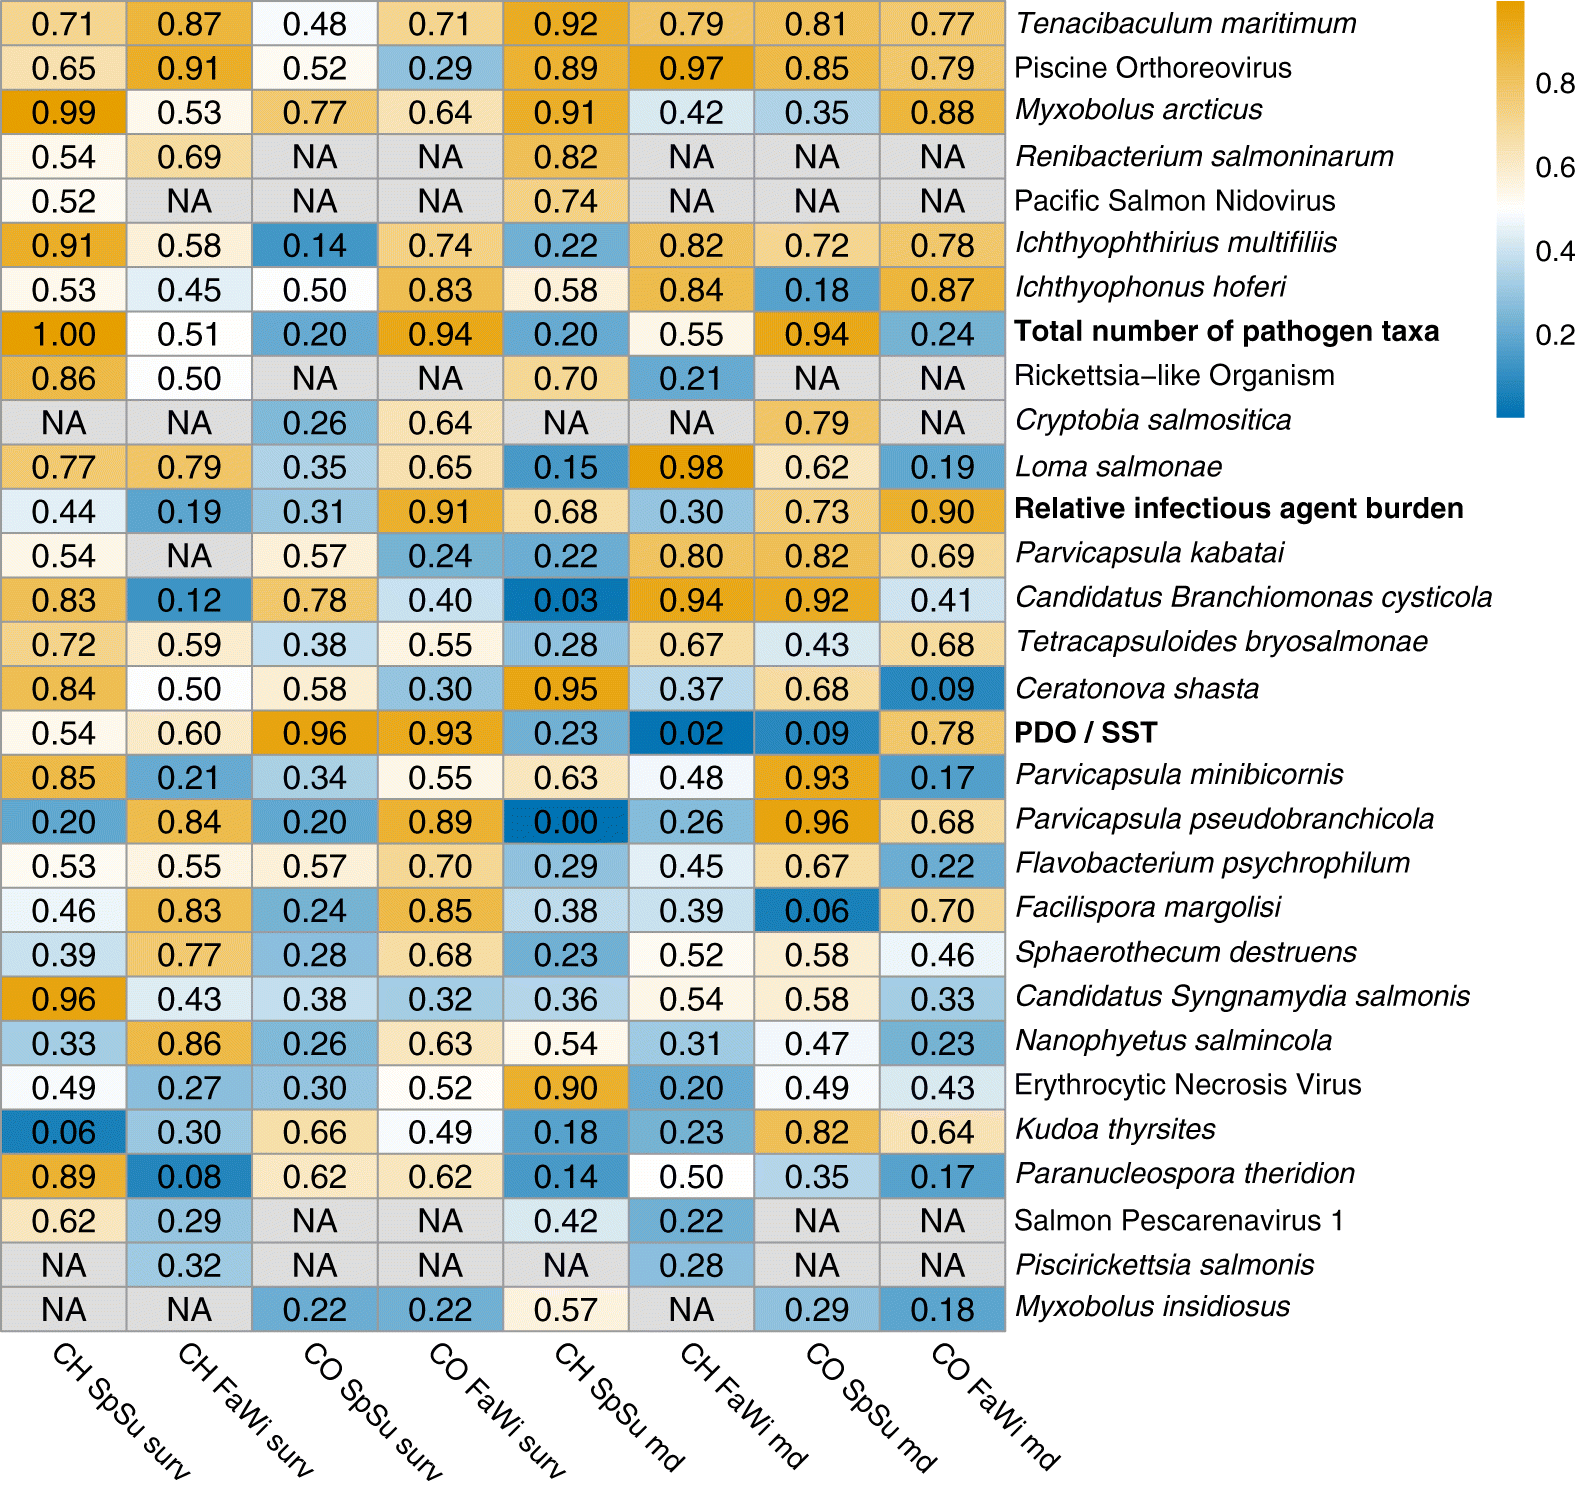
A total of 38 pathogen taxa were detected in Chinook and 36 were detected in Coho (Table 1). Pathogen prevalences, specific to season and host species, can be found in Table 1. MCMC convergence criteria were met for cohort survival models in at least one season for 25 infectious-agent taxa in Chinook and 22 taxa in Coho. For mass deviation models, 29 taxa were tested in at least one season for Chinook and 27 for Coho. There were 19 pathogen taxa with models across all eight species–season model combinations. An example of both model types with raw data and model results is presented in Fig. 3. Similar figures for every pathogen run in both cohort survival and mass deviation models can be found in the Supplementary Materials 2–5.
Fig. 3.
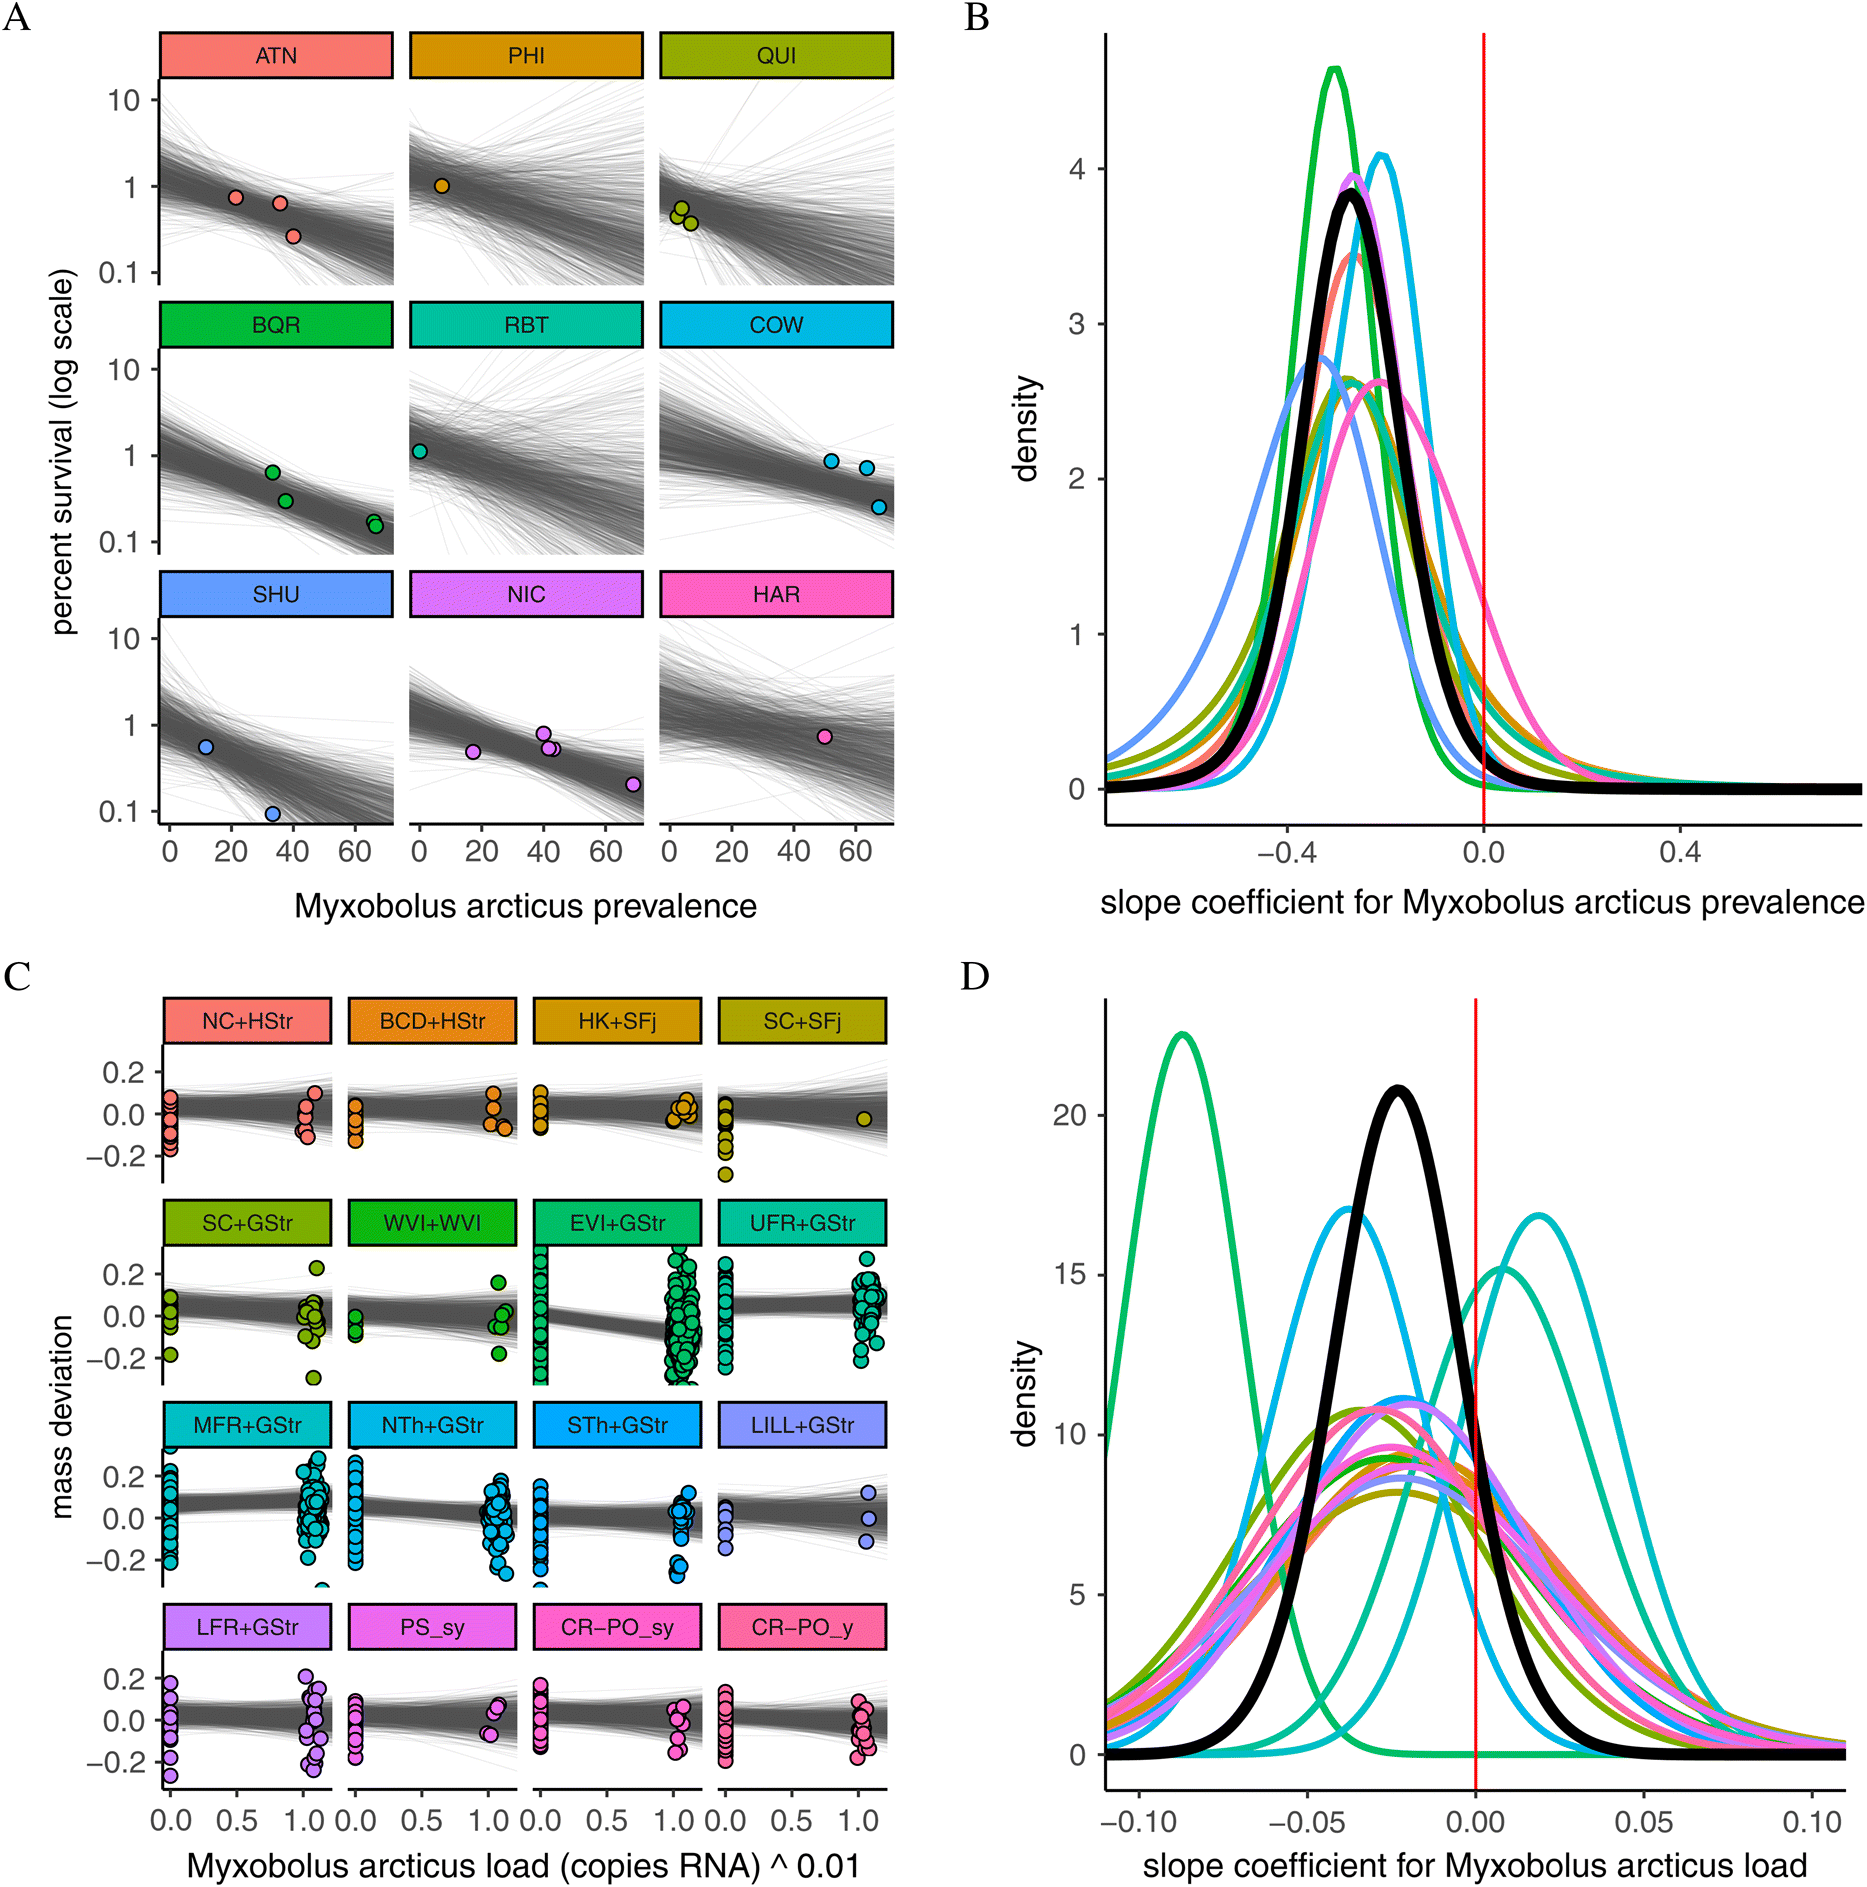
Cohort survival
Myxobolus arcticus had the strongest negative association (as determined by PP) between a pathogen and cohort survival in the study, in Chinook salmon in the spring–summer period (median β = –0.30 (95% credible interval = −0.53 to −0.07); PP < 0 = 0.99; Fig. 3). Candidatus Syngnamydia salmonis was another pathogen with a strong negative association with survival for Chinook in the spring–summer period (PP = 0.96). Piscine orthoreovirus (PRV) had the most negative association for Chinook survival in the fall–winter (PP = 0.91). There were no pathogen coefficients for Coho salmon with 95% credible intervals that did not overlap zero. For Coho, the most negative association in the spring–summer was with Candidatus Branchiomonas cysticola (PP = 0.78) followed closely by M. arcticus (PP = 0.77). In the fall–winter, the pathogen with the most negative association was Parvicapsula pseudobranchicola (PP = 0.89). The strongest positive association between survival and any pathogen was for Kudoa thyrsites in spring–summer Chinook salmon (PP = 0.06).
As an example of how to interpret cohort survival model results, holding all other model variables constant, a 10% increase in M. arcticus prevalence in Chinook salmon would be associated with a 25.9% (95% credible interval = 6.7; 41.1%) decrease in cohort survival, which would equate to a reduction in cohort survival to 0.74% (95% credible interval = 0.59; 0.93%) if we use 1% as a hypothetical baseline survival.
Mass deviation
Ceratonova shasta had the strongest (based on PP) negative association with mass deviation in Chinook salmon in the spring–summer, meaning as C. shasta load increased, fish were increasingly lighter than expected based on length (median β = –0.01 [−0.03 to 0.00]; PP = 0.95). In the fall–winter period, the strongest mass deviation association in Chinook was with Loma salmonae (β = –0.01 [−0.03 to −0.002]; PP = 0.98). For Chinook salmon, the strongest positive association with mass deviation was for Parvicapsula pseudobranchicola in the spring–summer (PP = 0.00; Fig. 4). For Coho salmon, the strongest negative association with mass deviation for spring–summer was with Parvicapsula pseudobranchicola (β = –0.01 [−0.04 to −0.001]; PP = 0.96) and for fall–winter it was with Myxobolus arcticus (PP = 0.88). The strongest positive associations in Coho were with Facilispora margolisi (PP = 0.06) and Ceratonova shasta (PP = 0.09) in the spring–summer and fall–winter, respectively (Figure S2).
Fig. 4.
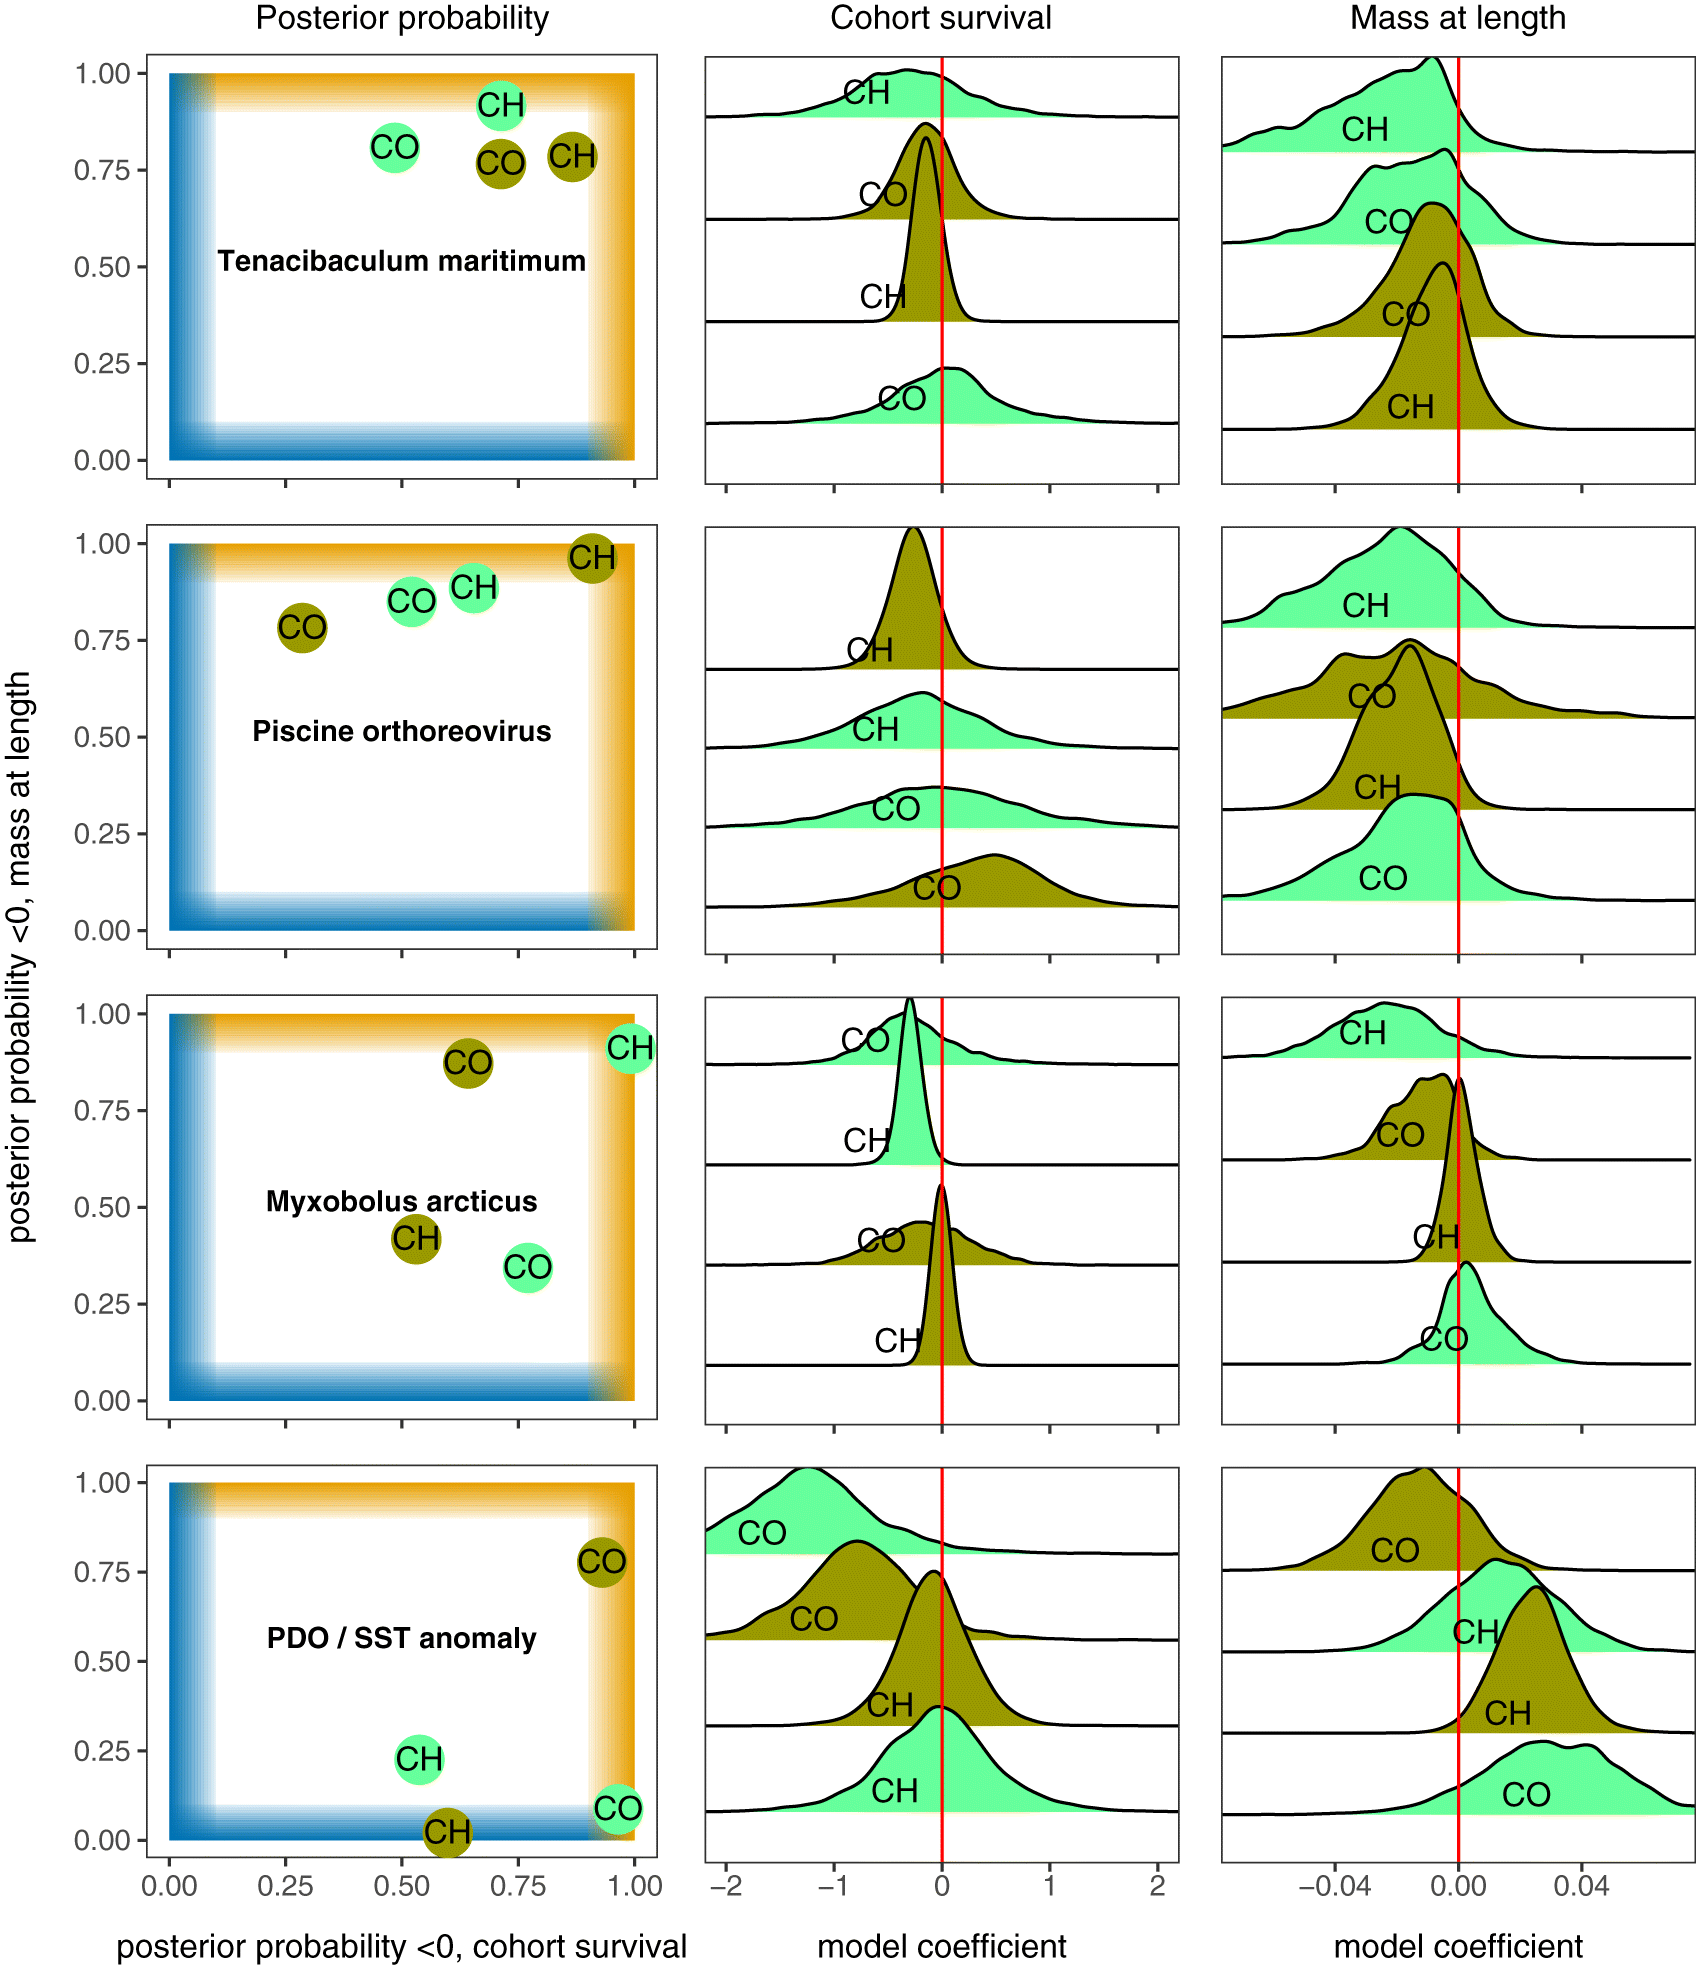
Pathogens with consistent patterns
PRV and Tenacibaculum maritimum both had posterior probabilities for all four mass deviation models indicating weak to strong negative associations (Figs. 4 and 5). For both pathogens, negative associations with Chinook salmon survival were strongest in the fall–winter. Myxobolus arcticus had a strong negative association with both survival and mass deviation in the spring–summer for Chinook salmon (Figs. 3 and 5).
Fig. 5.
Coinfection variables
The total number of pathogen taxa for spring–summer Chinook had the most negative association in the study (PP = 1.00; Fig. 5), and this composite variable was also the most negatively associated for fall–winter Coho (PP = 0.94). Furthermore, total pathogen taxa was negatively associated with Coho mass deviation in the spring–summer (PP = 0.94). RIB was negatively associated with survival for Coho salmon in the fall–winter (PP = 0.91; Fig. 5). Fall–winter was also the season where RIB was negatively associated with mass deviation for Coho (PP = 0.90).
PDO and sea surface temperature
Associations with PDO and SST anomalies, which were included in every model run, were consistent across pathogens for a given model group (Supplementary Material 1, Figures S3, S4). PDO was negatively associated with survival for Coho in both seasons but not for Chinook salmon (PP from randomly sampling (n = 5000 each) posterior distributions from all models: Chinook spring–summer = 0.54, fall–winter = 0.60; Coho spring–summer = 0.96, fall-winter = 0.93; Fig. 4; Supplementary Material 1, S3). SST anomalies were positively associated with mass deviation for three out of four models, with the strongest association for fall–winter Chinook salmon (PP = 0.02) followed by spring–summer Coho salmon (PP = 0.09; Fig. 4; Supplementary Material 1, S4).
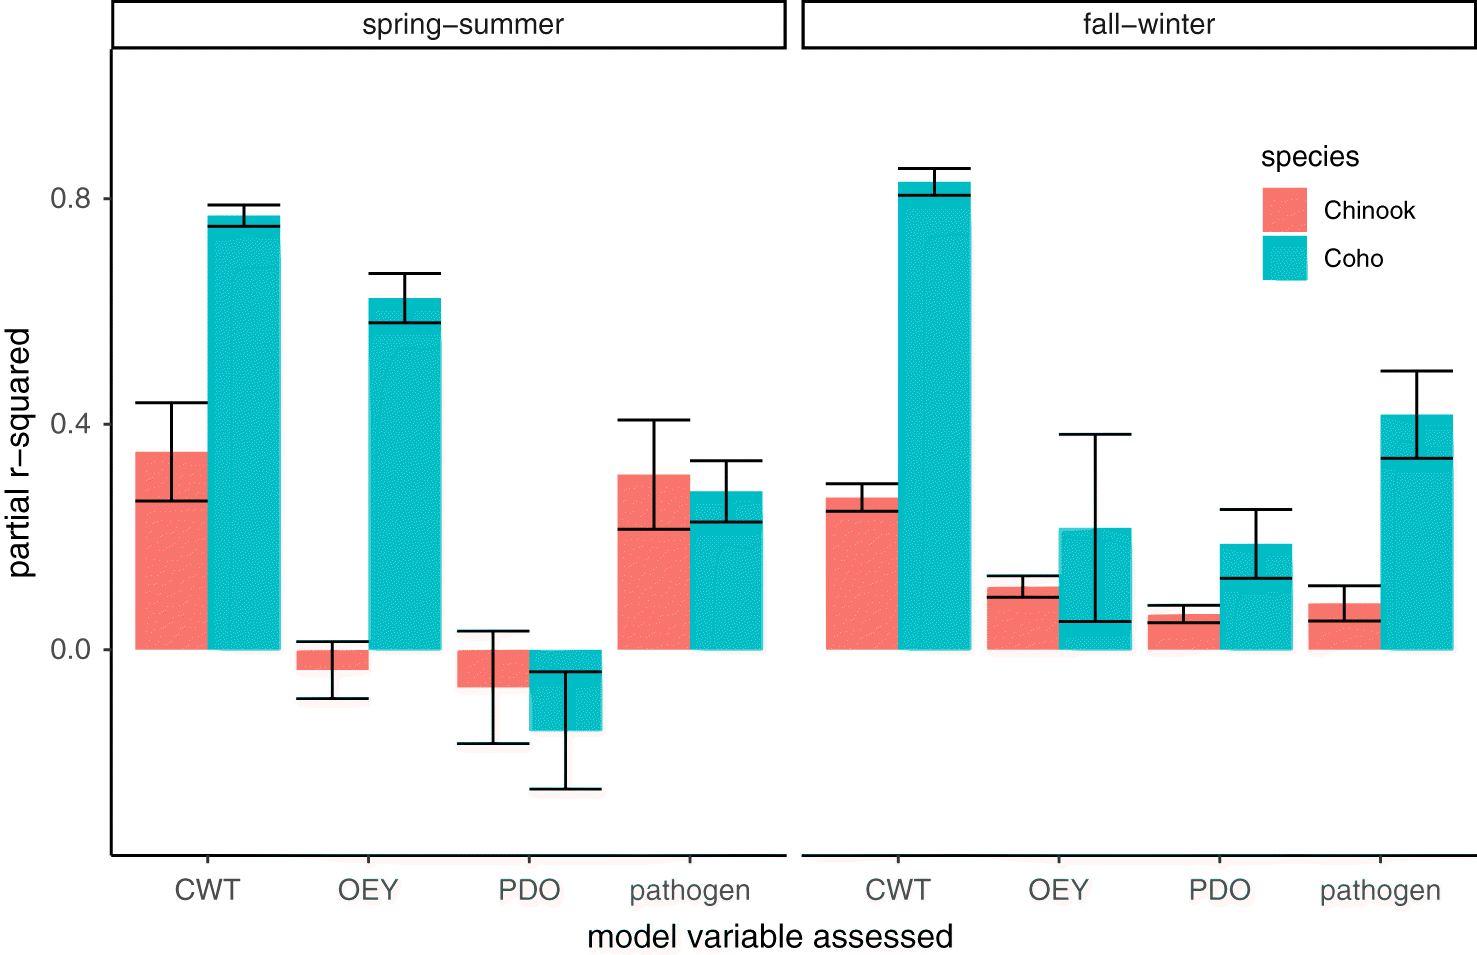
Variance explained by model components
In models for both Chinook and Coho salmon, the random effect of stock generally accounted for the greatest proportion of variance in cohort survival. The variance accounted for by pathogen prevalence was greater than the variance accounted for by PDO, except for fall–winter Chinook where it was similar (Fig. 6). Negative partial R2 values for PDO and OEY in the spring–summer (Fig. 6) were likely a result of small sample sizes (Chinook = 23, Coho = 15) and little variance explained by these variables for some model sets (Ives 2019; Rights and Sterba 2020).
Fig. 6.
Discussion
Depressed early marine survival has been hypothesized to be the primary driver of declines in Coho and Chinook salmon abundance across much of their southern range. At the same time there has been a growing appreciation for the potential for infectious agents to cause mass mortality events across marine taxa. However, little research has addressed the potential role infectious agents may play in reducing early marine survival in salmon. With a unique dataset describing infection loads for dozens of pathogens in thousands of Chinook and Coho salmon over a decade, we analyzed relationships between pathogen prevalence and cohort survival, as well as pathogen load and fish condition, to carry out the most comprehensive analysis to date on the influence of infectious agents on salmon survival. Our models yielded results similar to previous studies of salmon marine mortality, including substantial population-based variation in survival, associations between PDO and survival for Coho, and associations between SST and body condition for Chinook (Miller et al. 2013; Zimmerman et al. 2015; Dale et al. 2017; Ruff et al. 2017). In addition to these previously known factors, we identified Tenacibaculum maritimum and PRV as pathogens consistently negatively associated with mass deviation. These two pathogens, as well as Myxobolus arcticus, showed negative associations with survival for Chinook salmon and corresponding negative associations for mass deviation in the same seasons. These findings, among others specific to one season or host species, provide a starting point for more focused investigations of the population-level impacts of infectious agents on salmon survival.
While our study marks an important step forward in investigating the potential role of infectious agents in salmon survival on a population scale, the complexities of both infectious agent dynamics and salmon survival estimates in some cases hinder clear interpretation of our results. For example, we focused on negative associations between pathogen metrics and survival or condition, but how should we interpret positive associations? (e.g., P. pseudobranchicola load positively associated with mass deviation in spring–summer Chinook; Fig. 5). For some pathogens, positive associations could indicate that a pathogen is transmitted trophically (Losee et al. 2014) or, alternatively, that high prevalence (or presence at all) of some pathogens within a population is only tolerated in years when environmental conditions are agreeable. In another example of the complexity of our results, a pathogen in our analysis might have demonstrated a strong negative association in a host species in a single season and otherwise appeared unimportant (e.g., Ca. S. salmonis was strongly negatively associated with only spring–summer Chinook survival). Such a pathogen, despite having a strong association in only one of eight models, could have important population-level impacts. However, our analytical approach was more likely to prioritize pathogens with multiple negative associations. Finally, our approach is incapable of addressing the potential for susceptibility to pathogens to vary among populations (Ching 1984; Dionne et al. 2009). While we allowed associations to vary by population (i.e., random slope for CWT stock), any difference between populations is shrunk to the global average and would not be accurately represented in our final estimates. While our approach can identify some pathogens for future investigations, region- or stock-specific impacts from some pathogens we assayed were not identified. We do not attempt to solve these complexities here, but we raise them to remind the reader of the exploratory nature of this study and that our analysis and interpretation may not detect some important pathogen–host associations.
Infectious agents associated with poor survival and condition
The prevalence of the marine bacterium, Tenacibaculum maritimum, in fall–winter Chinook salmon was negatively associated with survival. Furthermore, all mass deviation models for this pathogen indicated that higher loads were associated with lower-than-expected mass at length. This is consistent with the observation that Atlantic salmon, Salmo salar, experiencing Tenacibaculosis on British Columbia fish farms tend to have reduced feeding rates (Nowlan et al. 2020). Some strains of T. maritimum have been shown to be highly virulent, resulting in high mortality rates of Atlantic salmon shortly after exposure (Frisch et al. 2018). Accordingly, this bacterium is responsible for significant losses from British Columbia Atlantic salmon farms, sometimes despite prophylactic measures (Nowlan et al. 2020). Bateman et al. (2021a) found that out of dozens of pathogens detected in Atlantic salmon in a longitudinal study conducted on four farm cohorts in British Columbia, prevalence and load of T. maritimum were consistently elevated in dead and dying fish. Another recent study suggested that Fraser River sockeye salmon encountered elevated T. maritimum infection risk and associated mortality when migrating past netpen aquaculture in the spring–summer period (Bateman et al. 2021b). A recent DFO review (DFO 2020) suggested that this bacterium is of little risk to sockeye salmon, primarily because it is not commonly detected in this species. However, our results, paired with global observations of the pathogenicity of T. maritimum and the recently demonstrated risk to sockeye salmon (Bateman et al. 2021b), suggest more information regarding the potential impacts on wild Pacific salmon is needed. Furthermore, because of a reported positive correlation between T. maritimum prevalence and water temperature (Downes et al. 2018), this bacterium may become a greater issue for wild salmon growth and survival in the study region as water temperatures rise (Peña et al. 2018) and antibiotic resistance evolves (Avendaño-Herrera et al. 2008; Nowlan et al. 2020).
Within British Columbia, there has been considerable debate about the risk PRV poses to native salmonids. Of all the pathogens we considered, PRV had the most consistently negative associations between pathogen load and mass deviation. In addition, the fall–winter prevalence of this virus was negatively associated with survival for Chinook salmon. The lineage of the virus found in British Columbia (PRV-1a), introduced from the Atlantic Ocean (Siah et al. 2020; Mordecai et al. 2021b), is considered to be less virulent in Atlantic salmon than the lineage (PRV-1b) which is commonly associated with mortality in Atlantic salmon on farms in Norway (Kongtorp et al. 2006; Wessel et al. 2020). The disease associated with PRV-1a in Atlantic salmon is characterised by inflammation in the heart, whereas in Chinook salmon the rupture of blood cells results in “jaundice/anemia” (Di Cicco et al. 2018), a pathology consistent with all PRV-related diseases in Pacific salmon (Takano et al. 2016; Cartagena et al. 2018; Vendramin et al. 2019). Based on a lack of significant mortality in challenge studies of Pacific salmon using local PRV-1a isolates, it was concluded that PRV in coastal British Columbia is of low virulence to Pacific salmon (Garver et al. 2016; Purcell et al. 2020). In the wild, however, diverse stressors (temperature, starvation, smoltification) can drive the manifestation of disease and sublethal impacts of infection (decreased foraging ability, altered behaviour). These impacts might not be endpoints in a challenge study but can still reduce overall survival, especially in the presence of predators. There is mounting evidence associating PRV-1a with disease in Chinook salmon, including localisation of the virus to early jaundice/anemia lesions in farmed and wild-sampled juvenile Chinook, association of infection with a molecular signal indicative of viral disease, and correlations between viral load and hemoglobin concentration (negative) and post-exercise recovery time (positive) (Miller et al. 2017; Di Cicco et al. 2018; Wang 2018; Polinski et al. 2021). Our results, further contribute to this body of evidence and underscore the need for a greater understanding of the pathogenicity of PRV-1a for wild Pacific salmonids. This is of heightened concern considering PRV-1a is ubiquitous on Atlantic salmon farms in British Columbia (DFO 2019), and there is both genomic and epidemiological evidence for continual transmission between farmed and wild salmon, particularly in the fall–winter period (Mordecai et al. 2021b).
We found that Myxobolus arcticus, a freshwater-transmitted myxozoan, was negatively associated with cohort survival and mass deviations in spring–summer Chinook salmon. Most of the literature concerning Myxobolus arcticus focuses on Sockeye salmon, which is the Pacific salmon species expected to be most exposed to this pathogen due to its lake-rearing freshwater life stage (Kent et al. 1993; Moles and Jensen 1999). Moles and Heifetz (1998) provided strong evidence that M. arcticus infections decrease the swimming ability of sockeye smolts but suggested that this impact did not influence marine survival since survival did not vary between stocks proportionally to M. arcticus prevalence. Aside from use of the pathogen as a population marker (Urawa and Nagasawa 1989), we found little mention in the literature of M. arcticus infections in Chinook or Coho salmon. We suggest that further swim challenge studies of multiple species of infected salmon should be conducted to expand the work of Moles and Heifetz (1998) and determine whether the sub-lethal effect of infection with this parasite could result in a reduced ability to evade predators or reduced feeding efficiency. Furthermore, a better understanding of the degree of the inter-annual variation of this pathogen and the factors affecting it is also necessary, as variation in prevalence could represent variation in freshwater rearing conditions that could themselves impact mortality (i.e., carry-over effects).
The pathogen with the second strongest negative association with survival (after M. arcticus) for Chinook salmon, Ca. S. salmonis, was first discovered in gill epitheliocysts found on salmon in Norway in 2006 (Nylund et al. 2015) and was first detected in British Columbia salmon around 2010 (Miller et al. 2014). There is very little literature describing the ecology or pathology of this bacterium. In a longitudinal study of pathogen dynamics on Atlantic salmon farms in British Columbia, Bateman et al. (2021a) found elevated prevalence of Ca. S. salmonis in dead and dying fish. As with many other understudied pathogens in British Columbia, more focused research on Ca. S. salmonis would help to better assess if it poses a threat for wild fish.
Coinfection variables
In this study, we primarily tested for pathogen associations with survival one pathogen at a time, but clearly this does not reflect reality, where multiple infections (common in marine resident salmon, Tucker et al. 2018) can have synergistic, antagonistic, or neutral effects on fish health (Roon et al. 2015; Kotob et al. 2017). As a first step towards addressing this complexity, we included two composite variables to represent coinfection. RIB was negatively associated with survival and mass deviation for Coho salmon in the fall–winter. Total number of pathogen taxa was strongly negatively associated with survival for Chinook salmon in the spring–summer and Coho survival in the fall–winter, as well as spring–summer Coho mass deviation. Why the two coinfection variables differed in their associations with the two host species is unknown. In their longitudinal study, Bateman et al. (2021a) found that RIB was elevated in farmed Atlantic salmon dying early in their marine residence. Tucker et al. (2018) found that among Fraser River origin Chinook salmon, total pathogen taxa (3.7 on average) increased through marine entrance and into the fall but declined over the winter. The total number of pathogen taxa has been previously associated with elevated predation of sockeye salmon by seabirds in the marine environment (Miller et al. 2014), and a metric similar to RIB has been associated with elevated predation of sockeye smolts by bull trout, Salvelinus confluentus, in freshwater (Furey et al. 2021). Inter-annual variation in coinfection variables has been observed previously (Nekouei et al. 2018) and could reflect freshwater or marine extrinsic factors that promote stress and thus facilitate coinfections (Oakgrove et al. 2014). While researchers tend to focus on one pathogen at a time, the impacts of some pathogens may only be realized in the presence of others (i.e., coinfection).
PDO and sea surface temperature
PDO was strongly negatively associated with Coho survival in both seasons, whereas the associations were neutral for Chinook. There was often a positive association between SST anomaly and mass deviation. In other words, fish were underweight in colder years when survival tended to be higher (at least for Coho). Higher survival in colder years could represent the impact of SST on ecological factors (e.g., predator and prey abundance), while the mass deviation results might demonstrate the impact of SST on individual physiology (more rapid growth at warmer temperatures). A negative correlation between PDO and Coho salmon survival has been observed previously (Rupp et al. 2012; Losee et al. 2014), and some studies have shown Chinook mass at length to be greater in warmer years (Miller et al. 2013; Dale et al. 2017). The importance of water temperature throughout the salmonid life cycle is well known, and its influence on survival is likely to increase in the face of rising freshwater and ocean temperatures. Particularly germane to our discussion is the relationship between temperature and infection, wherein elevated temperatures may act as a catalyst for infection. High water temperature may leave salmon immuno-compromised and more vulnerable to infection (Jokinen et al. 2011; Ray and Bartholomew 2013), modulate host behaviour to increase pathogen exposure (Johnson et al. 1996), and shorten generation times for some infectious agents (Aihua and Buchmann 2001). For many pathogens, temperature will govern the distribution, intensity, and impact of infections (Miller et al. 2014). Because of limitations imposed by the size of our datset, our models did not consider the interaction between temperature and infection, but future studies that do so may better characterize pathogen-survival relationships.
Variance explained by model components
We found that among-population variation and inter-annual effects (random effects in our models) explained a large amount of the cohort survival model variance, a finding consistent with previous studies of variability in marine survival on different ocean scales (Zimmerman et al. 2015; Ruff et al. 2017). In addition to accounting for its potentially confounding effects on survival and growth, a primary motivation for including PDO in our cohort survival models was to be able to directly relate the strength of relationships with infectious agents to a well-known correlate of marine survival and growth. We found that the relative importance of pathogen prevalence and PDO varied between species and seasons, with pathogen prevalence generally accounting for a greater amount of variance than PDO. Given that pathogens may account for variability greater than, or in some contexts similar to PDO, we suggest that infectious disease processes should receive more consideration in efforts to identify factors that influence salmon freshwater and marine survival.
Study limitations
The most important limitation in this study was that although the pathogen dataset we used was unusually large in scope and size, the actual sample size by level considered in the analyses (i.e., the combination of season, ocean entry year, and stock) was relatively small (Chinook spring–summer n = 23, fall–winter n = 57; Coho spring–summer n = 15, fall–winter = 21). Some prevalence estimates were based on as few as 10 individuals from a particular stock (Supplementary Material 1, Tables S3, S4), and accuracy in prevalence estimates is known to decrease as sample size decreases (Jovani and Tella 2006). The uncertainty in estimates of pathogen prevalence due to these small sample sizes, which we did attempt to address in the structure of our survival models, reduces our power to detect true relationships if they existed. A more extensive dataset, or one directing intensive, targeted sampling at fewer populations with robust survival data, would lead to more refined estimates of prevalence-survival correlations. Nevertheless, our dataset and analyses provided a unique opportunity to consider the role of infectious agents in the early marine survival of Pacific salmon.
Because we used CWT data, the most appropriate survival dataset for our analysis, our survival data were based solely on hatchery-released fish. Previous analyses have shown that pathogen profiles of hatchery and wild Chinook and Coho salmon are similar in the marine environment (Thakur et al. 2018; Nekouei et al. 2019). However, mounting evidence suggests a higher incidence of mortality for hatchery salmon relative to wild salmon during early marine residence (Beamish et al. 2012; Chittenden et al. 2018; Chasco et al. 2021). Although there is a theoretical basis for reduced immunocompetence in hatchery fish (Naish et al. 2008), we know of no empirical evidence of reduced resistance in hatchery fish relative to wild fish to any of the pathogens in our study. Future studies would benefit from including cohort survival data for wild populations (e.g., spawn-recruit data) and testing whether the response to infection may differ between hatchery and wild-origin fish.
Our infectious agent prevalence and load estimates were based on nucleic acids detected in pooled tissues, because this enabled us to detect the widest possible array of agents. Analyzing multiple tissues (e.g., heart, gill, spleen, etc.) separately for thousands of samples would have exceeded the capacity of our current project. However, some agents may be restricted to one or two of these tissues, and hence dilution with 4–5 additional tissues may result in an underestimation of load and, in rarer cases, of prevalence. Additionally, some agents that primarily infect the digestive tract, which was not biopsied for our tissue pool (e.g., I. hoferi C. shasta) could be underrepresented in our data.
Almost all studies that seek to identify predictors of salmon cohort survival, including this study, are correlative. Therefore, it is always possible that other unmeasured and unknown factors could be causally related to mortality, whereas the predictor we use (i.e., pathogen prevalence) could simply serve as a marker that coincides with the causal factor. Such a phenomenon was demonstrated by Losee et al. (2014), who found that certain parasite communities in Chinook salmon were correlated with the abundance of returning adults, but concluded that the true causal factor was prey availability, which was correlated with trophically transmitted parasites. Likewise, in our study it is possible that the prevalence of a pathogen is correlated with other factors impacting cohort survival, such as freshwater flow level and temperature (Ogut et al. 2005; Maceda-Veiga et al. 2009; Karvonen et al. 2010). In reality, the ecological determinants and correlates of many of the pathogens in our study are unknown and understudied. The most direct solution to this potential issue of collinearity between pathogen prevalence and unknown factors is experimental manipulation of infection paired with mark–recapture, as researchers have done by applying a sea lice prophylactic to tagged Atlantic salmon (Vollset et al. 2018). For example, if a vaccine similar to that tested by Wessel et al. (2018) proved efficacious in reducing PRV infection and (or) potentially associated disease in Pacific salmon, it could be administered to CWT hatchery salmon so that survival could be compared between treatment groups.
Conclusion
The goal of our study was to explore the relationship between a broad range of infectious agents and the survival and growth of free-ranging (hatchery and wild) Pacific salmon, thereby helping to identify those agents that are most likely to result in population-level impacts to Pacific salmon. Several of the pathogens we identified that were negatively associated with survival have not been extensively studied in the context of Pacific salmon (e.g., T. maritimum, Ca. S. salmonis), or have not been well-studied in Chinook and Coho (M. arcticus) or salmon in the marine environment (M. arcticus). The virulence of another agent we identified as being highly correlated with survival and condition is vigorously debated (PRV). If we had relied on assessments only of agents known to pose a high risk of mortality in culture or laboratory settings, like R. salmoninarum, Aeromonas salmonicida, Piscirickettsia salmonis, Vibrio anguillarum, and Viral hemorrhagic septicemia virus, we may have concluded that pathogens are an unlikely source of mortality in wild salmon. The types of pathogens that have the greatest population level impacts in wild salmon may not be those that cause acute disease and mortality in high-density culture environments, but rather those that are moderately virulent or more chronic in nature and capable of impacting behaviour and performance, leading to indirect mortality.
Future studies of the potential population-level impacts to wild salmonids from infectious agents we have identified here could focus on experimental tests of pathogenicity and virulence. While controlled laboratory challenge studies are considered the gold standard for demonstrating pathogen impacts and are therefore recommended, field studies with experimental manipulations (i.e., vaccinations or other treatments; Vollset et al. 2018) where possible may provide insights that are most representative of impacts on wild salmonids. When field studies with experimental manipulations are not possible, measurement of sub-lethal effects (e.g., swimming ability, predator evasion, changes in growth or appetite) should be included in laboratory challenge studies. We also encourage further study of the distributions of the pathogens we identified, as well as attempts to determine environmental or anthropogenic factors associated with these distributions.
Acknowledgements
We thank the Pacific Salmon Commission’s Chinook Technical Committee, specifically Gayle Brown and Antonio Velez-Espino as well as Mara Zimmerman and the Salish Sea Marine Survival Project for access to CWT survival data; Brian Riddell, Marty Krkošek, Strahan Tucker, Emiliano DiCicco and all others who provided feedback and critique on the ideas and analyses herein; and finally the many field and laboratory researchers who contributed to the creation of the multi-year dataset, including Marc Trudel, Chrys Neville, Tyler Zubkowski, Yeongha Jung, Kelsey Flynn, Kim Jonsen, Collin Wallace, Stephen Yu, Anna Yao, Claire Rycroft, Devan Johnson, and Dylan Conover. Thanks also to the crews of the CCGS WE Ricker and the F/V Viking Storm. Two anonymous reviewers contributed significantly to the improvement of this manuscript. The findings and statements made in this article are those of the authors and do not necessarily represent the views of any organization, governmental or otherwise.
References
Aihua L, and Buchmann K. 2001. Temperature-and salinity-dependent development of a nordic strain of Ichthyophthirius multifiliis from rainbow trout. Journal of Applied Ichthyology, 17(6): 273–276.
Anderson EC, Waples RS, and Kalinowski ST. 2008. An improved method for predicting the accuracy of genetic stock identification. Canadian Journal of Fisheries and Aquatic Sciences, 65(7): 1475–1486.
Arbeider M, Ritchie L, Braun D, Jenewin B, Rickards K, Dionne K, et al. 2020. Interior Fraser Coho Salmon Recovery Potential Assessment. DFO Canadian Science Advisory Secretariat Research Document, 2020/025: xi + 211 p.
Avendaño-Herrera R, Núñez S, Barja JL, and Toranzo AE. 2008. Evolution of drug resistance and minimum inhibitory concentration to enrofloxacin in Tenacibaculum maritimum strains isolated in fish farms. Aquaculture International, 16(1): 1–11.
Bacon P, Palmer S, MacLean J, Smith G, Whyte B, Gurney W et al. 2009. Empirical analyses of the length, weight, and condition of adult Atlantic salmon on return to the Scottish coast between 1963 and 2006. 66(5): 844–859.
Bakke TA, and Harris PD. 1998. Diseases and parasites in wild Atlantic salmon (Salmo salar) populations. Canadian Journal of Fisheries and Aquatic Sciences, 55(S1): 247–266.
Bass AL, Hinch SG, Teffer AK, Patterson DA, and Miller KM. 2019. Fisheries capture and infectious agents are associated with travel rate and survival of chinook salmon during spawning migration. Fisheries Research, 209: 156–166.
Bateman AW, Schulze AD, Kaukinen KH, Tabata A, Mordecai G, Flynn K, et al. 2021a. Descriptive multi-agent epidemiology via molecular screening on atlantic salmon farms in the northeast Pacific Ocean. Scientific Reports, 11(1): 1–15.
Bateman AW, Teffer AK, Bass A, Ming T, Kaukinen K, Hunt BPV, et al. 2021b. Atlantic salmon farms are a likely source of Tenacibaculum maritimum infection in migratory Fraser River sockeye salmon. Canadian Journal of Fisheries and Aquatic Sciences, 448581.
Beacham TD, Candy JR, Jonsen KL, Supernault J, Wetklo M, Deng L, et al. 2006. Estimation of stock composition and individual identification of Chinook salmon across the Pacific Rim by use of microsatellite variation. Transactions of the American Fisheries Society, 135(4): 861–888.
Beacham TD, Wallace C, Jonsen K, McIntosh B, Candy JR, Rondeau EB, et al. 2020. Accurate estimation of conservation unit contribution to coho salmon mixed-stock fisheries in British Columbia, Canada, using direct DNA sequencing for single nucleotide polymorphisms. Canadian Journal of Fisheries and Aquatic Sciences, 77(8): 1302–1315.
Beacham TD, Wallace C, MacConnachie C, Jonsen K, McIntosh B, Candy JR, et al. 2017. Population and individual identification of coho salmon in British Columbia through parentage-based tagging and genetic stock identification: An alternative to coded-wire tags. Canadian Journal of Fisheries and Aquatic Sciences, 74(9): 1391–1410.
Beamish R, Sweeting R, Neville C, Lange K, Beacham T, and Preikshot D. 2012. Wild chinook salmon survive better than hatchery salmon in a period of poor production. Environmental Biology of Fishes, 94(1): 135–148.
Behringer DC, Silliman BR, and Lafferty KD. 2020. Marine disease ecology. Oxford University Press, Oxford, United Kingdom.
Bolker BM. 2008. Ecological models and data in R. Princeton University Press, Princeton, NJ.
Brown GS, Thiess ME, Wor C, Holt CA, Patten B, Bailey RE, et al. 2020. 2020 summary of abundance data for chinook salmon Oncorhynchus tshawytscha in Southern British Columbia, Canada. Canadian Technical Report of Fisheries and Aquatic Sciences. 3401: xiii+214 p.
Bruno JF, Selig ER, Casey KS, Page CA, Willis BL, Harvell CD, Sweatman H, and Melendy AM. 2007. Thermal stress and coral cover as drivers of coral disease outbreaks. PLoS Biology, 5(6): e124.
Cartagena J, Tambley C, Sandino AM, Spencer E, and Tello M. 2018. Detection of piscine orthoreovirus in farmed rainbow trout from Chile. Aquaculture, 493: 79–84.
Chasco B, Burke B, Crozier L, and Zabel R. 2021. Differential impacts of freshwater and marine covariates on wild and hatchery Chinook salmon marine survival. PLoS ONE, 16(2): e0246659.
Ching HL. 1984. Comparative resistance of Oregon (Big Creek) and British Columbia (Capilano) juvenile chinook salmon to the myxozoan pathogen, Ceratomyxa shasta, after laboratory exposure to Fraser River water. Canadian Journal of Zoology, 62(7): 1423–1424.
Chinook Technical Committee. 2019. Pacific Salmon Commission joint chinook technical committee report: 2018 exploitation rate analysis and model calibration, volume one. PSCCTC, Vancouver (BC), Canada. Report TCCHINOOK (19)-2.
Chittenden C, Sweeting R, Neville C, Young K, Galbraith M, Carmack E, et al. 2018. Estuarine and marine diets of out-migrating Chinook Salmon smolts in relation to local zooplankton populations, including harmful blooms. Estuarine, Coastal and Shelf Science, 200: 335–348.
COSEWIC. 2019. COSEWIC assessment and status report on the Chinook Salmon Oncorhynchus tshawytscha, Designatable Units in Southern British Columbia (Part One – Designatable units with no or low levels of artificial releases in the last 12 years), in Canada. Committee on the Status of Endangered Wildlife in Canada, Ottawa. pp. xxxi + 283.
Dale KE, Daly EA, and Brodeur RD. 2017. Interannual variability in the feeding and condition of subyearling Chinook salmon off Oregon and Washington in relation to fluctuating ocean conditions. Fisheries Oceanography, 26(1):1–16.
Daly, E. A. and Brodeur, R. D. (2015). Warming ocean conditions relate to increased trophic requirements of threatened and endangered salmon. PLoS ONE, 10(12): e0144066.
DFO. 2009. Framework for characterizing Conservation Units of Pacific salmon (Oncorhynchus spp.) for implementing the Wild Salmon Policy. DFO Can. Sci. Advis. Sec. Sci. Advis. Rep. 2008/052. [online]: Available from psf.ca/wp-content/uploads/2021/10/Download-PDF959-1.pdf
DFO. 2018. Science information to support consultations on BC Chinook Salmon fishery management measures in 2018. DFO Canadian Science Advisory Secretariat Research Document, 2018/035.
DFO. 2019. Advice from the assessment of the risk to Fraser River Sockeye Salmon due to piscine orthoreovirus (prv) transfer from Atlantic Salmon farms in the Discovery Islands area, British Columbia. Technical report, Fisheries and Oceans Canada Science Advisory Secretariat Research Document 2019/022.
DFO. 2020. Advice from the assessment of the risk to Fraser River Sockeye Salmon due to Tenacibaculum maritimum transfer from Atlantic Salmon farms in the Discovery Islands area, British Columbia. Technical report, Fisheries and Oceans Canada Science Advisory Secretariat Research Document 2020/044.
Di Cicco E, Ferguson HW, Kaukinen KH, Schulze AD, Li S, Tabata A, et al. 2018. The same strain of Piscine orthoreovirus (prv-1) is involved in the development of different, but related, diseases in Atlantic and Pacific Salmon in British Columbia. Facets, 3(1): 599–641.
Dionne M, Miller KM, Dodson JJ, and Bernatchez L. 2009. MHC standing genetic variation and pathogen resistance in wild Atlantic salmon. Philosophical Transactions of the Royal Society B: Biological Sciences, 364(1523): 1555–1565.
Dionne M, Miller KM, Dodson JJ, Caron F, and Bernatchez L. 2007. Clinal variation in MHC diversity with temperature: Evidence for the role of host–pathogen interaction on local adaptation in Atlantic salmon. Evolution, 61(9): 2154–2164.
Downes J, Yatabe T, Marcos-Lopez M, Rodger H, MacCarthy E, O’Connor I, Collins E, and Ruane N. 2018. Investigation of co-infections with pathogens associated with gill disease in Atlantic salmon during an amoebic gill disease outbreak. Journal of Fish Diseases, 41(8): 1217–1227.
Duffy EJ, and Beauchamp DA. 2011. Rapid growth in the early marine period improves the marine survival of Chinook salmon (Oncorhynchus tshawytscha) in Puget Sound, Washington. Canadian Journal of Fisheries and Aquatic Sciences, 68(2): 232–240.
Duffy EJ, Beauchamp DA, Sweeting RM, Beamish RJ, and Brennan JS. 2010. Ontogenetic diet shifts of juvenile Chinook salmon in nearshore and offshore habitats of Puget Sound. Transactions of the American Fisheries Society, 139(3): 803–823.
Fisheries and Oceans Canada. 2020. Pacific region, integrated fisheries management plan, salmon, southern BC. 2020/21. 21-2051: 600p. [online]: Available from waves-vagues.dfo-mpo.gc.ca/Library/40980078.pdf
Frisch K, Småge SB, Vallestad C, Duesund H, Brevik ØJ, Klevan A, et al. 2018. Experimental induction of mouthrot in atlantic salmon smolts using tenacibaculum maritimum from western canada. Journal of Fish Diseases, 41(8): 1247–1258.
Furey NB, Bass AL, Miller KM, Li S, Lotto AG, Healy SJ, et al. 2021. Infected juvenile salmon can experience increased predation during freshwater migration. Royal Society Open Science, 8. [online]: Available from royalsocietypublishing.org/doi/full/10.1098/rsos.201522
Garver KA, Marty GD, Cockburn SN, Richard J, Hawley LM, Müller A, et al. 2016. Piscine reovirus, but not Jaundice Syndrome, was transmissible to Chinook salmon, Oncorhynchus tshawytscha (walbaum), sockeye salmon, Oncorhynchus nerka (walbaum), and Atlantic salmon, Salmo salar l. Journal of Fish Diseases, 39(2): 117–128.
Gelman, A. 2008. Scaling regression inputs by dividing by two standard deviations. Statistics in Medicine, 27: 2865–2873.
Gosselin JL, Zabel RW, Anderson JJ, Faulkner JR, Baptista AM, and Sandford BP. 2018. Conservation planning for freshwater–marine carryover effects on chinook salmon survival. Ecology and Evolution, 8(1): 319–332.
Heincke F. 1908. Bericht über die Untersuchungen der Biologischen Anstalt auf Helgoland zur Naturgeschichte der Nutzfische (1. April 1905 bis 1. Oktober 1907).
Hertz E, Trudel M, Tucker S, Beacham T, Parken C, Mackas D, et al. 2016. Influences of ocean conditions and feeding ecology on the survival of juvenile Chinook Salmon (Oncorhynchus tshawytscha). Fisheries Oceanography, 25(4): 407–419.
Ives AR. 2019. R s for correlated data: Phylogenetic models, lmms, and glmms. Systematic Biology, 68(2): 234–251.
Jacobson KC, Teel D, Van Doornik DM, and Casillas E. 2008. Parasite-associated mortality of juvenile Pacific salmon caused by the trematode Nanophyetus salmincola during early marine residence. Marine Ecology Progress Series, 354: 235–244.
Johnson JK. 1990. Regional overview of coded wire tagging of anadromous salmon and steelhead in northwest America. American Fisheries Society Symposium, 7: 782–816.
Johnson S, Blaylock R, Elphick J, and Hyatt K. 1996. Disease induced by the sea louse (Lepeophteirus salmonis)(Copepoda: Caligidae) in wild sockeye salmon (Oncorhynchus nerka) stocks of Alberni Inlet, British Columbia. Canadian Journal of Fisheries and Aquatic Sciences, 53(12): 2888–2897.
Jokinen IE, Salo HM, Markkula E, Rikalainen K, Arts MT, and Browman HI. 2011. Additive effects of enhanced ambient ultraviolet b radiation and increased temperature on immune function, growth and physiological condition of juvenile (parr) atlantic salmon, salmo salar. Fish & Shellfish Immunology, 30(1): 102–108.
Jovani R, and Tella JL. 2006. Parasite prevalence and sample size: Misconceptions and solutions. Trends in Parasitology, 22(5): 214–218.
Karvonen A, Rintamäki P, Jokela J, and Valtonen ET. 2010. Increasing water temperature and disease risks in aquatic systems: Climate change increases the risk of some, but not all, diseases. International Journal for Parasitology, 40(13): 1483–1488.
Kendall NW, Nelson BW, and Losee JP. 2020. Density-dependent marine survival of hatchery-origin chinook salmon may be associated with pink salmon. Ecosphere, 11(4): e03061.
Kent M, Whitaker D, and Margolis L. 1993. Transmission of Myxobolus arcticus Pugachev and Khokhlov, 1979, a myxosporean parasite of Pacific salmon, via a triactinomyxon from the aquatic oligochaete Stylodrilus heringianus (Lumbriculidae). Canadian Journal of Zoology, 71(6): 1207–1211.
Kocan RM. 2019. Transmission models for the fish pathogen Ichthyophonus: Synthesis of field observations and empirical studies. Canadian Journal of Fisheries and Aquatic Sciences, 76(4): 636–642.
Kongtorp R, Halse M, Taksdal T, and Falk K. 2006. Longitudinal study of a natural outbreak of heart and skeletal muscle inflammation in Atlantic salmon, Salmo salar l. Journal of Fish Diseases, 29(4): 233–244.
Kotob MH, Menanteau-Ledouble S, Kumar G, Abdelzaher M, and El-Matbouli M. 2017. The impact of co-infections on fish: A review. Veterinary Research, 47(1): 98.
Krkošek M, Connors BM, Morton A, Lewis MA, Dill LM, and Hilborn R. 2011. Effects of parasites from salmon farms on productivity of wild salmon. Proceedings of the National Academy of Sciences, 108(35): 14700–14704.
Losee JP, Miller JA, Peterson WT, Teel DJ, and Jacobson KC. 2014. Influence of ocean ecosystem variation on trophic interactions and survival of juvenile coho and Chinook salmon. Canadian Journal of Fisheries and Aquatic Sciences, 71(11): 1747–1757.
Maceda-Veiga, A, Salvadó, H, Vinyoles, D, and De Sostoa, A. 2009. Outbreaks of Ichthyophthirius multifiliis in Redtail Barbs Barbus haasi in a Mediterranean stream during drought. Journal of Aquatic Animal Health, 21(3): 189–194.
Mantua, N, Tohver, I, and Hamlet, A. 2010. Climate change impacts on streamflow extremes and summertime stream temperature and their possible consequences for freshwater salmon habitat in Washington State. Climatic Change, 102(1–2): 187–223.
Mantua NJ, and Hare S. 2002. Pacific-decadal oscillation (pdo). Encyclopedia of Global Environmental Change, 1: 592–594.
Michel CJ. 2019. Decoupling outmigration from marine survival indicates outsized influence of streamflow on cohort success for California’s Chinook salmon populations. Canadian Journal of Fisheries and Aquatic Sciences, 76(8): 1398–1410.
Miller JA, Teel DJ, Baptista A, and Morgan CA. 2013. Disentangling bottom-up and top-down effects on survival during early ocean residence in a population of Chinook salmon (Oncorhynchus tshawytscha). Canadian Journal of Fisheries and Aquatic Sciences, 70(4): 617–629.
Miller KM, Gardner IA, Vanderstichel R, Burnley T, Schulze AD, Li S, et al. (2016). Report on the performance evaluation of the Fluidigm BioMark platform for high-throughput microbe monitoring in salmon. DFO Canadian Science Advisory Secretariat Research Document, 2016/038: xi + 282 p.
Miller KM, Günther OP, Li S, Kaukinen KH, and Ming TJ. 2017. Molecular indices of viral disease development in wild migrating salmon. Conservation Physiology, 5(1).
Miller KM, Teffer A, Tucker S, Li S, Schulze AD, Trudel M, et al. 2014. Infectious disease, shifting climates, and opportunistic predators: Cumulative factors potentially impacting wild salmon declines. Evolutionary Applications, 7(7): 812–855.
Miner CM, Burnaford JL, Ambrose RF, Antrim L, Bohlmann H, Blanchette CA, et al. 2018. Large-scale impacts of sea star wasting disease (SSWD) on intertidal sea stars and implications for recovery. PLoS One, 13(3): e0192870.
Moles A, and Heifetz J. 1998. Effects of the brain parasite Myxobolus arcticus on sockeye salmon. Journal of Fish Biology, 52(1): 146–151.
Moles A, and Jensen K. 1999. Prevalence of the sockeye salmon brain parasite Myxobolus arcticus in selected Alaska streams. Alaska Fishery Research Bulletin, 6(2): 85–93.
Mordecai GJ, Di Cicco E, Günther OP, Schulze AD, Kaukinen KH, Li S, et al. 2021a. Discovery and surveillance of viruses from salmon in british columbia using viral immune-response biomarkers, metatranscriptomics, and high-throughput rt-pcr. Virus Evolution, 7(1): veaa069.
Mordecai GJ, Miller KM, Bass AL, Bateman AW, Teffer AK, Caleta JM, et al. 2021b. Aquaculture mediates global transmission of a viral pathogen to wild salmon. Science Advances, 7. [online]: Available from science.org/doi/10.1126/sciadv.abe2592
Mordecai GJ, Miller KM, Di Cicco E, Schulze AD, Kaukinen KH, Ming TJ, et al. 2019. Endangered wild salmon infected by newly discovered viruses. eLife, 8. [online]: Available from elifesciences.org/articles/47615
Naish KA, Taylor III, JE, Levin, PS, Quinn, TP, Winton, JR, Huppert, D, et al. 2008. An evaluation of the effects of conservation and fishery enhancement hatcheries on wild populations of salmon. Advances in Marine Biology, 53: 61–194.
Neaves P, Wallace C, Candy J, and Beacham T. 2005. cbayes: Computer program for mixed stock analysis of allelic data. Version 4.02. [online]: Available from pac.dfo-mpo.gc.ca/science/facilities-installations/pbs-sbp/mgl-lgm/apps/index-eng.htm
Nekouei O, Vanderstichel R, Kaukinen KH, Thakur K, Ming T, Patterson DA, et al. 2019. Comparison of infectious agents detected from hatchery and wild juvenile Coho salmon in British Columbia, 2008–2018. PloS One, 14(9): e0221956.
Nekouei O, Vanderstichel R, Ming T, Kaukinen KH, Thakur K, Tabata A, et al. 2018. Detection and assessment of the distribution of infectious agents in juvenile Fraser River Sockeye Salmon, Canada, in 2012 and 2013. Frontiers in Microbiology, 9: 3221.
Nelson BW, Walters CJ, Trites AW, and McAllister MK. 2018. Wild Chinook salmon productivity is negatively related to seal density and not related to hatchery releases in the Pacific Northwest. Canadian Journal of Fisheries and Aquatic Sciences, 76(3): 447–462.
Nowlan JP, Lumsden JS, and Russell S. 2020. Advancements in characterizing Tenacibaculum infections in canada. Pathogens, 9(12): 1029.
Nylund S, Steigen A, Karlsbakk E, Plarre H, Andersen L, Karlsen M, et al. 2015. Characterization of ‘Candidatus syngnamydia salmonis’(Chlamydiales, Simkaniaceae), a bacterium associated with epitheliocystis in Atlantic salmon (Salmo salar l.). Archives of Microbiology, 197(1): 17–25.
Oakgrove KS, Harrigan RJ, Loiseau C, Guers S, Seppi B, and Sehgal RN. 2014. Distribution, diversity and drivers of blood-borne parasite co-infections in Alaskan bird populations. International Journal for Parasitology, 44(10): 717–727.
Ogut H, Akyol A, and Alkan MZ. 2005. Seasonality of Ichthyophthirius multifiliis in the trout (Oncorhynchus mykiss) farms of the eastern black sea region of Turkey. Turkish Journal of Fisheries and Aquatic Sciences, 5(1): 23–27.
Peña A, Fine I, and Masson D. 2018. Towards climate change projections of biogeochemical conditions along the british columbia coast. In Report of working group 29 on regional climate modeling, chapter 13. Edited by C. Jang and E. Curchitser. PICES. Sci. Rep. No. 54, 177. pp. 114–124.
Plummer M. 2003. JAGS: A program for analysis of Bayesian graphical models using Gibbs sampling. Edited by K. Hornik, F. Leisch, and A. Zeileis. Proceedings of the 3rd International Workshop on Distributed Statistical Computing (DSC 2003). Vienna, Austria. ISSN 1609-395X. [online]: Available from r-project.org/conferences/DSC-2003/Proceedings/Plummer.pdf
Plummer M. 2019. rjags: Bayesian graphical models using MCMC. R package version 4–10.
Polinski MP, Zhang Y, Morrison PR, Marty GD, Brauner CJ, Farrell AP, et al. 2021. Innate antiviral defense demonstrates high energetic efficiency in a bony fish. BMC biology, 19(1): 1–15.
Preston DL, Mischler JA, Townsend AR, and Johnson PT. 2016. Disease ecology meets ecosystem science. Ecosystems, 19(4): 737–748.
Purcell MK, Powers RL, Taksdal T, McKenney D, Conway CM, Elliott DG, et al. 2020. Consequences of piscine orthoreovirus genotype 1 (prv-1) infections in chinook salmon (oncorhynchus tshawytscha), coho salmon (o. kisutch) and rainbow trout (o. mykiss). Journal of Fish Diseases, 43(7): 719–728.
R Core Team. 2019. R: a language and environment for statistical computing. R Foundation for Statistical Computing, Vienna, Austria.
Ray RA, and Bartholomew JL. 2013. Estimation of transmission dynamics of the Ceratomyxa shasta actinospore to the salmonid host. Parasitology, 140(7): 907–916.
Rights JD, and Sterba SK. 2020. New recommendations on the use of r-squared differences in multilevel model comparisons. Multivariate Behavioral Research, 55(4): 568–599.
Rimstad E, and Mjaaland S. 2002. Infectious salmon anaemia virus: An orthomyxovirus causing an emerging infection in Atlantic salmon. Apmis, 110(4): 273–282.
Roon SR, Alexander JD, Jacobson KC, and Bartholomew JL. 2015. Effect of Nanophyetus salmincola and bacterial co-infection on mortality of juvenile Chinook salmon. Journal of Aquatic Animal Health, 27(4): 209–216.
Rozas M, and Enríquez R. 2014. Piscirickettsiosis and Piscirickettsia salmonis in fish: A review. Journal of Fish Diseases, 37(3): 163–188.
Ruff CP, Anderson JH, Kemp IM, Kendall NW, Mchugh PA, Velez-Espino A, et al. 2017. Salish Sea Chinook salmon exhibit weaker coherence in early marine survival trends than coastal populations. Fisheries Oceanography, 26(6): 625–637.
Rupp DE, Wainwright TC, Lawson PW, and Peterson WT. 2012. Marine environment-based forecasting of coho salmon (oncorhynchus kisutch) adult recruitment. Fisheries Oceanography, 21(1): 1–19.
Sandell T, Teel DJ, Fisher J, Beckman B, and Jacobson K. 2015. Infections by Renibacterium salmoninarum and Nanophyetus salmincola (Chapin) are associated with reduced growth of juvenile Chinook salmon, Oncorhynchus tshawytscha (Walbaum), in the Northeast Pacific Ocean. Journal of Fish Diseases, 38(4): 365–378.
Sanderson CE, and Alexander KA. 2020. Unchartered waters: Climate change likely to intensify infectious disease outbreaks causing mass mortality events in marine mammals. Global Change Biology, 26(8): 4284–4301.
Siah A, Breyta R, Warheit K, Gagne N, Purcell MK, Morrison D, Powell J, and Johnson S. 2020. Genomes reveal genetic diversity of Piscine orthoreovirus in farmed and free-ranging salmonids from Canada and USA. Virus Evolution, 6(2): veaa054.
Staton B. 2020. postpack: Utilities for processing posterior samples stored in ‘mcmc.lists’. R package version 0.5.2. [online]: Available from bstaton1.github.io/postpack/.
Takano T, Nawata A, Sakai T, Matsuyama T, Ito T, Kurita J, Terashima S, et al. 2016. Full-genome sequencing and confirmation of the causative agent of erythrocytic inclusion body syndrome in coho salmon identifies a new type of piscine orthoreovirus. PLoS ONE, 11(10): e0165424.
Teel DJ, Bottom DL, Hinton SA, Kuligowski DR, McCabe GT, McNatt R, et al. 2014. Genetic identification of Chinook salmon in the Columbia River estuary: Stock-specific distributions of juveniles in shallow tidal freshwater habitats. North American Journal of Fisheries Management, 34(3): 621–641.
Thakur KK, Vanderstichel R, Li S, Laurin E, Tucker S, Neville C, Tabata A, and Miller KM. 2018. A comparison of infectious agents between hatchery-enhanced and wild out-migrating juvenile chinook salmon (Oncorhynchus tshawytscha) from Cowichan River, British Columbia. FACETS, 3(1): 695–721.
Tracy AM, Pielmeier ML, Yoshioka RM, Heron SF, and Harvell CD. 2019. Increases and decreases in marine disease reports in an era of global change. Proceedings of the Royal Society B, 286(1912): 20191718.
Trudel M, Fisher J, Orsi J, Morris J, Thiess M, Sweeting R, Hinton S, Fergusson E, and Welch D. 2009. Distribution and migration of juvenile chinook salmon derived from coded wire tag recoveries along the continental shelf of western north america. Transactions of the American Fisheries Society, 138(6): 1369–1391.
Tucker S, Li S, Kaukinen KH, Patterson DA, and Miller KM. 2018. Distinct seasonal infectious agent profiles in life-history variants of juvenile Fraser River Chinook salmon: An application of high-throughput genomic screening. PloS One, 13(4): e0195472.
Tucker S, Mark Hipfner J, and Trudel M. 2016. Size-and condition-dependent predation: A seabird disproportionately targets substandard individual juvenile salmon. Ecology, 97(2): 461–471.
Tucker S, Trudel M, Welch D, Candy J, Morris J, Thiess M, et al. 2012. Annual coastal migration of juvenile Chinook salmon: Static stock-specific patterns in a highly dynamic ocean. Marine Ecology Progress Series, 449: 245–262.
Urawa S, Nagasawa K, Margolis L, and Moles, A. 1998. Stock identification of Chinook salmon (Oncorhynchus tshawytscha) in the north Pacific Ocean and Bering Sea by parasite tags. North Pacific Anadromous Fish Commission Bulletin, 1: 199–204.
Vendramin N, Kannimuthu D, Olsen AB, Cuenca A, Teige LH, Wessel Ø, et al. 2019. Piscine orthoreovirus subtype 3 (PRV-3) causes heart inflammation in rainbow trout (Oncorhynchus mykiss). Veterinary Research, 50(1): 1–13.
Vollset KW, Dohoo I, Karlsen Ø, Halttunen E, Kvamme BO, Finstad B, et al. 2018. Disentangling the role of sea lice on the marine survival of Atlantic salmon. ICES Journal of Marine Science, 75(1): 50–60.
Wang Y. 2018. The physiological associations between infectious agents and migrating juvenile Chinook salmon (Oncorhynchus Tshawytscha). PhD thesis, University of British Columbia.
Wasser SK, Lundin JI, Ayres K, Seely E, Giles D, Balcomb K, et al. 2017. Population growth is limited by nutritional impacts on pregnancy success in endangered Southern Resident killer whales (Orcinus orca). PLoS ONE, 12(6): e0179824.
Welch DW, Porter AD, and Rechisky EL. 2021. A synthesis of the coast-wide decline in survival of West Coast Chinook Salmon (Oncorhynchus tshawytscha, Salmonidae). Fish and Fisheries, 22(1): 194–211.
Wellband KW, and Heath DD. 2013. Environmental associations with gene transcription in Babine Lake rainbow trout: Evidence for local adaptation. Ecology and Evolution, 3(5): 1194–1208.
Wessel Ø, Hansen EF, Dahle MK, Alarcon M, Vatne NA, Nyman IB, et al. 2020. Piscine orthoreovirus-1 isolates differ in their ability to induce heart and skeletal muscle inflammation in Atlantic Salmon (Salmo salar). Pathogens, 9(12): 1050.
Wessel Ø, Haugland Ø, Rode M, Fredriksen BN, Dahle MK, and Rimstad E. 2018. Inactivated Piscine orthoreovirus vaccine protects against heart and skeletal muscle inflammation in Atlantic salmon. Journal of Fish Diseases, 41(9): 1411–1419.
Wessel P, and Smith WH. 1996. A global, self-consistent, hierarchical, high-resolution shoreline database. Journal of Geophysical Research: Solid Earth, 101(B4): 8741–8743.
Wilson SM, Buehrens T, Fisher J, Wilson K, and Moore JW. 2021a. Phenological mismatch, carryover effects, and marine survival in a wild steelhead trout Oncorhynchus mykiss population. Progress in Oceanography, 102533.
Wilson SM, Robinson KA, Gutzmann S, Moore JW, and Patterson DA. 2021b. Limits on performance and survival of juvenile sockeye salmon (oncorhynchus nerka) during food deprivation: A laboratory-based study. Conservation Physiology, 9(1): coab014.
Zimmerman MS, Irvine JR, O’Neill M, Anderson JH, Greene CM, Weinheimer J, et al. 2015. Spatial and temporal patterns in smolt survival of wild and hatchery coho salmon in the Salish Sea. Marine and Coastal Fisheries, 7(1): 116–134.
Supplementary material
Supplementary Material 1
- Download
- 654.02 KB
Supplementary Material 2
- Download
- 3.85 MB
Supplementary Material 3
- Download
- 2.86 MB
Supplementary Material 4
- Download
- 10.09 MB
Supplementary Material 5
- Download
- 6.37 MB
Information & Authors
Information
Published In
FACETS
Volume 7 • Number 1 • January 2022
Pages: 742 - 773
Editor: Elena P. Ivanova
History
Received: 17 July 2021
Accepted: 16 February 2022
Version of record online: 19 May 2022
Copyright
© 2022 Bass et al. This work is licensed under a Creative Commons Attribution 4.0 International License (CC BY 4.0), which permits unrestricted use, distribution, and reproduction in any medium, provided the original author(s) and source are credited.
Data Availability Statement
All relevant data are within the paper and in the Supplementary Material.
Key Words
Sections
Subjects
Plain Language Summary
Infectious agents are associated with survival and condition in free-ranging Pacific salmon
Authors
Author Contributions
ALB, DAP, SGH, and KMM conceived and designed the study.
ALB, EBR, KHK, SL, AMT, and DAP performed the experiments/collected the data.
ALB, AWB, BMC, BAS, and AKT analyzed and interpreted the data.
DAP, SGH, and KMM contributed resources.
ALB, AWB, BMC, BAS, EBR, GJM, AKT, DAP, SGH, and KMM drafted or revised the manuscript.
Competing Interests
The authors have declared that no competing interests exist.
Funding Information
This research was part of the Strategic Salmon Health Initiative, co-led by KMM and co-funded by the Pacific Salmon Foundation (Salish Sea Marine Survival Program), Genome British Columbia, and Fisheries and Oceans Canada. Additional funds and support for research cruises were provided by the Canadian Coast Guard and the Bonneville Power Administration. ALB was supported by a Mitacs Fellowship. AKT was supported by a David H Smith Conservation Research Fellowship.
Metrics & Citations
Metrics
Other Metrics
Citations
Cite As
Arthur L. Bass, Andrew W. Bateman, Brendan M. Connors, Benjamin A. Staton, Eric B. Rondeau, Gideon J. Mordecai, Amy K. Teffer, Karia H. Kaukinen, Shaorong Li, Amy M. Tabata, David A. Patterson, Scott G. Hinch, and Kristina M. Miller. 2022. Identification of infectious agents in early marine Chinook and Coho salmon associated with cohort survival. FACETS.
7(): 742-773. https://doi.org/10.1139/facets-2021-0102
Export Citations
If you have the appropriate software installed, you can download article citation data to the citation manager of your choice. Simply select your manager software from the list below and click Download.
Cited by
1. Is scientific inquiry still incompatible with government information control? A quarter-century later
2. Assigning cause for emerging diseases of aquatic organisms