A simulation-based optimization method for emergency evacuation induced by gas pipeline leakage risk
Abstract
Long-distance gas pipelines with large diameter and high pressure, on which a leakage induces gas diffusion or fire explosion, may result in major influence to nearby buildings and residents. Safety and rapid evacuation of potentially affected people is a top priority. To analyze the affected areas by disasters and improve evacuation efficiency of the affected areas, this study presents a simulation-based optimization method for emergency evacuation induced by gas leakage risk. First, the influence radii of different leakage accidents were calculated based on damage criteria and the evacuation radii around the accidents were determined considering the panic psychology. The number of evacuees and their spatial distribution were calculated. Secondly, an evacuation simulation model for affected communities based on the multi-agent system was established to analyze the evacuation process of residents. Finally, the optimal design method and strategies for community evacuation were proposed. Responsibility areas of organized evacuation service for community exits were determined. The results showed that the evacuation times of the two communities A and C were reduced by 10% and 24%, which indicates organized evacuation is more efficient than unorganized evacuation. The selection of community exits is more balanced. Its rationality of the proposed method was verified by the comparison of evacuation simulation.
1. Introduction
The construction of long gas pipelines is still in a period of rapid development. More and more pipelines are close to the areas where residents and buildings are concentrated. Their transmission medium is inflammable and explosive. Once pipelines are damaged, they will cause gas leakage that can lead to fire or explosion and other accidents, which will bring great threats to natural environment and people (Sovacool et al. 2016; Guo et al. 2019; Liang et al. 2019). The primary task of emergency disposal at the scene is to evacuate the personnel in the adjacent area. However, the construction of natural gas pipelines is designed based on the existing (or planned) regional grade. There is no requirement to reserve emergency spaces around pipelines (Wei et al. 2021; Wang et al. 2020). Hence, it is of great significance to evaluate the possible impact of pipeline accidents, clarify the evacuation radius of the affected area, and develop evacuation strategies in advance, which can prevent accidents and reduce casualties.
The leakage accidents of long-distance pipelines were mainly fire and explosion. Studies on fire and explosion of gas leakage accidents mainly adopt mathematical models or numerical simulation methods to calculate (Ma and Zhang 2016; Díaz-Parra and Vera-López 2018; Terzioglu and Iskender 2021). The mathematical models mainly include gas leakage model, jet fire model, gas cloud explosion model, etc. Mishra and Wehrstedt (2015) utilized semi-empirical and Computational Fluid Dynamics modelings to investigate the scenarios of underground gas pipeline failure, crater formation, dispersion of gas, explosion, and subsequent fires. Whanda et al. (2015) developed an alternative method with Multi-Criteria Decision Analysis and Analytical Hierarchy Process to model potential risk area. Terzioglu and Iskender (2021) used Area Locations of Hazardous Atmospheres (ALOHA) to simulate different scenarios and investigated the risk determination of liquefied petroleum gas storage tank. Han et al. (2017) utilized PHAST RISK software to quantitatively calculate the influence scopes of different accidents, based on which to determine the best evacuation range. Bariha et al. (2016) established energy conservation and mass conservation equations to calculate the impact range of accidents under different pressure pipelines, which can be used to estimate dangerous distance or dangerous area. Ding (2022) carried out a simulation study on warning areas of gas pipeline leakage based on multiple factors and analyzed the influence of different variables on warning areas. The researches mentioned above payed more attention to mechanism analysis of leakage accidents and the influence range of casualties, but payed less attention to emergency evacuation at rescue sites. The analysis of evacuation radius and the temporal and spatial distributions of evacuees were lacked. So, it is necessary to study evacuation area and the number of the predicted evacuees.
The studies on emergency evacuation of communities mostly focus on earthquakes, floods, and other disasters (Chu et al. 2022; Liu 2020; Wang 2020). There are few studies on advance planning of emergency evacuation for the impact of long distance oil and gas pipeline leakage accidents (Han et al. 2017; Yang 2018; Wei et al. 2021). At present, most of the studies focus on evacuation and rescue disposal of accident sites, but lack the reservation and optimization design of emergency spaces. Zhang et al. (2019) constructed an optimization model of emergency evacuation route based on improved adaptive ant colony algorithm, and developed the urban large-scale emergency evacuation decision optimization system platform based on typical accident consequence analysis of oil and gas pipeline. Li and Zhu (2018) established an optimization model of evacuation path based on risk by Dijkstra algorithm.Abdelghany et al. (2014) used the genetic algorithm to optimize evacuation schemes. Based on the risk analysis of toxic gas leakage accident, a regional evacuation decision optimization was realized by Zhang et al. (2017) and Deng et al. (2014), respectively. Chen and Zhan (2014) utilized a multi-agent model to analyze the large-scale integral evacuation at city level, and carried out the performance analysis and comparison of strategies. Gai et al. (2017) proposed a multi-objective evacuation path model for toxic gas leakage.
Therefore, this study presents a numerical simulation method for obtaining the evacuation radius and determining the distribution of people to be evacuated. The evacuation models of communities based on multi-agents are established to analyze the evacuation characteristics of residents. The spatial optimization method and strategies for community emergency evacuation are proposed to determine responsibility areas of organized evacuation for community exit. The efficiency of community evacuation is improved. This study can provide a reference method for community emergency evacuation plan under the influence of pipeline leakage disasters.
2. Materials and methods
2.1. Study area and data
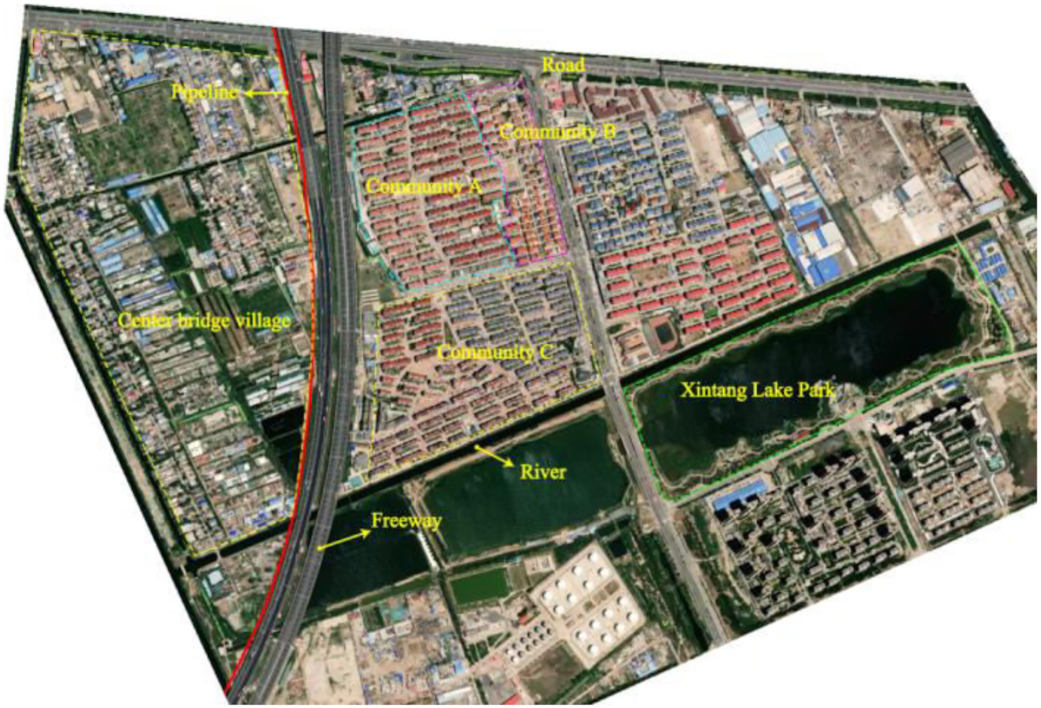
Figure 1 shows the location of the study area and its surrounding environment. There is a long gas pipeline buried in this area, which is close to the freeway, countryside, and residential communities. It intersects with roads and rivers. The pipe material is welded steel pipe and its operating pressure is 8.5 Mpa. It has a diameter of 813 mm. Three communities (namely A, B, and C) are located on the east of the pipeline. The houses in the communities are mostly multi-story buildings made of reinforced concrete structures.
Fig. 1.
2.2. Leakage impact analysis method
1.
Leakage accident of gas pipeline
The consequences of gas pipeline leakage are more serious compared with oil pipeline leakage. Relevant studies show that the major accidents caused by pipeline leakage are mainly jet fire, gas cloud combustion, and gas cloud explosion (Whanda et al. 2015; Han et al. 2017; Terzioglu and Iskender 2021). The leakage of gas transmission pipeline is generally divided into small hole leakage (the leakage aperture is 0∼5 mm), middle hole leakage (5∼50 mm), large hole leakage (50∼150 mm), and pipeline fracture (more than 150 mm) according to leakage aperture (SAWS 2013). The large hole leakage (the representative leakage aperture is 100 mm) was selected to analyze the influence range of the accident in this paper.
2.
Damage criterion and impact radius
The leakage of long-distance gas pipelines usually causes large-scale injuries to people in the form of explosion and combustion. The shockwave caused by gas explosion harms people, so the shockwave overpressure criterion can be used as the damage criterion. Combustion harms people in the form of thermal radiation. The injury caused by thermal radiation to human body is mainly expressed by the degree of injury caused by different thermal radiation flux to human body. The radius of injury includes first-degree burn radius (minor injury), second-degree burn radius (severe injury), and death radius. The criteria of thermal radiation injury were listed according to the industrial standard (SAWS 2013; Han et al. 2017), as shown in Table 1. Damage criteria of explosion shockwave were determined (Yu et al. 1995; Liu 2013), as shown in Table 2.
Table 1.
| Radiative flux (kW/m2) | Manifestations of human injury | Impact radius |
|---|---|---|
| 37.50 | 100% of the people died within 1 min; 1% of the people died within 10 s | Death zone radius |
| 25.00 | 50% of the people died within 1 min; severe burns within 10 s | Severe wound zone radius |
| 12.50 | 10% of the people died within 1 min; minor burns within 10 s | – |
| 4.00 | More than 20 s will cause pain, but will not blister | Minor injury zone radius |
| 1.58 | There will be no discomfort in long-term contact | – |
Table 2.
| Overpressure (kPa) | Manifestations of human injury | Impact radius |
|---|---|---|
| 140 | Probability of death from pulmonary hemorrhage by shockwave is 50% | Death zone radius |
| 44 | Probability of eardrum ruptures caused by shockwave is 50% | Severe wound zone radius |
| 17 | Probability of eardrum ruptures caused by shockwave is 1% | Minor injury zone radius |
Accidents caused by pipeline leaks can cause great psychological panic to the people around them. So, a panic coefficient was introduced to modify the impact range of accident consequences. The evacuation range affected by the accident was obtained. Hence, the relationship between the evacuation radius and the harmful radius of leakage-induced accidents was as follows:where Ri is the radius of minor injury impact of different types of accident consequences, and its value can be obtained by numerical simulation. αi is the panic coefficient of people within the range of minor injuries, and its value of jet flame and gas cloud explosion was 0.0955 and 0.0791, respectively (Song et al. 2015). Re is the maximum evacuation radius affected by the accident.
(1)
2.3. ALOHA-based simulation method
ALOHA is a calculation program used to simulate toxic gas diffusion, fire, explosion, and other hazards caused by hazardous chemical leakage and their threat area. It supports the risk modeling of chemicals in different environments. The parameters of location, weather conditions, accidents, and others are introduced into the software, and it can intuitively simulate the consequences of accidents and the impact scope. So, it can provide an important basis for chemical leakage disaster emergency plan, emergency rescue plan formulation, and real visualization of the scene. ALOHA software includes jet fire model, flash fire model, and gas cloud explosion model under the gas pipeline leakage source. It can be used to simulate the fire and explosion process of long-distance natural gas pipeline leakage. Table 3 shows some main parameters in the simulation of ALOHA software. The soil layer thickness of long-distance gas pipeline was generally about 1.5 m (Yang 2018). Due to the large diameter and pressure of pipelines, the influence of soil layer on simulated results was not considered.
Table 3.
| Parameter | Unit | Parameter | Unit |
|---|---|---|---|
| Gas | LPG (100% methane) | Altitude | 2.73 m |
| Pipe diameter | 813 mm | Wind speed | 5 m/s |
| Internal pressure | 8.5 Mpa | Direction of wind | NW |
| Ambient temperature | 14 °C | Humidity | 25% |
| Diameter of leak hole | 100 mm | Ground state | Urban |
| Longitude and latitude | E117°56′, N39°03′ | Degree of cloud cover | 50% |
Abbreviation: LPG, liquefied petroleum gas.
2.4. Simulation model of evacuation
The multi-agent system is a behavior simulation method, using programs to show individual and their various behaviors. Each independent individual represents an agent, and the synergistic action between multiple agents becomes the common behavior of multiple agents. According to the different attribute characteristics of agents and agent theory, the dynamic library model is created. The intelligent agent and environment are selected for simulation. The modeling process, software, and parameters of the multi-agent model are as follows:
1.
Evacuation simulation modeling process
Long-distance gas pipelines and geospatial data were constructed by ArcGIS.AnyLogic was used to simulate evacuation process to reveal the interaction between spatial layout and evacuation (Tang et al. 2021; Wang et al. 2021). The evacuation simulation modeling process is as follows: (1) Geographic space GIS data (SHP file) along gas pipelines is converted into DXF file, and imported into the “demonstration panel” in AnyLogic to build the physical simulation environment along gas pipelines. (2) The simulation environment is constrained, and parameters such as attributes and number of evacuees are set in AnyLogic. (3) General and set variables are set, and logical relationships between different variables are established. Road traffic library in AnyLogic is used to perfect or modify evacuation roads. (4) The evacuation logic between evacuees and building space is established in AnyLogic. (5) Run and output the simulation results.
2.
Behavior rules and personnel characteristics
Evacuation rules and basic assumptions were set: (1) evacuees choose the shortest path for evacuation; (2) personnel were conscious and could clearly judge escape route during evacuation; there were no return, no stay, no regression, and no wait-and-see during evacuation; (3) there were no obstacles in evacuation roads, and the road was unimpeded; and (4) the evacuation process was carried out on foot.
The initial evacuation speed was set as 0.8 m/s for the elderly, 1.5 m/s for adults, and 0.7 m/s for children. The pedestrian body width was set as 0.4 m for the elderly, 0.5 m for adults, and 0.2 m for children (Chen and Zhan 2014). The gender ratio was 1:1. The ratio of old people to adults to children is 0.2:0.65:0.15.
3.
Prediction and analysis of evacuees
The number of evacuees is estimated according to building area. According to the code (MOHURD 2018), the per capita residential land area of different buildings can be determined. The number of evacuees can be calculated using eqs. 2 and 3.where P is the number of people who need to be evacuated. Pi is the number of evacuees inside the ith building (i = 1, 2, 3, …, n). Si refers to the floor area of the ith building (m2). Ni refers to the number of floors of the ith building. Ai refers to the area per capita of the ith building (m2/person).
(2)
(3)
2.5. Optimization model of evacuation strategies
When or after an emergency occurs, community residents can evacuate quickly under the guidance of the neighborhood committee or volunteers. The evacuation mode is called organized evacuation (Filippidis et al. 2021). Considering the spatial distribution of the exits in community and residential buildings, the responsibility relationship between community buildings and community exits was determined based on maximizing the satisfaction of evacuation time.
Ei (i = 1, 2,…, m) is the set of residential buildings. Sj (j = 1, 2,…, n) is the evacuation exit set of the community. p is the total number of candidate evacuation exits (p ≤ n). αi is the time satisfaction level of residential building Ei. ωi is the number of evacuated residents of residential building Ei. Li is the maximum distance of residential building Ei when the time satisfaction is 1. Ui is the minimum distance of residential building Ei when the time satisfaction is 0. tij is the time for evacuation exits Sj to residential buildings Ei. Cj is the preference degree of evacuation guider to evacuation exit Sj under the influence of sudden disasters. If the exit is chosen, then xj = 1; otherwise, xj = 0. If F(tij) ≥ αi, then yij = 1; otherwise, yij = 0. fm(tij) is the satisfaction function of evacuation time from residential building Ei to evacuation exit Sj:
(4)
Based on the maximum coverage site selection model and the idea of “partial coverage” (Wang et al. 2014), the coverage model of residents’ satisfaction with evacuation time was established:where the objective function z represented that when the residential buildings in the covered community were most satisfied with the evacuation time, the number of evacuees covered was the largest. Equation 6 indicated that when the satisfaction degree of evacuation time was αi, all the buildings could be covered by the evacuation exits. Equation 7 indicated that the number of evacuation exits was p. Equation 8 represented that xij and yij were integer variables of 0 or 1. If F(tij) = 1, αi = 1, (1 ≤ i ≤ m, 1 ≤ j ≤ n), and the preference degree of guiders to exits is not considered, then residential buildings were completely covered by evacuation exits. Here, the genetic particle swarm optimization algorithm (GA-PSO) is used to solve the objective function, and the algorithm steps are detailed in the literature (Wang et al. 2014).
(5)
(6)
(7)
(8)
3. Results and discussion
3.1. Analysis of accident impact radius
The simulated affected areas of different accidents were shown in Fig. 2. The impact radii of death zone, severe injured zone, and minor injury zone in jet fire were 13.3, 17.6, and 44.3 m respectively. The radii of death zone, severe injured zone, and minor injury zone in gas explosion were 67.5, 84.8, and 118 m, respectively. Gas cloud combustion within a radius of about 104 m could cause death, and that within a radius of about 278 m could cause burns. Hence, the evacuation radii of jet fire and gas cloud explosion were calculated as 48.7 and 127.3 m. So, communities A and C should be evacuated. In addition, gas leakage accidents were assumed to occur randomly along the pipeline. So, the impact range of leakage accidents was revealed based on GIS in Fig. 3.
Fig. 2.

Fig. 3.

Some buildings in the communities were affected by the leakage accidents. Communities A and C all required evacuations. According to building attributes and per capita floor area, the number of evacuees in communities A and C were calculated as 1093 and 9568 people. The number ratio of the elders to adults to child was 0.2:0.65:0.15.
3.2. Simulation analysis of unorganized evacuation
The layout of community buildings was shown in Fig. 4. The proportional scale of the actual length was set in combination with the layout of community buildings, and the software’s own drawing tools (walls, text annotations, paths, etc.) were used to visualize community building facilities and shelters. According to the code (MOHURD 2015), the capacity of emergency shelters can be calculated.
1.
Community A
Figure 5 showed the evacuation status of Community A at different times. At 2 min after evacuation began, the residents began to evacuate from buildings. At 5 min after evacuation began, road congestion began to appear mostly at intersections (black circles in Fig. 5b), and Exit AG2 also began to jam. In the evacuation process, the density of people gradually increased, and the congestion of main road continued to intensify. Because Exit AG2 was closest to the shelter, most residents chose the exit for evacuation, resulting in a large area of congestion at the exit and main roads connected to it. At 10 min after evacuation began, the main road inside the community and Exit AG2 were no longer congested, and most of the residents had already come out of the community to municipal roads for going to the shelter. Congestion on roads and exits in communities was concentrated between 5 and 10 min after evacuation began.
The average value of 20 numerical simulations represented the evacuation time of Community A. The simulated evacuation time ranged from 35.09 to 37.99 min, and their average value was 36.5 min, as shown in Figs. 6. Figure 7 showed population changes from communities to shelters. Residents did not arrive at the shelter until 10 min after the evacuation began and then it showed an S-shaped growth trend. The number of community residents who chose Exit AG2 to evacuate was 6455 persons, and it took them 18.68 min to complete evacuation. The number of people who chose Exit AG3 was 76 persons, and it took them 4.85 min to complete the evacuation. But no one chose Exit AG1 to evacuate.
2.
Community C
Evacuation status of residents at different times was shown in Fig. 8. At 2 min after evacuation began, residents began to escape from buildings and chose exits nearest to the shelter for evacuation. At 5 min, road congestions began to appear and mostly at intersections (black circles in Fig. 8). Community residents appeared congested when passing through obstacles. At 10 min, the road congestion in the community had been alleviated. Congestion at Exit CG1 and Exit CG3 has continued. At this time, some residents have already arrived at the shelter. At 15 min, all residents had fled from the buildings. The congestion at Exit CG3 ended. But Exit CG1 and its connected main roads congestion increased. Most residents have come out of their communities to seek shelter, and the city’s municipal roads were clogged. At 20 min, most roads in the community were free of congestion. The congestion on the roads connected with Exit CG1 was greatly reduced. At 25 min, the roads inside the community had no congestion. There was only slight congestion at Exit CG1. Most residents reached the shelter, and congestion at municipal roads has disappeared. It can be seen that congestion mainly occurred between 5 and 15 min.
The average evacuation time was 38.18 min, as shown in Figs. 9. Figure 10 showed population changes from communities to shelters. Residents did not arrive at the shelter until about 5 min after the evacuation began and then it showed an S-shaped growth trend. Figure 11 showed the number of people evacuating from different exits in the community. The number of people who chose Exit CG1 to evacuate was 8518 persons. It took them 18.35 min to reach the shelter. The number of people who chose Exit CG3 to evacuate was 1050 persons. It took them 7 min to reach the shelter. No one chose Exit CG2 for evacuation. This reflected the imbalance of evacuation, resulting in low efficiency of evacuation.
Fig. 4.
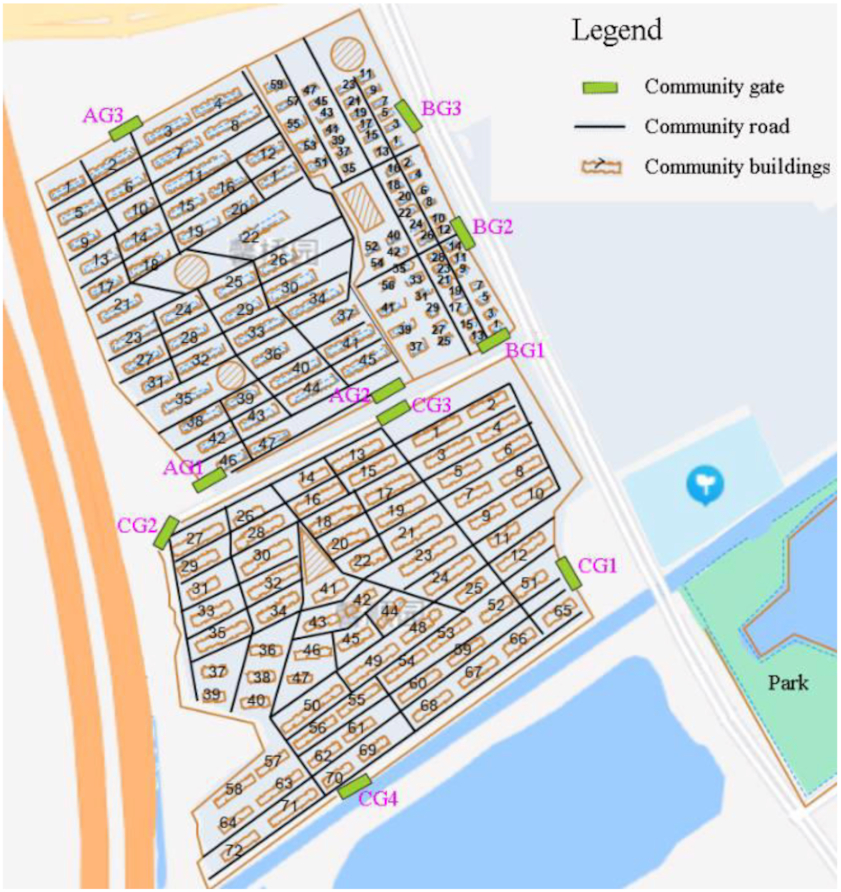
Fig. 5.
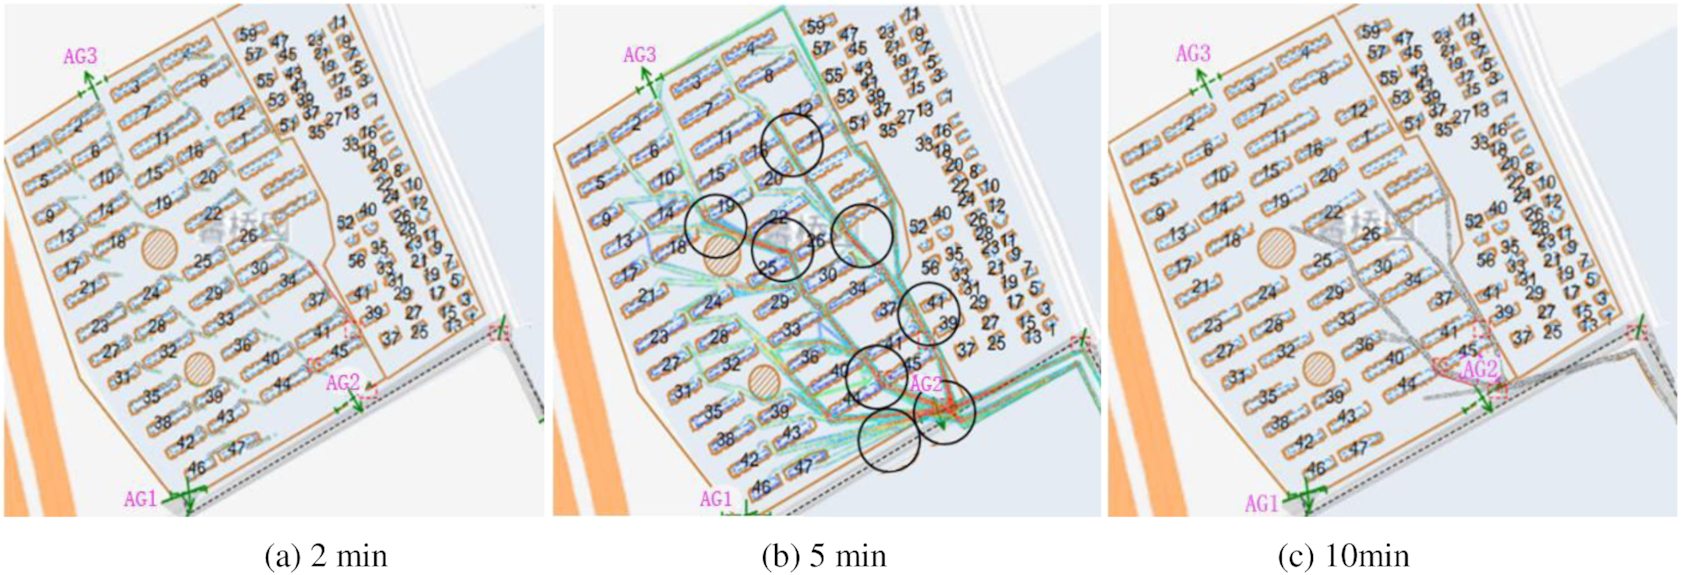
Fig. 6.
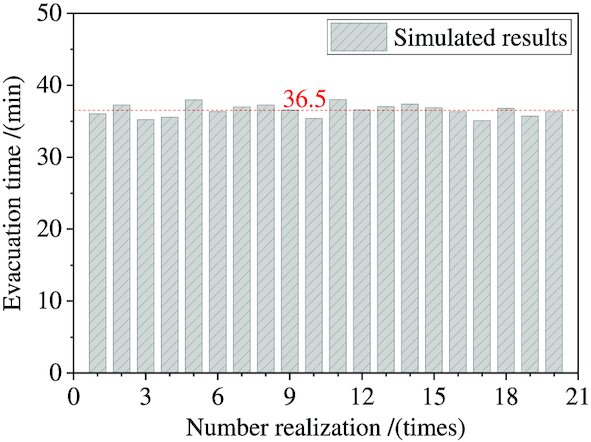
Fig. 7.
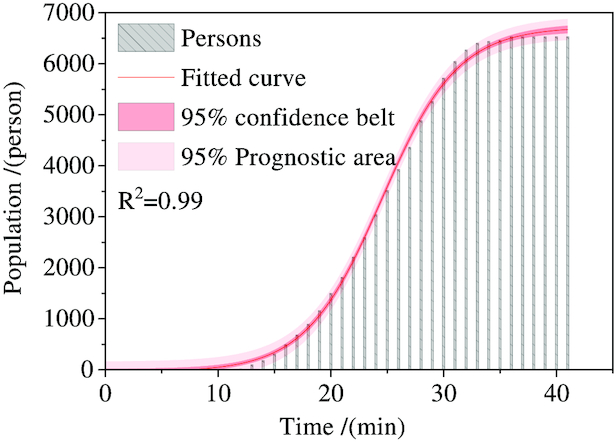
Fig. 8.

Fig. 9.
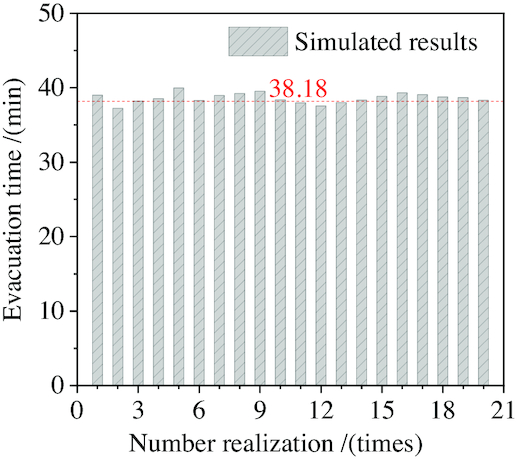
Fig. 10.

Fig. 11.

3.3. Optimization analysis of organized evacuation
3.3.1. Community evacuation space division
According to the Section 2.5, the GA-PSO was used to solve the evacuation optimization model. The results were listed in Table 4. With the increase of time satisfaction level αi, the maximum number of people covered by the exits decreased, and the number of buildings covered also gradually decreased. The evacuation exits responsible for the buildings and the number of evacuees were sorted out. The results were shown in Figs. 12 and 13.
Fig. 12.
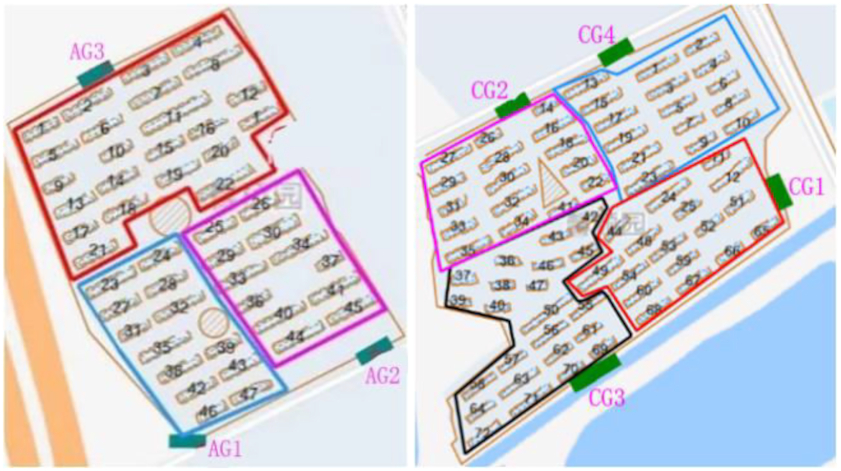
Fig. 13.

Table 4.
| Items | p | Li | Ui | αi | z | Uncovered community buildings Ei |
|---|---|---|---|---|---|---|
| Community A | 3 | 200 | 500 | [0.1–0.4] | 6531 | Full coverage |
| 3 | 200 | 500 | 0.5 | 6256 | 1#, 23# | |
| 3 | 200 | 500 | 0.6 | 5903 | 1#, 21#, 23#, 26#, 31# | |
| 3 | 200 | 500 | 0.7 | 5592 | 1#, 21‒23#, 26#, 27#, 31# | |
| 3 | 200 | 500 | 0.8 | 5284 | 1#, 21‒23#, 26#, 27#, 30#, 31# | |
| 3 | 200 | 500 | 0.9 | 4822 | 1#, 9#, 17#, 20‒24#, 26#, 27#, 29–31# | |
| 3 | 200 | 500 | 1.0 | 3690 | 1#, 9#, 12#, 13#, 17#, 20‒34#, 38# | |
| Community C | 4 | 200 | 500 | [0.1–0.6] | 9568 | Full coverage |
| 4 | 200 | 500 | 0.7 | 9427 | 39#, 40# | |
| 4 | 200 | 500 | 0.8 | 8991 | 37#, 39#, 40#, 58#, 64#, 72# | |
| 4 | 200 | 500 | 0.9 | 8820 | 37‒40#, 57#, 58#, 64#, 72# | |
| 4 | 200 | 500 | 1.0 | 7312 | 21#, 24#, 35‒40#, 43#, 44#, 47#, 48#, 50#, 57#, 58#, 64#, 71#, 72# |
Note: # = building number
The community was divided into multiple blocks, in which the residents in buildings were evacuated from the designated exits. In Community A, residents in blue-circled, purple-circled, and red-circled areas went to Exits AG1, AG2, and AG3 to evacuate, respectively. In Community C, residents in the red-circled, purple-circled, blue-circled, and black-circled areas went to Exits CG1, CG2, CG3, and CG3 to evacuate, respectively. The number of people evacuating through each exits in the community was more balanced.
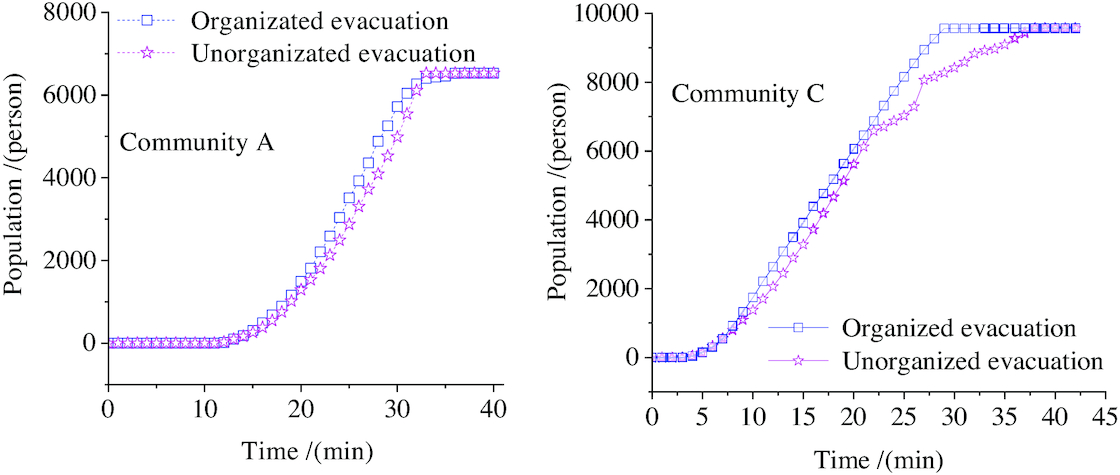
Organized evacuation and unorganized evacuation were simulated, and the total evacuation time was shown in Fig. 14. In Community A, the total times of unorganized evacuation and organized evacuation were 36.5 and 33 min, with a difference of 3.5 min. The total times of unorganized evacuation and organized evacuation in community C were 38.18 and 29 min, with a difference of 9.18 min. Hence, community evacuation organized by evacuation guiders is more efficient than that without guiders. Figure 15 showed the growth trend of evacuees arriving at shelters. In the case of organized evacuation, the growth rate of the number of people arriving at shelters was higher than that of unorganized evacuation. It showed that organized evacuation can reduce the congestion on community roads or exits and improve the evacuation efficiency.
Fig. 14.
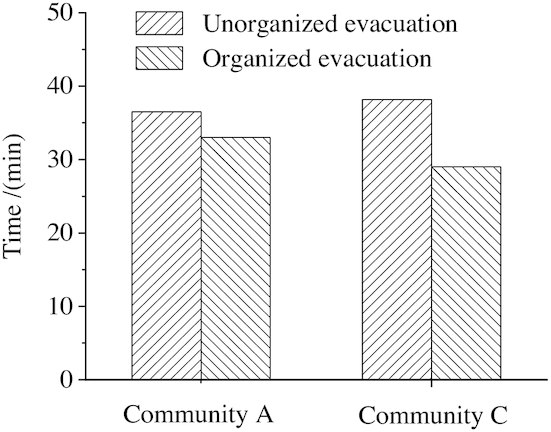
Fig. 15.
3.3.2. Strategies for improving evacuation efficiency
According to the thermal map of evacuation, the signage system of guiding residents was added (red circles), as shown in Fig. 16. The evacuation of key roads in the community was reflected in real time through broadcasting, and residents were guided to judge the congestions on the road in front reasonably and change evacuation routes in time. Moreover, debris and garbage piled on public roads were cleaned up to improve the effective width of evacuation roads. Signs such as “no parking zone for vehicles” were set up in the seven easily congested roads in Fig. 17.
Fig. 16.
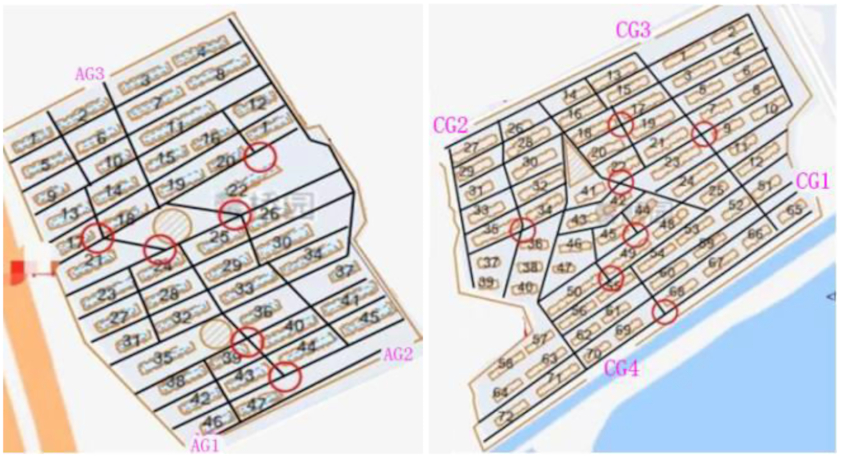
Fig. 17.

4. Conclusions
According to the impact range of leakage accidents, the spatial distribution of people to be evacuated was determined. A post-disaster evacuation model for communities based on multi-agent was established. The spatial optimization method for emergency evacuation in the community was proposed to improve the evacuation efficiency. The main conclusions are as follows:
1.
Combined with damage criteria of leakage consequences and ALOHA, three kinds of accident consequence ranges were calculated. The impact radii of jet flame, gas cloud explosion, and gas cloud combustion were 44.3, 118, and 278 m, respectively. The maximum evacuation radius was 127.3 m. The number of evacuees in communities A and C, which need emergency evacuation, were calculated as 6531 and 9568 people, respectively.
2.
The evacuation time, road congestion, and the choice of evacuation exits were analyzed. The total evacuation times of communities A and C were 36.5 and 38.18 min. There was an imbalanced phenomenon in the selection of evacuation exits by residents. Some evacuation exits were chosen for evacuation, while the utilization rate of some exits was relatively low, or some exits were not even selected. There were different degrees of congestion on the roads inside communities, municipal roads, and at the exits in the process of evacuation.
3.
The responsibility area of organized evacuation service for community exits was determined and its rationality was verified by the comparison of evacuation simulation. The block-based organized evacuation can greatly reduce road congestion and improve evacuation efficiency of the community. The total times of organized evacuation in communities A and C were decreased by 3.5 and 9.18 min. The reduction ratio was 10% and 24%, which indicates that community evacuation organized by guiders is more efficient than that without guiders. The selection of community exits was more balanced.
Acknowledgements
This research was funded by Hebei Natural Science Foundation (Grant No. E2022202119), National Natural Science Funds of China (Grant No. 52278472; 52178487), Tianjin Science and Technology Plan Project (Grant No.19YFZCSN01200) and Key R & D projects in Hebei Province (Grant No. 20375506D).
References
Abdelghany A., Abdelghany K., Mahmassani H., Alhalabi W. 2014. Modeling framework for optimal evacuation of large-scale crowded pedestrian facilities. European Journal of Operational Research, 237(3): 1105–1118.
Bariha N., Mishra I.M., Srivastava V.C. 2016. Hazard analysis of failure of natural gas and petroleum gas pipelines. Journal of Loss Prevention in the Process Industries, 40(3): 217–226.
Chen X., Zhan F.B. 2014. Agent-based modeling and simulation of urban evacuation: relative effectiveness of simultaneous and staged evacuation strategies. Palgrave Macmillan, London.
Chu H., Yu J., Wen J., Yi M., Chen Y. 2022. Emergency evacuation simulation and management optimization in urban residential communities. Sustainability, 11(3): 795.
Deng Y.F., Li Q., Gai W.M. 2014. Simulation of toxic gas leak and analysis of regional evacuation. Journal of Safety Science and Technology. 10(6): 12–19.
Díaz-Parra O., Vera-López E. 2018. Simulation of high consequence areas for gas pipelines. Revista Científica, 31(1): 32–44.
Ding X.B. 2022. Simulation research on alert zones of city gas pipeline leakage based on multi-factor. Fire Science and Technology, 41(1): 76–81.
Filippidis L., Xie H., Galea E.R., Lawrence P.J. 2021. Exploring the potential effectiveness of dynamic and static emergency exit signage in complex spaces through simulation. Fire Safety Journal, 125: 103404.
Gai W.M., Deng Y.F., Jiang Z.A., Li J., Du Y. 2017. Multi-objective evacuation routing optimization for toxic cloud releases. Reliability Engineering and System Safety, 159(1): 58–68.
Guo Z.F., Sheng Y., Wu X. 2019. Study on scenario design and response tasks for leakage and explosion accident of on land crude oil long-distance pipelines. Journal of Safety Science and Technology, 15(11): 90–95.
Han F., Chen F., Zhang S.L., Zhang B., Cai W.J., Liu T. 2017. Influence range of leakage consequence of city high-pressure gas pipeline. Gas & Heat, 37(10): 7–12.
Li J.-J., Zhu H.-Y. 2018. A risk-based model of evacuation route optimization under fire. Procedia Engineering, 211(1): 365–371.
Liang X., Liang W., Zhang L., Guo X. 2019. Risk assessment for long-distance gas pipelines in coal mine gobs based on structure entropy weight method and multi-step backward cloud transformation algorithm based on sampling with replacement.Journal of Cleaner Production, 227: 218–228.
Liu H.Q. 2013. The risk evaluation and the research of emergency response mechanism of long distance oil and gas pipeline accident. China University of Petroleum, Qingdao, China.
Liu Y.D. 2020. Study on the seismic damage of regional building and dynamic evacuation simulation based on shortest path. Harbin Institute of Technology, Harbin.
Ma Q.C., Zhang B. 2016. Numerical simulation of fire & explosion—affected areas caused by the urban natural gas pipeline leakage based on ALOHA. Safety and Environmental Engineering, 23(2): 75–79.
Ministry of Housing and Urban–Rural Development of the People’s Republic of China (MOHURD). 2015. Code for design of disasters mitigation emergency congregate shelter. GB51143–GB52015.
Ministry of Housing and Urban–Rural Development of the People’s Republic of China (MOHURD). 2018. Urban residential district planning and design standard. GB50180–GB52018.
Mishra K.B., Wehrstedt K.-D. 2015. Underground gas pipeline explosion and fire: CFD based assessment of foreseeability. Journal of Natural Gas Science and Engineering, 24, 526–542.
Song W.C., Shuai B., Zhong P.Y. 2015. Evacuation scope study of hazardous materials transportation accidents in case of terrorist attacks. Anquan Yu Huanjing Xuebao, 15(1): 176–182.
Sovacool B.K., Andersen R., Sorensen S., Sorensen K., Tienda V., Vainorius A., et al. 2016. Balancing safety with sustainability: assessing the risk of accidents for modern low-carbon energy systems. Journal of Cleaner Prodution, 112: 3592–3965.
State Administration of Work Safety (SAWS). 2013. Guidelines for quantitative risk assessment of chemical enterprises. AQ/T. 3046–2013.
Tang J., Hu Y.L., Wang Y.H. 2021. Research on evacuation guidance strategy in large space buildings based on AnyLogic. Fire Science and Technology, 40(11): 1594–1598.
Terzioglu L., Iskender H. 2021. Modeling the consequences of gas leakage and explosion fire in liquefied petroleum gas storage tank in Istanbul Technical University, Maslak campus. Process Safety Progress, e12263.
Wang Y.Y. 2020. Optimal strategy research on safety evacuation of urban residential area in Northeast China. Harbin Institute of Technology, Harbin, China.
Wang W., Su J.Y., Ma D.H., Guo X.D., Wang Z.T. 2014. Urban emergency shelter locations for earthquake disaster using time-satisfaction-based maximal covering location model. Natural Science ed. Journal of Shanghai Jiaotong University (English Edition), 48(1): 154–159.
Wang W., Xia C., Liu C., Wang Z. 2020. Study of double combination evaluation of urban comprehensive disaster risk. Natural Hazards, 104(8): 1181–1209.
Wang Y.X., Wang L., Zheng Z.L. 2021. Under the principles of cluster evacuation model based on Anylogic stadium emergency evacuation simulation application. Journal of Research in Science and Engineering, 3(11): 125–128.
Wei J., Yang J.W., Xiu L.Q. 2021. Study on emergency evacuation spacing of long distance natural gas pipeline accidents. China Petroleum and Chemical Standards and Quality, 41(22): 7–8.
Whanda S., Sani Y., Bulus G. 2015. Modelling of potential pipeline impact radius and high consequence area in a wetland sub-region of Nigeria. Journal of Geographic Information System, 7: 692–709.
Yang G.Z. 2018. Study on evacuation radius of leakage accident of high pressure gas pipeline. Urban Gas. pp. 21–26.
Yu D.M., Feng C.G., Zeng Q.X., 1995. The damage of explosions and the division of their injury regions. Zhongguo Anquan Kexue Xuebao, 5: 13–17.
Zhang N., Ni X.Y., Huang H., Duarte M. 2017. Risk-based personal emergency response plan under hazardous gas leakage: optimal information dissemination and regional evacuation in metropolises. Physica A, 473: 237–250.
Zhang X.W., Yu A.R., Zhang P.H. 2019. Decision-making optimization of emergency evacuation in accident of urban oil and gas pipeline. Journal of Safety Science and Technology, 15(12): 143–149.
Information & Authors
Information
Published In

FACETS
Volume 8 • January 2023
Pages: 1 - 11
Editor: Nicholas Vlachopoulos
History
Received: 31 October 2022
Accepted: 5 July 2023
Version of record online: 14 September 2023
Copyright
© 2023 The Author(s). This work is licensed under a Creative Commons Attribution 4.0 International License (CC BY 4.0), which permits unrestricted use, distribution, and reproduction in any medium, provided the original author(s) and source are credited.
Data Availability Statement
Data generated or analyzed during this study are available from the corresponding author upon request.
Key Words
Sections
Subjects
Plain Language Summary
Simulation-based method for emergency evacuation induced by a gas leak
Authors
Author Contributions
Conceptualization: LW, CL
Data curation: GL
Funding acquisition: CL
Investigation: CL, XG
Methodology: LW, CL, XG
Software: XC, CL, XG, GL, XL
Writing – original draft: LW, XC, CL, GL, XL
Writing – review & editing: LW, XC, CL, GL, XL
Competing Interests
The authors declare that they have no known competing financial interests or personal relationships that could have appeared to influence the work reported in this paper.
Metrics & Citations
Metrics
Other Metrics
Citations
Cite As
Ling Wang, Xuejiao Chen, Chaofeng Liu, Xingxing Guo, Gang Li, and Xiaoran Liu. 2023. A simulation-based optimization method for emergency evacuation induced by gas pipeline leakage risk. FACETS.
8(): 1-11. https://doi.org/10.1139/facets-2022-0229
Export Citations
If you have the appropriate software installed, you can download article citation data to the citation manager of your choice. Simply select your manager software from the list below and click Download.
There are no citations for this item