Open access

Strength and competitiveness are more strongly predictive of retrospective sport participation than 2D:4D in university-aged women

Publication: FACETS
9 September 2019

Abstract

Objective: Females continue to participate in sport at lower rates than males. Girls who participate in sport gain many advantages. Even with programs designed to emphasize participation, some females continue with sport participation while others do not. Given the advantages and controversies surrounding testosterone and female sport, it is possible that testosterone may predispose females toward sport participation. Our objective was to determine if the second to fourth digit (2D:4D) ratio, a proxy for prenatal androgen exposure, correlates with sport participation throughout female adolescence and young adulthood. Methods: A cross-sectional analysis of indirect prenatal androgen exposure (i.e., 2D:4D) was completed on 18–30-year-old women (n = 92) using demographics, anthropometrics, sport-specific behaviour tendencies, and retrospective sport participation. Results: 2D:4D was not significantly correlated with total sport participation (TSP) (r = −0.065, p = 0.538). Secondary analyses revealed significant correlations between TSP and maximum hand grip (r = 0.406, p = 0.000) and the Sport Orientation Questionnaire (SOQcomp (r = 0.513475, p = 0.000), SOQgoal (r = 0.253, p = 0.015), SOQwin (r = 0.366, p = 0.000)). Conclusion: Although strength and competitiveness are strongly correlated with female sport participation, the impact of prenatal androgen exposure (i.e., 2D:4D) remains to be determined given its weak and negative association with female sport participation. Given that females participate in sport at lower rates than males, continuing to determine what factors influence sport participation is an important goal.

Introduction

Lifetime sport and physical activity participation provide many physiological and sociological benefits; consequently, understanding this behaviour is important to the health and well-being of women and girls. However, there is a discrepancy between leisure time physical activity (LTPA) and sport participation rates of males and females worldwide. As a population, North Americans do not meet the guidelines of daily recommended activity in both sexes, but males are more likely to participate in LTPA, including sport participation, than females (Stephens et al. 1985). Moreover, while there is a general decline in physical activity and sport participation starting in the early teens, the largest drop in participation rates occur between the mid to late teens for females. This drop in participation could be due to many factors including, but not limited to, intrapersonal (i.e., stress (Crane and Temple 2015)), economical (i.e., low familial social economic status (Walters et al. 2009)), or environmental (i.e., proximity of facilities (White and McTeer 2012)) factors. Generally, the implementation of programs to overcome barriers are promising, but not completely effective. Youth sport participation in Canada (both male and female) has been fairly consistent over the past decade with approximately 75% (81% of boys versus 70% girls) of youth aged 5–17 years participating in sport at some point (Canadian Heritage 2013), a sex difference that is even greater in other parts of the world.
A primary difference in development between males and females is the exposure to prenatal and pubertal androgens. These androgens may impact various traits beneficial to sport performance such as: increased skeletal muscle mass (Yu et al. 2014), a major determinant of strength and power; regulation of erythropoiesis (Beggs et al. 2014), thereby increasing the oxygen carrying capacity of blood; increased cardiac size (Gray 1918) resulting in a larger stroke volume and cardiac output; and fat loss (Usui et al. 2014), which is highly beneficial in most sport settings. Further, the second to fourth digit (2D:4D) ratio, a proxy for prenatal androgen exposure (Manning et al. 2002) and circulating testosterone, has been correlated with competitiveness and aggressiveness (Book et al. 2001; Coyne et al. 2007), which may predispose individuals to success in sporting contexts. This success in sport may subsequently lead to an increase in physical practice, extrinsic motivation (awards, praise, etc. (Vallerand and Losier 1999)), intrinsic motivation (fun, winning, etc. (Vallerand et al. 1987)), and (or) a belief in physical abilities (self-efficacy (McAuley et al. 1991)), that may increase success in sport in a positive feedback cycle.
There are logistical, time, and financial restrictions to performing large-scale studies including the hormonal analyses of androgen status. As an alternative to hormonal analyses, the 2D:4D ratio has been examined as an indirect marker of prenatal androgen exposure within a variety of studies testing its relationship with sport performance (e.g., a cycle sprint test (Crewther et al. 2015)), sporting ability (i.e., highest level achieved of all sports played from 11 years old (Paul et al. 2006)) and sport-related psychological variables (i.e., mental toughness, optimism, goal orientations, aggression, and coping style (Golby and Meggs 2011)). Although studies have indicated that prenatal testosterone can influence sport interest (Giuliano et al. 2000; Manning et al. 2002) as well as participation in competitive sport (Hönekopp and Schuster 2010), to our knowledge, no studies have directly addressed androgens as a potential influence on recreational and competitive sport participation.
Exogenous anabolic androgen administration is one of the biggest doping concerns for male and female athletic competitions because of the effectiveness of these hormones in enhancing sport performance (Sjöqvist et al. 2008); however, the extent to which androgens impact sport participation remain unclear. Combined with the potential sport-related benefits of androgens on performance, we predicted that 2D:4D would correlate with female sport participation through adolescence (9–18 years) and young adulthood. It was hypothesized that early exposure to androgens, as inferred from a lower 2D:4D, would predispose girls toward sport participation.

Materials and methods

Cross-sectional analyses of indirect prenatal androgen concentrations using 2D:4D were obtained from a sample of 92 females (18–30 years) recruited from the University of Windsor, Windsor, Ontario, and the Windsor-Essex community. Participant demographic, anthropometric, sport-specific behaviour tendencies, and retrospective sport participation information were collected. All procedures were cleared by the Research Ethics Board at the University of Windsor and consent was obtained from all participants prior to undertaking any of the methods described below.

Sport participation score

Participants were asked to recall all of the sports in which they had participated between the ages of 9–18 years. Sport participation for each year was defined by four components including: (a) number of sports played, (b) highest level of achievement in any/all sports, (c) frequency of participation per week (hours), and (d) number of months of the year in which the sport season(s) took place.
Bivariate Pearson correlations were performed between the four components of sport participation defined above (i.e., a–d). Results of these correlations ranged from r = 0.296 to r = 0.631, which indicated that the four components could be combined to produce a single composite sport participation score. Internal consistency of the measures including all ages was evaluated using Cronbach’s α and was found to be excellent (α = 0.97), further supporting the generation of a composite score. The four sport participation component scores were transformed into z-scores so they would all be equally weighted within the composite sport participation score. The composite sport participation score was created through the summation of individual z-scores for the correlated variables a–d, of the sport participation questionnaire. However, to generate a participation score without negative values, each individual’s z-score sum was added to the absolute minimum z-score sum in the sample to give a transformed yearly sport participation score for a given individual (tSPi). A total sport participation (TSP9to18) in youth was initially determined as the sum of tSPi scores across and inclusive of the ages 9–18 years.
The pattern of TSP9to18 (Fig. 1) revealed an inverted U-shaped curve suggesting a peak of TSP around 13 years (confirmed by repeated measures ANOVA with the independent repeated variable of age where 13 years TSP was greater than at all other ages (p < 0.05)). This peak in sport participation around 13 years is consistent with current literature (Canadian Heritage 2013; Zarrett et al. 2018). Consequently, TSP was divided into two scores that encompassed sport participation across two equal age ranges: 9–13 years (TSPearly), and 14–18 years (TSPlate).
Fig. 1.
Fig. 1. Age versus average sport participation. Sport participation, expressed as arbitrary units (AU), for each year is the sample mean of transformed yearly sport participation score for a given individual of the number of sports played in each year, number of months playing sports in each year, highest sport level attained in each year, and the weekly frequency of sport participation in hours for each participant. Points represent mean scores across that age ± SD, n = 92. A one-way repeated measures ANOVA revealed a significant main effect for age. Posthoc analysis revealed several differences between ages; however, for clarity, significance is only shown at 13 years which was the only age observed to significantly differ from all other ages (*, p < 0.05).
Given that one individual indicated that she had not participated in sport across the retrospective timeline, all sport participation scores were truly 0 bounded at the lower end.
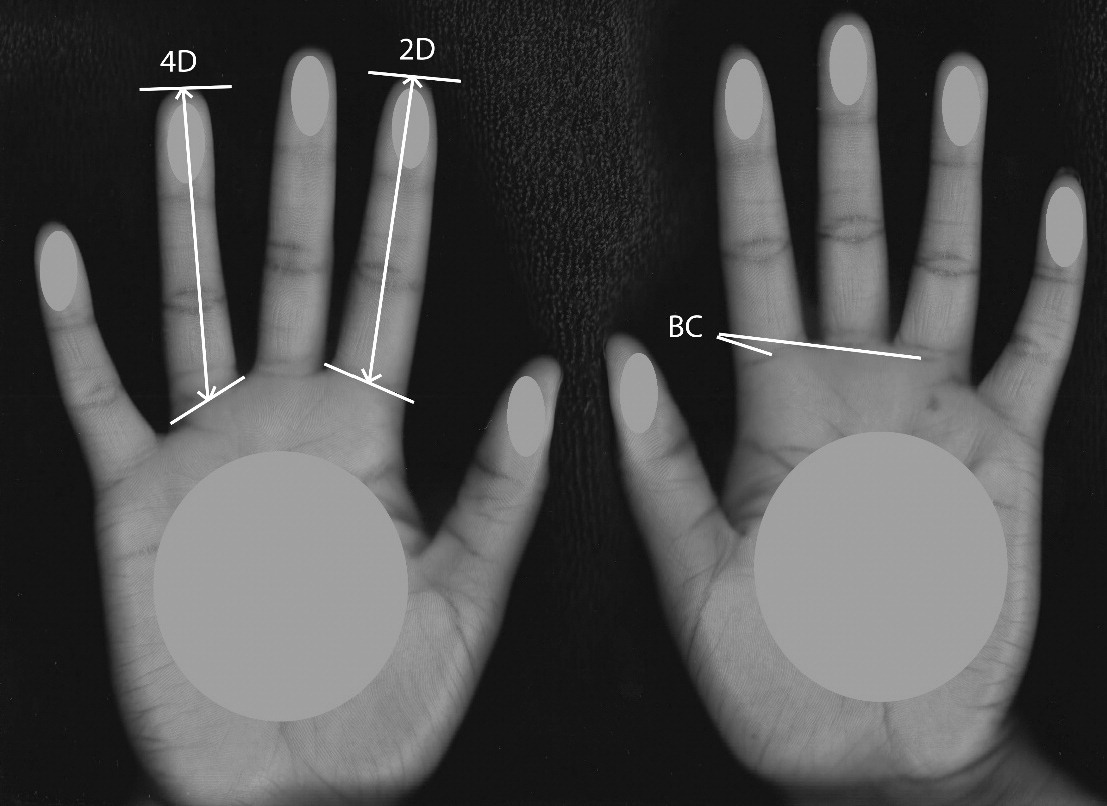
2 D:4D ratio

The 2D:4D was measured as an indicator of prenatal androgens (Lutchmaya et al. 2004). 2D:4D data were collected using a flatbed scanner (Canon, USA CanoScan LiDE 110). Participants were asked to remove all rings and jewelry prior to their scan. Subsequently, a black towel was placed over their hands to increase the contrast of the final colour scan at a resolution of 2400 dpi.
Three individual raters independently determined the 2D:4D of every participant using Image J (https://imagej.nih.gov/ij/, Research Services Branch of the National Institute of Mental Health). As sex differences in 2D:4D are more pronounced for the right than the left hand, only the average right 2D:4D was used for subsequent analyses (Manning 2002). Scanned images were set to an eight-bit grayscale image type (Fig. 2). Second and fourth digit lengths were determined using the line and measure function on Image J. Landmarks for each finger consisted of the distal center apex of the finger and the middle of the basal proximal crease of the finger. A mean of the three raters’ data for the right hand was used for statistical analysis. An intraclass correlation coefficient (ICC) two-way mixed-effects model with absolute-agreement definition was used to determine intra-rater reliability. This test was performed a minimum of two weeks after the final analysis on three random hands and were all found to be above 0.930. An ICC two-way mixed-effects model with absolute-agreement definition was used to asses inter-rater reliability (average measures ICC = 0.917, confidence interval (CI) 0.878–0.944, p = 0.000) (Bescos et al. 2009).
Fig. 2.
Fig. 2. Representative hand scan image. Second digit (2D) and fourth digit (4D) finger lengths were determined using the line and measure function on the Image J program. Landmarks for each finger consisted of the distal, center apex of each finger (upper white lines). BC, basal crease.

Physical testing

Subsequent to anthropometric measurements of height and weight, muscular power was assessed using a hand dynamometer (Cardio Grip IBX H-101, Zona Health, Boise, ID, USA). While standing, participants were asked to grip the dynamometer with their nondominant hand and index finger so that the valley between their thumb and pointer finger was directly centered over the force gauge, with their other fingers wrapped around the device. Participants were asked to stand with their hands at their sides, arms not touching their body, and were instructed to perform a maximal voluntary contraction for 3–5 s in duration. An average of three attempts (2 min rest between attempts) was used for statistical analysis.

The Scale of Children’s Action Tendencies in Sport

The Scale of Children’s Action Tendencies in Sport (SCATS) (Bredemeier et al. 1987), was used to measure self-reported aggression tendencies in a sport specific context. The SCATS has two subscales including physical and nonphysical aggression. Scoring of the SCATS involved the summation of the number of times the aggressive responses were chosen. On this version, physical aggression scores ranged from 0 to 12, and nonphysical aggression scores from 1 to 8. The SCATS has been proven both valid and reliable (Bredemeier et al. 1987). The internal consistency reliability of the SCATS as a whole is 0.85 (Bredemeier et al. 1987).

The Sport Orientation Questionnaire

The Sport Orientation Questionnaire (SOQ) measured competitiveness in a sport-specific context. The SOQ contains 25 items measured on a 5-point Likert scale with 1 being “Strongly Agree” and 5 being “Strongly Disagree”. The SOQ includes three subscales: competitiveness (SOQcomp; 13 items), win orientation (SOQwin; six items) and goal orientation (SOQgoal; six items), which are separate but related factors. The internal consistency and reliability of the subscales have been shown to be good (Gill and Deeter 1988).

Statistical analyses

All statistical analyses were performed using IBM SPSS Statistics (version 24; Armonk, NY: IBM Corp) with statistical significance set at an α of 0.05. One participant did not have a hand scan completed to analyze 2D:4D and was consequently excluded from all analyses where 2D:4D was included. The number of participants (n) was reported for each analysis.
Bivariate Pearson correlations were completed between 2D:4D and other measured variables. Subsequent bivariate Pearson correlations were computed between 2D:4D and each dependent variable (i.e., sport participation in each of its three dimensions, TSP9to18, TSPearly, and TSPlate).
Subsequent to the initial correlations, bivariate Pearson correlations were performed on continuous supplemental data, including alternate physiological (maximum hand grip (HGmax), body mass index (BMI), age of first menarche, and birth month) and psychological (SOQ and SCATS) independent variables (IVs) with the main outcome variables of TSP9to18, TSPearly, and TSPlate. All IVs found to be significantly correlated with the outcome variables were included in an enter-method multiple linear regression analysis. Further, the following potential social confounding variables were dummy coded into the following dichotomous (0, 1) variables: use of birth control (none = 0), presence of older brothers (none = 0), ethnicity (Caucasian = 0), and mother’s highest education level (above high school = 0). Data are presented as means and standard deviations unless otherwise reported.

Results

Anthropometric and demographic data of the participants are outlined in Table 1. All participants had, or were in the completion of, a postsecondary education. Only one participant indicated that she had not participated in sport in any year in the retrospective timeline. Descriptive statistics for the main variables are displayed in Table 2.
Table 1.
Table 1. Anthropometric and demographic data of participants.
Anthropometric data 
Age22.06 ± 2.56
BMI (kg/m2)24.40 ± 4.56
Height (cm)168.29 ± 6.93
Weight (kg)66.94 ± 11.54
Ethnicity (%)
Caucasian75.56
Southeast Asian1.11
South Asian3.33
Latin American1.11
Filipino5.56
Chinese1.11
Black6.67
Arab/West Asian2.22
Other3.33
University major (%)
Human Kinetics70
Other22
OC use (%)
Currently using OC48
Not using OC44

Note: Anthropometric data are presented as mean ± standard deviation. BMI, body mass index; OC, oral contraceptive.

Table 2.
Table 2. Descriptive statistics for the main variables used in statistical analyses.
 MeanSDMinimumMaximum
Right hand 2D:4D0.9610.2800.891.03
Left hand 2D:4D0.9210.2920.901.04
SOQcomp49.812.016.065.0
SOQgoal25.84.07.030.0
SOQwin21.85.36.029.0
HGmax48.310.925.074.7

Note: Right and left 2D:4D were significantly and positively correlated (Pearson r = 0.919, p = 0.000). SOQ, Sport Orientation Questionnaire (subscales of SOQ: comp, competitiveness; win, win orientation; goal, goal orientation); HG, hand grip.

Bivariate correlations among variables

Mean right 2D:4D was unrelated to BMI, birth month, the SOQ, SCATS, and HG strength. Although the relationship with HG strength was not significant (r = −0.056, p = 0.601), the negative association is in line with predictions on this association. 2D:4D was significantly correlated with age of first menarche (r = 0.225, p = 0.032), suggesting that those females who experienced puberty earlier than their peers also have a lower 2D:4D, although this association would be considered weak (r = 0.225).

Primary analyses

2D:4D was analyzed against the three dimensions of sport participation (i.e., TSP9to18, TSPearly, and TSPlate) using a bivariate Pearson correlation. None of the correlations were significant (Table 3).
Table 3.
Table 3. Significant correlations as a result of secondary analyses, bivariate Pearson correlations.
 2D:4DTSP9to18TSPearlyTSPlate
r95% CIpr95% CIpr95% CIpr95% CIp
SOQcomp−0.076−0.284 to 0.1340.4750.5130.333 to 0.6930.0000.3800.187 to 0.5740.0000.6020.435 to 0.7700.000
SOQgoal0.010−0.200 to 0.2190.9250.2530.050 to 0.4550.0150.196−0.010 to 0.4010.0620.2860.085 to 0.4860.006
SOQwin−0.084−0.294 to 0.1260.4280.3660.171 to 0.5610.0000.3010.101 to 0.5010.0040.3900.197 to 0.5830.000
HGmax−0.056−0.264 to 0.1540.6010.4060.215 to 0.5980.0000.2720.070 to 0.4730.0090.5180.339 to 0.6970.000
2D:4D−0.065−0.277 to 0.1460.538−0.047−0.258 to 0.1640.659−0.079−0.290 to 0.1310.456

Note: TSP, total sport participation; SOQ, Sport Orientation Questionnaire (subscales of SOQ: comp, competitiveness; win, win orientation; goal, goal orientation); HG, hand grip.

Secondary analyses

HGmax, SOQcomp, SOQgoal, and SOQwin were found to be significantly correlated with all three time measures of sport participation: TSP9to18, TSPearly, and TSPlate (Table 3).

Regression analyses

Factors significantly correlated with TSP9to18, TSPearly, and TSPlate were included into a standard enter-method multiple linear regression as predictor variables (i.e., HGmax, SOQcomp, SOQgoal, and SOQwin). 2D:4D was also included given that a regression allows the possibility for a set of variables to have joint predictive capabilities even when individually they may not (Dallal n.d.). It is important to note that with the inclusion of 2D:4D as a variable, the regression analyses would have reached the limits of statistical power for our sample size. As such, interpretation of these findings should be viewed with caution. Potential physiological confounders (i.e., ethnicity and age of first menarche) as well as known sociological confounds (mother’s education level and presence of older brother(s)) were included as control factors into the regression. Results of the initial regression were: TSP9to18 (F[9,81] = 5.306, p = 0.000), TSPearly (F[9,81] = 2.709, p = 0.008), and TSPlate (F[9,81] = 9.083, p = 0.000). After initial regression analyses, due to no change in the relationships with 2D:4D, a backwards multiple linear regression was performed (Table 4). Final and best predictor models were as follows for TSP9to18 (F[4,86] = 11.801, p = 0.000), TSPearly (F[3,87] = 7.834, p = 0.000), and TSPlate (F[3,87] = 24.392, p = 0.000).
Table 4.
Table 4. Initial and final model equations for TSP9to18, TSPearly, and TSPlate.
 Unstandardized coefficientsStandardized coefficientsCollinearity statistics
BSEβtpVIFAIC
TSP9to18 initial model
(Constant)28.81183.6570.3440.731573.298
Older brothers−10.1165.381−0.175−1.8800.0641.120 
SOQgoal−0.9610.788−0.147−1.2190.2261.872 
2D:4D−0.1540.872−0.016−0.1770.8601.076 
Ethnicity−12.2466.065−0.192−2.0190.4701.169 
Mother’s education level−2.8536.783−0.039−0.4210.6751.110 
HGmax0.4810.2500.1991.9220.0581.382 
Age of first menarche−0.7461.623−0.044−0.4600.6471.207 
SOQcomp1.0960.3830.4982.8630.0053.904 
SOQwin0.1390.6970.0280.2000.8422.510 
TSP9to18 final model
(Constant)−11.05411.889−0.9300.355565.656
HGmax0.4410.2400.1831.8350.0701.321 
SOQcomp0.9570.2200.4354.3420.0001.337 
Ethnicity−12.1815.562−0.191−2.1900.0311.017 
Older brothers−9.2845.069−0.161−1.8320.0701.028 
TSPearly initial model
(Constant)23.15957.6620.4020.689505.570
Older brothers−6.3113.710−0.175−1.7010.0931.120 
SOQgoal−0.3210.543−0.079−0.5910.5561.872 
2D:4D−0.0670.601−0.011−0.1120.91110.76 
Ethnicity−8.2894.180−0.209−1.9830.0511.169 
Mother’s education level1.0694.6760.0230.2290.8201.110 
HGmax0.1550.1720.1030.9000.3711.382 
Age of first menarche−0.6881.119−0.066−0.6150.5401.207 
SOQcomp0.4570.2640.3331.7310.0873.904 
SOQwin0.2680.4080.0860.5580.5792.510 
TSPearly final model
(Constant)9.7486.8131.4310.156495.757
SOQcomp0.5400.1320.3944.0800.0001.031 
Ethnicity−7.8053.791−0.197−2.0590.0421.008 
Older brothers−6.5913.470−0.183−1.9000.0611.027 
TSPlate initial model
(Constant)6.66033.9570.1960.845409.200
Older brothers−3.8052.185−0.145−1.7420.0851.120 
SOQgoal−0.6390.320−0.214−1.9990.0491.872 
2D:4D−0.0870.354−0.020−0.2470.8061.076 
Ethnicity−3.9582.462−0.136−1.6080.1121.169 
Mother’s education level−3.9202.753−0.118−1.4240.1581.110 
HGmax0.3260.1020.293.2080.0021.382 
Age of first menarche−0.580.659−0.008−0.0880.9301.207 
SOQcomp0.6390.1550.6374.1130.0003.904 
SOQwin−0.1280.283−0.056−0.4540.6512.510 
TSPlate final model
(Constant)−16.2174.947−3.2780.002405.153
HGmax0.3070.1000.2793.0720.0031.320 
SOQcomp0.4590.0910.4585.0600.0001.309 
Ethnicity−4.5402.312−0.156−1.9630.0531.015 

Note: Dependent variable final predictor models: TSP9to18, F[9,81] = 13.252, p = 0.000; TSPearly, F[9,81] = 7.373, p = 0.000; TSPlate, F[9,81] = 21.512, p = 0.000. TSP, total sport participation; VIF, variance inflation factors; SOQ, Sport Orientation Questionnaire (subscales of SOQ: comp, competitiveness; win, win orientation; goal, goal orientation); HG, hand grip.

A posthoc power analysis was conducted using GPower (Faul et al. 2009). The sample size of 92 was used for the statistical power analyses and the number of predictor variables (pvs) in the final models were TSP9to18 (4 pvs) TSPearly (3 pvs), and TSPlate (3 pvs). The effect sizes used were medium (f 2 = 0.15), and the α level was p < 0.05. Posthoc analyses revealed the statistical power for the three final models to be TSP9to18 (0.842), TSPearly (0.876), and TSPlate (0.876).

Discussion

Our purpose was to determine if 2D:4D was associated with female sport participation throughout adolescence (9–18 years) and to determine whether this indirect measure of prenatal androgen exposure could predict female sport participation in those ages. We predicted that early exposure to androgens, as inferred from 2D:4D, would predispose girls toward sport participation. In fact, this has been shown to some extent in males and females, where lower ratios appear to relate to fitness and level of sport achieved (Sjöqvist et al. 2008; Ranson et al. 2015). 2D:4D was not significantly correlated with TSP9to18 alone (r = −0.065, p = 0.538, CI = −0.277 to 0.146) or when the potential for covariates and confounders were added in regression analyses. However, in examining the 95% CI for this relationship, it is important to note that the majority of the CI were within the negative range as predicated. Nonetheless, whether positive or negative, the CIs suggest moderate to weak associations at best in either direction. From this we can infer that 2D:4D might not play a large role in predisposing girls towards sport participation as predicted. However, given that all but one of our participants participated in sport at some point throughout our age range, we do not have an adequate comparison of 2D:4D against individuals who did not participate in sport. While previous research has found an association between the 2D:4D of elite female fencers (n = 87) and current and highest past rankings (Bescos et al. 2009), the athletes in that study had all achieved world-class ranking in their past, and this association was true only when ethnicity and the rankings were taken into account. Similarly, Paul et al. (2006) analyzed the 2D:4D of 607 females (53.8 ± 8.5 years) who were asked to rate their highest level achieved (on a scale of 1–5, ranging from social participation only to national level) for a total of 12 sports. When adjusted for age, the highest level achieved in any sport was significantly, negatively associated with average 2D:4D (b = −4.93, p = 0.01) (Paul et al. 2006). Participants in the current study were younger (22.32 ± 2.68 years) than those in the study by Paul et al. (2006). Therefore, some of the participants in the current study may not have reached their full athletic potential (i.e., highest level) within the timeframe analyzed (e.g., the average age of female Olympians is in the mid to late 20s (Patel 2012)). Given the above findings, it is possible that the relationship between 2D:4D and sport success might manifest in the differentiation of elite level athletes from recreational athletes and (or) those who do not participate in sport. Nonetheless, one of the central aims of the current study was to determine the relationship between prenatal androgen exposure and sport participation, not simply highest level.
Moreover, Paul et al. (2006) suggested that the performance of childhood athletes may not correlate well with best adult performance due to variability in development. Therefore, it may be more valid to look at adolescent sport participation as a sum, because of ranges in age of development (Paul et al. 2006). In the current study, TSP was divided into TSPearly (9–13 years) and TSPlate (14–18 years). Age of menarche was included as a covariate in regression analyses to determine whether physiological influences may have had a greater impact at later stages or for girls who began development later. In all cases, 2D:4D was not significantly related to sport participation. Traits that would otherwise correlate with sport participation, such as youth fitness, have been shown to correlate with 2D:4D in young boys and girls (Hönekopp et al. 2006); however, that and recent evidence suggests that this effect appears much stronger in boys (Ranson et al. 2015).
One of the strongest correlations found in the current study was the association of TSP9to18, TSPearly, and TSPlate with a marker of upper body strength (i.e., HGmax). Not only was HGmax significantly correlated on its own but, according to structure coefficients, it also contributed 35% and 43.3% to the predicted sport participation score in the regression models for TSP9to18 and TSPlate, respectively. However, it is likely that by participating in sport an athlete is exposed to environments in which strength will increase. Conversely, a person who is stronger initially might do better in a sport, thereby increasing their sport success and subsequent participation. It has been proposed that androgens help to develop grip strength in men and women, although this relation may be subdued in females (Isen et al. 2014). Interestingly, HGmax was removed from the final model in the prediction for TSPearly. This may suggest that strength is a result of sport participation given that TSPlate would have been closer in time to participation in this study. Nonetheless, the relationship between HGmax and sport participation was clear even without a categorization of sport type, which confirms that strength is an important component of all sport participation and achievement (Fink et al. 2006; Ribeiro et al. 2016).
A strong relationship between competitiveness in sport situations (SOQ) and TSP9to18, TSPearly, and TSPlate was found (r = 0.473, p = 0.000, r = 0.362, p = 0.000, and r = 0.545, p = 0.000, respectively), suggesting that the higher a female’s measure of competitiveness, the higher their sport participation score. There are three subscales (i.e., win orientation, goal orientation, and competitiveness) associated with the SOQ and the correlations of the subscales with TSP9to18 were as follows: SOQwin (r = 0.324, p = 0.002), SOQgoal (r = 0.331, p = 0.001), and SOQcomp (r = 0.544, p = 0.000). The original purpose of the SOQ in the current study was to aid in predicting sport participation (i.e., did 2D:4D correlate with competitiveness and consequently, could this explain sport participation?). Much like HGmax, whether competitive girls were drawn toward sport or sport participation, increased competitiveness in sport is still unclear; however, it is important to note that all participants (excluding one) had or currently were participating in sport and exhibited SOQ scores similar to those found in collegiate athletes (Finkenberg et al. 1998).
Taken together, we did not find evidence that prenatal androgen exposure is significantly correlated with female sport participation at young ages. While this is not surprising given the complexities of behaviour that include, but are not limited to, familial and peer influences, socioeconomic status, positive and negative experiences, and chance, the hormonal advantages to sport participation and achievement associated with androgens remain intriguing.

Acknowledgements

We would like to thank the individuals who participated in the study and the undergraduate students at the University of Windsor who volunteered their time to help with data collection and analyses. Lastly, we would like to thank the Centre for Human Performance and Health and Physical Activity and Cardiovascular Research Lab in the Faculty of Human Kinetics in which data collection took place.

References

Beggs LA, Yarrow JF, Conover CF, Meuleman JR, Beck DT, Morrow M, et al. 2014. Testosterone alters iron metabolism and stimulates red blood cell production independently of dihydrotestosterone. American Journal of Physiology Endocrinology and Metabolism, 307(5): E456–E461.
Bescos R, Esteve M, Porta J, Mateu M, Irurtia A, and Voracek M. 2009. Prenatal programming of sporting success: associations of digit ratio (2D:4D), a putative marker for prenatal androgen action, with world rankings in female fencers. Journal of Sports Sciences, 27(6): 625–632.
Book AS, Starzyk KB, and Quinsey VL. 2001. The relationship between testosterone and aggression: a meta-analysis. Aggression and Violent Behavior, 6(1): 579–599.
Bredemeier BJ, Weiss MR, Shields DL, and Cooper BAB. 1987. The relationship between children’s legitimacy judgments and their moral reasoning, aggression tendencies, and sport involvement. Sociology of Sport Journal, 4(1): 48–60.
Canadian Heritage. (2013). Sport participation. 2010. Ottawa, Ontario, Canada. Available at: http://publications.gc.ca/collections/collection_2013/pc-ch/CH24-1-2012-eng.pdf.
Coyne SM, Manning JT, Ringer L, and Bailey L. 2007. Directional asymmetry (right–left differences) in digit ratio (2D:4D) predict indirect aggression in women. Personality and Individual Differences, 43(4): 865–872.
Crane J, and Temple V. 2015. A systematic review of dropout from organized sport among children and youth. European Physical Education Review, 21(1): 114–131.
Crewther B, Cook C, Kilduff L, and Manning J. 2015. Digit ratio (2D:4D) and salivary testosterone, oestradiol and cortisol levels under challenge: evidence for prenatal effects on adult endocrine responses. Early Human Development, 91(8): 451–456.
Dallal GE. n.d. The little handbook of statistical practice [online]. Tufts University, Medford, MA, USA. Available from jerrydallal.com/LHSP/LHSP.HTM.
Faul F, Erdfelder E, Buchner A, and Lang A-G. 2009. Statistical power analyses using G*Power 3.1: tests for correlation and regression analyses. Behavior Research Methods, 41(4): 1149–1160.
Fink B, Thanzami V, Seydel H, and Manning JT. 2006. Digit ratio and hand-grip strength in German and Mizos men: cross-cultural evidence for an organizing effect of prenatal testosterone on strength. American Journal of Human Biology, 18: 776–782.
Finkenberg ME, Moode FM, and DiNucci JM. 1998. Analysis of sport orientation of female collegiate athletes. Perceptual and Motor Skills, 86: 647–650.
Gill DL, and Deeter TE. 1988. Development of the sport orientation questionnaire. Research Quarterly for Exercise and Sport, 59(3): 191–202.
Giuliano TA, Popp KE, and Knight JL. 2000. Footballs versus barbies: childhood play activities as predictors of sport participation by women. Sex Roles, 42: 159–181.
Golby J, and Meggs J. 2011. Exploring the organizational effect of prenatal testosterone upon the sporting brain. Journal of Sports Science and Medicine, 10(3): 445–451.
Gray H. 1918. Gray’s anatomy. 20th edition. Lea & Febiger, Philadelphia, Pennsylvania.
Hönekopp J, and Schuster M. 2010. A meta-analysis on 2D:4D and athletic prowess: substantial relationships but neither hand out-predicts the other. Personality and Individual Differences, 48(1): 4–10.
Hönekopp J, Manning JT, and Müller C. 2006. Digit ratio (2D:4D) and physical fitness in males and females: evidence for effects of prenatal androgens on sexually selected traits. Hormones and Behavior, 49(4): 545–549.
Isen J, McGue M, and Iacono W. 2014. Genetic influences on the development of grip strength in adolescence. American Journal of Physical Anthropology, 154(2): 189–200.
Lutchmaya S, Baron-Cohen S, Raggatt P, Knickmeyer R, and Manning JT. 2004. 2nd to 4th digit ratios, fetal testosterone and estradiol. Early Human Development, 77: 23–28.
Manning JT. 2002. Digit ratio: a pointer to fertility, behaviour, and health. Rutgers University Press, New Brunswick, New Jersey.
Manning JT, Martin S, Trivers RL, and Soler M. 2002. 2nd to 4th digit ratio and offspring sex ratio. Journal of Theoretical Biology, 217: 93–95.
McAuley E, Wraith S, and Duncan TE. 1991. Self-efficacy, perceptions of success, and intrinsic motivation for exercise. Journal of Applied Social Psychology, 21: 139–155.
Patel A. 2012. Olympic athlete ages: what is the ‘peak’ age to be an athlete? The Huffington Post Canada [online]: Available from huffingtonpost.ca/2012/07/25/peak-age-for-athletes_n_1699631.html.
Paul SN, Kato BS, Hunkin JL, Vivekanandan S, and Spector TD. 2006. The big finger: the second to fourth digit ratio is a predictor of sporting ability in women. British Journal of Sports Medicine, 40: 981–983.
Ranson R, Stratton G, and Taylor SR. 2015. Digit ratio (2D:4D) and physical fitness (Eurofit test battery) in school children. Early Human Development, 91(5): 327–331.
Ribeiro E Jr, Neave N, Morais RN, Kilduff L, Taylor SR, Butovskaya M, et al. 2016. Early human development digit ratio (2D:4D), testosterone, cortisol, aggression, personality and hand-grip strength: evidence for prenatal effects on strength. Early Human Development, 100: 21–25.
Sjöqvist F, Garle M, and Rane A. 2008. Use of doping agents, particularly anabolic steroids, in sports and society. The Lancet, 371: 1872–1882.
Stephens T, Jacobs DR, and White CC. 1985. A descriptive epidemiology of leisure-time physical activity. Public Health Reports, 100(2): 147–158.
Usui T, Kajita K, Kajita T, Mori I, Hanamoto T, Ikeda T, et al. 2014. Elevated mitochondrial biogenesis in skeletal muscle is associated with testosterone-induced body weight loss in male mice. FEBS Letters, 588(10): 1935–1941.
Vallerand RJ, and Losier GF. 1999. An integrative analysis of intrinsic and extrinsic motivation in sport. Journal of Applied Sport Psychology, 11: 142–169.
Vallerand RJ, Deci EL, and Ryan RM. 1987. Intrinsic motivation in psychology. Exercise & Sport Sciences Reviews, 15(1): 389–426.
Walters S, Barr-Anderson DJ, Wall M, and Neumark-Sztainer D. 2009. Does participation in organized sports predict future physical activity for adolescents from diverse economic backgrounds? Journal of Adolescent Health, 44(3): 268–274.
White P, and McTeer W. 2012. Socioeconomic status and sport participation at different developmental stages during childhood and youth: multivariate analyses using Canadian national survey data. Sociology of Sport Journal, 29(2): 186–209 [online]: Available from scopus.com/inward/record.url?eid=2-s2.0-84870291893&partnerID=40&md5=797016e301e55e46e0256c57c76c4f0a.
Yu J-G, Bonnerud P, Eriksson A, Stål PS, Tegner Y, and Malm C. 2014. Effects of long term supplementation of anabolic androgen steroids on human skeletal muscle. PLoS ONE, 9(9): e105330.
Zarrett N, Veliz P, and Sabo D. 2018. Teen sport in America: why participation matters. Women’s Sports Foundation, East Meadow, New York.

Information & Authors

Information

Published In

cover image FACETS
FACETS
Volume 4Number 1June 2019
Pages: 459 - 471
Editor: Angelo Belcastro

History

Received: 19 March 2019
Accepted: 12 June 2019
Version of record online: 9 September 2019

Data Availability Statement

All relevant data are within the paper.

Key Words

  1. hormones
  2. behaviour
  3. strength
  4. androgens
  5. handgrip
  6. competitiveness

Sections

Subjects

Authors

Affiliations

Elizabeth T. Vandenborn
Department of Kinesiology, Faculty of Human Kinetics, University of Windsor, 401 Sunset Avenue, Windsor, ON N9B 3P4, Canada
Cayla N. Wood
Department of Kinesiology, Faculty of Human Kinetics, University of Windsor, 401 Sunset Avenue, Windsor, ON N9B 3P4, Canada
Krista J. Munroe-Chandler
Department of Kinesiology, Faculty of Human Kinetics, University of Windsor, 401 Sunset Avenue, Windsor, ON N9B 3P4, Canada
Kevin J. Milne [email protected]
Department of Kinesiology, Faculty of Human Kinetics, University of Windsor, 401 Sunset Avenue, Windsor, ON N9B 3P4, Canada

Author Contributions

ETV and KJM conceived and designed the study.
ETV and CNW performed the experiments/collected the data.
ETV, CNW, and KJM analyzed and interpreted the data.
All contributed resources.
ETV, KJM-C, and KJM drafted or revised the manuscript.

Competing Interests

The authors have declared that no competing interests exist.

Metrics & Citations

Metrics

Other Metrics

Citations

Cite As

Export Citations

If you have the appropriate software installed, you can download article citation data to the citation manager of your choice. Simply select your manager software from the list below and click Download.

There are no citations for this item

View Options

View options

PDF

View PDF

Get Access

Media

Media

Other

Tables

Share Options

Share

Share the article link

Share on social media