Non-HDL cholesterol level and depression among Canadian elderly—a cross-sectional analysis of the baseline data from the CLSA
Abstract
To explore whether non-high-density-lipoprotein cholesterol (non-HDL-c) is associated with depression, a total of 26 819 Canadians aged 45–85 from the Canadian Longitudinal Study on Aging (CLSA) were included in analysis. Non-HDL-c, the difference between total-c and HDL-c, was categorized into five levels, i.e., <2.6, 2.6 to <3.7, 3.7 to <4.8, 4.8 to 5.7, and ≥5.7 mmol/L. History of clinical depression was collected by questionnaire at an in-home interview, and current potential depression status was determined by CES-D10 (Center for Epidemiological Studies Depression Scale 10 questions version) score, i.e., ≥10 vs. <10. Logistic continuation ratio model for ordinal data was used to estimate the odds of being at or above a higher non-HDL-c category for depression status. Compared with those without clinical depression history and currently undepressed, the adjusted odds ratios (95% CI) were 1.09 (1.02, 1.17) for those without clinical depression history but currently depressed, 1.05 (0.98, 1.12) for those had clinical depression history but currently undepressed, and 1.21 (1.10, 1.32) for those had clinical depression history and currently depressed. The average of non-HDL-c for four depression groups were 3.64, 3.71, 3.69, and 3.82 mmol/L, respectively, and group 4 was statistically higher than others (p < 0.001). In conclusion, people with both current depression and a history clinical depression are at an increased risk of having high level of non-HDL-c.
Introduction
Individuals with high levels of non-high-density-lipoprotein (non-HDL) cholesterol are at an increased risk for coronary heart disease (CHD) (Liu et al. 2006; Brunner et al. 2019). Non-HDL cholesterol level is the difference between total cholesterol and HDL cholesterol, which includes all proatherogenic lipoproteins containing apolipoproteins B (apo B) located in very-low-density lipoprotein (VLDL), intermediate-density lipoprotein (IDL), lipoprotein (a), and low-density lipoprotein (LDL) (Emerging Risk Factors Collaboration et al. 2009). More than 90% of plasma apo B is associated with LDL particles (Barter et al. 2006) and lowering LDL cholesterol levels does indeed lower the risk for CHD; thus, LDL cholesterol levels are used as the primary target of treatment of CHD (Expert Panel on Detection, Evaluation, and Treatment of High Blood Cholesterol in Adults 2001). However, clinical laboratory tests do not estimate LDL cholesterol levels directly, instead approximating it by the Friedewald formula, which estimates the levels of LDL cholesterol as total cholesterol—HDL cholesterol—2.2 × triglycerides (Friedewald et al. 1972). Of concern, this approach becomes increasingly inaccurate when triglyceride levels are measured using nonfasted blood specimen (Demacker et al. 1984). For this reason, non-HDL cholesterol is considered to be superior to LDL cholesterol as the treatment target for CHD risk management because the levels of total cholesterol and HDL cholesterol are less likely to be affected by fasting status (Emerging Risk Factors Collaboration et al. 2009). Furthermore, since it contains all apo B lipoproteins, studies have found that people with normal LDL cholesterol levels but elevated levels of non-HDL cholesterol were at an increased risk for CHD (Liu et al. 2005, 2006; Brunner et al. 2019). The Canadian Cardiovascular Society 2016 guidelines recommend that all men and women of 40 years of age and older have their lipid levels measured every five years. Since LDL cholesterol levels are of greatest concern for physicians, non-HDL cholesterol is addressed as an alternative marker (Anderson et al. 2016).
Depression is a mood disorder that causes persistent feelings of sadness and loss of interests and at its worst can manifest with suicidal thoughts and acts and psychotic features (American Psychiatric Association 2013). It is found that depression is strongly associated with cardiovascular disease (CVD), not only with its occurrence but also with its progress (Penninx 2017). Although it is not totally understood how depression plays a role in the development of CVD, it is believed that the pathway linking depression to CVD might be through a general mediating mechanism rather than a pure organ- or disease-specific process. For example, people with depression are more likely to live with a unhealthy lifestyle (e.g., smoking, excessive alcohol use, physically inactive, etc.), which may contribute to a higher risk for CVD (Penninx 2017). Patients with depression and dyslipidemia are more likely at an increased risk for CVD (Kim et al. 2020), but the results on the relationship between depression and dyslipidemia seem contradictory. A meta-analysis found that both total cholesterol and LDL cholesterol were negatively, but HDL cholesterol was positively associated with depression (Shin et al. 2008). A study conducted among US household population found a U-shaped relationship in men between LDL cholesterol levels and severe depression but not in women (Tedders et al. 2011). When compared to those with remitted major depression disorder (MDD), those with current MDD had lower levels of HDL cholesterol, but higher levels of total and LDL cholesterol (van Reedt Dortland et al. 2010). The results from recent a study with a large sample size indicated that an elevated triglycerides level was associated with the risk of depression symptoms, the same as for HDL cholesterol, but not for total and LDL cholesterol (So et al. 2020). It is unclear why the results of the association between dyslipidemia and depression are inconsistent. This may reflect the difference in definition of depression and possible the limitation of the measurement of LDL cholesterol and (or) triglycerides. In addition, no study has examined the relationship between depression and non-HDL cholesterol. Therefore, in this analysis, we explored whether depression status is associated with the levels of non-HDL cholesterol.
Methods
Canadian Longitudinal Study on Aging (CLSA)
The CLSA has two sub-cohorts, i.e., “Tracking cohort” and “Comprehensive cohort”, which together represents approximately 51 000 men and women aged 45–85 years across Canada (mean age 60 years). The detailed description of the CLSA can be found elsewhere (Raina et al. 2009). This study, however, only used data from the “Comprehensive cohort” because only in this cohort the related information of both depression and lipid measurements was available. The “Comprehensive Cohort” had 30 097 participants at the entry of the cohort baseline, after cleaning the missing data on lipid measurements (n = 3085) and depression measurements (n = 193), a total of 26 819 men and women were included. This study was approved for a secondary data analysis by the Research Ethics Board of Brock University (REB No. 17-097-LIU).
Measurements of depression
Two types of questions related to depression were surveyed, i.e., history of clinical depression and potential current depression.
History of clinical depression
A questionnaire at an in-home interview was conducted among all participants at the cohort baseline. Under the section of chronic conditions, information was collected on long-term conditions that were diagnosed by a health professional, that are expected to last, or have already lasted, six months or more. History of clinical depression was then determined by a positive response to the question “Has a doctor ever told you that you suffer from clinical depression?”
Current potential depression
All participants were surveyed with the CES-D 10 (Center for Epidemiological Studies Depression Scale 10 questions version), a short form of the regular CES-D (Kimberlin et al. 1998), which has been tested with good reliability (Björgvinsson et al. 2013). The CES-D 10 is used to detect current depressive symptomatology that helps to identify clinically important depression. The overall CES-D 10 score ranges from 0 to 30 with a score ≥10 suggesting current depressive illness, which needs to be further assessed (Zhang et al. 2012).
Based on the response to the history of clinical depression question and CES-D10 score, all participants were then categorized into one of the four groups; i.e., Group 1: without a history of clinical depression and currently not being depressed (CES-D10 score < 10); Group 2: without a history of clinical depression but currently depressed (CES-D10 score ≥ 10); Group 3: with a history of clinical depression but currently not depressed (CES-D10 score < 10); and Group 4: with a history of clinical depression and currently depressed (CES-D10 score ≥ 10).
Measurements of lipids
Nonfasting venipuncture blood was collected from each participant at the data collection sites and then shipped to Calgary Laboratory Services by cryoshippers for all biomarker measurements. A complete lipid profile (i.e., total cholesterol, HDL cholesterol, and triglycerides), was measured in serum by clinical analyzer (Roche Diagnostics Cobas 8000 series). LDL cholesterol was estimated using the Friedewald formula. Non-HDL cholesterol was calculated as the difference between total cholesterol and HDL cholesterol. Five non-HDL categories were created based the following cut-offs related to the risk of CVD: <2.6 mmol/L, 2.6 to <3.7 mmol/L, 3.7 to <4.8 mmol/L, 4.8 to 5.7 mmol/L, and ≥5.7 mmol/L (Brunner et al. 2019).
Measurements of covariates
The following covariates were considered when modeling the association between non-HDL cholesterol levels and depression: age (years), sex (male vs. female), education (<post-secondary, post-secondary or some college degree, and bachelor’s degree or above), marital status (married or living with a partner vs. other), immigrant status (yes vs. no), ethnicity (Caucasian vs. other), alcohol use (nondrinker, less than once a month, more than once a week during the past 12 months), smoking (nonsmoker, former smoker, current smoker), number of close friends, moderate physical activity 30+ min per day over the past 7 d (yes vs. no), waist circumference (cm), systolic blood pressure (mm Hg), and comorbidity (number of chronic diseases reported).
Analytic strategies
All analyses were conducted using SAS 9.4 (SAS Institute Inc., Cary, North Carolina, USA). Statistical significance was set at two-sided α <0.05. For the univariate analysis, one-way ANOVA were used for continuous variables, and χ2 tests for categorical variables. According to the method of continuation ratio model with logit link, we restructured four data sets from the original data set (n = 26 819). A dichotomous variable “beyond” was created as 1 for non-HDL cholesterol level ≥ 2.6 mmol/L and 0 for non-HDL cholesterol level < 2.6 mmol/L in the first data set (n = 26 819); among those whose non-HDL cholesterol level ≥ 2.6 mmol/L, “beyond” = 1 for non-HDL cholesterol level ≥ 3.7 mmol/L and 0 for non-HDL cholesterol level 2.6–3.7 mmol/L in the second data set (n = 22 277); among those whose non-HDL cholesterol level ≥ 3.7 mmol/L, “beyond” = 1 for non-HDL cholesterol level ≥ 4.8 mmol/L and 0 for 3.7–4.8 mmol/L in the third data set (n = 12 295); among those whose non-HDL cholesterol level ≥ 4.8 mmol/L, “beyond” = 1 for non-HDL cholesterol level ≥ 5.7 mmol/L and 0 for 4.8–5.7 mmol/L in the fourth data set (n = 3768). The four data sets were then combined (n = 65 159) and used to estimate the odds of being at or above a category of high level of non-HDL cholesterol (O’Connell 2006). From the desired probability, p(yi > cat.j|yi ≥ cat.j),j = 1,…,5), the odds of higher levels of non-HDL cholesterol for depression status can be estimated. Three models were then created to examine the risk association of having higher levels of non-HDL cholesterol with depression status and people in Group 1 (i.e., without a history of clinical depression and currently not being depressed were used as the reference. In model 1, we adjusted for several key demographic characteristic variables, which included age, sex, ethnicity as Caucasian, marital status, education, and immigrant status. In model 2, we further adjusted for four variables that might reflect lifestyle, i.e., friends, alcohol, smoking, and physical activity. In model 3, three variables, i.e., waist circumference, systolic blood pressure, and co-morbidity, related to cardiovascular health status were further adjusted. We also examined whether there is an interaction between sex and depression status since females usually have a higher prevalence of depression. Additionally, general linear models (GLMs) were used to obtain the adjusted mean levels of lipids for depression status, and multiple regression was used to examine the linear relationship between non-HDL cholesterol levels and CESD-10 scores with adjusting for the covariates mentioned in model 3. To ensure generalizability, the trimmed inflation weight was used for estimating means and proportions for the population and analytic weight was used when examining relationships between variables (CLSA 2017).
Results
Overall, the mean level of non-HDL cholesterol was 3.72 mmol/L among participants from the CLSA Comprehensive cohort at baseline; approximately 28% exhibited non-HDL cholesterol levels of 4.3 mmol/L or higher, a level needed to initiate primary prevention measures according to the 2016 Canadian Cardiovascular Society guidelines (Anderson et al. 2016); 17.3% of participants had a history of clinical depression; and 15.1% of participants might be currently depressed (CES-D10 score ≥ 10). Summary statistics for demographics and other covariates across the five categories of non-HDL cholesterol levels can be found in Table 1. All univariate analyses results were statistically significant (p < 0.05). The mean age of the participants was 60 years. Compared with those within the lowest levels of non-HDL cholesterol (<2.6 mmol/L), those within the highest (≥5.7 mmol/L) were approximately five years younger (58.1 vs. 62. 7 years). In addition, they were more likely to be female (52.4% vs. 42.4%), an immigrant (19.5% vs. 16.9%), current smoker (14.7% vs. 8.3%), and have fewer close friends (4.8 vs. 5.2). They also tended to have the highest mean levels of CES-D10 scores, systolic blood pressure, and waist circumference, and the worst lipid profile (e.g., the levels of total cholesterol were 3.8, 4.7, 5.6, 6.5, and 7.5 mmol/L, respectively for the five non-HDL cholesterol level categories).
Table 1.
| Non-HDL cholesterol (mmol/L) | |||||
|---|---|---|---|---|---|
| <2.6 | ∼3.7 | ∼4.8 | ∼5.7 | ≥5.7 | |
| n = 4542 | n = 9982 | n = 8527 | n = 2796 | n = 972 | |
| Age, years (mean (SE)) | 62.7 (0.2) | 59.5 (0.1) | 58.6 (0.1) | 58.2 (0.2) | 58.1 (0.3) |
| Female (%) | 42.4 | 51.6 | 49.7 | 50.7 | 52.4 |
| Married or living with partner (%) | 74.7 | 76.5 | 77.1 | 77.2 | 74.5 |
| Caucasian (%) | 96.8 | 95.8 | 96.0 | 96.1 | 96.7 |
| Education (%) | |||||
| Less than post-secondary | 22.0 | 19.7 | 20.1 | 21.5 | 22.5 |
| Some college degree | 31.3 | 32.4 | 33.3 | 34.3 | 35.7 |
| Bachelor’s degree or above | 46.7 | 47.9 | 46.6 | 44.2 | 41.8 |
| Immigrated (%) | 16.9 | 17.6 | 17.6 | 18.0 | 19.5 |
| Alcohol intake during past 12 months (%) | |||||
| Nondrinker | 11.7 | 10.9 | 9.9 | 11.1 | 12.6 |
| Less than once in a month | 11.9 | 10.8 | 11.1 | 10.1 | 14.0 |
| More than once in a week | 76.4 | 78.3 | 78.9 | 78.8 | 73.5 |
| Smoking (%) | |||||
| Nonsmoker | 30.4 | 34.9 | 34.1 | 33.0 | 26.6 |
| Former smoker | 61.3 | 56.9 | 56.9 | 56.9 | 58.8 |
| Current smoker | 8.3 | 8.2 | 9.0 | 10.1 | 14.7 |
| CESD-10 score (mean (SE)) | 5.0 (0.07) | 5.1 (0.05) | 5.2 (0.06) | 5.4 (0.09) | 6.0 (0.02) |
| Moderate physical activity 30+ min (%) | 11.6 | 13.5 | 13.8 | 13.6 | 13.4 |
| Lipid profile, mmol/L (mean (SE)) | |||||
| Total cholesterol | 3.8 (0.01) | 4.7 (0.006) | 5.6 (0.005) | 6.5 (0.009) | 7.5 (0.02) |
| HDL cholesterol | 1.6 (0.008) | 1.6 (0.005) | 1.5 (0.005) | 1.4 (0.007) | 1.3 (0.01) |
| Non-HDL cholesterol | 2.2 (0.005) | 3.2 (0.003) | 4.2 (0.003) | 5.2 (0.005) | 6.3 (0.02) |
| LDL cholesterol | 1.6 (0.006) | 2.5 (0.004) | 3.3 (0.005) | 4.1 (0.009) | 5.0 (0.02) |
| Triglyeride | 1.2 (0.009) | 1.5 (0.008) | 1.9 (0.01) | 2.5 (0.02) | 3.2 [0.05) |
| Systolic blood pressure, mm Hg (mean (SE)) | 117.5 (0.2) | 117.7 (0.2) | 119.6 (0.2) | 121.9 (0.3) | 122.7 (0.6) |
| WC, cm (mean (SE)) | 93.4 ((0.2) | 91.4 ((0.2) | 93.4 (0.2) | 94.5 (0.2) | 95.7 (0.4) |
| No. of close friends (mean (SE)) | 5.2 (0.09) | 5.4 (0.06) | 5.4 (0.06) | 5.3 (0.1) | 4.8 (0.1) |
| No. of comorbid diseases (mean (SE)) | 3.4 (0.04) | 2.6 (0.02) | 2.3 (0.02) | 2.3 (0.04) | 2.4 (0.07) |
Note
CLSA, Canadian Longitudinal Study on Aging; CESD-10, 10-item Center for Epidemiologic Studies Depression Scale; HDL, high-density lipoprotein; LDL, low-density lipoprotein; WC, waist circumference.
The estimated parameters from the continuation ratio model are shown in Table 2. After adjusting for age, sex, ethnicity, education, marital status, and immigrant status (model 1), compared with those without a history of clinical depression and currently not being depressed (Group 1), the ORs (95% CIs) of being in a higher non-HDL cholesterol category for those in Group 2 to Group 4 were 1.025 (0.965, 1.090), 1.006 (0.950, 1.066), and 1.155 (1.068, 1.248), respectively. A further adjustment for the number of close friends, alcohol intake, smoking, and physical activity (model 2) had a little effect on these estimates. However, when further adjusting for waist circumference, systolic blood pressure, and number of comorbidities (model 3), the ORs (95% CIs) for depression status were slightly increased: the ORs (95% CIs) of being in higher non-HDL cholesterol category for those in Group 2 to Group 4 were 1.094 (1.021, 1.172), 1.047 (0.983, 1.116), and 1.206 (1.101, 1.321), respectively. The significant covariates in model 3 included age (OR (95% CI): 0.985 (0.982, 0.987)), sex as male (0.746 (0.713, 0.781)), Caucasian (1.132 (1.024, 1.251)), education (0.96 (0.935, 0.986)), immigrant (1.107 (1.048, 1.169)), smoking (1.041 (1.007, 1.076)), moderate physical activity (1.068 (1.009, 1.076)), waist circumference (1.008 (1.007, 1.010)), systolic blood pressure (1.011 (1.009, 1.012)), and comorbidity (0.908 (0.897, 0.919)). All models were statistically significant (p < 0.001). The interaction term of sex with depression status was not statistically significant (p = 0.111) when being added into model 3. The in model 3 reflected that the model significantly reduced the deviance of null model (D0 = −2LL0) by 22.3%.
Table 2.
| Model 1 | Model 2 | Model 3 | ||||||||||
|---|---|---|---|---|---|---|---|---|---|---|---|---|
| b | SE (b) | OR | 95% CI | b | SE (b) | OR | 95% CI | b | SE (b) | OR | 95% CI | |
| Inter1 | 0.004 | 0.087 | — | — | −0.134 | 0.094 | — | — | −2.1835*** | 0.132 | — | — |
| Inter2 | 2.842*** | 0.040 | — | — | 2.876*** | 0.042 | — | — | 3.0319*** | 0.045 | — | — |
| Inter3 | 1.329*** | 0.039 | — | — | 1.353*** | 0.040 | — | — | 1.453*** | 0.043 | — | — |
| Inter4 | 0.269*** | 0.041 | — | — | 0.285*** | 0.043 | — | — | 0.3279*** | 0.045 | — | — |
| Depression 1 vs. 0 | 0.025 | 0.031 | 1.03 | (0.97, 1.09) | 0.032 | 0.033 | 1.03 | (0.97, 1.10) | 0.0896* | 0.035 | 1.09 | (1.02, 1.17) |
| Depression 2 vs. 0 | 0.006 | 0.029 | 1.01 | (0.95, 1.07) | 0.018 | 0.030 | 1.02 | (0.96, 1.08) | 0.0462 | 0.033 | 1.05 | (0.98, 1.12) |
| Depression 3 vs. 0 | 0.144** | 0.040 | 1.16 | (1.07, 1.25) | 0.133** | 0.042 | 1.14 | (1.05, 1.24) | 0.187*** | 0.046 | 1.21 | (1.10, 1.32) |
| Age, years | −0.018*** | 0.001 | 0.98 | (0.98, 0.98) | −0.018*** | 0.001 | 0.98 | (0.98, 0.98) | −0.015*** | 0.001 | 0.99 | (0.98, 0.99) |
| Sex | −0.095*** | 0.018 | 0.91 | (0.88, 0.94) | −0.094*** | 0.019 | 0.91 | (0.88, 0.95) | −0.293*** | 0.023 | 0.75 | (0.71, 0.78) |
| Ethnicity | 0.104* | 0.045 | 1.11 | (1.02, 1.21) | 0.135** | 0.048 | 1.15 | (1.04, 1.26) | 0.1239* | 0.051 | 1.13 | (1.02, 1.25) |
| Education | −0.066*** | 0.012 | 0.94 | (0.92, 0.96) | −0.063*** | 0.013 | 0.94 | (0.92, 0.96) | −0.0408** | 0.013 | 0.96 | (0.94, 0.99) |
| Marital status | −0.002 | 0.015 | 1.00 | (0.97, 1.21) | 0.005 | 0.016 | 1.01 | (0.97, 1.04) | 0.01 | 0.017 | 1.01 | (0.98, 1.04) |
| Immigrant status | 0.099*** | 0.025 | 1.10 | (1.05, 1.16) | 0.097** | 0.026 | 1.10 | (1.05, 1.16) | 0.1017** | 0.028 | 1.11 | (1.05, 1.17) |
| Friend | — | — | — | — | 0.0005 | 0.002 | 1.00 | (1.00, 1.01) | 0.002 | 0.001 | 1.00 | (1.00, 1.01) |
| Alcohol | — | — | — | — | 0.016 | 0.015 | 1.02 | (0.99, 1.05) | 0.0019 | 0.016 | 1.00 | (0.97, 1.03) |
| Smoker | — | — | — | — | 0.041* | 0.016 | 1.04 | (1.01, 1.07) | 0.0402* | 0.017 | 1.04 | (1.01, 1.08) |
| Physical activity | — | — | — | — | 0.047 | 0.028 | 1.05 | (0.99, 1.11) | 0.066* | 0.029 | 1.07 | (1.01, 1.13) |
| WC | — | — | — | — | — | — | — | — | 0.008*** | 0.001 | 1.01 | (1.01, 1.01) |
| SBP | — | — | — | — | — | — | — | — | 0.0107*** | 0.007 | 1.01 | (1.01, 1.01) |
| Multimorbidity | — | — | — | — | — | — | — | — | −0.0967*** | 0.006 | 0.91 | (0.90, 0.92) |
| Model χ2 (df) | 14 842.6 (12)*** | 14 028.1 (16)*** | 13 626.4 (19)*** | |||||||||
| 0.204 | 0.207 | 0.223 | ||||||||||
Note
*, p < 0.05; **, p < 0.01; ***, p < 0.001. Depression 0 (reference): 10-item Center for Epidemiologic Studies Depression Scale (CES-D10) <10 and no clinical depression history; Depression 1: CES-D10 ≥10 and no clinical depression history; Depression 3: CES-D10 <10 and having clinical depression history; Depression 4: CES-D10 ≥10 and having clinical depression history.
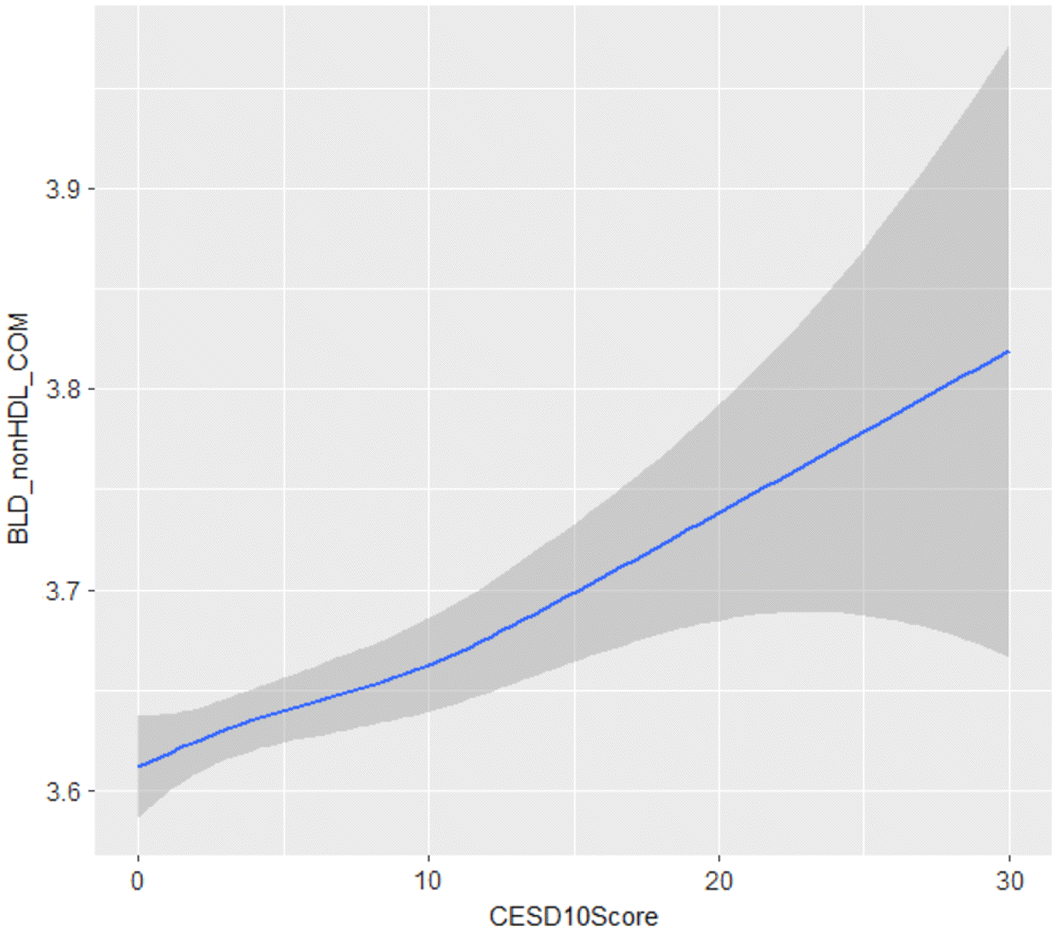
The adjusted mean levels of lipids by depression status are shown in Fig. 1. After adjusting for covariates similar to those in model 3, the mean levels of total cholesterol for people in depression status Group 1 to 4 were 5.15, 5.22, 5.18, and 5.31 mmol/L; for HDL cholesterol were 1.50, 1.51, 1.50, and 1.49; for non-HDL cholesterol were 3.64, 3.71, 3.69, and 3.82 mmol/L; for LDL cholesterol were 2.86, 2.91, 2.88, and 2.99 mmol/L; for triglycerides were 1.75, 1.79, 1.82, and 1.84 mmol/L, respectively. The differences in mean levels between Group 4 and other groups, between Group 2 and Group 1 were statistically significant (p < 0.01) for total, non-HDL, and LDL cholesterol. For triglycerides, the statistical significance in mean differences were only observed between Group 4 and Group 1 and between Group 3 and Group 1 (p < 0.01). The results from the multiple regression model showed that with 1 standard deviation increase in CESD-10 scores, the level of non-HDL cholesterol would increase, on average, approximately 0.03 (95% CI: 0.02, 0.05) mmol/L (p < 0.05). A smooth line fitted to data of the association between the levels of non-HDL cholesterol and CESD-10 scores is shown in Fig. 2.
Fig. 1.
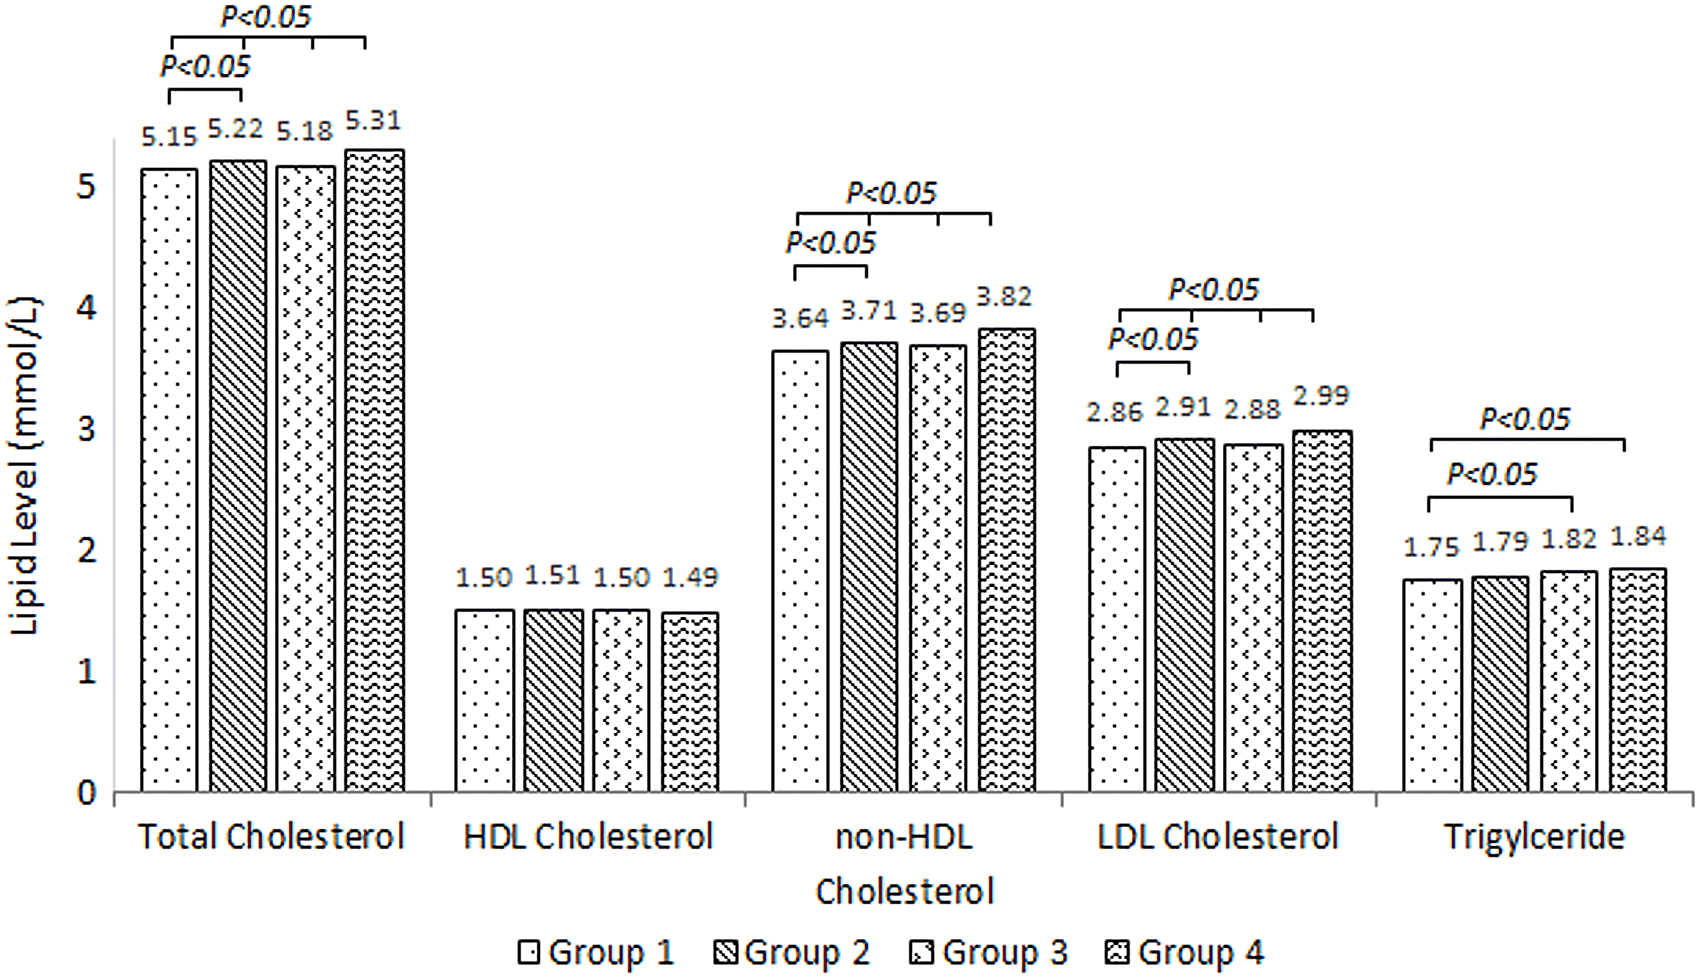
Fig. 2.
Discussion
In this study, we explored the relationship between non-HDL cholesterol and depression status among the CLSA participants. We found that compared with those who had no history of clinical depression and were also not currently depressed, those who were currently depressed regardless of their history of clinical depression had significantly higher average level of non-HDL cholesterol when treated as a continuous variable. They also had higher odds of having higher levels of non-HDL cholesterol when treated as a categorical variable.
Extensive evidence indicates that there is an association between depression and CVD. Depression may not only increase the risk of CVD, but it also affect its pathogenesis and prognosis; yet, the link between depression and CVD is mutual and bidirectional (Dhar and Barton 2016; Penninx 2017). The complicated link between depression and CVD makes it difficult to explore the association between depression and lipids. Previously, a lot of efforts have been made to explore whether lipids are one of the potential etiological factors of depression or suicide. Most studies have focused on the association of LDL cholesterol level with depression and the results have been inconsistent with either a negative, positive, or no association. Overall, several meta-analysis studies have reported negative associations, but the small sample size and high heterogeneity among those existing studies were a notable limitation (Persons and Fiedorowicz 2016; Wu et al. 2016). Further examination of those studies indicated a wide range of age (e.g., aged <30 years in one but >70 years in another), and differences in measurement of lipids (e.g., LDL cholesterol levels measured by directly, Friedewald, or no report), which may contribute to the high heterogeneity. Many studies also examined the relationship between other lipids (i.e., total, HDL cholesterol, triglycerides) and depression, but the results were inconsistent as well. Recently, the results from a large Mendelian randomization analysis suggested that the levels of triglycerides, not LDL cholesterol, were causally related to depression phenotypes (So et al. 2020). We did observe that people who were currently depressed had higher mean levels of total cholesterol, LDL cholesterol, and triglycerides, but not HDL cholesterol (Fig. 1). Since lipid measurements in the CLSA were nonfasting blood samples, it is hard to compare the association for LDL cholesterol and triglycerides in this analysis with other studies. However, we are not aware of any studies that have examined the relationship between non-HDL cholesterol and depression. We observed that those who are currently depressed had higher levels of non-HDL cholesterol and total cholesterol, particularly those who had a history of clinical depression, after adjustment of well-known covariates. Interestingly, among those people the levels of LDL cholesterol and triglycerides measured with a nonfasting blood specimen were also higher as well as the ORs for being in higher levels of non-HDL cholesterol. When depression status alone was in the model, the proportionate reduction in deviation expressed as was 0.199 (results of the model are not shown), and the in the full model (model 3) was 0.223. This suggests that non-HDL cholesterol levels are highly associated with people’s depression status. Our multiple regression results also confirmed there is a linear association between CESD-10 scores and the levels of non-HDL cholesterol. In our previous analysis, we found that people who had a history of clinical depression and were currently depressed had a higher odd of both heart-related disorders and peripheral/vascular related disorders (Liu et al. 2019). The significantly higher levels of non-HDL cholesterol among people in that group may support the observed risk association. This is similar to a previous cohort study, in which they found that when the depressed individuals whose symptoms progressed were at much higher risk for CVD if they were physically inactive (Meyer et al. 2019). Among the statistically significant covariates in model 3, we observed a significant lower odd for age, sex as male, education, and co-morbidity, but a significant higher odd for ethnicity as Caucasian, immigration, smoking, moderate physical activity, waist circumference, and systolic blood pressure. Although we did not find literature that exactly describes the relationship between non-HDL cholesterol and these covariates, the results of for some covariates in our study seem follow other studies. For example, total cholesterol was found to be negatively associated with age in seniors (Volpato et al. 2001). People with a higher education seemed more likely to choose healthy food, thus showing a lower level of cholesterol (Paalanen et al. 2012). Smoking, ethnicity as Caucasian, waist circumference, and systolic blood pressure were found to be positively associated with an elevated level of cholesterol (Eliasson et al. 2006; Sliwa et al. 2012; Nepal et al. 2018; Zhao et al. 2018). We did not find any literature with lower odds for males and comorbidity and higher odds for immigrants; these odds may simply reflect observations of univariate analysis that people with higher levels of non-HDL cholesterol were more likely to be females, immigrants, and with a higher number of co-morbidities.
Several limitations may need to be considered when interpreting the results. First, we used cross-sectional data for our analyses and therefore cannot rule out bidirectional relationships in the associations we observed. Second, the self-reported history of clinical depression might have a misclassification among participants. However, this should be a nondifferential misclassification that will generally bias towards the null. Nevertheless, the large sample size, population-based sampling design and weighting, and adjustment of many well-known covariates would enhance the generalization of this study.
Conclusion
In conclusion, people who are currently depressed regardless of their history of clinical depression are at an increased risk of having high level of non-HDL cholesterol. Whether the impact of depression on CVD mediates through high level of non-HDL cholesterol, however, needs to be examined through future longitudinal studies.
Acknowledgements
This research was made possible using the data/biospecimens collected by the Canadian Longitudinal Study on Aging (CLSA). Funding for the CLSA is provided by the Government of Canada through the Canadian Institutes of Health Research (CIHR) under grant reference: LSA 9447 and the Canada Foundation for Innovation. This research has been conducted using the CLSA Baseline Tracking Dataset 3.3, Baseline Comprehensive Dataset 3.2, under “Application Number 171003.” The CLSA is led by Drs. Parminder Raina, Christina Wolfson, and Susan Kirkland. We also acknowledge the Brock University Library Open Access Publishing Fund for supporting the publication of this work.
Disclaimer
The opinions expressed in this manuscript are the author’s own and do not reflect the views of the Canadian Longitudinal Study on Aging.
References
American Psychiatric Association. 2013. Diagnostic and statistical manual of mental disorders: DSM-5. American Psychiatric Association, Washington, D.C.
Anderson TJ, Grégoire J, Pearson GJ, Barry AR, Couture P, Dawes M, et al. 2016. 2016 Canadian Cardiovascular Society guidelines for the management of dyslipidemia for the prevention of cardiovascular disease in the adult. Canadian Journal of Cardiology, 32(11): 1263–1282.
Barter PJ, Ballantyne CM, Carmena R, Castro Cabezas M, Chapman MJ, Couture P, et al. 2006. Apo B versus cholesterol in estimating cardiovascular risk and in guiding therapy: report of the thirty-person/ten-country panel. Journal of Internal Medicine, 259(3): 247–258.
Björgvinsson T, Kertz SJ, Bigda-Peyton JS, McCoy KL, and Aderka IM. 2013. Psychometric properties of the CES-D-10 in a psychiatric sample. Assessment, 20(4): 429–436.
Brunner FJ, Waldeyer C, Ojeda F, Salomaa V, Kee F, Sans S, et al. 2019. Application of non-HDL cholesterol for population-based cardiovascular risk stratification: results from the Multinational Cardiovascular Risk Consortium. The Lancet, 394(10215): 2173–2183.
CLSA. 2017. CLSA technical document.
Demacker PN, Hijmans AG, Brenninkmeijer BJ, Jansen AP, and van ‘t Laar A. 1984. Five methods for determining low-density lipoprotein cholesterol compared. Clinical Chemistry, 30(11): 1797–1800.
Dhar AK, and Barton DA. 2016. Depression and the link with cardiovascular disease. Frontiers in Psychiatry, 7: 33.
Eliasson M, Janlert U, Jansson JH, and Stegmayr B. 2006. Time trends in population cholesterol levels 1986–2004: influence of lipid-lowering drugs, obesity, smoking and educational level. The northern Sweden MONICA study. Journal of Internal Medicine, 260(6): 551–559.
Emerging Risk Factors Collaboration, Di Angelantonio E, Sarwar N, Perry P, Kaptoge S, Ray KK, et al. 2009. Major lipids, apolipoproteins, and risk of vascular disease. JAMA, 302(18): 1993–2000.
Expert Panel on Detection, Evaluation, and Treatment of High Blood Cholesterol in Adults. 2001. Executive Summary of the Third Report of the National Cholesterol Education Program (NCEP) Expert Panel on Detection, Evaluation, and Treatment of High Blood Cholesterol in Adults (Adult Treatment Panel III). JAMA, 285(19): 2486–2497.
Friedewald WT, Levy RI, and Fredrickson DS. 1972. Estimation of the concentration of low-density lipoprotein cholesterol in plasma, without use of the preparative ultracentrifuge. Clinical Chemistry, 18(6): 499–502.
Kim JA, Choi S, Choi D, and Park SM. 2020. Pre-existing depression among newly diagnosed dyslipidemia patients and cardiovascular disease risk. Diabetes & Metabolism Journal, 44(2): 307–315.
Kimberlin CL, Pendergast JF, Berardo DH, and McKenzie LC. 1998. Issues related to using a short-form of the Center for Epidemiological Studies-Depression Scale. Psychological Reports, 83(2): 411–421.
Liu J, Sempos C, Donahue RP, Dorn J, Trevisan M, and Grundy SM. 2005. Joint distribution of non-HDL and LDL cholesterol and coronary heart disease risk prediction among individuals with and without diabetes. Diabetes Care, 28(8): 1916–1921.
Liu J, Sempos CT, Donahue RP, Dorn J, Trevisan M, and Grundy SM. 2006. Non-high-density lipoprotein and very-low-density lipoprotein cholesterol and their risk predictive values in coronary heart disease. American Journal of Cardiology, 98(10): 1363–1368.
Liu J, Son S, Mcintyre J, and Narushima M. 2019. Depression and cardiovascular diseases among Canadian older adults: a cross-sectional analysis of baseline data from the CLSA Comprehensive Cohort. Journal of Geriatric Cardiology, 16(12): 847–854.
Meyer ML, Lin FC, Jaensch A, Mons U, Hahmann H, Koenig W, et al. 2019. Multi-state models of transitions in depression and anxiety symptom severity and cardiovascular events in patients with coronary heart disease. PLoS ONE, 14(3): e0213334.
Nepal G, Tuladhar ET, Acharya K, Bhattarai A, Sharma VK, Raut M, et al. 2018. Dyslipidemia and associated cardiovascular risk factors among young Nepalese university students. Cureus, 10(1): e2089.
O’Connell AA. 2006. Logistic regression models for ordinal response variables. Sage Publications, Thousand Oaks, California.
Paalanen L, Prattala R, and Laatikainen T. 2012. Contribution of education level and dairy fat sources to serum cholesterol in Russian and Finnish Karelia: results from four cross-sectional risk factor surveys in 1992–2007. BMC Public Health, 12: 910.
Penninx BWJH. 2017. Depression and cardiovascular disease: epidemiological evidence on their linking mechanisms. Neuroscience & Biobehavioral Reviews, 74(Part B): 277–286.
Persons JE, and Fiedorowicz JG. 2016. Depression and serum low-density lipoprotein: a systematic review and meta-analysis. Journal of Affective Disorders, 206: 55–67.
Raina PS, Wolfson C, Kirkland SA, Griffith LE, Oremus M, Patterson C, et al. 2009. The Canadian longitudinal study on aging (CLSA). Canadian Journal on Aging, 28(3): 221–229.
Shin JY, Suls J, and Martin R. 2008. Are cholesterol and depression inversely related? A meta-analysis of the association between two cardiac risk factors. Annals of Behavioral Medicine, 36(1): 33–43.
Sliwa K, Lyons JG, Carrington MJ, Lecour S, Marais AD, Raal FJ, et al. 2012. Different lipid profiles according to ethnicity in the Heart of Soweto study cohort of de novo presentations of heart disease. CardioVascular Journal of Africa, 23(7): 389–395.
So HC, Chau CK, Cheng YY, and Sham PC. 2020. Causal relationships between blood lipids and depression phenotypes: a Mendelian randomisation analysis. Psychological Medicine, 1–13.
Tedders SH, Fokong KD, McKenzie LE, Wesley C, Yu L, and Zhang J. 2011. Low cholesterol is associated with depression among US household population. Journal of Affective Disorders, 135(1–3): 115–121.
van Reedt Dortland AK, Giltay EJ, van Veen T, van Pelt J, Zitman FG, and Penninx BW. 2010. Associations between serum lipids and major depressive disorder: results from the Netherlands Study of Depression and Anxiety (NESDA). The Journal of Clinical Psychiatry, 71(6): 729–736.
Volpato S, Zuliani G, Guralnik JM, Palmieri E, and Fellin R. 2001. The inverse association between age and cholesterol level among older patients: the role of poor health status. Gerontology, 47(1): 36–45.
Wu S, Ding Y, Wu F, Xie G, Hou J, and Mao P. 2016. Serum lipid levels and suicidality: a meta-analysis of 65 epidemiological studies. Journal of Psychiatry & Neuroscience, 41(1): 56–69.
Zhang W, O’Brien N, Forrest JI, Salters KA, Patterson TL, Montaner JS, et al. 2012. Validating a shortened depression scale (10 item CES-D) among HIV-positive people in British Columbia, Canada. PLoS ONE, 7(7): e40793.
Zhao X, Bo L, Zhao H, Li L, Zhou Y, and Wang H. 2018. Cardio-ankle vascular index value in dyslipidemia patients affected by cardiovascular risk factors. Clinical and Experimental Hypertension, 40(4): 312–317.
Information & Authors
Information
Published In

FACETS
Volume 5 • Number 1 • January 2020
Pages: 1006 - 1018
Editor: David Moher
History
Received: 29 May 2020
Accepted: 11 September 2020
Version of record online: 17 December 2020
Copyright
© 2020 Liu et al. This work is licensed under a Creative Commons Attribution 4.0 International License (CC BY 4.0), which permits unrestricted use, distribution, and reproduction in any medium, provided the original author(s) and source are credited.
Data Availability Statement
All relevant data are within the paper.
Key Words
Sections
Subjects
Authors
Author Contributions
JL conceived and designed the study.
JL, SS, and MG analyzed and interpreted the data.
JL, CPV, and MN drafted or revised the manuscript.
Competing Interests
The authors have declared that no competing interests exist.
Metrics & Citations
Metrics
Other Metrics
Citations
Cite As
Jian Liu, Surim Son, Mike Giancaterino, Chris P. Verschoor, and Miya Narushima. 2020. Non-HDL cholesterol level and depression among Canadian elderly—a cross-sectional analysis of the baseline data from the CLSA. FACETS.
5(1): 1006-1018. https://doi.org/10.1139/facets-2020-0039
Export Citations
If you have the appropriate software installed, you can download article citation data to the citation manager of your choice. Simply select your manager software from the list below and click Download.
Cited by
1. Association of hemoglobin and vitamin D status with depression and cognitive function in Iranian older adults