Runoff and discharge pathways of microplastics into freshwater ecosystems: A systematic review and meta-analysis
Abstract
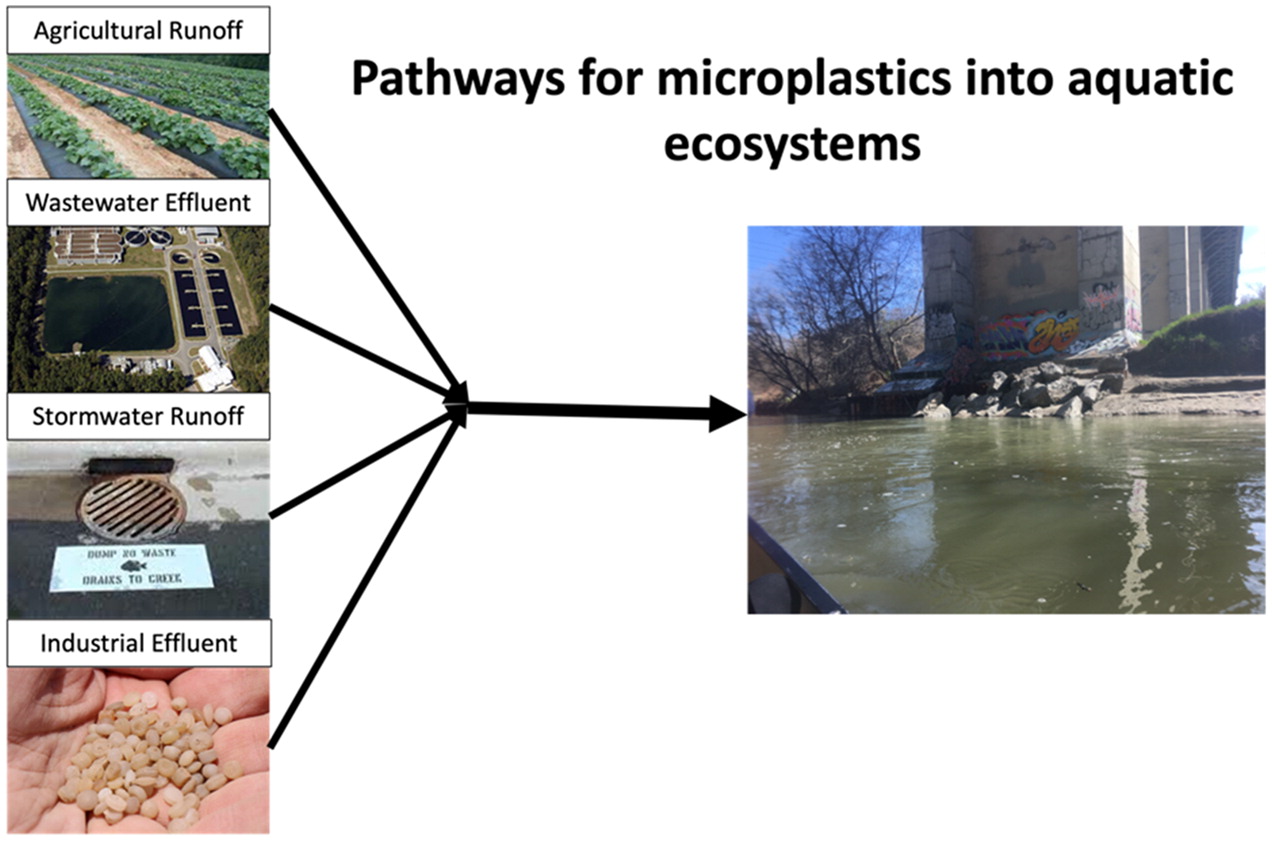
Although many studies have focused on the importance of littering and (or) illegal dumping as a source of plastic pollution to freshwater, other relevant pathways should be considered, including wastewater, stormwater runoff, industrial effluent/runoff, and agricultural runoff. Here, we conducted a meta-analysis focused on these four pathways. We quantified the number of studies, amount and characteristics of microplastics reported, and the methods used to sample and measure microplastics from each pathway. Overall, we found 121 studies relevant to our criteria, published from 2014 to 2020. Of these, 54 (45%) quantified and characterized microplastics in discharge pathways. Although most focused on wastewater treatment plant effluent (85%), microplastic concentrations were highest in stormwater runoff (0.009 to 3862 particles/L). Morphologies of particles varied among pathways and sampling methods. For example, stormwater runoff was the only pathway with rubbery particles. When assessing methods, our analysis suggested that water filtered through a finer (<200 um) mesh and of a smaller volume (e.g., 6 L) captured more particles, and with a slightly greater morphological diversity. Overall, our meta-analysis suggested that all four pathways bring microplastics into freshwater ecosystems, and further research is necessary to inform the best methods for monitoring and to better understand hydrologic patterns that can inform local mitigation.
Graphical Abstract
Introduction
Researchers estimated that 24–34 million metric tons of plastic waste entered aquatic ecosystems in 2020 (Borrelle et al. 2020). Global estimates of plastic often consider mismanaged waste (i.e., littering from municipal solid waste) as the primary source (Jambeck et al. 2015). While the littering of mismanaged waste is one pathway of plastic pollution, other sources and pathways into the environment also need to be measured. Other key pathways separate from littering include fishing (Macfadyen et al. 2009), agricultural runoff (Nizzetto et al. 2016; Liu et al. 2018; Lv et al. 2019), stormwater runoff (Liu et al. 2019a; Liu et al. 2019b; Grbić et al. 2020), and wastewater treatment plant effluent (Magnusson and Norén 2014; Mason et al. 2016; Murphy et al. 2016; Carr et al. 2016). Some of these pathways are particularly relevant for microplastics (particles smaller than 5 mm in size; Thompson et al. 2009). Although there are many sources of microplastics into aquatic systems, the abundance and composition of microplastics among different pathways is rarely compared (Horton et al. 2017; Lv et al. 2019; Grbić et al. 2020; Hoellein and Rochman 2021).
Microplastics are reported to be the most abundant plastic debris by count in aquatic ecosystems (van Sebille et al. 2015). Microplastics have primary and secondary sources. Primary microplastics are manufactured as small pieces of plastics (e.g., pre-production pellets and microbeads in rinse-off personal care products; Cauwenberghe et al. 2015; Laskar and Kumar 2019). Secondary microplastics are degraded pieces of larger plastics, broken down via photo-, mechanical- or bio-degradation (Arthur et al. 2009; Laskar and Kumar 2019), including fragmentation of plastic litter, and microparticles from the wear of products during use (e.g., tire particles, microfibers from textiles, and films used in agriculture).
Like all plastic debris, microplastics are persistent (Worm et al. 2017) and ubiquitous (Rochman and Hoellein 2020). Microplastics are common in freshwater (Horton et al. 2017; Hoellein et al. 2019; Allen et al. 2019), the atmosphere (Brahney et al. 2020), seafood (Abbasi et al. 2018; Van Cauwenberghe and Janssen 2014; Davidson and Dudas 2016), and move through ecosystems as recalcitrant particulate carbon (Zhu et al. 2021). They are also found at every level of aquatic food webs, with potential implications for predators when they move up the food chain (Provencher et al. 2019). Humans may also be exposed via water resource use (e.g., fish consumption, drinking water, food crop irrigation) in addition to inhalation (Wright and Kelly 2017; Danopoulos et al. 2020). Consequently, additional measurements of the sources and transport pathways of microplastics into the environment are needed to inform mitigation.
Transport pathways for microplastics to aquatic ecosystems include stormwater runoff (Liu et al. 2019a; Liu et al. 2019b; Grbić et al. 2020), wastewater treatment plant (WWTP) effluent (Magnusson and Norén 2014; Mason et al. 2016; Murphy et al. 2016; Carr et al. 2016), industrial effluent/runoff (Li et al. 2020; Deng et al. 2020), agricultural runoff (Ng et al. 2018; Lv et al. 2019), and atmospheric deposition (Brahney et al. 2020). Stormwater runoff is precipitation that carries sediments, chemicals, and anthropogenic particles, including microplastics, from impervious surface or land into aquatic ecosystems. WWTP effluent is treated sewage and has been identified as a contributor of microplastics to aquatic ecosystems globally (Magnusson and Norén 2014; Mason et al. 2016), including in North America (Carr et al. 2016; Mason et al. 2016; Hoellein et al. 2017), Europe (Magnusson and Norén 2014; Murphy et al. 2016), Australia (Ziajahromi et al. 2017), and Asia (Li et al. 2020; Lv et al. 2019). Industrial effluent/runoff is treated or untreated waste from any industry that is either released directly to aquatic ecosystems via runoff or treated beforehand. The importance of industrial effluent/runoff as a pathway for microplastics has only recently been explored (Deng et al. 2020; Lechner and Ramler 2015; Li et al. 2020). Agricultural runoff is excess water draining from agricultural fields after irrigation or precipitation. Agriculture-derived microplastics come from sources such as plastic mulch and the use of sludge-based fertilizers (Horton et al. 2017). Previous studies extrapolated a total annual input of 63–430 thousand metric tons of microplastics to farmlands in Europe and up to 300 thousand tons of microplastics to the farmlands in North America, which have the potential to enter aquatic ecosystems through runoff (Nizzetto et al. 2016). Atmospheric deposition of microplastics is also recognized as a pathway for the redistribution of microplastics (Allen et al. 2019; Wright et al. 2020), but few studies have attempted to quantify contributions to aquatic ecosystems and it may be low relative to other pathways (e.g., 0.03 tons per year estimated by Boucher et al. 2019). While multiple pathways transfer microplastics into aquatic ecosystems, the relative abundance and composition of microplastics is rarely quantified across pathways.
Here, we conducted a systematic review and meta-analysis to synthesize research on microplastic pollution contributed by stormwater runoff, WWTP effluent, industrial effluent/runoff, and agricultural runoff. We did not include atmospheric transport because it is less relevant to informing mitigation strategies. Our objectives were (1) examine the progression of research on microplastics in each of four management-relevant pathways over time, (2) assess the relative concentrations and composition (i.e., morphology) of microplastic in each, and (3) assess the methods employed for studying microplastic concentration and morphologies across pathways. Results from this analysis will inform future research priorities on microplastic dynamics in aquatic ecosystems, thereby supporting the prevention and mitigation of plastic pollution globally.
Methods
Literature search
We conducted a literature search in Web of Science (all databases), published through June 2020, using specific keywords for each pathway. For microplastics in stormwater, we used the keywords “microplastic and stormwater,” “microplastic and storm,” “microplastic and runoff,” “microplastic and stream,” “microplastic and tributary,” and “microplastic and river”. For WWTP effluent, which included both effluent and close receiving water impacted by the effluent, we used the keywords “microplastic and wastewater”. We used “microplastic and industr*” and “microplastic and agricultur*” as keywords for industrial effluent/runoff and agricultural runoff, respectively. The resulting articles were published from 1984 to June 2020. Our search included articles across multiple disciplines, including environmental chemistry, ecology, toxicology, and limnology.
We created a database of all relevant papers based on their titles. Next, we assessed the applicability of each paper for our review based on the abstract. Papers were considered either directly or indirectly relevant. Directly relevant papers included those that sampled from pathways or conducted modelling exercises, testing hypotheses directly related to these pathways. Studies that sampled included those that took samples directly from the pathway or in a waterbody just downstream of the direct source (e.g., river, stormwater retention pond, stormwater drains during storm events, industrial canals linking to a river). Indirectly relevant papers included studies that only briefly mentioned a pathway as part of their discussion about the potential contributing sources of contamination. Indirectly relevant papers gave a measure of the perceptions of each of these individual pathways as a source of microplastics. Only studies that quantified and characterized microplastics in samples were used for data synthesis and meta-analysis. Studies that sampled surface water in rivers/streams as stormwater were only included if samples were taken after rain events near urban areas. See Fig. 1 for a flow chart describing our systematic review and meta-analysis.
Fig. 1.
Data extraction
For each directly relevant paper, we extracted the following: sampling location (i.e., country of sampling), type of sample (e.g., river, WWTP effluent, stormwater), matrix sampled (e.g., sediment, water), sampling method, minimum mesh size used, minimum microplastic size reported, their relevance to each pathway (e.g., direct, indirect), sample amount (volume or mass), number of samples, mean concentration, minimum concentration, maximum concentration, and the percent of each morphology. For morphology, we targeted seven morphological categories: fiber, fragments, rubbery particles, pellets, spheres, foam, and film. Other morphologies are sometimes reported (e.g., flakes, granules) but at frequencies that prevented inclusion in the meta-analysis. When reporting quantitative data such as sampling volume, studies that included multiple pathways and (or) sample matrices had several entries because each was included as a separate datapoint.
Synthesis and meta-analysis
To determine the weight of evidence (total number of studies focused on each pathway) relevant to each pathway over time, we enumerated the number of studies and recorded the publication date. We then compared data using descriptive statistics from all directly relevant studies (i.e., the mean, minimum, and maximum concentrations and morphology), separated by matrix (sediment and water). Studies containing no morphology data, or studies that quantified only one morphology, were not included in morphological analysis. Both sediments and water samples were included in the first three parts of the meta-analysis (i.e., overall weight of evidence, microplastic concentrations across pathways, and microplastic morphologies across pathways). The morphology categories (i.e., percentage of different microplastics morphologies for each pathway reported in each article) were used to make two-dimensional ordinations via nonmetric multidimensional scaling (NMDS) to examine distribution patterns by pathway. NMDS plots were run using Bray-Curtis dissimilarity with untransformed data. We used the function ‘metaMDS’ and ‘adonis2’ in the vegan community ecology package (Jari Oksanen et al. 2019) in R (R core team 2020). Significant differences between microplastic morphology distributions among pathways were assessed using PERMANOVAs (function ‘adonis2’). Differences were considered significant when p < 0.05.
Effects of sampling method on microplastic concentration and morphology
We assessed how microplastic concentrations and morphologies varied according to water sampling method by assessing how different parameters such as minimum particle size reported, mesh/filter size, and volume collected influenced patterns in microplastic concentration and morphology. Publications that use rare sampling methods, including four that use computer modeling and one that sample through vacuum filtration, and studies that did not report methodological details for water sampling were not included. Few studies focused on microplastics in sediments (i.e., 11 studies with 13 samples), and thus only water samples were used for these analyses. We categorized sampling methods for water as those initially sampled with a mesh size less than or greater than 200 μm. This threshold was decided upon because traditional net sampling typically uses nets with mesh sizes greater than 200 μm (typically around 300 μm), while typical “grab” sampling using buckets or pumps tend to use mesh sizes smaller than 200 μm. We also grouped ‘large’ and ‘small’ volume samples as less than or greater than 100 L, because this cut-off seems to be typical between sampling strategies using a larger vs smaller mesh size. We analyzed the relationship between the minimum microplastic size reported and mean microplastic concentration, minimum sampling mesh size and mean microplastic concentration, and volume sampled and mean microplastic concentration. We created a series of linear and logarithmic regression models from the data extracted and reported the best-fit models, which were logarithmic (R core team 2020; Wickham 2016; Wickham 2017).
Results and discussion
Overall weight of evidence across pathways
Our primary search resulted in a total of 269 articles containing keywords related to microplastics and the four pathways. Of these, 120 studies contained information that was either directly (n = 61) or indirectly (n = 59) relevant to microplastics in different pathways that contribute to plastic pollution in freshwater ecosystems (Fig. 1A; SI Data Table II). Of the 120 articles that were relevant to at least one pathway (directly or indirectly), 25 (21%) included stormwater runoff, 76 (63%) included WWTP effluent, 54 (45%) included industrial effluent, and 25 (21%) included agricultural runoff (Fig. 2A). There were more indirectly relevant studies for all pathways except for WWTP effluent (Fig. 2A), demonstrating the proportion of quantitative observations relative to those that discussed pathways as potentially important. In total, the number of directly relevant studies included 11 for stormwater, 46 for WWTP, 4 for industrial runoff, and 4 for agricultural runoff (for a list of the publications on each pathway informing this analysis, see SI Data Table III, IV).
Fig. 2.
The list of assembled studies was examined for patterns in the publication record over time (Fig. 2B). Although the first studies captured by our literature search date back to the 1980s, these were indirectly relevant, and the first directly relevant study was published in 2014 (McCormick et al. 2014). This study focused on WWTP effluent, which reflects the early acknowledgement of WWTP effluent as a major pathway for microplastics to aquatic ecosystems (Browne et al. 2011; Eriksen et al. 2013). WWTP effluent remains the most studied pathway, incorporated in 50% of all directly relevant papers published in 2020.
Studies related to stormwater runoff appeared in the literature shortly after WWTP effluent, with the first directly relevant paper by Baldwin et al. 2016. Recent increases in stormwater runoff studies reflect a growing focus on this pathway (Fig. 2B), especially since urban and stormwater runoff carry tire wear particles among other contaminants (Sutton et al. 2019; Tian et al. 2021). Stormwater retention ponds serve as microplastic retention sites on the landscape, and as conduits for microplastics to receiving waters (Liu et al. 2019a; Moruzzi et al. 2020). Stormwater ponds in industrial/commercial areas have higher microplastic concentrations than those receiving highway and residential runoff (Liu et al. 2019a). More research on microplastic abundance, composition, upstream sources, and transport is needed to assess the role of stormwater in microplastic pollution in aquatic ecosystems, and the capacity for existing storm water management infrastructure to capture microplastic pollution.
Compared to wastewater and stormwater, industrial runoff and effluent has been measured less frequently (Fig. 2A). Although industrial runoff was commonly mentioned as a potential pathway in the literature (Fig. 2A) and the presence of plastics in aquatic systems from industry is well documented (particularly from pre-production pellets (e.g., Carpenter and Smith 1972; Ogata et al. 2009)), very few studies have yet quantified microplastics in runoff and effluent from industry directly. Runoff from plastic industries has been reported as a source of microplastics to beaches (Zbyszewski and Corcoran 2011; Zbyszewski et al. 2014; Corcoran et al. 2020), sediments (Ballent et al. 2016), and rivers (Lechner et al. 2014; Lechner and Ramler 2015; Grbic et al. 2020; Li et al. 2020; Tsui et al. 2020). Other industry sectors, such as textile mills, have also been noted as sources to nearby waters (Deng et al. 2020). Further assessments of emissions from industries via stormwater and discharges of processed waters are needed to better understand the magnitude of contributions to microplastic pollution from industrial sources, particularly in regions with higher numbers of plastics-based businesses (Ballent et al. 2016).
The recognition of agricultural activities as a source of microplastics to aquatic ecosystems is relatively recent (Nizzetto et al. 2016; Liu et al. 2018; Lv et al. 2019). Plastics are used in agricultural applications, and can degrade into microplastics during use. Like industrial runoff, microplastics from agricultural drainage has few direct measurements (Fig. 2A). Microplastics have been reported in rice fields (Lv et al. 2019) and in biosolids applied to agricultural fields (Crossman et al. 2020; Nizzetto et al. 2016). Biosolids contain concentrated microplastics removed during wastewater treatment (Lusher et al. 2019). In addition to biosolids, plasticulture such as plastic mulching materials, contributes to microplastics in agricultural fields (Steinmetz et al. 2016). Recently, concerns about agriculture-derived microplastics were cited as a top priority in the state of California (California Ocean Science Trust 2021). Understanding agricultural sources of microplastics to aquatic ecosystems also requires more research on microplastic movement within soils, drainage networks (e.g., tile drains and retention ponds), and interactions with plants (Rillig et al. 2017).
Despite the historic and ongoing dominance of studies focusing on WWTP effluent as a pathway delivering microplastics to aquatic ecosystems, our meta-analysis highlights the importance of stormwater and other pathways. We also illustrate a clear need for more studies that measure the abundance and diversity of microplastics in more diverse pathways. Because our search stopped in July 2020, we quickly surveyed the literature in Summer 2021 to see if more studies have been published on any of these pathways. We found six directly relevant papers on stormwater, seven on WWTP, and four each on industrial and agricultural. While more research has started to focus on each individual pathway, WWTP effluent is still the dominant pathway studied, and thus, more research is needed to expand our understanding of the relative contributions (e.g., relative loads to the environment) from all of these pathways.
Microplastic concentrations across pathways
From the 54 directly relevant studies included in the analysis, most quantified and characterized microplastics in water (n = 49), and fewer completed analyses in sediments (n = 11). The extracted data from each study can be found in the Supporting Information (SI Data Tables III, IV). We first investigated the patterns of microplastic concentrations reported in water among pathways. Despite the dominance of research efforts on WWTP effluent across the literature, our results show that stormwater runoff had the highest overall mean concentration (676 microplastic particles/L; n = 6) compared to the other three pathways (Fig. 3A–C). Stormwater also had the greatest variability in concentrations, ranging from 0.009 (Baldwin et al. 2016) to 3862 particles/L (Järkskog et al. 2020). We note some of the highest concentrations of microplastics in stormwater runoff samples were from stormwater retention ponds where microplastics accumulate. Still, studies that sampled several pathways in one region observed a similar pattern, where microplastic concentrations in stormwater runoff were higher than WWTP effluent (Stormwater = 15.4 particles/L, WWTP effluent = 13.3 particles/L (Grbic et al. 2020); Stormwater = 8.1 particles/L, WWTP effluent = 0.058 particles/L (Zhu et al. 2021)) The second highest mean concentrations were found in WWTP effluent (mean = 12.6 microplastic particles/L; min = 0.0088 particles/L, max = 132 microplastic particles/L; n = 39) (Carr et al. 2016; Hidayaturrahman and Lee 2019). In industrial effluent/runoff, the mean concentration of microplastics was 9.9 microplastic particles/L (n = 3), ranging from 6.1 microplastic particles/L (Alam et al. 2019) to 13.3 particles/L (Deng et al. 2020). Concentrations were the lowest in agricultural runoff, with a mean of 3.1 microplastic particles/L (n = 4), ranging from 0.7 (Lv et al. 2019) to 7 microplastic particles/L (Alam et al. 2019).
Fig. 3.
While the trends in microplastic concentrations observed among pathways is a valuable start to understanding their relative role in microplastic pollution, differences in concentrations do not equate to their relative load into freshwater ecosystems. Understanding the overall contribution of each pathway to an aquatic ecosystem requires measuring the discharge as well (volume/time). For example, discharge of wastewater effluent typically occurs as a relatively constant volume over time (although it can vary with time of day and in systems with combined sewers). Discharge from stormwater and agricultural inputs, however, are more variable in duration and magnitude than WWTP effluent. Previous studies that have attempted to estimate microplastic loads, such as Boucher et al. (2019), Zhu et al. (2021), and Werbowski et al. (2021), suggest a dominance of stormwater as a pathway to local aquatic ecosystems over WWTP effluent. To the best of our knowledge, no study has measured all four pathways in a single ecosystem, which is needed to generate a comparison of total microplastic load across pathways.
Microplastic concentrations in sediments downstream of potential inputs followed a similar overall pattern to water, where the mean concentrations and variability among studies was greatest in sediments receiving stormwater (collected from ponds, wetlands) compared to other pathways (Fig. 3D–F). Across all studies, however, sediments impacted by WWTP effluent had the highest mean concentration at 34,300 microplastic particles/kg (n = 6). Values ranged from 8.9 microplastic particles/kg (Talvitie et al. 2015) to 205,000 microplastic particles/kg (Haave et al. 2019). The extremely high concentration reported in Haave et al (2019) skews the mean, affecting the pattern observed here. Sediments impacted by stormwater had the second highest mean microplastic concentration at 10 900 microplastic particles/kg (n = 3), ranging from 468 (Ziajahromi et al. 2020) to 31 700 microplastic particles/kg (Liu et al. 2019a, 2019b). Sediments impacted by industrial effluent/runoff had the third largest mean concentration at 263 microplastic particles/kg (n = 3), ranging 35 microplastic particles/kg (Alam et al. 2019) to 670 microplastic particles/kg (Deng et al. 2020). Only one study focused on agricultural runoff, which had the lowest mean concentration among the pathways at 23.3 microplastic particles/kg (n = 1; Alam et al. 2019).
Overall, these results provide some insight into the relative concentrations of microplastics within each of the four transport pathways explored here, but there are some important caveats for the inferences generated from this analysis. This dataset reflects a modest number of studies and samples, which use a range of sampling approaches and parameters (e.g., particle size), and show high variability and skewed distributions. We stress these comparisons are preliminary and illustrate the need for more research which includes multiple microplastic pathways using consistent protocols applied across each. Furthermore, measurements of microplastic should be paired with discharge and conducted with sufficient frequency to quantify particle loads to assess the relative contributions of each pathway to a water body (e.g., lakes or rivers).
Microplastic morphologies across pathways
Material shape offered some insight into particle composition across pathways. All four pathways were dominated by fibers and fragments, with a mean abundance of 45.7% and 43.1% in stormwater, 54.6% and 28.4% in WWTP effluent, 67.9% and 24% in industrial effluent/runoff, and 32.7% and 19% in agricultural runoff, respectively (Fig. 4A). Still, there were some unique morphologies among pathways. Rubbery particles were only found in stormwater runoff. Spheres were found only in WWTP effluent and agricultural runoff. In industrial effluent/runoff the relative abundance of pellets was higher than other pathways, and in agricultural runoff film was more common than other pathways. The morphology distributions were not significantly different among pathways (PERMANOVA, p = 0.15) and overlap of datapoints on the NMDS occurred among all pathways, likely as a result of fibers and fragments (Fig. 4B). The NMDS showed the largest overlap among WWTP effluent and stormwater. Industrial effluent/runoff also had some overlap with each of stormwater and WWTP effluent. Agricultural runoff had the least overlap, suggesting that agricultural runoff has the most unique morphology distributions.
Fig. 4.
Although the assemblages of microplastic morphologies did not show a significant difference among the four pathways, the data can still facilitate inferences about potential microplastic sources. For instance, stormwater runoff was the only pathway with rubbery particles reported. These particles were likely tire and roadwear particles (tires and crack sealant), which have been reported in stormwater (Grbic et al. 2020; Järlskog et al. 2020; Werbowski et al. 2021). The spheres in WWTP effluent and agricultural runoff are likely from personal care products flowing through the plants or captured in sludge and applied to land (Hidayaturrahman and Lee 2019; Lv et al. 2019). Other studies, such as McCormick et al. (2014), also identified spheres, attributed to personal care products as a common morphology in WWTP effluent. Pre-production plastic pellets were relatively unique to industrial effluent/runoff. This may be expected if plastic industry is upstream. Similarly, a high proportion of fibers was observed in studies that sampled near textile industries (Deng et al. 2020). Finally, a large percentage of films were reported in agricultural runoff, consistent with the use of plastic mulch (Lv et al. 2019a, 2019b; Zhang et al. 2019). These unique morphologies could potentially act as signatures of dominant sources for a particular pathway, which would be useful in monitoring to inform source reduction (Helm 2017).
While the patterns observed here are suggestive, more research is necessary to link microplastic morphologies to input pathways. A more standard classification of microplastic morphologies is necessary to allow harmonized monitoring to improve source apportionment and inform policies. For instance, some studies classified rubber as fragments (Zhu et al. 2021), and spheres as pellets (Eriksen et al. 2013; Mason et al. 2018). This confounds synthesis across studies. For example, the pellets contributing to wastewater in Fig. 4 are most likely spheres, based on inferences of them as spherical microbeads from personal care products in the publications. However, we had to list them as pellets because it is how they were categorized in their datasets. Moreover, the small sample sizes for many pathways in the literature, especially agricultural and industrial effluent/runoff, may preclude accurate estimation of unique morphologies. This field of study is quickly growing, and newly published articles on related industrial and agricultural runoff pathways that occurred since our data synthesis date (June 2020) will increase available morphological data. For example, Werbowski et al. (2021) sampled stormwater and similarly reported a high proportion of rubbery fragments. Sang et al. (2021) also found a high percentage of fragments in their stormwater sample. Zhu et al. (2021) sampled wastewater and similarly reported spheres as a signature of WWTP effluent. On the other hand, Treilles et al. (2021) and Lutz et al. (2021) reported higher microfiber concentrations in stormwater, followed by fragments. Thus, further studies with greater consistency in morphological classification of microplastic particles in these pathways will help to elucidate these patterns.
Implications to inform monitoring strategies
In addition to analyzing the concentrations and morphologies of microplastics in each pathway, we examined the data generated by different sampling methodologies. Due to the small number of studies that focused on microplastics in sediments, we only included studies that sampled microplastics in water (n = 49). First, studies were separated by sampling mesh size (which is an indicator of the smallest particle size captured): less than 200 μm and greater than 200 μm (See SI Data Tables XIII, XIV). Among all studies included in this analysis, 41 (84%) sampled microplastics <200 μm, and eight (16%) sampled microplastics >200 μm. We noted a trend that researchers taking samples in a relatively smaller water body, such as stormwater retention ponds (Liu et al. 2019a) and WWTP effluent tanks, favored water collection with pumps, bottles, or buckets, followed by sample filtration in the lab. Studies sampling in larger bodies of water, such as rivers and lakes, tended to use net sampling methods with a larger mesh size.
Concentrations of microplastics varied between sampling mesh sizes (Fig. 5A). From the 44 studies using <200 μm sampling, mean and median concentrations were 105 and 2.45 microplastic particles/L, respectively. Mean concentrations ranged from 0.001 to 3862 microplastic particles/L. From the studies using >200 μm sampling, concentrations were lower with mean and median concentration of 5.97 and 0.53 microplastics particles/L, respectively. Samples collected with larger mesh also showed less variability among studies, with mean concentrations ranging from 0.001 to 29.4 microplastic particles/L. We observed a very similar pattern relative to sample volume, whereby smaller volume samples had higher concentrations and greater variability (Fig. S1).
Fig. 5.
We compared morphological diversity captured using each method. Morphological diversity collected by both methods was dominated by fibers and fragments, with 54.5% fiber and 26.4% fragment reported in samples collected with a smaller mesh and 57.7% fiber and 26.1% fragment reported in samples collected with a large mesh (Fig. 5B). Samples collected with a smaller mesh size reported a greater proportion of spheres (6%), and samples collected with a larger mesh size reported a greater proportion of pellets (11%). Studies using a smaller mesh size also reported a slightly greater diversity of shapes, including all seven morphologies discussed in this review. Samples collected with a larger mesh size only included six morphologies, which did not include rubbery particles. Again, patterns documented according to mesh size were very similar relative to sample volume, with all samples being dominated by fibers and fragments, and smaller volumes capturing greater morphological diversity (Fig. S1).
These results suggest that studies sampling with a smaller mesh size capture higher concentrations than samples taken with large mesh sizes. This is most likely because these methods capture smaller particles, and a broader spectrum of size classes. The result regarding morphologies is not consistent with Hung et al. (2021) who report more diversity of microplastic size and morphologies in trawl samples (with larger mesh size) compared to water samples (filtered through a finer mesh) sampled from the same sites in San Francisco Bay. The greater diversity of morphologies observed in smaller mesh sampling here is likely due to where in the water column and how samples were taken in the different pathways – typically from smaller water bodies or directly from wastewater effluent tanks and stormwater retention ponds. Other factors, such as the location, could also play a role in the different microplastic concentrations and morphologies reported. In this study, sampling nets with larger mesh size were mainly used to sample microplastics in the river, typically downstream of an effluent pipe.
Finally, we explored whether the minimum microplastic size analyzed (explained by minimum microplastic size reported because studies did not report a method detection limit), the minimum microplastic size sampled (explained by mesh size or minimum filter size for bulk water), and the volume of water sampled affects concentrations reported (expressed as the mean microplastic concentration reported in each study). We found a significant negative relationship between the minimum microplastic size reported and the mean microplastic concentrations observed (Fig. 6A). We did not find a significant relationship between minimum mesh size and the mean microplastic concentrations observed (Fig. 6B). Similar to minimum size reported, we found a significant negative relationship between the volume of water sampled and the mean microplastic concentrations observed (Fig. 6C). In other words, concentrations of microplastics were higher when smaller particles were reported, and lower volumes of water were sampled.
Fig. 6.
Similar patterns and results have also been reported in Lorenz et al. (2019), which illustrate an exponential increase in microplastic abundance as the detectable particle size decreases. This is consistent with our results above regarding <200 μm and >200 μm sampling methods. Capturing smaller microplastics is not easy, but needed to estimate total concentration of microplastics across wide size gradients. Overall, we recognize the complementarity in taking samples with different size meshes. The mesh size used should be chosen based on the objective of the research and capabilities of the laboratory. The trend we observed in Fig. 6B may have been due to the method detection limit in the laboratory not being comparable to the size of the mesh used in the field (i.e., sampling smaller microplastics than can be measured in the lab). Fig. 6C suggests that a smaller sampling volume is also associated with an increase in the concentration of microplastic, consistent with studies elsewhere (Covernton et al. 2019), suggesting the increase of sampling volume is associated with the decrease in sampled microplastics concentrations. However, this result is probably confounded by the use of grab sampling, which has a lower volume and lower mesh size than other sampling approaches. We do not suggest taking a smaller volume, as taking larger volumes reduces the variability and more accurately represents the environment (Hung et al. 2021).
While sampling method may impact microplastic concentrations, the relationship revealed by our analyses explained a modest amount of variation (i.e., 11%–13%). Many other factors drive variation in microplastic concentrations, including season, location, and matrix (i.e., stormwater retention ponds and wastewater effluent tanks). For example, we may expect the stormwater retention ponds to show higher concentration of microplastics than rivers receiving urban runoff due to dilution in the river. Furthermore, results may be affected by laboratory methods for extraction and analysis which were not explored here. Finally, our regression results were skewed by extreme values, so more research which spans a wider gradient of methods and particles will resolve relationships between volume, mesh size, and particle concentrations.
Conclusions and implications for management
Overall, more studies are needed to expand data collection to a greater diversity of microplastic pathways into freshwater ecosystems. Stormwater runoff, industrial effluent/runoff, and agricultural runoff showed microplastic concentrations that were in the same range or higher than those recorded in WWTPs effluent. Our results also suggest the potential use of unique morphologies in each pathway to act as a signature for some particle types (e.g., rubbery particles in stormwater runoff), which can help inform monitoring and mitigation strategies. The morphologies detected can also indicate sources that might be key contributors to a particular pathway, informing upstream solutions. Finally, our study assessed sampling methodologies and how mesh size, volume, and detection limits for size impacted concentration and diversity of microplastics. We did not find any clear trend suggesting how samples should be taken and processed. Instead, we recommend consistent sampling protocols (to facilitate meta-analysis and synthesis) that align with the objective of the research. For example, research directed at measuring microplastic toxicity may want to sample smaller particles via bulk water samples filtered through a fine mesh. Research targeting pellets in industrial runoff would benefit from using nets with larger mesh to sample more volume to capture a representative sample of 3 mm pellets. Multiple pathways contribute microplastics to aquatic ecosystems and further research should consider a broader spectrum of transport pathways, including stormwater runoff, industrial effluent/runoff and agricultural runoff, in addition to WWTP effluent. Taking a more holistic approach will improve our understanding of plastic pollution dynamics and inform more effective policies for monitoring and mitigation.
Acknowledgments
J. Wang was supported by a Northrop Frye Summer Research Experience award from University of Toronto and an NSERC Discovery grant awarded to C. Rochman.
References
Abbasi S, Soltani N, Keshavarzi B, Moore F, Turner A, and Hassanaghaei M. 2018. Microplastics in different tissues of fish and prawn from the Musa Estuary, Persian Gulf. Chemosphere, 205: 80–87.
Alam FC, Sembiring E, Muntalif BS, and Suendo V. 2019. Microplastic distribution in surface water and sediment river around slum and industrial area (case study: Ciwalengke River, Majalaya district, Indonesia). Chemosphere, 224: 637–645.
Allen S, Allen D, Phoenix VR, Le Roux G, Durántez Jiménez P, Simonneau A, et al. 2019. Atmospheric transport and deposition of microplastics in a remote mountain catchment. Nature Geosciences, 12(5): 339–344.
Arthur C, Baker J, and Bamford H. 2009. Proceedings of the International Research Workshop on the Occurrence, Effects and Fate of Microplastic Marine Debris. NOAA technical memorandum NOS-OR & R-30.
Baldwin AK, Corsi SR, and Mason SA. 2016. Plastic debris in 29 great lakes tributaries: Relations to watershed attributes and hydrology. Environmental Science & Technology, 50(19): 10377–10385.
Ballent A, Corcoran PL, Madden O, Helm PA, and Longstaffe FJ. 2016. Sources and sinks of microplastics in Canadian Lake Ontario nearshore, tributary and beach sediments. Marine Pollution Bulletin, 110(1): 383–395.
Borrelle SB, Ringma J, Law KL, Monnahan CC, Lebreton L, McGivern A, et al. 2020. Predicted growth in plastic waste exceeds efforts to mitigate plastic pollution. Science (New York, N.Y.), 369(6510): 1515–1518.
Boucher J, Faure F, Pompini O, Plummer Z, Wieser O, and de Alencastro LF. 2019. (Micro) plastic fluxes and stocks in Lake Geneva basin. TrAC Trends in Analytical Chemistry, 112: 66–74.
Brahney J, Hallerud M, Heim E, Hahnenberger M, and Sukumaran S. 2020. Plastic rain in protected areas of the United States. Science (New York, N.Y.), 368(6496): 1257–1260.
Browne MA, Crump P, Niven SJ, Teuten E, Tonkin A, Galloway T, et al. 2011. Accumulation of microplastic on shorelines woldwide: sources and sinks. Environmental Science & Technology, 45(21): 9175–9179.
California Ocean Science Trust. 2021. Progress report from October 2019 to September 2021.
Carpenter EJ, and Smith KL. 1972. Plastics on the sargasso sea surface. Science, 175(4027): 1240–1241.
Carr SA, Liu J, and Tesoro AG. 2016. Transport and fate of microplastic particles in wastewater treatment plants. Water Research, 91: 174–182.
Cauwenberghe L, Devriese L, Galgani F, Robbens J, and Janssen CR. 2015. Microplastics in sediments: A review of techniques, occurrence and effects. Marine Environmental Research, 111: 5–17.
Corcoran PL, de Haan Ward J, Arturo IA, Belontz SL, Moore T, Hill-Svehla CM, et al. 2020. A comprehensive investigation of industrial plastic pellets on beaches across the Laurentian Great Lakes and the factors governing their distribution. Science of The Total Environment, 747: 141227.
Covernton GA, Pearce CM, Gurney-Smith HJ, Chastain SG, Ross PS, Dower JF, et al. 2019. Size and Shape Matter: A Preliminary Analysis of Microplastic Sampling Technique in Seawater Studies with Implications for Ecological Risk Assessment. Science Total Environment, 667: 124–132.
Crossman J, Hurley RR, Futter M, and Nizzetto L. 2020. Transfer and transport of microplastics from biosolids to agricultural soils and the wider environment. Science of The Total Environment, 724: 138334.
Danopoulos E, Twiddy M, and Rotchell JM. 2020. Microplastic contamination of drinking water: A systematic review. PloS ONE, 15(7): e0236838.
Davidson K, and Dudas SE. 2016. Microplastic ingestion by wild and cultured Manila clams (Venerupis philippinarum) from Baynes Sound, British Columbia. Archives of Environmental Contamination and Toxicology, 71(2): 147–156.
Deng H, Wei R, Luo W, Hu L, Li B, Di Y, and Shi H. 2020. Microplastic pollution in water and sediment in a textile industrial area. Environmental Pollution (Barking, Essex: 1987), 258(113658): 113658.
Eriksen M, Mason S, Wilson S, Box C, Zellers A, Edwards W, et al. 2013. Microplastic pollution in the surface waters of the Laurentian Great Lakes. Marine Pollution Bulletin, 77(1–2): 177–182.
Grbić J, Helm P, Athey S, and Rochman CM. 2020. Microplastics entering northwestern Lake Ontario are diverse and linked to urban sources. Water Research, 174(115623): 115623.
Haave M, Lorenz C, Primpke S, and Gerdts G. 2019. Different stories told by small and large microplastics in sediment - first report of microplastic concentrations in an urban recipient in Norway. Marine Pollution Bulletin, 141: 501–513.
Helm PA. 2017. Improving Microplastics Source Apportionment: A Role for Microplastic Morphology and Taxonomy? Anal. Methods, 9(9): 1328–1331.
Hidayaturrahman H, and Lee T-G. 2019. A study on characteristics of microplastic in wastewater of South Korea: Identification, quantification, and fate of microplastics during treatment process. Marine pollution bulletin, 146: 696–702.
Hoellein TJ, McCormick AR, Hittie J, London MG, Scott JW, and Kelly JJ. 2017. Longitudinal patterns of microplastic concentration and bacterial assemblages in surface and benthic habitats of an urban river. Freshwater Science, 36(3): 491–507.
Hoellein TJ, Shogren AJ, Tank JL, Risteca P, and Kelly JJ. 2019. Microplastic deposition velocity in streams follows patterns for naturally occurring allochthonous particles. Scientific Reports, 9(1):3740.
Hoellein, T.J. and Rochman, C.M. 2021. The “plastic cycle”: A watershed-scale model of plastic pools and fluxes. Frontiers in Ecology and the Environment, 19(3): 176–183.
Horton AA, Walton A, Spurgeon DJ, Lahive E, and Svendsen C. 2017. Microplastics in freshwater and terrestrial environments: Evaluating the current understanding to identify the knowledge gaps and future research priorities. The Science of the Total Environment, 586: 127–141.
Hung C, Klasios N, Zhu X, Sedlak M, Sutton R, and Rochman CM. 2021. Methods matter: methods for sampling microplastic and other anthropogenic particles and their implications for monitoring and ecological risk assessment. Integrated Environmental Assessment and Management, 17(1): 282–291.
Jambeck JR, Geyer R, Wilcox C, Siegler TR, Perryman M, Andrady A, et al. 2015. Marine pollution. Plastic waste inputs from land into the ocean. Science (New York, N.Y.). 347(6223): 768–771.
Jari Oksanen F, Blanchet G, Friendly M, Kindt R, Legendre P, McGlinn D, et al. 2019.Vegan: Community Ecology Package. R package version 2.5-6. [online]: Available from CRAN.R-project.org/package=vegan
Järlskog I, Strömvall A-M, Magnusson K, Gustafsson M, Polukarova M, Galfi H, et al. 2020. Occurrence of tire and bitumen wear microplastics on urban streets and in sweepsand and washwater. The Science of the Total Environment, 729(138950): 138950.
Laskar N, and Kumar U. 2019. Plastics and microplastics: A threat to environment. Environmental Technology and Innovation, 14(100352): 100352.
Lechner A, Keckeis H, Lumesberger-Loisl F, Zens B, Krusch R, Tritthart M, et al. 2014. The Danube so colourful: A potpourri of plastic litter outnumbers fish larvae in Europe’s second largest river. Environmental Pollution, 188: 177–181.
Lechner A, and Ramler D. 2015. The discharge of certain amounts of industrial microplastic from a production plant into the River Danube is permitted by the Austrian legislation. Environmental Pollution, 200: 159–160.
Li B, Su L, Zhang H, Deng H, Chen Q, and Shi H. 2020. Microplastics in fishes and their living environments surrounding a plastic production area. The Science of the Total Environment. 727(138662):138662.
Liu F, Olesen KB, Borregaard AR, and Vollertsen J. 2019a. Microplastics in urban and highway stormwater retention ponds. The Science of the Total Environment, 671: 992–1000.
Liu F, Vianello A, and Vollertsen J. 2019b. Retention of microplastics in sediments of urban and highway stormwater retention ponds. Environmental pollution (Barking, Essex: 1987), 255(Pt 2): 113335.
Liu M, Lu S, Song Y, Lei L, Hu J, Lv W, Zhou W, Cao C, Shi H, Yang X, et al. 2018. Microplastic and mesoplastic pollution in farmland soils in suburbs of Shanghai, China. Environmental pollution (Barking, Essex: 1987), 242(Pt A): 855–862.
Lorenz C, Roscher L, Meyer MS, Hildebrandt L, Prume J, Löder MGJ, et al. 2019. Spatial distribution of microplastics in sediments and surface waters of the southern North Sea. Environmental Pollution, 252: 1719–1729.
Lutz N, Fogarty J, and Rate A. 2021. Accumulation and potential for transport of microplastics in stormwater drains into marine environments, Perth region, Western Australia. Marine Pollution Bulletin, 168(112362): 112362.
Lusher AL, Hurley RR, and Vogelsang C. 2019. Microplastics in sewage sludge: Captured but released? Microplastics in Water and Wastewater.
Lv W, Zhou W, Lu S, Huang W, Yuan Q, Tian M, et al. 2019a. Microplastic pollution in rice-fish co-culture system: A report of three farmland stations in Shanghai, China. The Science of the Total Environment, 652: 1209–1218.
Lv X, Dong Q, Zuo Z, Liu Y, Huang X, and Wu W-M. 2019b. Microplastics in a municipal wastewater treatment plant: Fate, dynamic distribution, removal efficiencies, and control strategies. Journal of Cleaner Production. 225:579–586.
Macfadyen G, Huntington T, and Cappell R. 2009. Abandoned, lost or otherwise discarded fishing gear. UNEP Regional Seas Reports and Studies No.185; FAO Fisheries and Aquaculture Technical Paper, No. 523. UNEP/FAO, Rome.
Magnusson K, and Norén F. 2014. Screening of microplastic particles in and down-stream a wastewater treatment plant. IVL Swedish Environmental Research Institute, Report Number C55, Stockholm, Sweden, 20 pp.
Mason SA, Garneau D, Sutton R, Chu Y, Ehmann K, Barnes J, et al. 2016. Microplastic pollution is widely detected in US municipal wastewater treatment plant effluent. Environmental Pollution (Barking, Essex: 1987), 218: 1045–1054.
Mason SA, Welch VG, and Neratko J. 2018. Synthetic Polymer Contamination in Bottled Water. Frontiers in Chemistry, 6.
McCormick A, Hoellein TJ, Mason SA, Schluep J, and Kelly JJ. 2014. Microplastic is an abundant and distinct microbial habitat in an urban river. Environmental Science and Technology, 48(20): 11863–11871.
Moruzzi BR, Galileu Speranza L, Tomazini da Conceição F, Teodoro de Souza Martins S, Busquets R, and Cintra Campos L. 2020. Stormwater detention reservoirs: An opportunity for monitoring and a potential site to prevent the spread of urban microplastics. Water, 12(7): 1994.
Murphy F, Ewins C, Carbonnier F, and Quinn B. 2016. Wastewater Treatment Works (WwTW) as a Source of Microplastics in the Aquatic Environment. Environmental Science and Technology, 50(11): 5800–5808.
Ng E-L, Huerta Lwanga E, Eldridge SM, Johnston P, Hu H-W, Geissen V, et al. 2018. An overview of microplastic and nanoplastic pollution in agroecosystems. The Science of the Total Environment, 627: 1377–1388.
Nizzetto L, Futter M, and Langaas S. 2016. Are agricultural soils dumps for microplastics of urban origin? Environmental Science and Technology. 50(20): 10777–10779.
Ogata Y, Takada H, Mizukawa K, Hirai H, Iwasa S, Endo S, Mato Y, et al. 2009. International Pellet Watch: Global monitoring of persistent organic pollutants (POPs) in coastal waters. 1. Initial phase data on PCBs, DDTs, and HCHs. Marine Pollution Bulletin. 58(10): 1437–1446.
Provencher JF, Ammendolia J, Rochman CM, and Mallory ML. 2019. Assessing plastic debris in aquatic food webs: what we know and don’t know about uptake and trophic transfer. Environmental reviews. 27(3):304–317.
R Core Team. 2020. R: A language and environment for statistical computing. R Foundation for Statistical Computing, Vienna, Austria. [online]: Available from R-project.org/
Rillig MC, Ingraffia R, and de Souza Machado AA. 2017. Microplastic Incorporation into Soil in Agroecosystems. Frontiers in Plant Science, 8.
Rochman CM, and Hoellein T. 2020. The global odyssey of plastic pollution. Science. 368(6496): 1184–1185.
Sang W, Chen Z, Mei L, Hao S, Zhan C, Zhang WB, et al. 2021. The abundance and characteristics of microplastics in rainwater pipelines in Wuhan, China. The Science of the total environment. 755(Pt 2): 142606.
Steinmetz Z, Wollmann C, Schaefer M, Buchmann C, David J, Tröger J, et al. 2016. Plastic mulching in agriculture. Trading short-term agronomic benefits for long-term soil degradation? The Science of the Total Environment, 550: 690–705.
Sutton R, Chen D, Sun J, Greig DJ, and Wu Y. 2019. Characterization of brominated, chlorinated, and phosphate flame retardants in San Francisco Bay, an urban estuary. The Science of the Total Environment, 652: 212–223.
Talvitie J, Heinonen M, Pääkkönen J-P, Vahtera E, Mikola A, Setälä O, et al. 2015. Do wastewater treatment plants act as a potential point source of microplastics? Preliminary study in the coastal Gulf of Finland, Baltic Sea. Water Science and Technology: A Journal of the International Association on Water Pollution Research. 72(9):1495–1504.
Thompson RC, Moore CJ, vomSaal FS, and Swan SH. 2009. Plastics, the environment and human health: current consensus and future trends. Philosophical Transactions of the Royal Society B, 364: 2153–2166.
Tian Z, Zhao H, Peter KT, Gonzalez M, Wetzel J, Wu C, et al. 2021. A ubiquitous tire rubber-derived chemical induces acute mortality in coho salmon. Science (New York, N.Y.), 371(6525): 185–189.
Treilles R, Gasperi J, Gallard A, Saad M, Dris R, Partibane C, et al. 2021. Microplastics and microfibers in urban runoff from a suburban catchment of Greater Paris. Environmental Pollution (Barking, Essex: 1987), 287(117352): 117352.
Tsui N, Helm P, Hruska J, and Rochman CM. 2020. Kicking pellet emissions to the curb. Integrated Environmental Assessment and Management, 16(5): 788–790.
Van Cauwenberghe L, and Janssen CR. 2014. Microplastics in bivalves cultured for human consumption. Environmental pollution (Barking, Essex: 1987), 193: 65–70.
van Sebille E, Wilcox C, Lebreton L, Maximenko N, Hardesty BD, van Franeker JA, et al. 2015. A global inventory of small floating plastic debris. Environmental Research Letters, 10(12): 124006.
Werbowski LM, Gilbreath AN, Munno K, Zhu X, Grbic J, Wu T, et al. 2021. Urban Stormwater Runoff: A Major Pathway for Anthropogenic Particles, Black Rubbery Fragments, and Other Types of Microplastics to Urban Receiving Waters. ACS ES&T Water, 1(6): 1420–1428.
Wickham, H. 2016. ggplot2: Elegant graphics for data analysis. Springer-Verla, New York.
Wickham, H. 2017. tidyverse: Easily Install and Load the ‘Tidyverse’. R package version 1.2.1. [online]: Available from CRAN.R-project.org/package=tidyverse
Worm B, Lotze HK, Jubinville I, Wilcox C, and Jambeck J. 2017. Plastic as a Persistent Marine Pollutant. Annual Review of Environment and Resources, 42(1): 1–26.
Wright SL, and Kelly FJ. 2017. Threat to human health from environmental plastics. BMJ (Clinical research ed.), 358: j4334.
Wright SL, Ulke J, Font A, Chan KLA, and Kelly FJ. 2020. Atmospheric microplastic deposition in an urban environment and an evaluation of transport. Environment International, 136(105411): 105411.
Zbyszewski M, and Corcoran PL. 2011. Distribution and degradation of fresh water plastic particles along the beaches of Lake Huron, Canada. Water, Air, & Soil Pollution, 220(1–4): 365–372.
Zbyszewski M, Corcoran PL, Hockin A. 2014. Comparison of the distribution and degradation of plastic debris along shorelines of the Great Lakes, North America. Journal of Great Lakes Research, 40(2): 288–299.
Zhang M, Zhao Y, Qin X, Jia W, Chai L, Huang M, et al. 2019. Microplastics from mulching film is a distinct habitat for bacteria in farmland soil. Science of The Total Environment, 688: 470–478.
Zhu X, Munno K, Grbic J, Werbowski LM, Bikker J, Ho A, et al. 2021. Holistic assessment of microplastics and other anthropogenic microdebris in an urban bay sheds light on their sources and fate. ACS ES&T Water, 1(6): 1401–1410.
Ziajahromi S, Neale PA, Rintoul L, and Leusch FDL. 2017. Wastewater treatment plants as a pathway for microplastics: Development of a new approach to sample wastewater-based microplastics. Water Research, 112:93–99.
Ziajahromi S, Drapper D, Hornbuckle A, Rintoul L, and Leusch FDL. 2020. Microplastic pollution in a stormwater floating treatment wetland: Detection of tyre particles in sediment. The Science of the Total Environment, 713(136356): 136356.
Supplementary material
Supplementary Material 1
- Download
- 161.76 KB
Supplementary Material 2
- Download
- 144.50 KB
Information & Authors
Information
Published In

FACETS
Volume 7 • Number 1 • January 2022
Pages: 1473 - 1492
Editor: Yang Liu
History
Received: 15 June 2022
Accepted: 18 October 2022
Version of record online: 12 December 2022
Copyright
© 2022 Wang et al. This work is licensed under a Creative Commons Attribution 4.0 International License (CC BY 4.0), which permits unrestricted use, distribution, and reproduction in any medium, provided the original author(s) and source are credited.
Key Words
Sections
Subjects
Authors
Author Contributions
JW, PAH, TH, MJH, RR, and CMR conceived and designed the study.
JW performed the experiments/collected the data.
JW and CMR analyzed and interpreted the data.
CMR contributed resources.
JW, PAH, TH, MJH, RR, and CMR drafted or revised the manuscript.
Metrics & Citations
Metrics
Other Metrics
Citations
Cite As
J. Wang, K. Bucci, P.A. Helm, T. Hoellein, M.J. Hoffman, R. Rooney, and C.M. Rochman. 2022. Runoff and discharge pathways of microplastics into freshwater ecosystems: A systematic review and meta-analysis. FACETS.
7(): 1473-1492. https://doi.org/10.1139/facets-2022-0140
Export Citations
If you have the appropriate software installed, you can download article citation data to the citation manager of your choice. Simply select your manager software from the list below and click Download.
There are no citations for this item