Snow, ponds, trees, and frogs: how environmental processes mediate climate change impacts on four subarctic terrestrial and freshwater ecosystems
Abstract
Amplified warming in subarctic regions is having measurable impacts on terrestrial and freshwater ecosystem processes. At the boundary of the discontinuous and continuous permafrost zones, and at the northern extent of the boreal forest, the Hudson Bay Lowlands has experienced, and is projected to continue to experience dramatic rates of climate change in the coming decades. In this review, we explore the impacts of climate change on terrestrial and freshwater ecosystems in the Hudson Bay Lowlands and other environmental processes that mediate these impacts. We surveyed published literature from the region to identify climate indicators associated with impacts on snowpacks, ponds, vegetation, and wood frogs. These climate indicators were calculated using statistically downscaled climate projections, and the potential impacts on ecosystem processes are discussed. While there is a strong trend towards longer and warmer summers, associated changes in the vegetation community mean that snowpacks are not necessarily decreasing, which is important for freshwater ponds dependent on snowmelt recharge. A clear throughline is that the impacts on these ecosystem processes are complex, interconnected, and nonlinear. This review provides a framework for understanding the ways in which climate change has and will affect subarctic regions.
1. Introduction
1.1. Climate change in the subarctic
Northern environments have been and continue to be impacted by human-caused climate change. In these regions, feedback between the loss of snow and ice and the absorption of solar radiation regionally amplifies the global warming signal, resulting in warming trends four or more times greater than the global average (Masson-Delmotte et al. 2021). This amplified warming is already having considerable impacts on marine and land ecozones, and thus on the people and their communities who live there (Kuzyk and Candlish 2019). As a result, climate change is exposing subarctic and arctic terrestrial and freshwater ecosystems to a multitude of stresses. Climate-related pressures disrupt the structure and function of these ecosystems, and the biodiversity of local flora and fauna. The capacity of the region to maintain a relatively narrow thermal window with upper and lower boundaries creates an environment able to support the presence of organisms that are not found elsewhere. Marginal temperature increases outside of this window could alter the species composition within these landscapes (Groffman et al. 2014). One of the greatest ecologically relevant thresholds in northern landscapes is the crossing of the zero degree Celsius marker in terms of frequency and duration, due to the state change of water at this temperature (Bonsal and Prowse 2003), especially relevant for subarctic regions that straddle this temperature on annual, seasonal, and diurnal timescales.
1.2. Hudson Bay Lowlands as a zone of change
The Hudson Bay Lowlands (HBL) is a coastal subarctic ecoregion that is North America's largest contiguous wetland complex. The HBL is situated at the boundary of the discontinuous and continuous permafrost zones and at the northern extent of the boreal forest, and as such, is a prime example of a geography poised to experience dramatic rates of climate change in the coming decades (Smith and Burgess 2004; Kaufman et al. 2009; Hochheim et al. 2010). Impacts of recent observable climatic change have been detected in pond sediment records in the region across several trophic layers, with diatoms showing the greatest degree of change of all indicators measured relative to pre-1850 baseline conditions (Rühland et al. 2014), both from direct climatic changes and thermokarst shoreline collapse (Morison et al. 2019). These paleolimnological records can be linked to modern diatom diversity and distribution to detect further consequences of ongoing climatic change within ponds of the HBL (Jacques et al. 2016).
The HBL is located at the intersection of several key ecological edges, including the boundary between discontinuous and continuous permafrost (Dyke and Sladen 2010), extent of treeline (Lescop-Sinclair and Payette 1995), and marine–terrestrial interface (Rouse 1991). The intersection of these edges provides a unique and valuable opportunity to examine the ecological impacts of climatic change across these transitions and provides testable hypotheses for how either side of these edges will respond. The HBL is a zone of rapid climate change, subjected to the series of forcings and feedback mechanisms that are responsible for much of the relatively accelerated warming and shift in precipitation characteristics at high latitudes. Because these climate-sensitive ecological edges are being subjected to rapid change, the HBL is a region where it is possible to track the migration and progression of these edges, such as range shifts in forest composition (Beck et al. 2011) or movement of the continuous permafrost edge (Zhang et al. 2008). Despite the presence of sharp edges delineating boundaries of and within the HBL, the HBL is also an example of a porous system, wherein the boundaries allow for fluxes of matter and energy in and outside of the geographic extent at multiple timescales, via migratory birds (Johnson et al. 2016; Koloski et al. 2016), caribou (Abraham and Thompson 1998), and exchanges between the terrestrial and marine systems. Therefore, climate-induced changes within the HBL are related to climate change in other regions via the fluxes of mass and energy across these boundaries.
1.3. Research questions and case study approach
The following research questions are framed to address the knowledge gaps associated with the rapidly changing, conservation-prioritized HBL: (i) What are the impacts of climate change on terrestrial and freshwater ecosystems in the HBL; and (ii) Do other environmental processes mediate these impacts? By addressing these gaps in the HBL region, we illustrate the complex, nonlinear, and feedback-driven impacts of climate change on ecosystems and identify the extent of gap missing in synthetic understandings of HBL and climatic change.
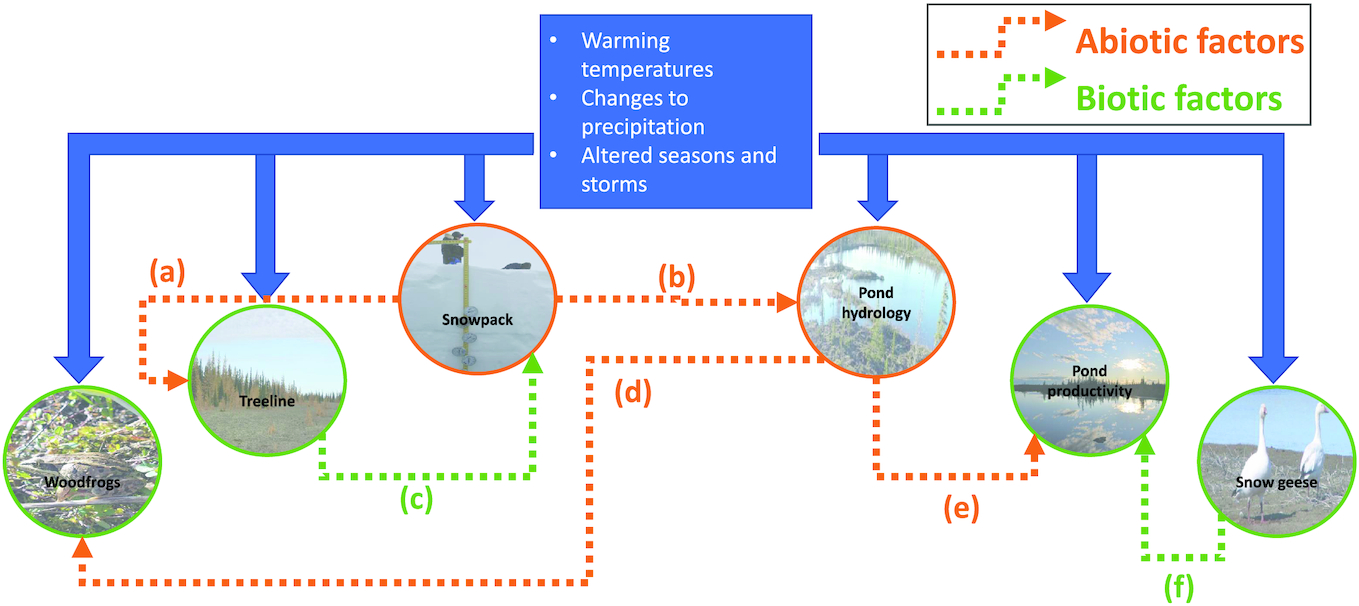
To explore these research questions, several illustrative case studies have been selected that span a range of interconnected subsystems within the HBL: snow, trees, ponds, frogs, and geese (Fig. 1). These case studies have been specifically selected as representative elements of terrestrial or freshwater ecosystems, which both show some degree of sensitivity to climate forcings while also providing internal mechanisms of resilience and resistance to these same forcings. In addition, these case studies provide an opportunity to examine feedback and mediating processes that affect the trajectory of ecosystem responses to climate change (Fig. 1). Understanding these interactions is crucial for projecting the magnitude and direction of ecological changes into the coming decades.
Fig. 1.
Within this case study approach, boundaries for this review are set in (i) spatial, (ii) temporal, and (iii) trophic dimensions (Fig. 2). These case studies are primarily based around evidence and observations from (i) a spatial domain of the western HBL, defined roughly as from the Ontario–Manitoba border to the western-most Hudson Bay coastlines, including watershed contributions from the upstream area, terminating at the estuary, (ii) a temporal period where direct observations of recent climatic change (temperature, precipitation, and seasonality/extremes) can be linked to direct observations of ecological processes, without relying on proxy-based evidence, i.e., from scales of hours to decades, and (iii) a trophic structure examining abiotic and biotic processes centered around the base of the food web in terrestrial and freshwater systems.
Fig. 2.
2. Approach to quantifying climate indicators
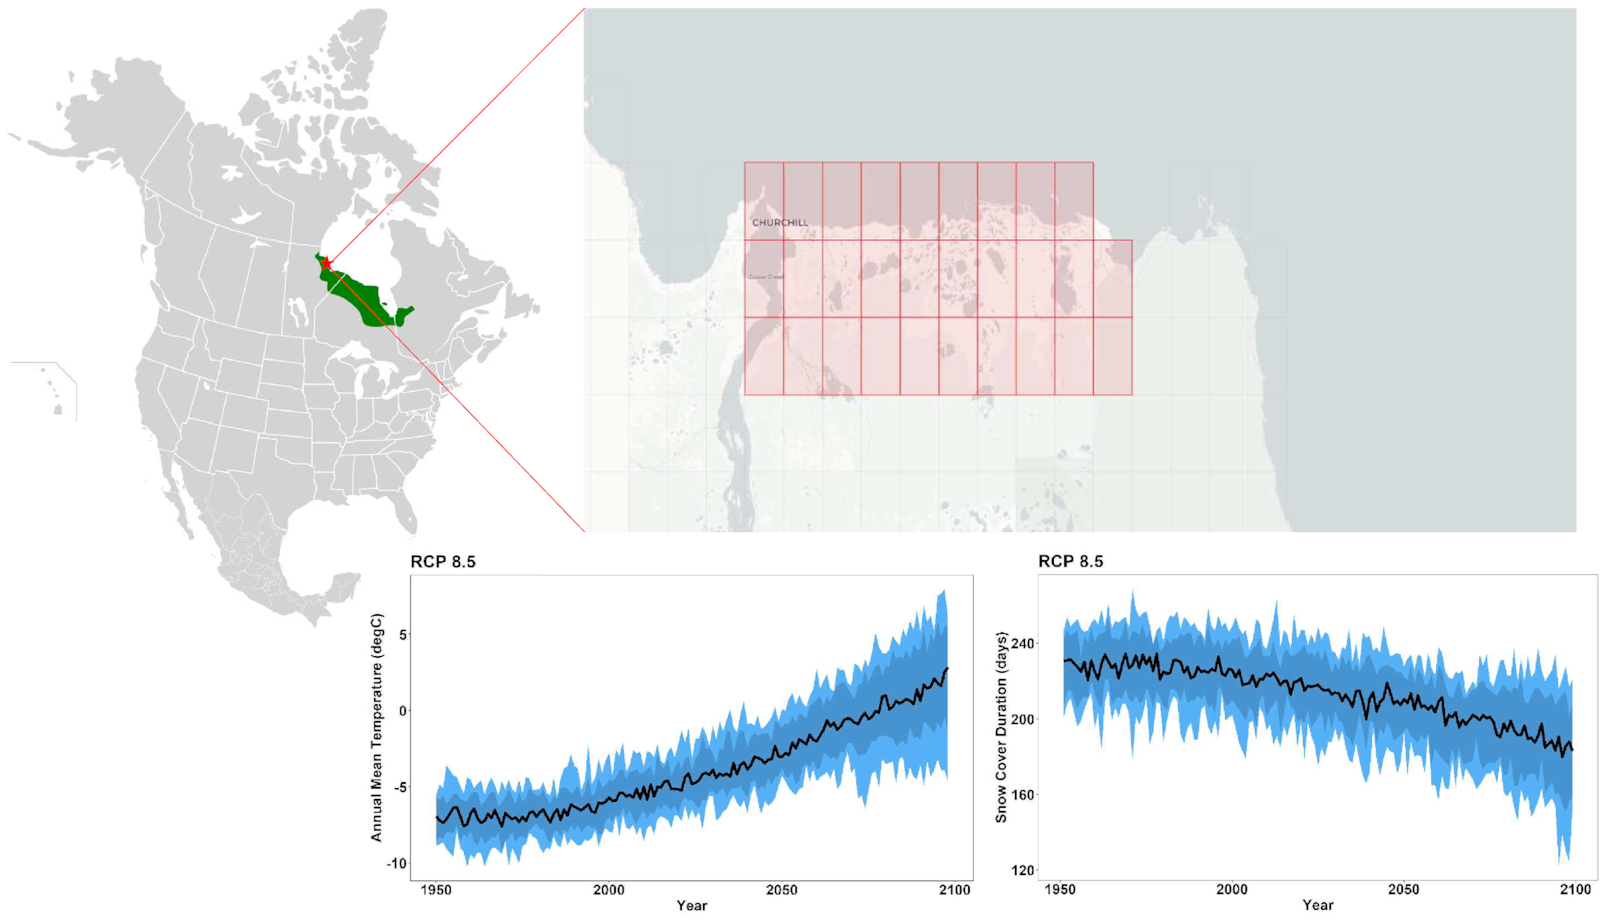
Future climate data were obtained from 24 models participating in the Coupled Model Intercomparison Project Phase 5 for daily outputs of maximum temperature, minimum temperature, and precipitation using representative concentration pathway (RCP) 8.5. A single carbon dioxide pathway was chosen, as ecologically forced models may show greater variability than using a single climate model under different carbon concentration trajectories (Ahlström et al. 2013).
Gridded data were obtained for the region of interest through the ClimateData.ca portal and spatially averaged over the entire domain (approximating 58.62945°N to 58.78447°N; 93.4437°W to 94.1623°W; Fig. 2). This publicly available dataset had been statistically downscaled by the Pacific Climate Impacts Consortium using the BCCAQv2 method, which is a combination of bias correction/constructed analogues (Maurer et al. 2010) and quantile delta mapping (Cannon et al. 2015). Sixteen ecologically relevant climate indicators (Table 1) were computed across the 24-model ensemble and represented by the ensemble median (Table 2). Periods of interest were selected as 1976–2005 (“recent past” hereafter), 2040–2069 (“mid-century”), and 2070–2099 (“end of century”), to align with standard ranges of future projections as well as a recently identified distinct climatological period associated with new treeline dynamics in the recent past (Mamet and Kershaw 2012). Indicator values were averaged over each of these three time periods and the ensemble mean is reported throughout.
Table 1.
| Indicator | Definition |
|---|---|
| Warming temperatures | |
| Maximum temperature (autumn, winter, June, July, frost-free season) | Mean daily maximum temperature over given time period for each year |
| Minimum temperature (winter, June, July) | Mean daily minimum temperature over given time period for each year |
| Mean annual temperature | Mean daily mean temperature during the entire year for each year, where Tmean = (tmin + tmax)/2 |
| Changes to precipitation and the water balance | |
| Potential evapotranspiration (PET) | Calculated on a monthly basis and totalled for each year using the Hargreaves method in the SPEI package |
| Annual water balance | Difference between monthly precipitation less PET, totalled for each year |
| Fraction snow* | Calculated using the snowmelt module of EcoHydRology as the fraction of annual precipitation partitioned as snowfall (e.g., fraction = snowfall/precipitation). |
| Seasonality and storms | |
| Maximum 1-day precipitation | Maximum annual daily precipitation for each year |
| Snowmelt start date* | Calculated using the snowmelt module of EcoHydRology as the first date with snowmelt >1 mm/day after the date of maximum snow water equivalent (SWE) (to avoid early/midwinter 1-day melt events) |
| Snow cover duration* | Calculated using the snowmelt module of EcoHydRology. Number of days with snow on ground (snow depth > 0) |
| Frost-free season length | Number of days between date of the last spring frost and date of the first fall frost (w/o any daily tmin ≤ 0 °C), where |
| Date of last spring frost = day after which Tmin > 0 °C; latest possible date set as July 15 | |
| Date of first fall frost = first date where Tmin ≤ 0 °C, forwards from July 15 | |
Note: Core analysis was done in R (R Core Team 2021), the EcoHydRology package was used for snow indicators (Fuka et al. 2018), and the SPEI package was used for potential evapotranspiration and related indicators (Beguería and Vicente-Serrano 2017).
*
All snow variables calculated for water years, e.g., Oct–Sept.
Table 2.
| 1976–2005 | 2040–2069 | 2070–2099 | |||||||
|---|---|---|---|---|---|---|---|---|---|
| Indicator | 10th | 50th | 90th | 10th | 50th | 90th | 10th | 50th | 90th |
| Warming temperatures | |||||||||
| Autumn maximum temperature (°C) | 0.6 | 0.9 | 1.1 | 3.4 | 4.5 | 5.4 | 4.6 | 6.7 | 8.3 |
| Winter maximum temperature (°C) | −20.8 | −20.4 | −19.8 | −16.4 | −13.9 | −12.4 | −14.2 | −9.9 | −7 |
| June maximum temperature (°C) | 11.4 | 11.8 | 12 | 12.9 | 14.8 | 16.7 | 14 | 17.3 | 20.7 |
| July maximum temperature (°C) | 17.4 | 17.7 | 18.2 | 19.1 | 21.2 | 23.1 | 20.5 | 23.8 | 26 |
| Frost-free season maximum temperature (°C) | 15 | 15.3 | 15.6 | 16.1 | 16.8 | 17.7 | 16.5 | 17.8 | 19.6 |
| Winter minimum temperature (°C) | −28.9 | −28.4 | −27.8 | −23.8 | −21.3 | −18.9 | −20.9 | −16.9 | −13.1 |
| June minimum temperature (°C) | 2.4 | 2.6 | 2.8 | 3.9 | 5.7 | 8.3 | 5.6 | 8.4 | 11.9 |
| July minimum temperature (°C) | 7.6 | 7.7 | 8 | 9.2 | 11.4 | 13 | 11 | 13.8 | 16.1 |
| Mean annual temperature (°C) | −6.6 | −6.4 | −6.2 | −3.5 | −2.3 | −0.7 | −1.5 | 0.6 | 3.4 |
| Changes to precipitation and the water balance | |||||||||
| Potential evapotranspiration (mm) | 354.5 | 360.1 | 366.6 | 384.6 | 411.7 | 437 | 392.9 | 453.6 | 497.8 |
| Annual water balance (mm) | 71.9 | 81 | 95.2 | 43.2 | 81.5 | 129.2 | 21.4 | 76 | 161.7 |
| Fraction of annual precipitation as snow (mm:mm) | 0.398 | 0.416 | 0.431 | 0.353 | 0.382 | 0.4 | 0.334 | 0.361 | 0.408 |
| Seasonality and storms | |||||||||
| Maximum one day precipitation (mm) | 25.3 | 27 | 29.4 | 28.8 | 32 | 4.5 | 30.2 | 34 | 37 |
| Snowmelt start date | 02 May | 04 May | 09 May | 21 Apr. | 28 Apr. | 03 May | 11 Apr. | 23 Apr. | 29 Apr. |
| Snow cover duration (days) | 222.8 | 225.3 | 227.8 | 195.2 | 204.9 | 214.1 | 178 | 188.9 | 207.5 |
| Frost-free season length (days) | 91.5 | 96 | 102.2 | 114.5 | 126.6 | 141.3 | 127.5 | 145.4 | 160.5 |
3. Warming temperatures
The trends in temperature in the HBL region are clear and consistent. Maximum, minimum, and average temperatures are projected to rise in all seasons, but the rate of increase depends on the indicator under consideration. Some of the most dramatic changes in temperature are projected in the winter season, where both minimum and maximum temperatures may be more than 10 °C warmer by the end of the century compared with the recent past (Table 2). However, many ecological processes are sensitive to temperature changes at certain points in the year, given their particular annual patterns. As such, it is important to be specific when considering the impact of warming on terrestrial and aquatic ecosystems.
Canada's arctic treeline represents a critical biogeographic boundary, separating the boreal forest from the tundra. With climate warming, the treeline has been predicted to potentially move polewards by hundreds of kilometres and upslope by hundreds of metres (MacDonald et al. 1998; Leng et al. 2008). Studies in the Churchill region show a strong correlation in temperature and tree ring width during the early growing season, June–July (Girardin et al. 2005; Tardif et al. 2008; Mamet and Kershaw 2013), where increasing maximum June (11.8–17.3 °C) and July (17.7–23.8 °C) daily maximum air temperatures are projected from the recent past to the end of this century (Table 2). In particular, tamarack trees have experienced the greatest growth and at unprecedented rates in recent years (1980–2006) relative to other tree species. Annual growth has shown a strong correlation to climate, and in particular, autumn temperatures (Girardin et al. 2005; Mamet and Kershaw 2013), where the autumn maximum temperature is expected to continue to increase from 0.9 to 6.7 °C from the recent past to the end of this century in the HBL (Table 2). Along with increased tree growth, studies have also found a threefold increase in tree density at three separate sites in the Churchill region, as a result of increased recruitment (Mamet and Kershaw 2012).
While strong correlations have been found with warmer temperatures and increased tree growth and density, other factors could alter the predicted growth and movement of the treeline. Fine-scale treeline and vegetation positions are dependent on local climatic (Harsch et al. 2009; Grafius et al. 2012), biotic, and topographic variables (Cairns and Moen 2004; Macias-Fauria and Johnson 2013; Brown and Vellend 2014) as well as the actual treeline form (i.e., diffuse, abrupt, tree island, krummholz; Mamet et al. 2015). In particular, tree islands, which act as key areas of overwinter snow water equivalent (SWE) accumulation, have been identified as a key hotspot for potential future recruitment with the potential to form a positive-feedback mechanism for future treeline range expansion (Fitzpatrick et al. 2020), although some evidence suggests that changing temperature–snow depth interactions outside of optimal ranges may result in reduced seedling occurrence (Hättenschwiler and Smith 1999). Therefore, understanding these local changes in treeline and tundra vegetation is crucial to forecast/understand how future warming trends will influence the terrestrial environment within the Churchill region (Chapin et al. 2005; Tinner et al. 2008; Mamet et al. 2015).
Flat topography and flow restrictions in permafrost peatlands frequently result in small terminal ponds in patterned ground, ribbed fens, headwater lakes, and other lentic surface water bodies, in either closed basin or flow-through systems (Duguay and Pietroniro 2005; Boike et al. 2008; Laurion et al. 2010). The majority of surface water features in permafrost landscapes are typically shallow and small (<1 ha; Muster et al. 2013). These small water bodies have less total storage capacity than larger temperate systems and thus are sensitive to climatically driven changes in pond hydrology and nutrient cycling. In the HBL, 25%–40% of the land surface is covered by shallow water bodies (Duguay and Lafleur 2003). These ponds range from 400 m2 to 0.04 km2 in surface area and from 0.1 to 1 m in depth (Macrae et al. 2004). These ponds play important roles in surficial energy balance (Eaton et al. 2001), water budget (Boudreau and Rouse 1995), supporting diverse benthic communities (Bonilla et al. 2005), and carbon cycling and storage (Macrae et al. 2004). Increasing temperatures and nutrient input are some of the main drivers that ultimately result in alterations of the primary productivity of these pond systems (Hobbie et al. 1999; Flanagan et al. 2003). In general, northern aquatic ecosystems exhibit lower productivity as compared with their southern counterparts due to cooler temperatures. It is predicted that from the recent past to the end of this century, increased summer temperatures at the air–water interface (July maximum temperatures increasing from 17.7 to 23.8 °C; Table 2) may result in an increase in arctic and subarctic freshwater productivity (Rouse et al. 1997; Hobbie et al. 1999; Chapin et al. 2005; Prowse et al. 2006; Eichel et al. 2014; Wrona et al. 2016).
These pond and wetland habitats of the HBL support the only two species of amphibians that can withstand the harsh northern climate of the region: the wood frog (Lithobates sylvaticus) and the boreal chorus frog (Pseudacris maculata). While there is currently no evidence to suggest a decline in the local populations of these two species, their subarctic location makes them susceptible to climatic influence, particularly given that they are poikilotherms and therefore strongly influenced by their external environment. An amphibian's basic physiological functions (i.e., growth, development, reproduction, and locomotion) are dependent on environmental temperature, specifically during the larval life stage (Orizaola and Laurila 2009). As June maximum temperatures (as a proxy for when the animals are in their larval life stage period; Davenport et al. 2017) in the HBL are projected to increase from 11.8 to 17.3 °C between 1976–2005 and 2070–2099, the effects could be beneficial to frog larvae through increased growth rates, and a reduction in time to metamorphosis resulting from increased wetland temperatures (Blaustein et al. 2010). In the Churchill area, warmer water temperatures (increased by 1 °C) increased the survival and development rate of wood frog tadpoles by a factor of 1.8 and increased the overall size of the tadpoles by 16% at the end of 30 days (Davenport et al. 2017). Given the strong coupling of water temperature to air temperature in the region in shallow water bodies (Bello and Smith 1990), increases in the annual maximum air temperature (from 15.3 to 17.8 °C from the recent past to the end of this century; Table 2) are likely to result in dampened but similar patterns to tadpole habitat. Other studies conducted within the wood frog's range determined that larger juveniles and individuals that metamorphosed early experienced higher survival rates, earlier ages at first reproduction, and had larger body sizes as adults (Berven 1990). While these temperature increases remain beneath known thermal maximum for wood frog tadpole (Castano et al. 2010; Table 2), the capacity for temperatures to temporarily exceed these maxima could result in decreased survival during extreme temperature events.
While the direct effects of warming temperatures on organisms are evident in the examples described above, in the complex ecosystem of the HBL, there are several factors that mediate these impacts. These mediating factors mean that the expected increases in growth, range expansion, or evapotranspiration may not be observed directly or as quickly as expected if the processes were solely driven by changes in climate. One well-studied example of this is the relationship between climate change projections and net changes in biomass and productivity. While some projections suggest net greening in the region (i.e., net increases in biomass; Sturm et al. 2001), others suggest net browning (Walker and Johnstone 2014; Phoenix and Bjerke 2016), or complex interactions between the two (Myers-Smith et al. 2020). If tundra productivity rises, an increase in the abundance of shrubs is a likely outcome (Myers-Smith et al. 2011). Over the last 50 years, shrub expansion has been observed throughout the arctic tundra. Already there is evidence of shrub-tundra replacing tussock-tundra along the southern limit of the Alaskan tundra (Sturm et al. 2001; Myers-Smith et al. 2011). The characteristics and spatial arrangement of vegetation are an important influence in the formation and evolution of snow depth in the tundra (Fig. 3). As shrubs increase the snow-holding capacity of the arctic landscape, an increase in shrub abundance would have important implications for the snowpack in a subarctic environment. Where the landscape transitions from willow-dominant, to shrubby tundra, to tussock-tundra, Sturm et al. (2001) observed a corresponding decline in snow depth, in conjunction with a decline in the overall height and abundance of shrubs. Permafrost thaw, both gradual (active layer thickening) and rapid (loss of periglacial features such as palsas and pingos), could result in changes in snowpack distribution, such as a reduction in snow drifting (Seppälä 2011). From such observations, it can be surmised that the tundra could experience deeper snowpacks in the future, as shrubs increase in density and extent.
Fig. 3.
In the windswept areas near treeline, where arboreal vegetation is sparse, cool soil temperatures are common. Soils under closed forests are also cooler due to shade (Mamet and Kershaw 2013; Mamet et al. 2015). Increasing June (2.6–8.4 °C, from the recent past to the end of this century) and July (7.7–3.8 °C) daily minimum air temperatures as well as changes to shallow active layer moisture regimes altering the thermal conductivity of shallow peat soils may alter the present cool soil temperature regime. Currently, this soil temperature can limit the production of dry matter, restrict root growth, and delay photosynthetic reactivation in the spring (Tranquillini 1979; Mamet et al. 2015). In addition to the direct impacts of wildfire on slowing treeline advance (Timoney et al. 2019), postfire soil thermal regimes may also affect recovery trajectories (Morison et al. 2020).
For amphibian populations, there is a trade-off between the rate of development and growth, which could be exacerbated by climate change (Blaustein et al. 2010). In general, the rate of development increases as temperatures rise, often by shortening the larval period (Balustein et al. 2010). Davenport et al. (2017) found that the size at which L. sylvaticus individuals metamorphosed decreased slightly by approximately 5.5% with 1 °C of warming. This minor cost suggests that a response to environmental change that produces rapid development, and allows for an earlier departure from winter ponds, is not likely a primary threat to the fitness of frogs at northern latitudes (Davenport et al. 2017). However, if increased climate warming shortens the wetland hydroperiod, then future individuals might experience a further reduction in size at metamorphosis, thus impacting their probability to survive their first winter, to survive to their first breeding, and for female frogs, impacts on clutch size (Bishir et al. 2018). Alternatively, earlier emergence and continuing warmer temperatures may allow for longer foraging periods, where the HBL is projected to experience an increase in July maximum daily temperatures from 17.7 to 23.8 °C from the recent past to the end of this century (Table 2), which could compensate for smaller sizes at emergence (Benard 2015), although some limits to the plasticity of development may be near physiological capacity (Davenport et al. 2017). Both scenarios, changes in metamorphosis date and foraging activity during the active season, will influence time to sexual maturity, movement, and overwintering potential, which has not been directly observed in the HBL but other northern populations appear to demonstrate this mechanism (Amburgey et al. 2018; Fitzpatrick et al. 2020).
4. Changes to precipitation and the water balance
Trends in precipitation in the HBL are less uniform than trends in temperature. There are few, if any, substantive changes in precipitation metrics projected (Table 2). There is a clearer increase in potential evapotranspiration, from 360 mm in the recent past to 453 mm by the end of the century. Similarly, the fraction of annual precipitation as snow is projected to decrease, consistent with shorter winters and later onset of freezing temperatures (Table 2). These changes in precipitation have important implications for both terrestrial and aquatic ecosystems across the HBL.
Condensed snow drifts or snowpacks are a critical part of the HBL, providing physical protection to vegetation from the abrasion of blowing snow, and acting as insulative layers, reducing soil desiccation during winter months (Essery and Pomeroy 2004). Specific characteristics of a snowpack can influence the surrounding landscape on both a physical (e.g., meltwater production and heat flow) and a biological (e.g., plant phenology and invertebrate populations) level (Kershaw and McCulloch 2007). Warming arctic temperatures will likely change snow cover characteristics, however, recent work suggests that this relationship may not be consistent across all regions of the subarctic. Some studies have found long-term significant increases in the seasonal snow depth in Europe and Asia (Kohler et al. 2006; Bulygina et al. 2009), whereas other studies have found significant snow depth decreases over parts of northern Canada (Atkinson et al. 2006). Globally, trends in SWE have also varied regionally, where SWE has increased over Eurasia and northern Russia, but decreased over northern Canada (Bulygina et al. 2010; Kong and Wang 2017).
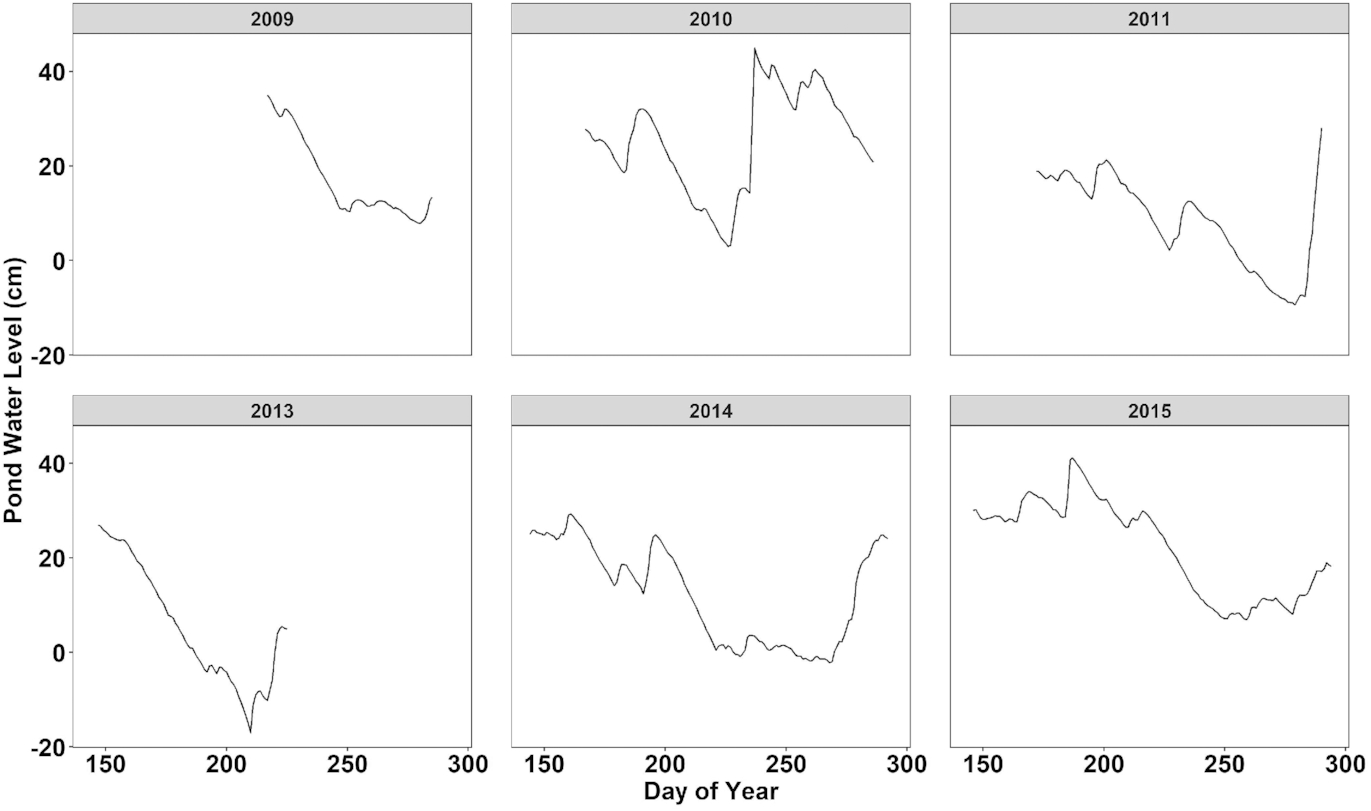
The small and shallow nature of ponds in the HBL renders them vulnerable to hydroclimatic stresses. Two separate hydrologic regimes annually control the water balance of these ponds. First is the accumulation of snow over the winter period before a relatively rapid melt and initial recharge of pond storage. Second, a gradual decline in water levels over the summer is primarily controlled by the difference between liquid-phase precipitation and evapotranspiration (Fig. 4). Currently, of these two components, winter SWE accumulation remains an important part of the annual water budget for ponds (Schindler and Smol 2006), although high shrub growth (Robinson et al. 2021) and relief allow for the trapping and redistribution of snow in low-SWE years (Bouchard et al. 2013).
Fig. 4.
Following the snowmelt period, within the summer water balance, potential evapotranspiration is expected to increase (360–454 mm from the present to the end of the century), with an approximately equal increase in annual precipitation. Previous work using historical imagery analysis and modelling of summer water balance in the HBL concluded that ponds in this region are not vulnerable to summer drying and may instead be at risk for great expansion due to a lack of evaporation increase coincident with increases in precipitation in the future (Macrae et al. 2014). This is consistent with future water balance projections that show no substantive changes in the difference between annual precipitation and potential evaporation between the recent past (80.1 mm) and the end for this century (76.0 mm), although mid-summer drying events may still be possible. As a result of warming, a shorter larval period for tadpoles increases the likelihood that individuals will successfully metamorphose before pond desiccation, and consequently increases the chance of overall survival and future reproductive success (Berven 1990; Blaustein et al. 2010). This is increasingly important as warmer subarctic temperatures also threaten the hydroperiod of the ponds and wetlands (Davenport et al. 2017).
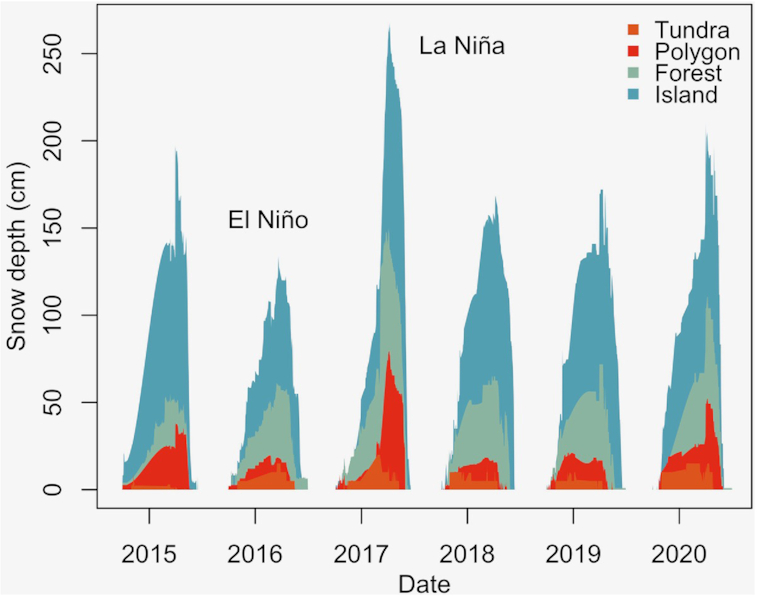
In the Churchill area, the organization of the vegetation significantly impacts the characteristics of the wind, and in turn, causes variation in the snowpack (Scott et al. 1993; Kershaw and McCulloch 2007). During the winter months, this vegetation interacts in several ways with the snowpack. In general, portions of the landscape with little to no plant presence experience wind erosion and redistribution of snow to the forested and shrubby areas. Conversely, a larger volume of plant cover leads to little erosion and redistribution, and thus results in a high accumulation of snow (Essery and Pomeroy 2004; Kershaw and McCulloch 2007). In their study on midwinter snowpacks, Kershaw and McCulloch (2007) observed that the surface roughness of the forests and tree islands accumulated up to 18× the mean snow-water-equivalent, in comparison to the open tundra. Essery and Pomeroy (2004) simulated a 1 m threshold, at which shrub density could hold the maximum amount of snow. This suggests that dense areas of shrubs could have as comparable an impact on snowpack as forested areas. In many studies, the deepest snow has been associated with areas of tall, dense shrubs, frequently near riverbanks, resulting in approximately tripled snow accumulation (Scott et al. 1993; Sturm et al. 2001). Moreover, El Niño and La Niña teleconnections may have a considerable influence on fine-scale patterns of snow accumulation (McClung 2013; Fig. 3).
The summer pond water balance is controlled by the differences in precipitation minus evapotranspiration, particularly in ombrogenic peatland catchments in the HBL and other subarctic environments (Rouse et al. 1997). The frequency and intensity of storms relative to the timing and amount of potential evapotranspiration and other water losses will determine the magnitude of water table variability. At the landscape scale, encroachment of trees into the tundra could facilitate dispersal and colonization of new or additional ponds in the future (Bishir et al. 2018). This could mediate the effects of ponds drying or unsuitable habitat and allowing for additional population recruitment. However, decreases in snowpack during the winter could have negative effects on the body condition of wood frogs, which could reduce reproductive output but allow for earlier foraging (Benard 2015; O'Connor and Rittenhouse 2016).
5. Seasonality and storms
Boreal ecology is dominated by role of cold temperatures and snowy conditions on boreal ecology, in which “any ecological study in northern environments is a study of winter impacts” (Pruitt 1978). Changes to the shifting seasonality and relative length and strength of winter will likely play a large role in the HBL. Changes to winter precipitation could be as important than rising temperatures to snowmelt phenology in this region. Despite warmer temperatures, increased winter snowfall has led to delayed snowmelt (up to 0.2 days/year in the last 21 years) in the Canadian Arctic (Bjorkman et al. 2015), However, in the HBL, the initiation of snowmelt is projected to move earlier from an average of May 4th for the period 1976–2005 to an average of April 23rd for the period 2070–2099, and a decrease in annual snow cover duration from 225 to 189 days for the same period. In this condensed winter season, the proportion of annual precipitation as snow will decrease from 41.6% in 1976–2005 to 36.1% in 2070–2099, as well as the initiation of snowmelt is anticipated to occur earlier under a changing climate (from May 4th in the recent past to April 23rd at the end of this century).
The length of the growing season is important for plant communities, but studies across the subarctic have shown that the direction and magnitude of change are very species specific (Richardson et al. 2013). Tree ring studies in Churchill suggest that both late spring warmth and late onset of snow in the fall were correlated with biomass accumulation in white spruce (Tardif et al. 2008). Of the three main species of trees found in Churchill (tamarack, white spruce, and black spruce), tamarack has experienced the greatest growth at the treeline and has shown an increasing sensitivity to the lengthening growing season (Mamet and Kershaw 2013; Mamet et al. 2019). Given projections that the length of the frost-free season will increase from 96 to 145 days from the recent past to the end of this century, unravelling these species-specific responses is key to understanding trajectories of tree community dynamics.
Snowmelt is often the greatest single annual hydrologic input in subarctic regions and may represent up to one half of annual water budget inputs within a period of a month or less (Carey and Woo 2001), although snowmelt hydrographs are dominated by near-surface old water chemical signatures (Hayashi et al. 2004; Carey et al. 2013). Thus, summer season water budgets are sensitive to the magnitude and timing of the winter snowpack and vulnerable to drying with decreases in snowfall. Bouchard et al. (2013) demonstrated that a peatland pond in the HBL was susceptible to unprecedented summer desiccation following a low melt runoff spring. In addition to atmospheric components of the water balance, pond and wetland hydrologic storage and transport processes in the HBL and other permafrost regions are frequently governed by “fill-and-spill” dynamics (Spence and Woo 2002, 2003). Fill-and-spill systems are characterized by a series of storage units divided by topographic features, each serving a storage function until its storage capacity is exceeded and excess water spills into the next storage unit in the elevational sequence, demonstrated for a pair of instrumented pond catchments in the HBL wherein runoff generation was not initiated until static storage thresholds were exceeded (Morison et al. 2017a). This complex hydrology means that water budget responses to increases in temperature and changes to precipitation will be heterogeneous across the landscape.
Most ponds in this region are oligotrophic based on low concentrations of available nutrients and low algal biomass in the water column (Bos and Pellatt 2012). Generally, additional nutrient inputs to ponds incite phytoplankton growth, leading to a darkening of the water column and decreased light availability for phytobenthos from both organism growth and dissolved/suspended nutrient loadings (Rautio et al. 2011). However, Eichel et al. (2014) found through controlled nutrient amendments to microcosms that the shallow subarctic freshwater ecosystems are able to respond rapidly to an increased supply of inorganic nutrients from an external source that is likely to occur if climate warming continues. The uptake of these nutrients is also reliant on lake sediments and their associated benthic communities to process the nutrient inputs. Additionally, ponds in the HBL are extremely sensitive to evaporative desiccation, especially in years of low snowmelt (Bouchard et al. 2013; MacDonald et al. 2017). Increases in open-water evaporation (projected to increase by nearly 25% from the recent past to the end of this century) could increase evapoconcentration (Morison et al. 2017b) and potentially lead to a further increase in productivity within HBL freshwater ecosystems. Changes to in-pond primary production could have implications for higher trophic levels within the food web, including wood frog and boreal chorus frog food availability (Stephens et al. 2015), although these increases could be curbed by pond temperatures approaching algal thermal maximum tolerance values (Chen 2015).
The magnitude of rainstorms is expected to increase, from an annual single-day maximum precipitation of 27–34 mm from the recent past (1976–2005) to the end of the century (Table 2), although projected changes to summer precipitation are extremely varied across space, and generalizations are therefore more difficult (Shook and Pomeroy 2012; Harder and Pomeroy 2013). Across multiple years, short-term (i.e., hour-to-hour) variations in pond chemistry exceeded seasonal-scale variation in pond chemistry (Morison et al. 2017a, 2017b), illustrating the potential of individual precipitation events to dictate factors mediating pond hydrochemical responses to climatic change. The relative vulnerability of these shallow pond and wetland systems to short-term, event-based hydrochemical changes may be controlled hydrologically, particularly for conservative chemical species, in which the relative proportion/contribution of new and old water will dictate the extent of these short-term responses. For more bioavailable chemical species such as mineral nutrient forms, the arrival of nutrients to ponds in short pulses may be rapidly taken up, on a timescale of hours to days (Eichel et al. 2014). The resulting productivity and increased phytoplankton biomass (Symons et al. 2012) could serve a function of additional aquatic carbon uptake, potentially forming a negative feedback with climate change, and maybe act as an additional food source for wood frogs and boreal chorus frogs.
In addition to stressors of direct climate forcing, there has been a dramatic increase in features indicative of permafrost decay in a subarctic peatlands in the HBL (Payette 2004), including thermokarst ponds and plateau collapse scars, which can act as a vector of nutrient mineralization (Morison et al. 2018) and redistribution into ponds (Morison et al. 2019). Permafrost is particularly vulnerable to changing seasonality. The loss of a steeper thermal gradient in winter (with winter daily maximum temperatures warming from −20.4 to −9.9 °C and minimum temperatures warming from −28.4 to −16.9 °C in the period from 1976–2005 to 2070–2099) may result in gradual or rapid permafrost thaw. Modelling work suggests that while permafrost may persist across much of the HBL region to the end of the 21st century, the spatial extent of continuity, active layer depth, and the duration of frozen and thawed conditions may show extreme fluctuations with climatic variability, with corresponding impacts on the distribution of surface water and pond chemistry (Zhang 2013). Permafrost thaw interactions with other forms of disturbance, such as increased frequency and severity of wildfires, are known to impact pond hydrology and chemistry (Gibson et al. 2018; Granath et al. 2021).
6. Uncertainties associated with future climate change
The climate in the HBL is changing rapidly and predictably, although projections of temperature changes are more certain than projections to precipitation changes. This climatic change has had measurable direct impacts on the ecosystem across several concrete examples, illustrated in this review: snowpack, trees, ponds, wood frogs, and lesser snow geese. While ecosystem impacts can be mediated by other environmental factors, as illustrated above, the future magnitude and direction of these impacts may also be underestimated based solely on monotonic projections of temperature and precipitation. In this section, we discuss four key suggested areas of future research associated with impacts of climatic changes, which are critical to understanding future trajectories of ecological processes.
6.1. Tipping points
There is a lack of predictability associated with projections that cross ecological tipping points (Brook et al. 2013). Much of the evidence synthesized in this paper represents ecological “snapshots” of season to annual time periods, and known relationships between climatic variables and ecosystem processes may not continue to behave in their current state as thresholds are crossed. For example, as winter daily minimum temperatures increase and ponds no longer freeze to the bottom, increases in pond temperatures beyond 0 °C are likely to have different impacts than increases in pond temperature within the freezing range (i.e., from −10 to −5 °C). The mean annual temperature for the recent past in Churchill is −6 °C, but projections indicate that the mean annual temperature will rise above 0 °C in approximately 2078. Nonlinear patterns may also arise as a function of larger scale climate-driven changes, such as the shift to an increasingly ice-free Hudson Bay (Andrews et al. 2018; Notz and SIMIP Community 2020). Given the role that sea ice plays in regulating temperature and precipitation patterns in the HBL (Rouse 1991) and projections that the Arctic may be ice-free well before the end of the century (Notz and SIMIP Community 2020), the impacts on climate-dependent ecosystem processes may be profound. While climate change in the HBL is direct and linear now, and projections are that these trends will continue in the near future, we may not expect continued linearity as thresholds begin and continue to be crossed.
6.2. Extreme events
Changes to the timing, frequency, and intensity of extreme events may override the impacts of monotonic changes in climate in the HBL ecosystem. While projecting these types of extreme events is challenging, there is some indication that the intensity and frequency of precipitation events will increase across the region (Braun et al. 2021). For example, a large snowstorm swept through Churchill, Manitoba in March 2017, which blanketed the region with 60 cm of snow, and impacted not only the terrestrial environment, but also the sea ice deformation on Hudson Bay (Lukovich et al. 2021). When large precipitation events occur during the ice-free season, they can have outsized consequences for pond ecosystems. For instance, pond hydrochemistry has been shown to be more variable within and following a 24 h period surrounding a large precipitation event than an entire ice-free season of variation (Morison et al. 2017b). In fragile and complex ecosystems such as the HBL, extreme events can result in state changes and reset the impacts of other climate-driven changes. The trajectories of the ecological processes discussed in this paper will certainly depend on the future regime of extreme weather events.
6.3. Feedback from other trophic levels
The impacts of climate change on the ecology of higher trophic levels in the HBL terrestrial and aquatic ecosystem are complex, and have been discussed in other literature (e.g., Tam et al. 2014; Persaud et al. 2015; Kent et al. 2018; Brook et al. 2021). There are some notable ways in which higher trophic levels interact with and may mitigate impacts of changes in climate on the case studies of terrestrial and freshwater ecology examined in this review. These effects are especially pronounced given the low productivity landscape of the HBL, where food web complexity is low and therefore susceptible to disturbance (Post et al. 2009). For example, Arctic foxes in the western HBL have been shown to alter and fertilize their denning habitat, resulting in redistribution of nutrients and patches of enhanced productivity (Gharajehdaghipour et al. 2016). Range contraction of foxes due to climate warming and the loss of winter food sources (Roth 2002) may alter this process, with consequences for the distribution and availability of local vegetation and soil nutrients. These engineering activities show examples of the interconnectedness of systems that can scale both spatially and through time, and the complexity of interactions that may act as either mitigating or exacerbating factors, providing either resilience to, or acceleration of, impacts of climatic change in the HBL.
A second example is the impact of increases in the Lesser Snow Goose population on ponds and their catchments. As a result of land use changes in their wintering grounds, the Lesser Snow Goose expanded in population and geographic extent within the western HBL during the second half of the 20th century (Batt 1997; Jefferies et al. 2003), although the population may have stabilized more recently (Baldwin and Leafloor 2018). The impacts of snow geese disturbance on pond catchments include grubbing of vegetation, soil disturbance, and deposition of feces (MacDonald et al. 2015), while ponds themselves are subject to increases in each of alkalinity, nitrogen and phosphorus concentrations, productivity, chemically enhanced CO2 invasion, and catchment runoff (MacDonald et al. 2014). As nutrient-limited systems receive nitrogen and phosphorus inputs as a result of Lesser Snow Goose impacts, enhanced terrestrial and aquatic production could be triggered (Cargill and Jefferies 1984), coupled with pH-driven benthic algae carbon demand (MacDonald et al. 2014), resulting in increased atmospheric carbon uptake (Macrae et al. 2004). Warmer temperatures have led to a mismatch in timing between goose migration timing and plant green-up, which may curtail future population growth (Aubry et al. 2013) and therefore the effects of the geese on terrestrial and freshwater ecosystems.
6.4. Subregional variability and wider applicability
Within the HBL, there are varying levels of uncertainty around the impacts of climate changes across subregions and regional-specific impacts of climate change, distinct from other western and central Canadian Arctic environments (Kuzyk and Candlish 2019). For example, runoff is projected to increase within the eastern HBL with high certainty under a changing climate, while projections to western HBL runoff regimes are less certain due to greater variability in climate projections (Déry et al. 2016). Divergent hydrological responses have been observed on scales of individual ponds just hundreds of metres apart (Wolfe et al. 2011; Fig. 4), potentially driven by highly localized permafrost thaw. This subregional variability should be carefully considered when scaling the impacts observed at single sites or within individual regions across the landscape.
7. Conclusions
The HBL is a region of complex, interconnected ecosystems that are sensitive to the rapidly changing climate of the subarctic. Rising temperatures, declining snowpacks, and changes to precipitation regimes affect the physical environment and associated ecological processes. By identifying specific climate indicators associated with impacts on snowpacks, ponds, vegetation, and wood frogs, we provide tangible and urgent examples of the changes that have occurred and will continue to occur into the future (Fig. 1). However, the effects of climatic changes in this region can be nonlinear and driven by feedback from other ecosystem components. For example, despite clear trends towards warmer winters with shorter snowpack durations, changes to the vegetation community may lead to deeper snowpacks in this region (Fig. 1a). Given that pond hydrology depends largely on recharge from snowmelt, future trajectories of these aquatic ecosystems will depend not only directly on changes in temperature and precipitation but also in the ways in which the spatial distribution of vegetation changes in response to warmer air and soils (Figs. 1b and 1c). Aquatic ecosystem primary productivity, with implications for higher trophic levels, such as amphibian populations, depends closely on pond hydroclimatology (Figs. 1d and 1e) and inputs and outputs across other ecological edges, such as avian influences (Fig. 1f). While the case studies described above are specific to the western HBL, these types of climate-driven changes and interactions are ubiquitous across the subarctic. Using a framework such as the one explored here may help unravel the complex and nuanced ways in which climate will continue to affect ecological processes into the future.
Acknowledgements
The research conducted and synthesized in this paper took place on the lands of the Cree, Dene, and Inuit peoples and Métis nation, in Treaty Five territory. Science staff from the Churchill Northern Studies Centre provided valuable coordination and literature suggestions at early stages of this project. SDM and LAF would like to thank the Earthwatch International volunteers (“sub-zero heroes”) for their contributions to this research. The Garfield-Weston Foundation and Wapusk National Park provided financial and logistical support. We wish to thank ClimateData.ca for providing the climate information used in this paper. ClimateData.ca was created through a collaboration between the Pacific Climate Impacts Consortium (PCIC), Ouranos Inc., the Prairie Climate Centre (PCC), Environment and Climate Change Canada (ECCC), Centre de Recherche Informatique de Montréal (CRIM), and Habitat7.
References
Abraham K.F., Thompson J.E. 1998. Defining the Pen Islands Caribou Herd of southern Hudson Bay. Rangifer, 18: 33.
Ahlström A., Smith B., Lindström J., Rummukainen M., Uvo C.B. 2013. GCM characteristics explain the majority of uncertainty in projected 21st century terrestrial ecosystem carbon balance. Biogeosciences, 10: 1517–1528.
Amburgey S.M., Miller D.A.W., Campbell Grant E.H., Rittenhouse T.A.G., Benard M.F., Richardson J.L., et al. 2018. Range position and climate sensitivity: the structure of among-population demographic responses to climatic variation. Global Change Biology, 24: 439–454.
Andrews J., Babb D., Barber D.G. 2018. Climate change and sea ice: shipping in Hudson Bay, Hudson Strait, and Foxe Basin (1980–2016). Elementa: Science of the Anthropocene, 6: 19.
Atkinson D.E., Brown R., Alt B., Agnew T., Bourgeois J., Burgess M., et al. 2006. Canadian cryospheric response to an anomalous warm summer: a synthesis of the climate change action fund project “the state of the arctic cryosphere during the extreme warm summer of 1998.” Atmosphere-Ocean, 44: 347–375. Taylor & Francis.
Aubry L.M., Rockwell R.F., Cooch E.G., Brook R.W., Mulder C.P.H., Koons D.N. 2013. Climate change, phenology, and habitat degradation: drivers of gosling body condition and juvenile survival in lesser snow geese. Global Change Biology, 19: 149–160.
Baldwin F.B., Leafloor J.O. 2018. Consecutive November nesting attempts by a wild Canada Goose (Branta canadensis) at 49.9° N latitude. The Wilson Journal of Ornithology, 130: 1047–1051.
Batt B.D.J. (Editor). 1997. Arctic ecosystems in peril: report of the Arctic Goose Habitat Working Group. U.S. Fish and Wildlife Service and Canadian Wildlife Service, Washington, D.C and Ottawa, ON.
Beck P.S., Juday G.P., Alix C., Barber V.A., Winslow S.E., Sousa E.E., et al. 2011. Changes in forest productivity across Alaska consistent with biome shift. Ecology Letters, 14: 373–379. Wiley Online Library.
Beguería S., Vicente-Serrano S.M. 2017. SPEI: calculation of the standardised precipitation-evapotranspiration index. Available from https://CRAN.R-project.org/package=SPEI [accessed 22 February 2022].
Bello R., Smith J.D. 1990. The effect of weather variability on the energy balance of a lake in the Hudson Bay Lowlands, Canada. Arctic and Alpine Research, 22: 98.
Benard M.F. 2015. Warmer winters reduce frog fecundity and shift breeding phenology, which consequently alters larval development and metamorphic timing. Global Change Biology, 21: 1058–1065.
Berven K.A. 1990. Factors affecting population fluctuations in larval and adult stages of the wood frog (Rana sylvatica). Ecology, 71: 1599–1608. Wiley Online Library.
Bishir S.C., Hossack B.R., Fishback L., Davenport J.M. 2018. Post-breeding movement and habitat use by wood frogs along an Arctic–Subarctic ecotone. Arctic, Antarctic, and Alpine Research, 50: e1487657.
Bjorkman A.D., Elmendorf S.C., Beamish A.L., Vellend M., Henry G.H. 2015. Contrasting effects of warming and increased snowfall on Arctic tundra plant phenology over the past two decades. Global Change Biology, 21: 4651–4661.
Blaustein A.R., Walls S.C., Bancroft B.A., Lawler J.J., Searle C.L., Gervasi S.S. 2010. Direct and indirect effects of climate change on amphibian populations. Diversity, 2: 281–313.
Boike J., Wille C., Abnizova A. 2008. Climatology and summer energy and water balance of polygonal tundra in the Lena River Delta, Siberia. Journal of Geophysical Research: Biogeosciences, 113.
Bonilla S., Villeneuve V., Vincent W.F. 2005. Benthic and planktonic algal communities in a high Arctic lake: pigment structure and contrasting responses to nutrient enrichment. Journal of Phycology, 41: 1120–1130.
Bonsal B.R., Prowse T.D. 2003. Trends and variability in spring and autumn 0 C-isotherm dates over Canada. Climatic Change, 57(3): 341–358.
Bos D.G., Pellatt M.G. 2012. The water chemistry of shallow ponds around Wapusk national park of Canada, Hudson Bay Lowlands. Canadian Water Resources Journal/Revue canadienne des ressources hydriques, 37: 163–175.
Bouchard F., Turner K.W., MacDonald L.A., Deakin C., White H., Farquharson N., et al. 2013. Vulnerability of shallow subarctic lakes to evaporate and desiccate when snowmelt runoff is low. Geophysical Research Letters, 40: 6112–6117.
Boudreau L., Rouse W. 1995. The role of individual terrain units in the water balance of wetland tundra. Climate Research, 5: 31–47.
Braun M., Thiombiano A.N., Vieira M.J.F., Stadnyk T.A. 2021. Representing climate evolution in ensembles of GCM simulations for the Hudson Bay System. Elementa: Science of the Anthropocene, 9: 00011.
Brook B.W., Ellis E.C., Perring M.P., Mackay A.W., Blomqvist L. 2013. Does the terrestrial biosphere have planetary tipping points? Trends in Ecology & Evolution, 28: 396–401.
Brook R., Pollock L., Abraham K., Brown G. 2021. Bird trends from long-term observation data at sites in the Hudson Bay Lowlands. Avian Conservation and Ecology, 16.
Brown C.D., Vellend M. 2014. Non-climatic constraints on upper elevational plant range expansion under climate change. Proceedings of the Royal Society B: Biological Sciences, 281: 20141779. Royal Society.
Bulygina O.N., Groisman P.Y., Razuvaev V.N., Radionov V.F. 2010. Snow cover basal ice layer changes over Northern Eurasia since 1966. Environmental Research Letters, 5: 015004. IOP Publishing.
Bulygina O.N., Razuvaev V.N., Korshunova N.N. 2009. Changes in snow cover over Northern Eurasia in the last few decades. Environmental Research Letters, 4: 045026. IOP Publishing.
Cairns D.M., Moen J. 2004. Herbivory influences tree lines. Journal of Ecology, 92: 1019–1024.
Cannon A.J., Sobie S.R., Murdock T.Q. 2015. Bias correction of GCM precipitation by quantile mapping: how well do methods preserve changes in quantiles and extremes? Journal of Climate, 28: 6938–6959.
Carey S.K., Woo M. 2001. Slope runoff processes and flow generation in a subarctic, subalpine catchment. Journal of Hydrology, 253: 110–129.
Carey S.K., Boucher J.L., Duarte C.M. 2013. Inferring groundwater contributions and pathways to streamflow during snowmelt over multiple years in a discontinuous permafrost subarctic environment (Yukon, Canada). Hydrogeology Journal, 21: 67–77.
Cargill S.M., Jefferies R.L. 1984. The effects of grazing by lesser snow geese on the vegetation of a sub-arctic salt marsh. Journal of Applied Ecology, 669–686.
Castano B., Miely S., Smith G.R., Rettig J.E. 2010. Interactive effects of food availability and temperature on wood frog (Rana sylvatica) tadpoles. The Herpetological Journal, 20(3): 209–211.
Chapin F.S., Sturm M., Serreze M.C., McFadden J.P., Key J.R., Lloyd A.H., et al. 2005. Role of land-surface changes in Arctic summer warming. Science, 310: 657–660.
Chen B. 2015. Patterns of thermal limits of phytoplankton. Journal of Plankton Research, 37(2): 285–292.
Davenport J.M., Hossack B.R., Fishback L. 2017. Additive impacts of experimental climate change increase risk to an ectotherm at the Arctic's edge. Global Change Biology, 23: 2262–2271.
Déry S.J., Stadnyk T.A., MacDonald M.K., Gauli-Sharma B. 2016. Recent trends and variability in river discharge across northern Canada. Hydrology and Earth System Sciences, 20: 4801–4818. Copernicus GmbH.
Duguay C.R., Lafleur P.M. 2003. Determining depth and ice thickness of shallow sub-Arctic lakes using space-borne optical and SAR data. International Journal of Remote Sensing, 24: 475–489. Taylor & Francis.
Duguay C.R., Pietroniro A. 2005. Remote sensing in northern hydrology: measuring environmental change. American Geophysical Union.
Dyke L.D., Sladen W.E. 2010. Permafrost and peatland evolution in the Northern Hudson Bay Lowland, Manitoba. Arctic, 63: 429–441. Arctic Institute of North America.
Eaton A.K., Rouse W.R., Lafleur P.M., Marsh P., Blanken P.D. 2001. Surface energy balance of the Western and Central Canadian Subarctic: variations in the energy balance among five major terrain types. Journal of Climate, 14: 3692–3703. American Meteorological Society.
Eichel K.A., Macrae M.L., Hall R.I., Fishback L., Wolfe B.B. 2014. Nutrient uptake and short-term responses of phytoplankton and benthic algal communities from a subarctic pond to experimental nutrient enrichment in microcosms. Arctic, Antarctic, and Alpine Research, 46: 191–205.
Essery R., Pomeroy J. 2004. Vegetation and topographic control of wind-blown snow distributions in distributed and aggregated simulations for an Arctic tundra basin. Journal of Hydrometeorology, 5: 735–744. American Meteorological Society.
Fitzpatrick M.J., Porter W.P., Pauli J.N., Kearney M.R., Notaro M., Zuckerberg B. 2020. Future winters present a complex energetic landscape of decreased costs and reduced risk for a freeze-tolerant amphibian, the Wood Frog (Lithobates sylvaticus). Global Change Biology, 26: 6350–6362.
Flanagan K.M., McCauley E., Wrona F., Prowse T. 2003. Climate change: the potential for latitudinal effects on algal biomass in aquatic ecosystems. Canadian Journal of Fisheries and Aquatic Sciences, 60: 635–639.
Fuka D., Walter M., Archibald J., Steenhuis T., Easton Z. 2018. EcoHydRology: a community modeling foundation for eco-hydrology. Available from https://CRAN.R-project.org/package=EcoHydRology [accessed 22 February 2022].
Gharajehdaghipour T., Roth J.D., Fafard P.M., Markham J.H. 2016. Arctic foxes as ecosystem engineers: increased soil nutrients lead to increased plant productivity on fox dens. Scientific Reports, 6: 24020.
Gibson C.M., Chasmer L.E., Thompson D.K., Quinton W.L., Flannigan M.D., Olefeldt D. 2018. Wildfire as a major driver of recent permafrost thaw in boreal peatlands. Nature Communications, 9: 1–9.
Girardin M.-P., Berglund E., Tardif J.C., Monson K. 2005. Radial growth of tamarack (Larix laricina) in the Churchill area, Manitoba, Canada, in relation to climate and larch sawfly (Pristiphora erichsonii) herbivory. Arctic, Antarctic, and Alpine Research, 37: 206–217. Taylor & Francis.
Grafius D.R., Malanson G.P., Weiss D. 2012. Secondary controls of alpine treeline elevations in the western USA. Physical Geography, 33: 146–164. Taylor & Francis.
Granath G., Evans C.D., Strengbom J., Fölster J., Grelle A., Strömqvist J., Köhler S.J. 2021. The impact of wildfire on biogeochemical fluxes and water quality in boreal catchments. Biogeosciences, 18: 3243–3261.
Groffman P.M., Kareiva P., Carter S., Grimm N.B., Lawler J., Mack M., et al. 2014. Ecosystems, biodiversity, and ecosystem services. In Climate change impacts in the United States: the third national climate assessment. US Global Change Research Program, Washington, DC. pp. 195–219.
Harder P., Pomeroy J. 2013. Estimating precipitation phase using a psychrometric energy balance method. Hydrological Processes, 27: 1901–1914. Wiley Online Library.
Harsch M.A., Hulme P.E., McGlone M.S., Duncan R.P. 2009. Are treelines advancing? A global meta-analysis of treeline response to climate warming. Ecology Letters, 12: 1040–1049. Wiley Online Library.
Hättenschwiler S., Smith W.K. 1999. Seedling occurrence in alpine treeline conifers: a case study from the central Rocky Mountains, U.S.A. Acta Oecologica, 20: 219–224.
Hayashi M., Quinton W.L., Pietroniro A., Gibson J.J. 2004. Hydrologic functions of wetlands in a discontinuous permafrost basin indicated by isotopic and chemical signatures. Journal of Hydrology, 296: 81–97.
Hobbie J.E., Peterson B.J., Bettez N., Deegan L., O'Brien W.J., Kling G.W., et al. 1999. Impact of global change on the biogeochemistry and ecology of an Arctic freshwater system. Polar Research, 18: 207–214. Taylor & Francis.
Hochheim K., Barber D.G., Lukovich J.V. 2010. Changing sea ice conditions in Hudson Bay, 1980–2005. In A little less Arctic: top predators in the world's largest northern inland sea, Hudson Bay. Edited by S.H. Ferguson, L.L. Loseto, M.L. Mallory. Springer Netherlands, Dordrecht. pp. 39–52.
Jacques O., Bouchard F., MacDonald L.A., Hall R.I., Wolfe B.B., Pienitz R. 2016. Distribution and diversity of diatom assemblages in surficial sediments of shallow lakes in Wapusk National Park (Manitoba, Canada) region of the Hudson Bay Lowlands. Ecology and Evolution, 6(13): 4526–4540.
Jefferies R.L., Rockwell R.F., Abraham K.F. 2003. The embarrassment of riches: agricultural food subsidies, high goose numbers, and loss of Arctic wetlands: a continuing saga. Environmental Reviews, 11: 40.
Johnson A.S., Perz J., Nol E., Senner N.R. 2016. Dichotomous strategies? The migration of Whimbrels breeding in the eastern Canadian sub-Arctic. Journal of Field Ornithology, 87: 371–383.
Kaufman D.S., Schneider D.P., McKay N.P., Ammann C.M., Bradley R.S., Briffa K.R., et al. 2009. Recent warming reverses long-term Arctic cooling. Science, 325: 1236–1239. American Association for the Advancement of Science.
Kent A., Drezner T.D., Bello R. 2018. Climate warming and the arrival of potentially invasive species into boreal forest and tundra in the Hudson Bay Lowlands, Canada. Polar Biology, 41: 2007–2022.
Kershaw G.P., McCulloch J. 2007. Midwinter snowpack variation across the Arctic treeline, Churchill, Manitoba, Canada. Arctic, Antarctic, and Alpine Research, 39: 9–15.
Kohler J., Brandt O., Johansson M., Callaghan T. 2006. A long-term Arctic snow depth record from Abisko, northern Sweden, 1913–2004. Polar Research, 25: 91–113. Taylor & Francis.
Koloski L., Coulson S., Nol E. 2016. Sex determination in breeding Dunlin (Calidris alpina hudsoni a). Waterbirds, 39: 27–33.
Kong Y., Wang C.-H. 2017. Responses and changes in the permafrost and snow water equivalent in the Northern Hemisphere under a scenario of 1.5 °C warming. Advances in Climate Change Research, 8: 235–244.
Kuzyk Z.A., Candlish L.M. 2019. From science to policy in the greater Hudson Bay marine region: an integrated regional impact study (IRIS) of climate change and modernization. ArcticNet, Québec City: 424.
Laurion I., Vincent W.F., MacIntyre S., Retamal L., Dupont C., Francus P., Pienitz R. 2010. Variability in greenhouse gas emissions from permafrost thaw ponds. Limnology and Oceanography, 55: 115–133.
Leng W., He H.S., Bu R., Dai L., Hu Y., Wang X. 2008. Predicting the distributions of suitable habitat for three larch species under climate warming in northeastern China. Forest Ecology and Management, 254: 420–428.
Lescop-Sinclair K., Payette S. 1995. Recent advance of the arctic treeline along the eastern coast of Hudson Bay. Journal of Ecology, 83: 929–936.
Lukovich J.V., Jafarikhasragh S., Tefs A., Myers P.G., Sydor K., Wong K., et al. 2021. A baseline evaluation of oceanographic and sea ice conditions in the Hudson Bay Complex during 2016–2018. Elementa: Science of the Anthropocene, 9: 00128.
MacDonald G.M., Szeicz J.M., Claricoates J., Dale K.A. 1998. Response of the Central Canadian treeline to recent climatic changes. Annals of the Association of American Geographers, 88: 183–208.
MacDonald L.A., Farquharson N., Hall R.I., Wolfe B.B., Macrae M.L., Sweetman J.N. 2014. Avian-driven modification of seasonal carbon cycling at a Tundra Pond in the Hudson Bay Lowlands (Northern Manitoba, Canada). Arctic, Antarctic, and Alpine Research, 46: 206–217.
MacDonald L.A., Farquharson N., Merritt G., Fooks S., Medeiros A.S., Hall R.I., et al. 2015. Limnological regime shifts caused by climate warming and Lesser Snow Goose population expansion in the western Hudson Bay Lowlands (Manitoba, Canada). Ecology and Evolution, 5: 921–939.
MacDonald L.A., Wolfe B.B., Turner K.W., Anderson L., Arp C.D., Birks S.J., et al. 2017. A synthesis of thermokarst lake water balance in high-latitude regions of North America from isotope tracers. Arctic Science, 3: 118–149.
Macias-Fauria M., Johnson E.A. 2013. Warming-induced upslope advance of subalpine forest is severely limited by geomorphic processes. Proceedings of the National Academy of Sciences, 110: 8117–8122.
Macrae M.L., Bello R.L., Molot L.A. 2004. Long-term carbon storage and hydrological control of CO2 exchange in tundra ponds in the Hudson Bay Lowland. Hydrological Processes, 18: 2051–2069.
Macrae M.L., Brown L.C., Duguay C.R., Parrott J.A., Petrone R.M. 2014. Observed and projected climate change in the Churchill Region of the Hudson Bay lowlands and implications for pond sustainability. Arctic, Antarctic, and Alpine Research, 46: 272–285.
Mamet S.D., Kershaw G.P. 2012. Subarctic and alpine tree line dynamics during the last 400 years in north-western and central Canada: four centuries of subarctic and alpine tree line dynamics. Journal of Biogeography, 39: 855–868.
Mamet S.D., Kershaw G.P. 2013. Age-dependency, climate, and environmental controls of recent tree growth trends at subarctic and alpine treelines. Dendrochronologia, 31: 75–87.
Mamet S.D., Brown C.D., Trant A.J., Laroque C.P. 2019. Shifting global larix distributions: northern expansion and southern retraction as species respond to changing climate. Journal of Biogeography, 46: 30–44.
Mamet S.D., Cairns D.M., Brook R.K., Kershaw G.P. 2015. Modeling the spatial distribution of subarctic forest in northern Manitoba using GIS-based terrain and climate data. Physical Geography, 36: 93–112.
Masson-Delmotte V., Zhai P., Pirani A., Connors S.L., Péan C., Berger S., et al. (Editors). 2021. Climate change 2021: the physical science basis. Contribution of Working Group I to the Sixth Assessment Report of the Intergovernmental Panel on Climate Change. Cambridge University Press.
Maurer E.P., Hidalgo H.G., Das T., Dettinger M.D., Cayan D.R. 2010. The utility of daily large-scale climate data in the assessment of climate change impacts on daily streamflow in California. Hydrology and Earth System Sciences, 14: 1125–1138. Copernicus GmbH.
McClung D.M. 2013. The effects of El Niño and La Niña on snow and avalanche patterns in British Columbia, Canada, and central Chile. Journal of Glaciology, 59: 783–792.
Morison M.Q., Macrae M.L., Petrone R.M., Fishback L. 2017a. Seasonal dynamics in shallow freshwater pond-peatland hydrochemical interactions in a subarctic permafrost environment: Subarctic Pond-Peatland hydrochemical interactions. Hydrological Processes, 31: 462–475.
Morison M.Q., Macrae M.L., Petrone R.M., Fishback L. 2017b. Capturing temporal and spatial variability in the chemistry of shallow permafrost ponds. Biogeosciences, 14: 5471–5485.
Morison M.Q., Macrae M.L., Petrone R.M., Fishback L. 2018. Climate-induced changes in nutrient transformations across landscape units in a thermokarst subarctic peatland. Arctic, Antarctic, and Alpine Research, 50: e1519366.
Morison M.Q., Petrone R.M., Wilkinson S.L., Green A., Waddington J.M. 2020. Ecosystem scale evapotranspiration and CO2 exchange in burned and unburned peatlands: implications for the ecohydrological resilience of carbon stocks to wildfire. Ecohydrology, 13.
Morison M.Q., Volik O., Hall R.I., Wiklund J.A., Macrae M.L., Petrone R.M. 2019. Effects of shoreline permafrost thaw on nutrient dynamics and diatom ecology in a subarctic tundra pond. Journal of Paleolimnology, 62: 151–163.
Muster S., Heim B., Abnizova A., Boike J. 2013. Water body distributions across scales: a remote sensing based comparison of three Arctic tundra wetlands. Remote Sensing, Multidisciplinary Digital Publishing Institute. 5: 1498–1523.
Myers-Smith I.H., Forbes B.C., Wilmking M., Hallinger M., Lantz T., Blok D., et al. 2011. Shrub expansion in tundra ecosystems: dynamics, impacts and research priorities. Environmental Research Letters, 6: 045509.
Myers-Smith I.H., Kerby J.T., Phoenix G.K., Bjerke J.W., Epstein H.E., Assmann J.J., et al. 2020. Complexity revealed in the greening of the Arctic. Nature Climate Change, 10: 106–117.
Notz D., SIMIP Community. 2020. Arctic Sea ice in CMIP6. Geophysical Research Letters, 47: e2019GL086749.
O'Connor J.H., Rittenhouse T.A. 2016. Snow cover and late fall movement influence wood frog survival during an unusually cold winter. Oecologia, 181: 635–644.
Orizaola G., Laurila A. 2009. Microgeographic variation in temperature-induced plasticity in an isolated amphibian metapopulation. Evolutionary Ecology, 23: 979–991.
Payette S. 2004. Accelerated thawing of subarctic peatland permafrost over the last 50 years. Geophysical Research Letters, 31: L18208.
Persaud A., Luek A., Keller W., Jones F.C., Dillon P., Gunn J., Johnston T. 2015. Trophic dynamics of several fish species in lakes of a climatically sensitive region, the Hudson Bay Lowlands. Polar Biology, 38: 651–664.
Phoenix G.K., Bjerke J.W. 2016. Arctic browning: extreme events and trends reversing arctic greening. Global Change Biology, 22: 2960–2962.
Post E., Forchhammer M.C., Bret-Harte M.S., Callaghan T.V., Christensen T.R., Elberling B., Fox A.D., et al. 2009. Ecological dynamics across the Arctic associated with recent climate change. Science, 325: 1355–1358.
Prowse T.D., Wrona F.J., Reist J.D., Gibson J.J., Hobbie J.E., Lévesque L.M.J., Vincent W.F. 2006. Climate change effects on hydroecology of arctic freshwater ecosystems. Ambio, 35: 347–358.
Pruitt W.O. Jr. 1978. Boreal ecology. In Biology No. 91, The Institute of Biology's Studies. 73 pp. Edward Arnold (Publishers) Ltd. London.
R Core Team. 2021. R: a language and environment for statistical computing. R Foundation for Statistical Computing. Vienna, Austria. Available from https://www.R-project.org.
Rautio M., Dufresne F., Laurion I., Bonilla S., Vincent W.F., Christoffersen K.S. 2011. Shallow freshwater ecosystems of the circumpolar Arctic. Ecoscience, 18: 204–222.
Richardson A.D., Keenan T.F., Migliavacca M., Ryu Y., Sonnentag O., Toomey M. 2013. Climate change, phenology, and phenological control of vegetation feedbacks to the climate system. Agricultural and Forest Meteorology 169: 156–173.
Ricketts T.H., Dinerstein E., Olson D.M., Eichbaum W., Loucks C.J., DellaSala D.A., et al. 1999. Terrestrial ecoregions of North America: a conservation assessment. Vol. 1. Island Press. p. 485.
Robinson C., Roy-Léveillée P., Turner K., Basiliko N. 2021. Impacts of shrubification on ground temperatures and carbon cycling in a Sub-arctic fen near Churchill, MB. American Society of Civil Engineers, 60–70.
Roth J.D. 2002. Temporal variability in arctic fox diet as reflected in stable-carbon isotopes; the importance of sea ice. Oecologia, 133: 70–77.
Rouse W.R. 1991. Impacts of Hudson Bay on the terrestrial climate of the Hudson Bay lowlands. Arctic and Alpine Research, 23: 24–30. Taylor & Francis.
Rouse W.R., Douglas M.S.V., Hecky R.E., Hershey A.E., Kling G.W., Lesack L., et al. 1997. Effects of climate change on the freshwaters of Arctic and Subarctic North America. Hydrological Processes, 11: 873–902.
Rühland K.M., Hargan K.E., Jeziorski A., Paterson A.M., Keller W., Smol J.P. 2014. A multi-trophic exploratory survey of recent environmental changes using lake sediments in the Hudson Bay Lowlands, Ontario, Canada. Arctic, Antarctic, and Alpine Research, 46(1): 139–158.
Schindler D.W., Smol J.P. 2006. Cumulative effects of climate warming and other Human activities on freshwaters of Arctic and Subarctic North America. AMBIO: A Journal of the Human Environment, 35: 160–168. Royal Swedish Academy of Sciences.
Scott P.A., Hansell R.I., Erickson W.R. 1993. Influences of wind and snow on northern tree-line environments at Churchill, Manitoba, Canada. Arctic, 316–323. JSTOR.
Seppälä M. 2011. Synthesis of studies of palsa formation underlining the importance of local environmental and physical characteristics. Quaternary Research, 75: 366–370.
Shook K., Pomeroy J. 2012. Changes in the hydrological character of rainfall on the Canadian prairies. Hydrological Processes, 26: 1752–1766.
Smith S.L., Burgess M.M. 2004. Sensitivity of permafrost to climate warming in Canada. Available from https://www.osti.gov/etdeweb/biblio/20581743 [accessed 22 February 2022].
Spence C., Woo M. 2002. Hydrology of subarctic Canadian shield: bedrock upland. Journal of Hydrology, 262: 111–127.
Spence C., Woo M. 2003. Hydrology of subarctic Canadian shield: soil-filled valleys. Journal of Hydrology, 279: 151–166.
Stephens J.P., Berven K.A., Tiegs S.D., Raffel T.R. 2015. Ecological stoichiometry quantitatively predicts responses of tadpoles to a food quality gradient. Ecology, 96(8): 2070–2076.
Sturm M., Holmgren J., McFadden J.P., Liston G.E., Chapin F.S. III, Racine C.H. 2001. Snow–shrub interactions in Arctic tundra: a hypothesis with climatic implications. Journal of Climate, 14: 336–344.
Symons C.C., Arnott S.E., Sweetman J.N. 2012. Nutrient limitation of phytoplankton communities in Subarctic lakes and ponds in Wapusk National Park, Canada. Polar Biology, 35: 481–489.
Tam A., Gough W.A., Kowal S., Xie C. 2014. The fate of Hudson Bay Lowlands palsas in a changing climate. Arctic, Antarctic, and Alpine Research, 46: 114–120.
Tardif J.C., Conciatori F., Leavitt S.W. 2008. Tree rings, δ13C and climate in Picea glauca growing near Churchill, subarctic Manitoba, Canada. Chemical Geology, 252: 88–101.
Timoney K.P., Mamet S.D., Cheng R., Lee P., Robinson A.L., Downing D., Wein R.W. 2019. Tree cover response to climate change in the forest-tundra of north-central Canada: fire-driven decline, not northward advance. Écoscience, 26: 133–148.
Tinner W., Bigler C., Gedye S., Gregory-Eaves I., Jones R.T., Kaltenrieder P., et al. 2008. A 700-year paleoecological record of boreal ecosystem responses to climatic variation from Alaska. Ecology, 89: 729–743.
Tranquillini W. 1979. Climatic resistance and damage of trees at timberline. In Physiological ecology of the alpine timberline. Springer. pp. 91–111.
Walker X., Johnstone J.F. 2014. Widespread negative correlations between black spruce growth and temperature across topographic moisture gradients in the boreal forest. Environmental Research Letters, 9: 064016.
Wolfe B.B., Light E.M., Macrae M.L., Hall R.I., Eichel K., Jasechko S. et al. 2011. Divergent hydrological responses to 20th century climate change in shallow tundra ponds, western Hudson Bay Lowlands. Geophys. Res. Lett. 38(23): L23402.
Wrona F.J., Johansson M., Culp J.M., Jenkins A., Mård J., Myers-Smith I.H., et al. 2016. Transitions in Arctic ecosystems: ecological implications of a changing hydrological regime: terrestrial and freshwater ecosystems. Journal of Geophysical Research: Biogeosciences, 121: 650–674.
Zhang Y. 2013. Spatio-temporal features of permafrost thaw projected from long-term high-resolution modeling for a region in the Hudson Bay Lowlands in Canada: permafrost thaw features. Journal of Geophysical Research: Earth Surface, 118: 542–552.
Zhang Y., Chen W., Riseborough D.W. 2008. Transient projections of permafrost distribution in Canada during the 21st century under scenarios of climate change. Global and Planetary Change, 60: 443–456.
Supplementary material
Supplementary Material 1 (DOCX / 15.9 KB).
- Download
- 15.94 KB
Information & Authors
Information
Published In

FACETS
Volume 8 • January 2023
Pages: 1 - 15
Editor: Irene Gregory-Eaves
History
Received: 13 July 2022
Accepted: 28 November 2022
Version of record online: 11 May 2023
Copyright
© 2023 The Author(s). This work is licensed under a Creative Commons Attribution 4.0 International License (CC BY 4.0), which permits unrestricted use, distribution, and reproduction in any medium, provided the original author(s) and source are credited.
Data Availability Statement
Data and codes used in analysis will be made available on a data repository following manuscript acceptance.
Key Words
Sections
Subjects
Authors
Author Contributions
Conceptualization: NJC, LAF
Data curation: MM, SM, JD, TL, HW, AW
Formal analysis: MM, NJC, TL
Funding acquisition: NJC, SM, JD, LAF
Investigation: MM, SM, JD, TL, HW, AW
Methodology: MM, SM, JD, HW, AW
Project administration: MM, NJC, LAF
Resources: NJC
Supervision: NJC
Visualization: MM, NJC
Writing – original draft: MM, NJC
Writing – review & editing: MM, NJC, SM, JD, TL, LAF, HW, AW
Competing Interests
The authors declare that there are no competing interests.
Metrics & Citations
Metrics
Other Metrics
Citations
Cite As
M. Morison, N.J. Casson, S. Mamet, J. Davenport, T. Livingston, L.A. Fishback, H. White, and A. Windsor. 2023. Snow, ponds, trees, and frogs: how environmental processes mediate climate change impacts on four subarctic terrestrial and freshwater ecosystems. FACETS.
8(): 1-15. https://doi.org/10.1139/facets-2022-0163
Export Citations
If you have the appropriate software installed, you can download article citation data to the citation manager of your choice. Simply select your manager software from the list below and click Download.
There are no citations for this item