Antimicrobial resistance gene surveillance in the receiving waters of an upgraded wastewater treatment plant
Abstract
Wastewater treatment plants (WWTPs) have been identified as hotspots for antimicrobial resistance genes (ARGs) and thus represent a critical point where patterns in ARG abundances can be monitored prior to their release into the environment. The aim of the current study was to measure the impact of the release of the final treated effluent (FE) on the abundance of ARGs in the receiving water of a recently upgraded WWTP in the Canadian prairies. Sample nutrient content (phosphorous and nitrogen species) was measured as a proxy for WWTP functional performance, and quantitative PCR (qPCR) was used to measure the abundance of eight ARGs, the intI1 gene associated with class I integrons, and the 16S rRNA gene. The genes ermB, sul1, intI1, blaCTX-M, qnrS, and tetO all had higher abundances downstream of the WWTP, consistent with the genes with highest abundance in the FE. These findings are consistent with the increasing evidence suggesting that human activity affects the abundances of ARGs in the environment. Although the degree of risk associated with releasing ARGs into the environment is still unclear, understanding the environmental dimension of this threat will help develop informed management policies to reduce the spread of antibiotic resistance and protect public health.
Introduction
Although antimicrobial resistance genes (ARGs) can be detected in pristine environments with minimal anthropogenic influence, their measured abundance can be elevated in managed environments such as livestock feedlots and wastewater treatment plants (WWTPs). ARG abundances in these environments can be upwards of two orders of magnitude greater than those from natural environments (Li et al. 2015). WWTPs receive feces from hospitals and all residential households within the catchment area and therefore represent a critical control point where patterns in ARG abundances can be monitored prior to their release into the environment.
WWTP design is mainly focused on the effective removal of nutrients and enteric pathogens. Although these reductions are undoubtedly essential for reducing detrimental impacts to aquatic ecosystems caused by, for example, nitrogen pollution (Donald et al. 2011; Waiser et al. 2011), the treatment process will invariably exert different selective pressures on bacterial communities, which can alter the effluent community diversity and species composition as well as the antibiotic resistance genes they harbour.
The resistome of wastewater influent, sludge, and effluent has been explored extensively. However, the effluent-receiving waters downstream of WWTPs have been less of a focus of previous literature. Several studies have taken a simplified approach to the downstream impacts of WWTP effluent, sampling only one site upstream and one downstream (Marti et al. 2013; Makowska et al. 2016), whereas others have explored complicated watershed systems with numerous ARG inputs (Devarajan et al. 2016; Xu et al. 2016). The WWTP of focus in this study is located in Regina, Saskatchewan, Canada, and recently underwent a $175 million CAD upgrade to incorporate advanced biological nutrient removal processes to accommodate recent changes in governmental requirements for reduced nutrient release in the receiving waters of wastewater effluent. The potential impact of this WWTP on the environmental dimension of antibiotic resistance is unique due to the small size of receiving water of Wascana Creek whereby the WWTP effluent contributes to much of the downstream flow. Although sediment has frequently been the sample of choice in similar studies (Pruden et al. 2006; Marti et al. 2013), due to its implications as a reservoir of ARGs, we opted to sample surface water because of the inherent risk associated with the use of water containing ARGs for recreational or irrigation purposes (Ashbolt et al. 2013). Our findings are consistent with the increasing pool of evidence suggesting that human activity greatly affects the abundances of ARGs in the environment, but they also identify patterns in ARG abundance different from those of other regional studies, suggesting that unique mechanisms may influence ARG communities in different regions.
Methods
Site description
This study took place within the region of Wascana Creek that is adjacent to the Regina Municipal Wastewater Treatment Facility in southern Saskatchewan, Canada. The Wascana Creek watershed covers an area of approximately 3 870 km2, and contains over 20% of the province’s population (Miki 2015). The creek originates near Vibank, Saskatchewan, flows through Regina, and ends west of Lumsden, Saskatchewan, where it joins the Qu’appelle River. Approximately 7 km downstream of the Regina city boundary, the creek receives an average of 70 mL/d of wastewater, including hospital effluent and storm water. The flow rate and volume of Wascana Creek is low relative to the effluent-receiving rivers of other major Canadian cities and the effluent discharge represents >90% of the downstream flow for much of the year. The Regina WWTP was built in 1960 and was extensively upgraded during 2014–2016 to accommodate new effluent standards put into place by federal and provincial governments in Canada (Wastewater Systems Effluent Regulations SOR/2012-139). Upgrades included the installation of bioreactors to remove phosphorus and nitrogen, and improved UV disinfection of the final treated effluent (FE). Although the WWTP was under construction during the three months of sampling, the nutrient removal process remained relatively consistent, using a combination of the newly installed bioreactors and components of the old plant. Alum and polymers, which are used to aid in phosphorus sequestration and small particle flocculation, were used in treatment at the WWTP throughout the sampling dates.
Sample collection
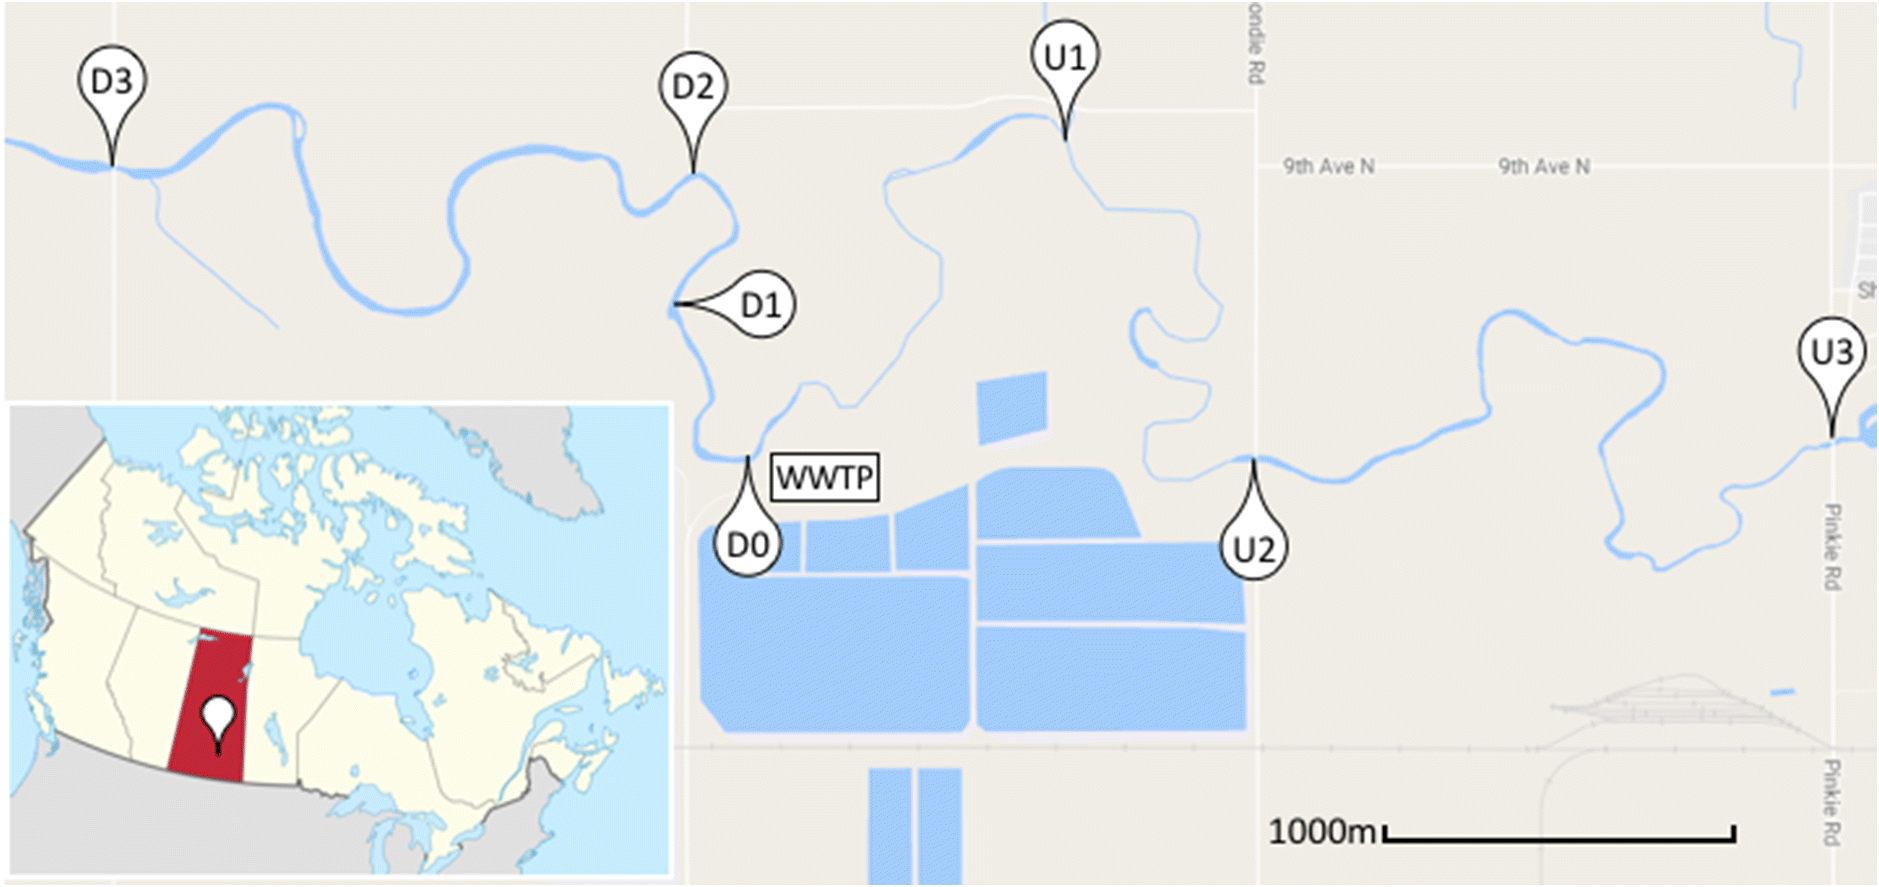
Surface water samples were collected in triplicate from seven sites: three upstream sites, abbreviated U1, U2, U3, and four downstream sites, abbreviated D0, D1, D2, D3 (Fig. 1). Sites U3, U2, and D3 were collected from a bridge, while D2, D1, D0, and U1 were collected 2 m from the edge of the shore. Given the small width of Wascana creek (<4.5 m), we estimate the difference between sampling approaches to be negligible. Additionally, samples of the FE were collected prior to its release from the plant. Samples were collected during six sampling events on 6 and 19 July, 11 and 22 August, and 6 and 12 September 2016. Sampling trips were conducted no fewer than 2 d after a heavy rainfall event (>15 mm of precipitation) to minimize the effect of flow rate on results. Detailed site information can be found in Table S1.
Fig. 1.
Sample processing
Samples were transported and stored at 4 °C for no longer than 48 h prior to processing. Between 100 and 150 mL of each sample was passed through a 47 mm diameter, 0.45 μm pore size filter (EMD Millipore, Billerica, Massachusetts, USA), in duplicate via vacuum filtration. The two filters were aseptically folded and retained in two sterile microfuge tubes and stored at −20 °C for later DNA extraction. The resulting filtrate was used for nutrient analysis, including total nitrogen, total phosphorus (TP), ammonia (NH3), soluble reactive phosphorus, nitrate (NO3), and nitrite (NO2). Nutrient analysis was completed at the Institute of Environmental Change and Society (University of Regina, Regina, Saskatchewan, Canada) using established protocols (Lachat Instruments, Loveland, Colorado, USA). For DNA extraction, each filter was briefly macerated with a sterilized metal spatula prior to cell lysis and homogenization, which was completed in the FastPrep®-24 Instrument (MP Biomedicals, Santa Ana, California, USA) at 4.0 m/s for three 1 min intervals. Subsequent DNA extractions were performed using the Powersoil® DNA Isolation Kit (Mo Bio Laboratories, Carlsbad, California, USA) according to the manufacturer’s instructions. DNA was pooled for the two replicate filters of each sample.
Quantitative PCR of specific ARGs
The ARGs targeted in this study encode resistance to commonly prescribed antibiotic classes, such as β-lactams, macrolides, tetracyclines, sulfonamides, and fluoroquinolones (blaCTX-M, ermB, tetO, sul1, qnrS, respectively). The resistance genes associated with frequent hospital outbreaks of methicillin-resistant Staphylococcus aureus (MRSA) and vancomycin-resistant Enterococcus (VRE), mecA and vanA, respectively, were also targeted in this study. Additionally, we quantified the abundance of the class I integron integrase gene intI1, which has been correlated with anthropogenic inputs of ARGs within the environment (Gillings et al. 2015). Quantification of 16S rRNA gene amplicons (Suzuki et al. 2000) was used to normalize the ARG concentrations across sampling locations.
Quantitative PCR (qPCR) assays included the use of Taqman Environmental Mastermix 2.0 (Applied Biosystems, Foster City, California, USA) according to the manufacturer’s specifications and were completed on a StepOnePlus™ Real-Time PCR System instrument (Applied BioSystems) using default settings for standard curve experiments. Each qPCR assay was done in duplicate and quantified according to a five-point standard curve over five orders of magnitude. For the scope of this study, values were considered below the limit of detection (LOD) if the qPCR assay reported no amplification, and below the limit of quantification (LOQ) if the reaction cycle threshold value was above that of the lowest point on the associated standard curve. Standards were created by cloning PCR amplicons of each gene of interest into a pGEM Easy-T cloning vector (Promega, Madison, Wisconsin, USA). Primer and probe sequences and their associated average qPCR efficiencies, R2 values, and LODs are listed in Table S2.
Statistical analysis
Gene copy numbers were calculated in the StepOnePlus software v2.3 according to the standard curve included in each qPCR run. Technical reaction replicates were averaged and exported for analysis. All data visualization and analysis was completed in R 3.3.2 (R Core Team 2016) using packages ggplot2 and viridis (Wickham 2009; Garnier et al. 2017). All statistical analysis was completed using gene copy number normalized to the 16S rRNA gene copy number and log transformed. Differences in gene abundances between sites were evaluated via ANOVA and the Tukey’s honestly significant difference test using a critical value of α = 0.05 to assess statistical significance.
Results
Nutrient analysis and WWTP performance
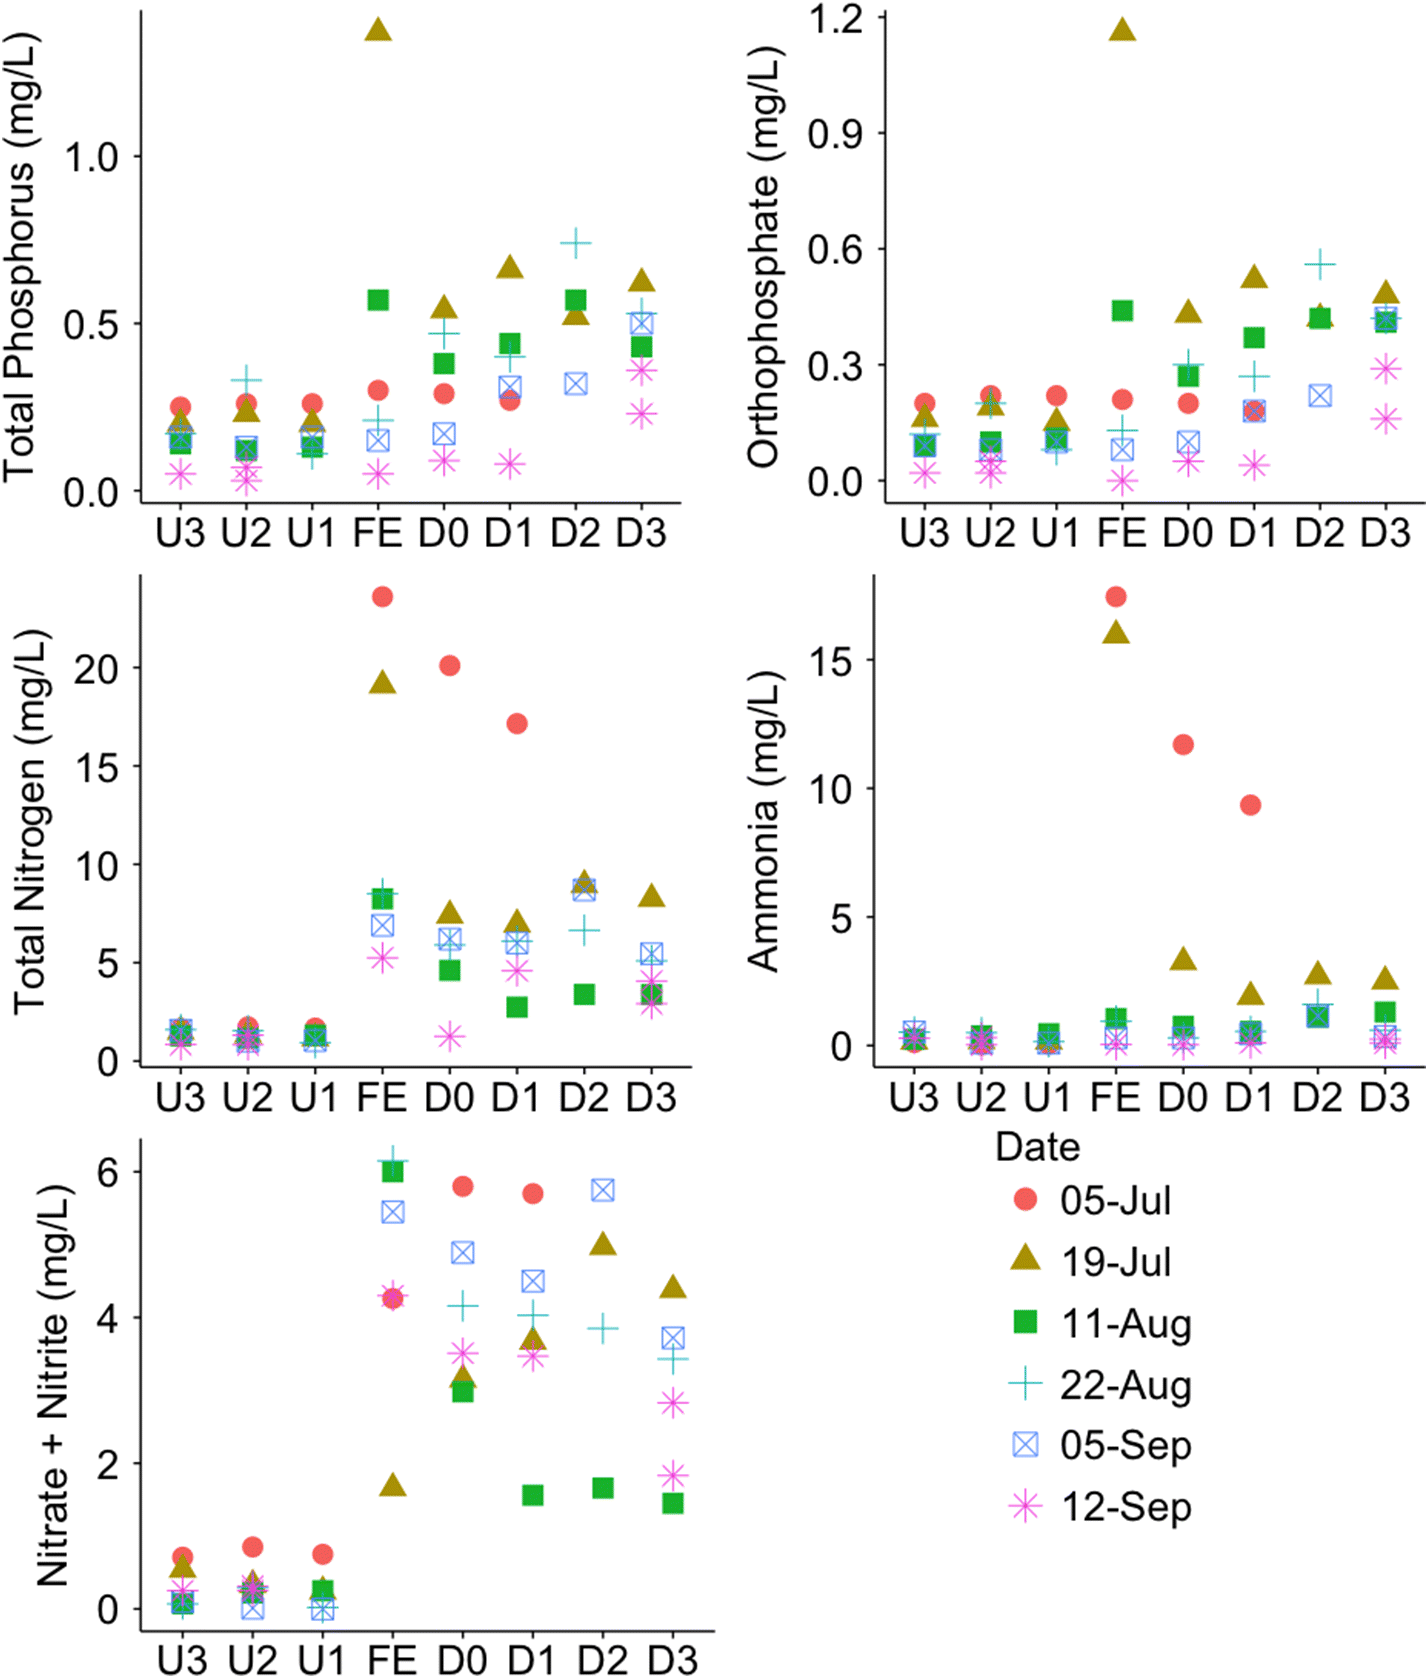
According to the discharge permit, the TP content in the WWTP effluent was not to exceed 1 mg/L as determined by a six-month average of the daily tests. During the sampling period, TP content only once exceeded the permit limit on the 19 July sampling date, while the average across all dates was 0.44 ± 0.49 mg/L (Fig. 2). A clear spike in nitrogen species can be observed in the effluent and downstream sites as compared with the upstream sites, indicating an impact of the release of the treated effluent on the nitrogen species content in the creek. Limits on the release of nitrogen species were not put into effect until January 2017. Furthermore, although spikes in nitrogen and phosphorus species can be observed in the effluent and downstream sites for both July sampling dates, concentrations remained consistently low in August and September, indicating that the WWTP performance improved during the final commissioning phase of the upgrades.
Fig. 2.
Abundances of ARGs in the FE and upstream and downstream surface water samples
The 16S rRNA gene copy numbers were not found to differ significantly (p > 0.05) between any of the sampling sites (Fig. 3). Therefore, prior to analysis, all ARG gene copy number values were normalized to their respective copies of the 16S rRNA gene. qPCR reaction efficiencies varied by primer set from 95% to 102% and all had R2 values >0.98 (Table S2).
Fig. 3.
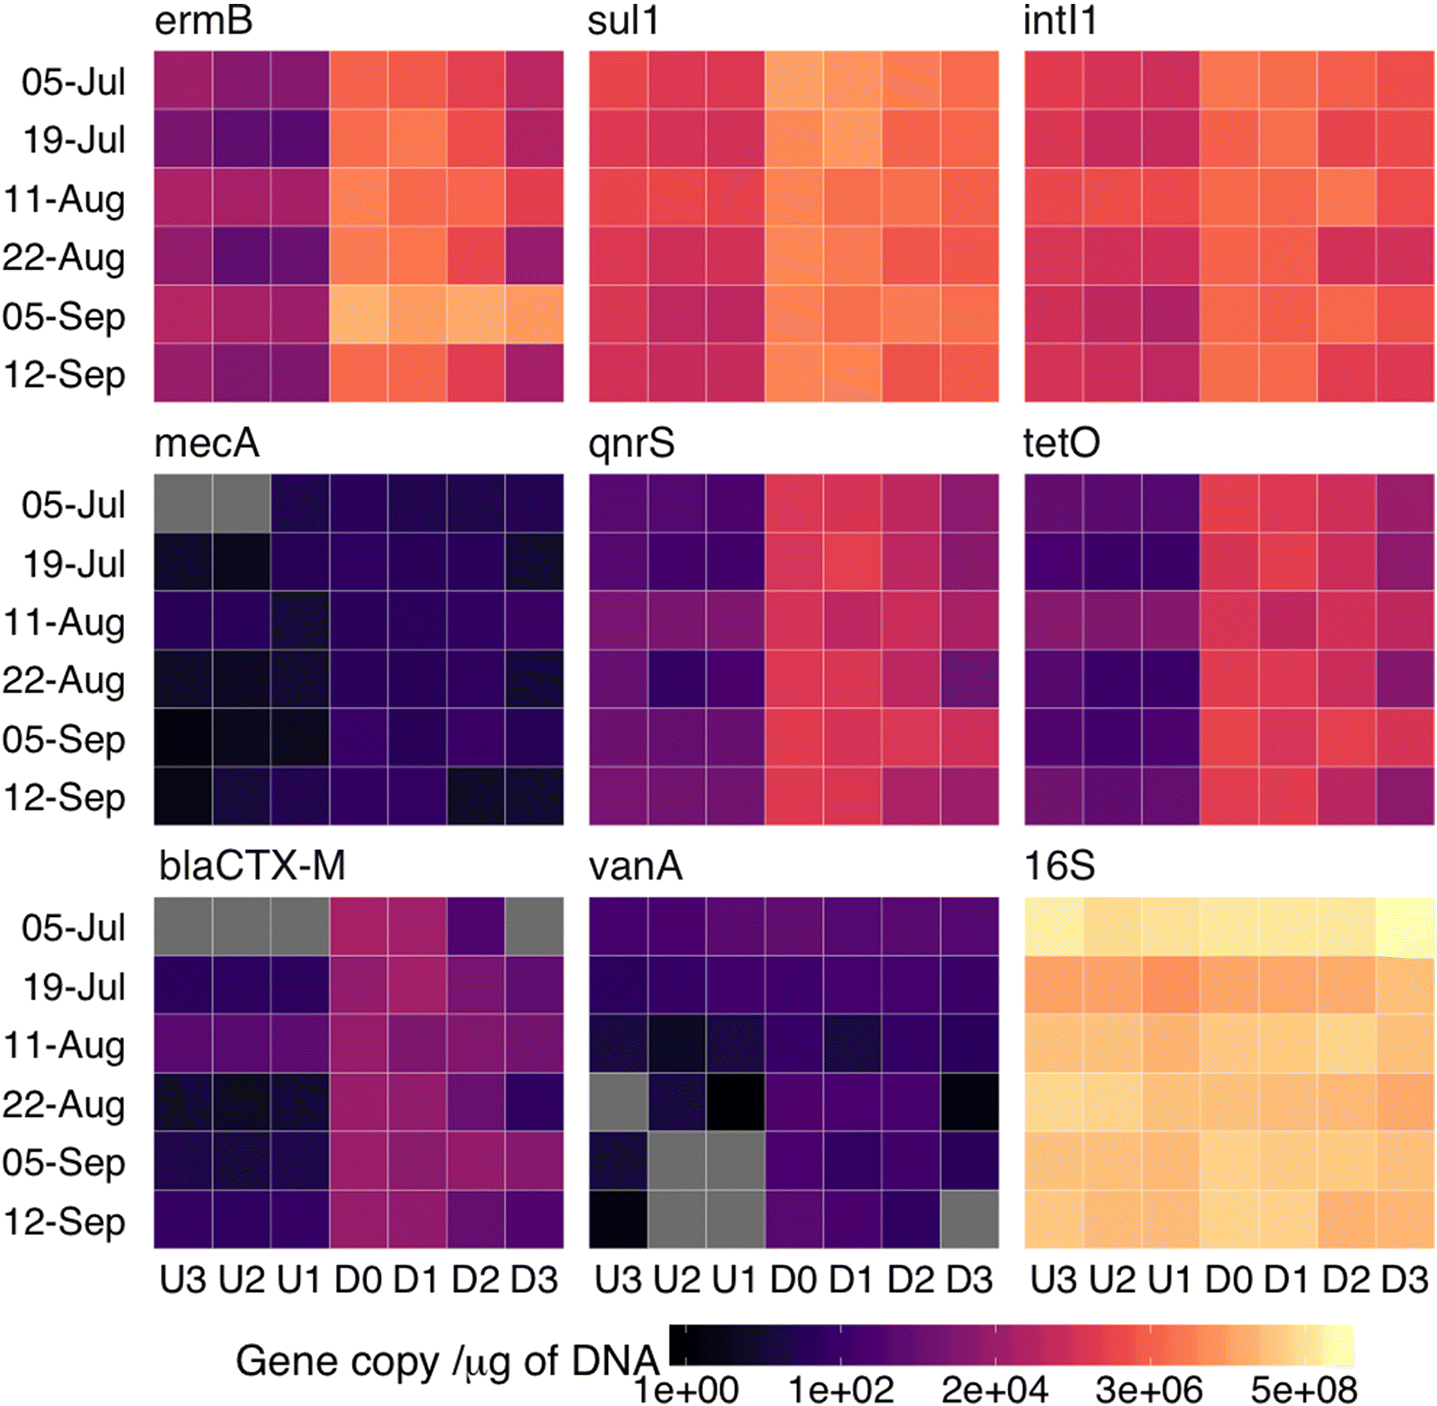
The genes with the highest measured abundances in the FE were sul1, ermB, and intI1, which had mean absolute copy numbers of 3.1 × 10⁴, 2.5 × 10⁴, and 8.1 × 10³ per nanogram of DNA, respectively (Fig. 4). The plant released high levels of all measured genes relative to the surrounding environment (i.e., upstream samples, Figs. 3, 5), with the exception of mecA and vanA, which were occasionally below the LOD and consistently below the LOQ for all collected samples.
Fig. 4.
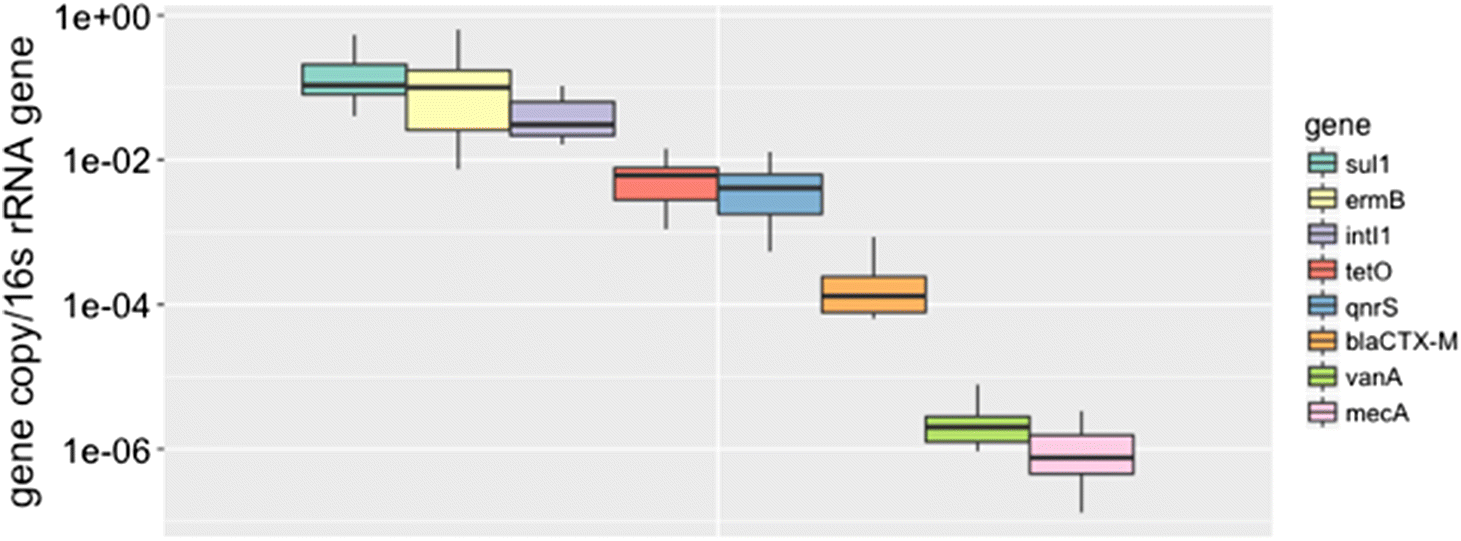
Fig. 5.
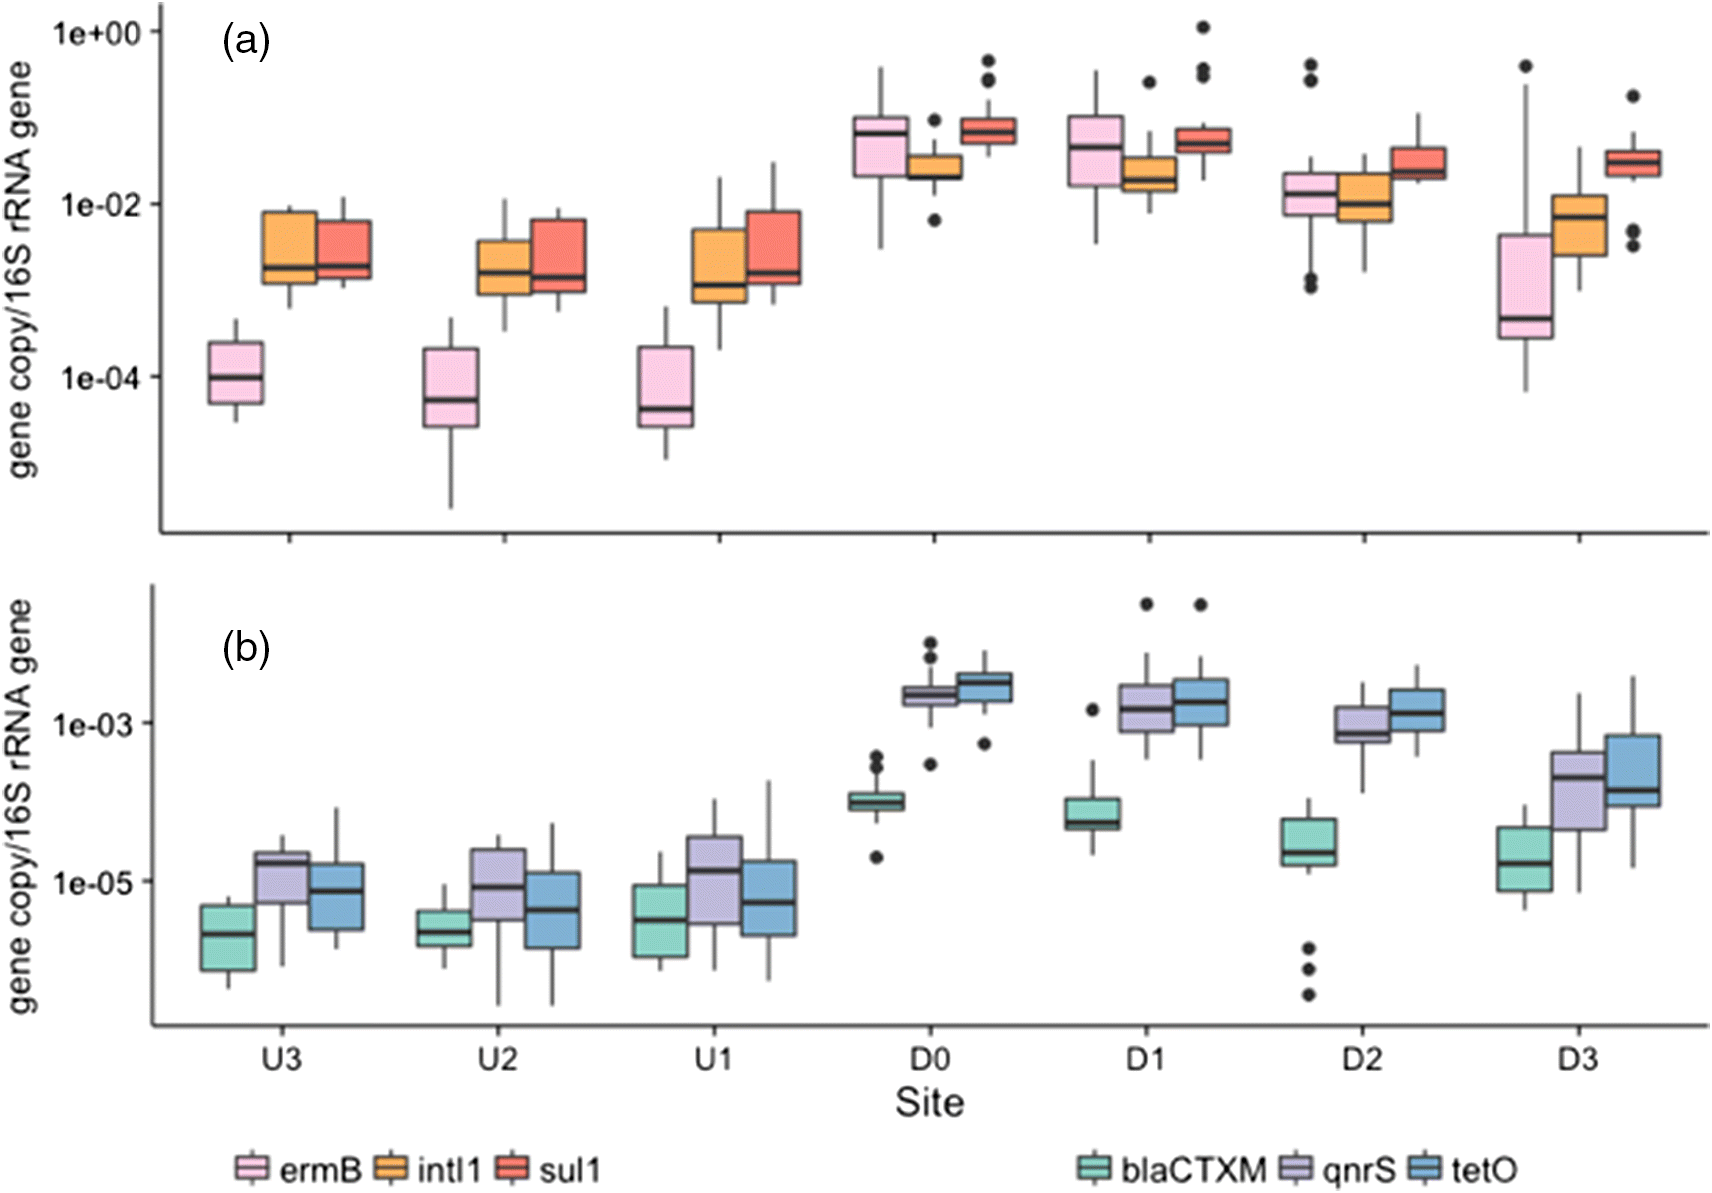
The three sampling points upstream of the plant were used to assess the ARG load of Wascana Creek prior to inputs from the plant. The abundance for each ARG gene was consistent and no significant differences (p > 0.05) were observed between the three sites. The vanA, mecA, and blaCTX-M genes were present in upstream samples but below the LOQ.
Differences in the abundances of detectable ARGs were assessed between all downstream sites. Six out of the eight genes surveyed were found in higher quantities immediately downstream of the plant, including ermB, sul1, intI1, blaCTX-M, qnrS, and tetO (p < 0.05) (Figs. 3, 5). While the WWTP did increase the overall ARG abundance downstream of the plant, these changes were not uniform across all genes. ermB and tetO had the largest log increase in comparison with abundances upstream (2.62 ± 0.46 and 2.59 ± 0.67, respectively), while log increases in intI1 and sul1 were considerably less (1.01 ± 0.28 and 1.46 ± 0.29, respectively).
The relative ARG abundances decreased in samples D1 through D3, corresponding with an increasing distance from the plant (Fig. 5). However, besides ermB, none of the genes surveyed returned to their upstream concentrations (U1–U3) by site D3, which is located approximately 5 km downstream of the effluent release point. Although the WWTP released high levels of ermB, its relative abundance decreased significantly by site D3 and thus did not differ from any of the upstream sites (p = 0.13). The relative ARG abundances in water samples impacted by the wastewater effluent were still on average 1.03 log higher at site D3 compared with their respective U1 values (Fig. 5).
Discussion
Although municipal wastewater can undergo extensive treatment for the reduction of biological nutrients and enteric pathogens, ARG-harbouring bacteria can be released into the environment (Cydzik-Kwiatkowska and Zielińska 2016). Similarly, our results indicate that the Regina Municipal WWTP is releasing treated effluent containing levels of ARGs that are higher in abundance relative to levels found in the surrounding environment.
Six of the eight measured genes were detectable upstream of the plant (blaCTX-M, intI1, tetO, ermB, sul1, and qnrS), which may not be surprising given that the creek flows directly through a mixed land-use area that includes agricultural lands and urbanized satellite communities with limited wastewater treatment. The creek contains quantified ARG levels that are consistent with studies focused on other similar urban rivers and creeks (Xu et al. 2016), which are far above expected ARG values for pristine aquatic environments (Marti et al. 2013).
Among the most abundant genes were the class I integron integrase gene intI1 and sul1 (Fig. 5). Their high abundance is unsurprising given that both have been identified as genetic markers associated with urbanization (Nardelli et al. 2012; Gillings et al. 2015). They are also remarkably similar in abundance, which is especially apparent in the upstream samples (Fig. 5). Their similar abundance may be attributed to the frequent co-occurrence of sul1 with the conserved region at the 3′ end of class 1 integrons (Bryskier 2005).
The treated effluent leaving the wastewater plant had increased abundances of most genes, with the noticeable exception of vanA and mecA. vanA and mecA were below the LOQ in the treated effluent, and at all creek sites. Although both genes are linked to notable outbreaks of resistant organisms (e.g., MRSA and VRE), they may be less likely to propagate within the WWTP environment. vanA encodes high level resistance to vancomycin (minimal inhibitory concentration (MIC): 1024 μg/mL) and teicoplanin (MIC: 512 μg/mL) and has been linked to numerous nosocomial VRE outbreaks (Abele-Horn et al. 2006). While vanA-associated vancomycin resistance is clinically widespread, the low frequency within wastewater-impacted environments maybe related to the genomic context whereby vanA is localized to a subset of Enterococcus spp. (Simjee et al. 2002). mecA is similar in that it has been found only in Staphylococcus and a few other select genera (Kassem et al. 2008) and is typically chromosomally encoded. It is unclear to what extent these genes are found in unculturable environmental bacteria.
blaCTX-M encodes resistance to extended-spectrum beta lactamases and is of significant clinical concern due to patient morbidity and mortality in treating infections caused by pathogens carrying the blaCTX-M gene (Paterson and Bonomo 2005). Although the blaCTX-M gene family is expansive and includes hundreds of variants, the primers used in this study capture the diversity found within the blaCTX-M-1 cluster (Colomer-Lluch et al. 2011), which is frequently associated with mobile transposon elements and is thus of interest in a system where horizontal gene transfer can be prominent (Cantón et al. 2012). The effluent from the Regina WWTP increased the abundance of the blaCTX-M gene in the downstream aquatic environment, a phenomenon that has been observed in several other studied sites including arctic Canada (Neudorf et al. 2017), Portugal (Tacão et al. 2012), India (Devarajan et al. 2016), and Switzerland (Devarajan et al. 2015).
Many studies have surveyed the surface water and sediments of wastewater effluent-receiving waters and found that, in general, ARG abundances are increased downstream of a WWTP. However, the region of study appears to have a heavy effect on the presence and abundance of specific ARGs. For example, we detected and quantified qnrS consistently both upstream and downstream of the WWTP, whereas a 2014 study in Sweden could not, despite having a very similar study site (Berglund et al. 2015). Conversely, a different Swedish study consistently detected and quantified mecA, contrary to what we observed in this study (Börjesson et al. 2009).
Although this approach is limited in scope to the selected gene targets, it is an efficient and straightforward approach to monitoring the release of ARGs in treated wastewater effluent prior to release into the environment. While other similar technologies such as qPCR arrays and metagenomics sequencing may allow for the detection of more ARGs overall, the genes targeted in this study are representative of the resistance gene pool and are clinically relevant. Moreover, the selected approach can detect shifts in ARG abundances, which if monitored temporally, can provide insights into changing resistance patterns within the community.
Conclusion
During this study, we observed elevated levels of six ARGs in the final treated wastewater of a municipal WWTP, as well as in the effluent-receiving body of water. Comparable studies in other countries have reported similar findings, indicating that this is a global phenomenon. Although the degree of risk associated with releasing ARGs into the environment is still unclear, understanding the environmental dimension of this threat will help develop informed management policies to reduce the spread of antibiotic resistance and protect public health.
Acknowledgements
This research was supported by a Natural Sciences and Engineering Research Council of Canada Strategic Projects Grant. We also acknowledge the support of the Saskatchewan Water Security Agency for providing monitoring data. Finally, we acknowledge support from staff at the Regina WWTP for supplying wastewater samples and Jennifer Russell for assistance in sample collection.
References
Abele-Horn M, Vogel U, Klare I, Konstabel C, Trabold R, Kurihara R, et al. 2006. Molecular epidemiology of hospital-acquired vancomycin-resistant enterococci. Journal of Clinical Microbiology, 44(11): 4009–4013.
Ashbolt NJ, Amézquita A, Backhaus T, Borriello P, Brandt KK, Collignon P, et al. 2013. Human Health Risk Assessment (HHRA) for environmental development and transfer of antibiotic resistance. Environmental Health Perspectives, 327(2): 259–266.
Berglund B, Fick J, and Lindgren P-E. 2015. Urban wastewater effluent increases antibiotic resistance gene concentrations in a receiving northern European river. Environmental Toxicology and Chemistry, 34(1): 192–196.
Börjesson S, Melin S, Matussek A, and Lindgren PE. 2009. A seasonal study of the mecA gene and Staphylococcus aureus including methicillin-resistant S. aureus in a municipal wastewater treatment plant. Water Research, 43(4): 925–932.
Bryskier A (Editor). 2005. Antimicrobial agents: antibacterials and antifungals. ASM Press, Washington, D.C. 1456 p.
Cantón R, González-Alba JM, and Galán JC. 2012. CTX-M enzymes: origin and diffusion. Frontiers in Microbiology, 3: 110.
Colomer-Lluch M, Jofre J, and Muniesa M. 2011. Antibiotic resistance genes in the bacteriophage DNA fraction of environmental samples. PLoS ONE, 6(3): e17549.
Cydzik-Kwiatkowska A, and Zielińska M. 2016. Bacterial communities in full-scale wastewater treatment systems. World Journal of Microbiology and Biotechnology, 32(4): 66.
Devarajan N, Laffite A, Graham ND, Meijer M, Prabakar K, Mubedi JI, et al. 2015. Accumulation of clinically relevant antibiotic-resistance genes, bacterial load, and metals in freshwater lake sediments in Central Europe. Environmental Science & Technology, 49(11): 6528–6537.
Devarajan N, Laffite A, Mulaji CK, Otamonga J-P, Mpiana PT, Mubedi JI, et al. 2016. Occurrence of antibiotic resistance genes and bacterial markers in a tropical river receiving hospital and urban wastewaters. PLoS ONE, 11(2): e0149211.
Donald DB, Bogard MJ, Finlay K, and Leavitt PR. 2011. Comparative effects of urea, ammonium, and nitrate on phytoplankton abundance, community composition, and toxicity in hypereutrophic freshwaters. Limnology and Oceanography, 56(6): 2161–2175.
Garnier S, Ross N, and Rudis B. 2017. viridis: default colour maps from “matplotlib” [online]: Available from cran.r-project.org/web/packages/viridis/viridis.pdf.
Gillings MR, Gaze WH, Pruden A, Smalla K, Tiedje JM, and Zhu Y-G. 2015. Using the class 1 integron-integrase gene as a proxy for anthropogenic pollution. The ISME Journal, 9(6): 1269–1279.
Kassem II, Esseili MA, and Sigler V. 2008. Occurrence of mecA in nonstaphylococcal pathogens in surface waters. Journal of Clinical Microbiology, 46(11): 3868–3869.
Li B, Yang Y, Ma L, Ju F, Guo F, Tiedje JM, et al. 2015. Metagenomic and network analysis reveal wide distribution and co-occurrence of environmental antibiotic resistance genes. The ISME Journal, 9(11): 2490–2502.
Makowska N, Koczura R, and Mokracka J. 2016. Class 1 integrase, sulfonamide and tetracycline resistance genes in wastewater treatment plant and surface water. Chemosphere, 144: 1665–1673.
Marti E, Jofre J, and Balcazar JL. 2013. Prevalence of antibiotic resistance genes and bacterial community composition in a river influenced by a wastewater treatment plant. PLoS ONE, 8(10): e78906.
Miki A. 2015. Wascana Creek Riparian Health Assessment Project Final Report 2015. Wascana Upper Qu’Appelle Watersheds Association Taking Responsibility, Regina, Saskatchewan.
Nardelli M, Scalzo PM, Ramírez MS, Quiroga MP, Cassini MH, and Centrón D. 2012. Class 1 integrons in environments with different degrees of urbanization. PLoS ONE, 7(6): e39223.
Neudorf KD, Huang YN, Ragush CM, Yost CK, Jamieson RC, and Hansen LT. 2017. Antibiotic resistance genes in municipal wastewater treatment systems and receiving waters in Arctic Canada. Science of the Total Environment, 598: 1085–1094.
Paterson DL, and Bonomo RA. 2005. Extended-spectrum β-lactamases: a clinical update. Clinical Microbiology Reviews, 18(4): 657–686.
Pruden A, Pei R, Storteboom H, and Carlson KH. 2006. Antibiotic resistance genes as emerging contaminants: studies in Northern Colorado. Environmental Science & Technology, 40(23): 7445–7450.
R Core Team. 2016. R: a language and environment for statistical computing. R Foundation for Statistical Computing, Vienna, Austria [online]: Available from r-project.org/.
Simjee S, White DG, McDermott PF, Wagner DD, Zervos MJ, and Donabedian SM. 2002. Characterization of Tn1546 in vancomycin-resistant Enterococcus faecium isolated from canine urinary tract infections: evidence of gene exchange between human and animal Enterococci. Journal of Clinical Microbiology, 40(12): 4659–4665.
Suzuki MT, Taylor LT, and DeLong EF. 2000. Quantitative analysis of small-subunit rRNA genes in mixed microbial populations via 5′-nuclease assays. Applied and Environmental Microbiology, 66(11): 4605–4614.
Tacão M, Correia A, and Henriques I. 2012. Resistance to broad-spectrum antibiotics in aquatic systems: anthropogenic activities modulate the dissemination of blaCTX-M like genes. Applied and Environmental Microbiology, 78(12): 4134–4140.
Waiser MJ, Tumber V, and Holm J. 2011. Effluent-dominated streams. Part 1: presence and effects of excess nitrogen and phosphorus in Wascana Creek, Saskatchewan, Canada. Environmental Toxicology and Chemistry, 30(2): 496–507.
Wickham H. 2009. ggplot2: elegant graphics for data analysis [online]: Available from ggplot2.org.
Xu Y, Guo C, Luo Y, Lv J, Zhang Y, Lin H, et al. 2016. Occurrence and distribution of antibiotics, antibiotic resistance genes in the urban rivers in Beijing, China. Environmental Pollution, 213: 833–840.
Supplementary material
Supplementary Material 1 (DOCX / 62 KB)
- Download
- 61.15 KB
Information & Authors
Information
Published In

FACETS
Volume 3 • Number 1 • October 2018
Pages: 128 - 138
Editor: Alexandre Poulain
History
Received: 28 June 2017
Accepted: 16 October 2017
Version of record online: 8 February 2018
Copyright
© 2018 Freeman et al. This work is licensed under a Creative Commons Attribution 4.0 International License (CC BY 4.0), which permits unrestricted use, distribution, and reproduction in any medium, provided the original author(s) and source are credited.
Data Availability Statement
All relevant data are within the paper and in the Supplementary Material.
Key Words
Sections
Subjects
Authors
Author Contributions
KDN, LTH, RCJ, and CKY conceived and designed the study.
CNF, LS, and KDN performed the experiments/collected the data.
CNF and CKY analyzed and interpreted the data.
LTH, RCJ, and CKY contributed resources.
CNF, LTH, and CKY drafted or revised the manuscript.
Competing Interests
The authors have declared that no competing interests exist.
Metrics & Citations
Metrics
Other Metrics
Citations
Cite As
Claire N. Freeman, Lena Scriver, Kara D. Neudorf, Lisbeth Truelstrup Hansen, Rob C. Jamieson, and Christopher K. Yost. 2018. Antimicrobial resistance gene surveillance in the receiving waters of an upgraded wastewater treatment plant. FACETS.
3(1): 128-138. https://doi.org/10.1139/facets-2017-0085
Export Citations
If you have the appropriate software installed, you can download article citation data to the citation manager of your choice. Simply select your manager software from the list below and click Download.
Cited by
1. Wastewater discharges alter microbial community composition in surface waters of the canadian prairies
2. Wastewater treatment plants, an “escape gate” for ESCAPE pathogens
3. Framework for establishing regulatory guidelines to control antibiotic resistance in treated effluents
4. A proposed framework for the identification of indicator genes for monitoring antibiotic resistance in wastewater: Insights from metagenomic sequencing
5. Antibiotic resistant genes in the environment-exploring surveillance methods and sustainable remediation strategies of antibiotics and ARGs
6. The Assessment of the Risk Ranking and Mobility Potential Associated with Environmental Resistomes in Wastewater Using Metagenomic Assembly
7. Occurrence and driving mechanism of antibiotic resistance genes in marine recreational water around Qinhuangdao, China
8. Profiling of emerging pathogens, antibiotic resistance genes and mobile genetic elements in different biological wastewater treatment plants
9. Pharmaceutical Pollution in Aquatic Environments: A Concise Review of Environmental Impacts and Bioremediation Systems
10. Knowledge Gaps in the Understanding of Antimicrobial Resistance in Canada
11. Profiles of environmental antibiotic resistomes in the urban aquatic recipients of Sweden using high-throughput quantitative PCR analysis
12. Urban wastewater as a conduit for pathogenic Gram-positive bacteria and genes encoding resistance to β-lactams and glycopeptides
13. Detection of carbapenem-resistance genes in bacteria isolated from wastewater in Ontario
14. Role of wastewater treatment plants on environmental abundance of Antimicrobial Resistance Genes in Chilean rivers
15. Antibiotic resistance genes in treated wastewater and in the receiving water bodies: A pan-European survey of urban settings
16. Lateral flow sand filters are effective for removal of antibiotic resistance genes from domestic wastewater
17. Degradation of extracellular genomic, plasmid DNA and specific antibiotic resistance genes by chlorination
18. Sources of Antibiotic Resistance Genes in a Rural River System
