Nucleobase-containing compounds evoke behavioural, olfactory, and transcriptional responses in model fishes
This article has been corrected.
VIEW CORRECTIONAbstract
The sensory system of animals detects a massive and unknown array of chemical cues that evoke a diversity of physiological and behavioural responses. One group of nitrogen-containing carbon ring chemicals—nucleobases—are thought to be involved in numerous behaviours yet have received little attention. We took a top-down approach to examine responses evoked by nucleobases at behavioural, tissue, and gene expression levels. Fish generally avoided nucleobases, and this behaviour, when observed, was driven by purines but not pyrimidines. At the tissue level, olfactory neuron generator potential responses tended to be concentration specific and robust at concentrations lower than amino acid detection ranges. In terms of gene expression, more than 2000 genes were significantly upregulated following nucleobase exposure, some of which were expected (e.g., genes involved in purine binding) and some of which were not (e.g., tubulin-related genes). Humanized RNA pathway analysis showed that we had exposed the animal to a nucleobase. Our data indicate that responses to nucleobase-containing compounds may be highly structure based and are evident from changes in behaviour to mRNA expression. Many of these responses were surprising, and all provide numerous routes for further research endeavour.
Introduction
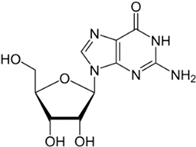
A huge diversity of chemicals can evoke a vast array of sensory responses. Animals use chemical stimuli ranging in complexity from the simple to the elaborate to facilitate activities from feeding to mating. One of the more intriguing classes of understudied chemical stimuli are nucleobase-containing compounds, i.e., compounds having carbon rings with nitrogen (Table 1). Among these compounds are the sugar-containing nucleosides, which include deoxyribonucleic acids (DNA), and the phosphorylated nucleotides, which include adenosine triphosphate (ATP). Nucleotides are released by bacteria (Okabayashi et al. 1963; Demain et al. 1965; Saier et al. 1975) and animals; the latter may excrete these compounds naturally (Murad and Pak 1972; Sato et al. 1981) or involuntarily through injury (Brown et al. 2000, 2001). Nucleobases may serve as sensory stimuli that evoke a range of responses in animals.
Table 1.
| Compounds | |||
|---|---|---|---|
| Purines | |||
| Adenine | Adenosine | AMP | ATP |
 | 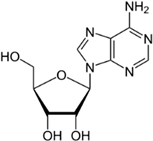 | 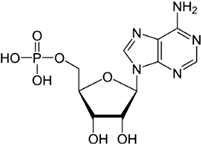 | 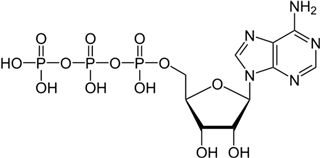 |
| Hypoxanthine | Guanosine | GMP | IMP |
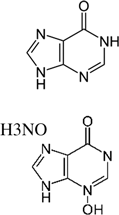 |  | 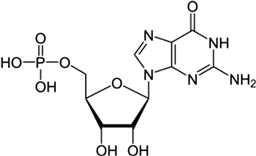 | 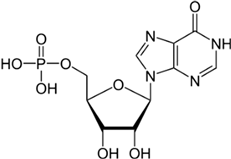 |
| Pyrimidines | |||
| CMP | UMP | ||
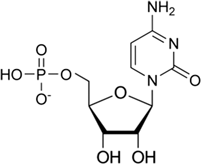 | 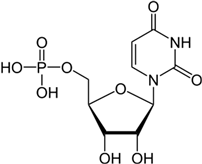 | ||
Note: Images from Wikimedia Commons. AMP, adenosine-5′-monophosphate monohydrate; ATP, adenosine-5′-triphosphate disodium salt hydrate; GMP, guanosine-5′-monophosphate disodium salt hydrate; CMP, cytidine-5′-monophosphate disodium salt; UMP, uridine-5′-monophosphate disodium salt; IMP, inosine-5′-monophosphate disodium salt hydrate.
In general, nucleobases evoke “eat or be eaten” behaviours. In several hematophagous insects, including the bed bug (Cimex lectularius Linnaeus, 1758) and the kissing bug (Rhodnius prolixus Stål, 1859), nucleotides are potent initiators of gorging behaviour (Friend and Smith 1971; Smith and Griend 1976; Romero and Schal 2014). In abalone (Haliotis discus Reeve, 1846) and rainbow trout (Oncorhynchus mykiss (Walbaum, 1792)), complex nucleotide mixtures evoked feeding (Mearns et al. 1987; Miyasaki and Harada 2003). A single nucleotide (inosine monophosphate) evoked feeding behaviour in various fishes (Carr et al. 1996). In contrast, a single nucleobase (hypoxanthine 3-N-oxide; H3NO) evoked the opposite of feeding—an alarm response—in several fishes (Brown et al. 2000, 2001, 2003; Parra et al. 2009; Mathuru et al. 2012).
In bed bugs and kissing bugs, reducing adenosine phosphorylation diminished responses (Friend and Smith 1971; Smith and Griend 1976; Romero and Schal 2014). These findings were supported in the Caribbean spiny lobster (Panulirus argus (Latreille, 1804)) (Carr et al. 1986). Presumably, the greater the number of phosphate groups, the “fresher” and more stimulatory the stimulus, as ATP will hydrolyze in water. For zebrafish (Danio rerio (Hamilton, 1822)), un-phosphorylated adenosine evoked a variety of changes in swimming activity (Shamchuk and Tierney 2012). There may also be differences among species; for example, adenine-containing compounds induced feeding in adult rainbow trout but not Atlantic salmon parr (Salmo salar Linnaeus, 1758) (Mearns et al. 1987). Additionally, the alarm response evoked by H3NO in ostariophysan fishes appeared to be absent in a salmonid (Brown et al. 2003). Of interest is understanding how specific nucleobase structures evoke behaviours.
This study explored the behavioural and physiological responses of larval zebrafish to nucleobases. We expected that some nucleobases would evoke attraction or feeding (appetitive) responses, whereas others would evoke avoidance or alarm. Appetitive responses may be apparent as increased foraging (Jones and Hara 1985; Mearns et al. 1987), which may be evident as increased swimming activity (Jones and Hara 1985; Lindsay and Vogt 2004; Braubach et al. 2009; Bhinder and Tierney 2012). Avoidance responses are self-evident and well described in fishes (Tierney 2016); alarm responses may be apparent as erratic and rapid movements and periods of “freezing” behaviour (Brown et al. 2000, 2001; Speedie and Gerlai 2008; Parra et al. 2009; Mathuru et al. 2012). We examined behaviour in embryonic zebrafish (5–7 d post-fertilization; dpf) in part because they are a model vertebrate, and so their responses may have relevance to both basic and applied studies, and in part to explore developmental changes in responses. The olfactory epithelium of embryonic zebrafish begins to function as early as 3 dpf (Lindsay and Vogt 2004; Li et al. 2005; Vitebsky et al. 2005). Although the olfactory system is functional, it is undergoing change. Odourant receptor expression changes over time (Barth et al. 1996; Argo et al. 2003), and the activity of the olfactory bulb increases with age (Argo et al. 2003; Li et al. 2005). Furthermore, not all receptors have the same onset of expression, nor do they increase at the same rate (Barth et al. 1996; Argo et al. 2003). Calcium imaging of olfactory bulb activity indicated odourant-induced activity was greater after just 2 d of development (5 vs. 3 dpf) (Li et al. 2005). Additionally, as embryonic fish develop, they have increased movement ability and need for food (Kimmel et al. 1995; Colwill and Creton 2011). All of this developmental change suggests that behavioural responses to odourants may vary.
The three objectives of this study were to determine (1) whether nucleobases evoked behaviours in a structure-dependent manner, (2) whether behaviours varied over embryonic development, and (3) whether nucleobases evoked physiological responses in the sensory epithelium or at the transcriptional level.
Materials and methods
Animals
Adult AB genotype zebrafish were housed in a stand-alone system (Aquaneering, USA) at the University of Alberta. Water was passed through course filters, fluidized filter beads, and carbon cartridges and underwent UV sterilization. Fish were maintained at 28 °C on a light:dark cycle of 14 h of light and 10 h of darkness per day (LD 14:10). Adult fish were fed twice daily with a supplemented trout chow mixture including blood worms (Omega Sea, China), spirulina flakes (Cobalt Aquatics, USA), and TetraMin flakes (Tetra, Germany). Zebrafish breeding pairs were separated by dividers until the morning breeding window to reduce temporal variation in development (Westerfield 1993). Embryos collected from breeding pairs were reared in embryo medium (EM; details in the Supplementary Material) at 28.5 °C under a LD 14:10 cycle until they reached the desired testing age (5–7 dpf) (Westerfield 1993). The EM was refreshed daily and dead or morphologically abnormal embryos were removed. Adult goldfish (Carassius auratus auratus (Linnaeus, 1758)) with a length of 10–15 cm (N = 7) were obtained from Mt. Parnell Fisheries (Mercersburg, Pennsylvania) and held in dechlorinated municipal tap water at 18 °C in flow-through aquaria at the University of Alberta Aquatics Facility. Goldfish were held for >3 weeks prior to experiments. Fish held in the aquatics facility were subjected to a LD 16:8 cycle and were fed daily at 0900. Animal use was approved by the University of Alberta’s Animal Care and Use Committee (AUP #052).
Chemical stimuli
Avoidance–attraction was tested with adenine, adenosine, adenosine-5′-monophosphate monohydrate (AMP), adenosine-5′-triphosphate disodium salt hydrate (ATP), guanosine, guanosine-5′-monophosphate disodium salt hydrate (GMP), cytidine-5′-monophosphate disodium salt (CMP), uridine-5′-monophosphate disodium salt (UMP), inosine-5′-monophosphate disodium salt hydrate (Sigma, Ontario), and H3NO, which was synthesized (details in the Supplementary Material). Stock solutions of nucleobase compounds were prepared at 1 × 10⁻³ mol/L in EM, adjusted to pH 7.20 ± 0.05, and stored at −20 °C prior to testing. A nucleotide mixture was also tested, which consisted of UMP, AMP, CMP, and GMP combined at equal molarity for a final stock concentration of 4 × 10⁻³ mol/L in EM. For experiments, aliquots were thawed and solutions were prepared in EM prior to testing at final concentrations of 1 × 10⁻⁵ and 4 × 10⁻⁵ mol/L for individual compounds and the mixture, respectively. Freezing of odourant stock solutions was previously shown not to reduce their efficacy (Parra et al. 2009). For H3NO, a concentration of 5 × 10⁻⁹ mol/L was used because it was shown to be the most effective concentration in adult zebrafish (Parra et al. 2009).
Behavioural responses
There are at least two methods to examine changes in swimming behaviour evoked by odourants: introduce an odourant into a static environment and allow the fish to find it, or introduce an odourant into a flow-through environment where a fish has no choice but to find it. Each method has pros and cons. The advantage of the first method is that it allows a fish to choose to move towards or away from the stimulus (i.e., make a choice), but the disadvantage is that the introduced water may itself be a stimulus (Shamchuk and Tierney 2012). With the second method, fish are forced to experience an odourant (i.e., at the expense of choice). We used both methods but report primarily on the avoidance data because behavioural changes were largely absent in the flow-through apparatus.
Avoidance–attraction responses
Nucleobase avoidance or attraction was tested in embryonic zebrafish of 5, 6, and 7 dpf. An avoidance–attraction trough was used in which fish were acclimated to a central area before being given access to side chambers via removable inserts (all three chambers were of equal size; see Fig. S1). The trough was contained within a curtained enclosure to limit disturbances from external stimuli. For experiments, 50 mL of EM was added to the trough and the barriers were inserted. Experimental fish (n = 9–11 per trial; all larvae were tested only once) in 7 mL of EM were transferred by pipette to the middle chamber of the apparatus. The water level across the three chambers was equalized during the 20-min acclimation and the test solutions were pipetted into adjacent chambers and mixed with the pipette tip (the stimulus side was randomized). Post-acclimation, barriers were removed, which caused little water disturbance, and overhead video was recorded for 10 min (SX-920C-HR camera; Matco, Quebec, Canada). Eight to 10 trials were carried out for each stimulus. This apparatus was first validated using embryos and food extracts and manual scoring of embryo movement (Fig. 1). All behavioural trials were carried out between the hours of 0800 and 1800, ensuring light exposure only within the rearing light cycle. Zebrafish larvae may exhibit greater baseline movement in the morning versus the afternoon (MacPhail et al. 2009), and so stimulus testing time was randomized to prevent temporal biases.
Fig. 1.
To determine stimulus attraction or avoidance, we examined the motion of all larvae considered together as the centre of mass over time. This was facilitated using videograms (Fig. 2). Videos were converted to AVI files (2 frames/s) using VirtualDub (General Public License) and then converted to videograms in ImageJ (National Institutes of Health, USA) using the protocol outlined by Wyeth et al. (2011). Average image stacks were created using every 10th frame between frame 100 and the last frame (rounded to the nearest hundred). The mean background image was imported into PhotoShop (Adobe, USA) and the Clone Stamp tool was used to eliminate stationary fish from the background image. Summed images were used to create videograms for the following time bins: 1–2, 2–3, 3–4, 4–5, 5–7, and 7–10 min (the first minute was not used owing to the water disturbance immediately following barrier removal). A maximum threshold of 20% was set for frame deletion within a time bin. As a result, some time bins have a smaller n-value than the total number of trials conducted per individual odourant. The shift in centre of mass was determined as the difference between the videogram centre of mass and the apparatus centre. Shifts were converted to a millimetre scale using the length of the apparatus. Data are presented as mean centre of mass shift ± SEM.
Fig. 2.
Physiological responses
Olfaction
To determine whether nucleobases evoked responses at the olfactory epithelium, we recorded electro-olfactograms (EOGs), which capture neuron generator potential responses, from another model fish, the goldfish. We did not use zebrafish owing to challenges in measuring EOGs from such a small fish. We acknowledge that there may be species differences, but the goal was to provide evidence that olfaction may play a role in nucleobase detection in fishes, and bony fishes are not dissimilar in olfactory abilities (Tierney 2015). Goldfish were given an induction dose of 200 mg/L tricaine methanesulfonate (Syndel, British Columbia) and a maintenance dose of 100 mg/L, perfused over the gills. The covering of the right naris was surgically removed and a recording electrode was placed on the third lamella from the right of the olfactory rosette; a reference electrode of the same composition was placed within the water bath. EOGs were taken as the maximum change from baseline and were recorded from the olfactory rosettes using Ag/AgCl electrodes embedded in 2% agar and 1 mol/L NaCl plugs in borosilicate capillary tubes, as described earlier (Evans and Hara 1985). Capillary tubes were pulled using an electrode puller to achieve a tip diameter of 25 μm, trimmed using forceps to achieve a diameter of 100 μm, and flame polished before being filled. All signals were AC coupled, filtered between 0.1 and 1000 Hz, and amplified 1000×. All recordings were acquired using a PowerLab 4/25 system and Chart5 software (ADInstruments, Colorado, USA). To evoke responses, we perfused the olfactory epithelium with background water for 10 min and delivered odourants in 2-s pulses at least 2 min apart. If goldfish did not have EOGs evoked by at least two odourants or if EOGs were <0.5 mV in magnitude, the electrode was repositioned. A maximum of three repositionings were allowed per fish; if conditions were not met on the third repositioning, the fish was not used.
Concentration–response curves were constructed for a subset of nucleobases including the purine nucleosides, guanosine and adenosine, and two purine derivatives, adenine and hypoxanthine, as previously described (Evans and Hara 1985). Each compound was tested at concentrations of 1 × 10⁻⁹, 1 × 10⁻⁷, and 1 × 10⁻⁵ mol/L, a range previously used to produce a concentration–response curve for amino acids (Friedrich and Korsching 1997). For each fish, three EOGs were recorded at each concentration, and the average of these was taken as the response. Responses to background water and to 1 × 10⁻⁵ mol/L l-serine were also evaluated. Responses to background water were recorded to detect whether any potential was being generated by the switching on of the solenoid valve controlling the perfusion mechanism. Responses to l-serine were recorded to demonstrate that fish were able to smell an odourant that has already been shown to evoke a response within the species. Cross-adaptation experiments were conducted as described earlier (Bruch and Rulli 1988). With cross adaptation, if a compound shares a common receptor with another, previous exposure to one compound will diminish the response to the other. Olfactory tissue was perfused with dechlorinated municipal tap water for 10 min before adenine, adenosine, hypoxanthine, or guanosine was perfused at a concentration of 1 × 10⁻⁵ mol/L. Adaptation was allowed for 30 min or until EOGs evoked by twice the concentration of the adapting odourant (2 × 10⁻⁵ mol/L) were the same as those of background water pulses before adaptation.
Gene expression
Zebrafish larvae were exposed to a mixture of ATP, AMP, adenosine, and adenine (1 × 10⁻⁵ mol/L) from 3 to 7 dpf. Control embryos were held in EM throughout the exposure period; all solutions were changed daily. These exposures are similar to the whole-organism exposures that could occur in behavioural trials, although they are longer. At 7 dpf, larvae were euthanized on ice, preserved in RNAlater® (Thermo Fisher, Waltham, Massachusetts, USA), and stored at −20 °C until RNA extraction. Each sample of total RNA was extracted from 33 to 35 pooled whole larvae using TRIzol® Reagent (Ambion, Carlsbad, California, USA) according to the manufacturer’s instructions. Extracted RNA was then purified using an RNeasy® Mini Kit (Qiagen, Hilden, Germany) according to the manufacturer’s protocol for RNA cleanup. Genomic DNA contamination was removed by a 30-min on-column incubation with DNase using an RNase-Free DNase Set (Qiagen).
Purified RNA was suspended in 20 μL of RNase-free water and stored at −80 °C until analysis. RNA quality and concentrations were measured using a NanoVue spectrophotometer (GE Healthcare Life Sciences, Chicago, Illinois, USA) and an RNA Nano 6000 Assay Kit for the Agilent 2100 Bioanalyzer (Agilent, Santa Clara, California, USA). RNA samples were sent to Genome Quebec for high-throughput RNA sequencing (RNA-seq) analysis. Sequencing was performed to a depth of 50 million reads per sample using an Illumina HiSeq 2000 system with a 2 × 100-bp paired-end strategy and a 6-bp index read to facilitate library multiplexing (Baker and Hardiman 2014). Data were subjected to Illumina quality control procedures (>80% of the data yielded a Phred score of 30). Secondary analysis was performed using an OnRamp Bioinformatics Genomics Research Platform (OnRamp Bioinformatics, San Diego, California, USA) (Hardiman et al. 2016; Davis-Turak et al. 2017). OnRamp’s advanced Genomics Analysis Engine utilized an automated RNA-seq workflow to process the data, including (1) data validation and quality control; (2) read alignment to the zebrafish genome (DanRer7) using TopHat2 (Trapnell et al. 2012), which revealed >78% mapping of the paired-end reads; (3) generation of gene-level count data with HTSeq; and (4) differential expression analysis with DESeq2 (Love et al. 2014), which enabled the inference of differential signals with robust statistical power (Genomics Research Platform with RNA-seq workflow v1.0.1, including FastQValidator v0.1.1a, Fastqc v0.11.3, Bowtie2 v2.1.0, TopHat2 v2.0.9, HTSeq v0.6.0, and DESeq v1.8.0).
The resulting Sequence Alignment Map files were sorted and input into the Python package HTSeq to generate count data for gene-level differential expression analyses. Transcript count data from DESeq2 analysis of the samples were sorted according to their adjusted p-value or q-value, which is the smallest false discovery rate (FDR) at which a transcript is considered significant. FDR adjustment is needed with large data sets such as those resulting from RNA-seq. FDR is the expected fraction of false positive tests among significant tests and was calculated using the Benjamini–Hochberg multiple testing adjustment procedure. Statistical analysis of pathways and gene ontology terms was performed using this sorted transcript list as described previously (Kozak et al. 2013; Paolini et al. 2014) and using the ToppGene Suite (Chen et al. 2009) and GOrilla (Eden et al. 2009). Sequencing data were submitted to Gene Expression Omnibus (National Center for Biotechnology Information) and given accession number GSE97016.
Statistics
Behaviour
Centre of mass data for each stimulus at each day were analyzed using a two-way (time × stimulus) repeated-measures analysis of variance (ANOVA) followed by the Holm–Sidak post hoc test. Data sets that violated normality were rank transformed prior to parametric statistical analysis (Conover 1980). At 6 and 7 dpf, EM controls for odourant set 2 displayed a bias to the right side of the avoidance–attraction apparatus. As a result, the 6 and 7 dpf odourant trials from set 2 were compared with EM controls from set 1, where no bias was present. Values that statistically showed a bias to the right side were corrected prior to comparison with set 1 EM controls. The correction factor (CF) was defined as follows:
Statistical analysis was performed and graphs were created using SigmaPlot 11.0 (Systat, California, USA). Significance was accepted at p < 0.05. All error bars are standard error of the mean.
Physiological responses
For EOG responses, concentration responses were analyzed using a repeated-measures (fish) one-way (concentration) ranked ANOVA followed by Tukey’s post hoc test. Cross-adaptation analysis was performed in a similar manner, except that pre-exposure EOG values of each nucleobase were compared with values during adaptation. For presentation purposes, changes in EOGs are given as percent change. Error was calculated as the average of the preadaptation and adapted responses, scaled by the magnitude of change.
RNA-seq analysis
Fold-change (FC) estimation and hypothesis testing for differential expression were performed using the DESeq2 Bioconducter library (Anders and Huber 2010; Anders et al. 2013; Love et al. 2014). For each gene, DESeq2 reported an estimated FC and provided an adjusted p- or q-value equivalent to the smallest FDR incurred when declaring that test significant.
Results
Behavioural responses
Overall, purines (double-ring nucleobases) induced behavioural responses, whereas pyrimidines (single-ring nucleobases) did not. When observed, behavioural responses were almost exclusively avoidance, and all tended to occur later in the trials (i.e., >5 min). Responses to un-phosphorylated compounds (adenine and adenosine) occurred early in development (5 dpf), while those to phosphorylated compounds (AMP and ATP) occurred later (7 dpf) (Fig. 3). Specifically, adenine was avoided at 7–10 min (p = 0.048), and a similar trend was present for adenosine at 7–10 min (p = 0.056). In contrast, larvae avoided AMP and ATP at 7 dpf, both at 5–7 min (AMP, p = 0.069; ATP, p = 0.019) and at 7–10 min (AMP, p = 0.013; ATP, p = 0.004). Hypoxanthine and guanine-based purines (those with a 6-oxo group on the major ring) did not evoke avoidance or attraction, with one exception: GMP evoked attraction at 3–4 min (p = 0.029) (Fig. 4). Interestingly, although H3NO did not evoke avoidance, in a flow-through chamber it evoked an increase in distance travelled during the first minute of exposure (H3NO vs. EM: 75.8% ± 31.8% vs. −16.1% ± 16.3%; p = 0.0326; Fig. S3), which coincided with an increase in maximum velocity (H3NO vs. EM: 262 ± 31.0 vs. 138 ± 31.0 mm/s; p < 0.05; Fig. S4). No other compounds evoked changes in activity.
Fig. 3.
Fig. 4.
The pyrimidines CMP and UMP did not evoke responses at any time during the 10-min exposure window in 5–7 dpf larvae, nor did they evoke responses when mixed with the purines AMP and GMP (Fig. 5).
Fig. 5.
There were some interactions between time and stimulus, in which the centre of mass tended to diverge over the 10-min trials (all statistical results are given in Table S3). This was noted for adenosine at 5 dpf (F5,117 = 4.87, p < 0.001), AMP at 6 dpf (F5,104 = 4.61, p = 0.001), ATP at 5 and 7 dpf (F5,111 = 5.167, p < 0.00; F5,116 = 2.39, p = 0.044), and GMP at 5 dpf (F5,110 = 3.34, p = 0.009). However, pairwise differences were found only for ATP at 7 dpf (Fig. 3L).
Considering behavioural responses over time alone, an interesting trend was apparent: fish generally moved from one side of the tank to the other over 10 min. This was apparent for hypoxanthine, H3NO, guanosine, and the nucleotide mixture at 6 dpf (F5,112 = 4.87, p < 0.001; F5,106 = 9.42, p < 0.001; F5,105 = 4.74, p < 0.001; F5,106 = 2.69, p = 0.027) and for CMP and UMP at 7 dpf (F5,116 = 6.83, p < 0.001; F5,117 = 7.48, p < 0.001).
Physiological responses
Olfaction
Of the four purines tested, three evoked olfactory tissue responses with some degree of concentration dependency (adenosine, hypoxanthine, and guanosine; p-values: <0.001, 0.047, and <0.001), while one did not (adenine, p = 0.531) (Fig. 6).
Fig. 6.
With cross adaptation, reciprocal knockdown of generator potential responses suggests a common receptor; a lack of reciprocal knockdown has less certain meaning. The former occurred for adenine and guanosine (adenine adaptation reduced guanosine responses, p = 0.021; guanosine adaptation reduced adenine responses, p = 0.018; Fig. 7). This was quite unexpected owing to appreciable structural differences between the two (see Table 1). The latter occurred with adenosine and hypoxanthine: adaptation to adenosine knocked down hypoxanthine responses (p = 0.013), but hypoxanthine adaptation did not affect adenosine responses. Conceivably, adenosine may have activated many hypoxanthine receptors, but hypoxanthine may not have activated many adenosine receptors. Alternatively, if we consider that the pathways may not be wholly separate, then perhaps adenosine activated the hypoxanthine pathway, but hypoxanthine did not activate the adenosine pathway.
Fig. 7.
Gene expression
Sequencing analysis identified 680 significantly differentially expressed genes (DEGs) at FDR <0.1 and 2045 DEGs at FDR <0.4, when referenced to the D. rerio genome (43 DEGs with a linear FC >2). These were analyzed using GOrilla. The protein FASTA sequences from Ensembl for zebrafish were compared using Ensembl’s homology to create protein FASTA files that contained a human Entrez gene ID that mapped to zebrafish (Renaud et al. 2017). This enabled a more comprehensive pathway-based analysis using human gene IDs with the ToppGene Suite. This analysis returned 1955 DEGs at FDR <0.1 and 4218 DEGs at FDR <0.4 (77 DEGs with a linear FC >2). The majority of the top 10 DEGs in both analyses belong to the tubulin, ubiquitin, and ribosomal protein gene families (Table S1).
Many zebrafish genes involved in nucleotide, guanosine triphosphate (GTP), and ATP binding were upregulated by exposure to the mixture of ATP, AMP, adenosine, and adenine (Table 2). The human gene ID appended output indicated that genes involved in nucleotide binding, specifically guanine nucleotides, were upregulated by exposure (Table 3).
Table 2.
| Symbol | Description/function | Linear fold change | Adjusted p-value |
|---|---|---|---|
| zgc:153713 | Ras homolog gene family, member A/GTPase protein | 6.33 | 2.68E-65 |
| zgc:55461 | Tubulin, beta 2b/GTP binding | 3.41 | 6.58E-47 |
| zgc:86709 | ATP binding | 2.56 | 2.51E-15 |
Table 3.
| Symbol | Description | Linear fold change | Adjusted p-value |
|---|---|---|---|
| GNG13 | Guanine nucleotide binding protein (G protein), gamma 13 | 2.36 | 1.09E-33 |
| GBP6 | Guanylate binding protein family, member 6 | 1.81 | 6.78E-24 |
| GNB2L1 | Guanine nucleotide binding protein (G protein), beta polypeptide 2-like 1 | 1.52 | 2.93E-11 |
The top five altered molecular functions were very similar between the zebrafish and the human gene ID appended results, with the top four being the same (Table S2). These altered functions are mostly involved in cell component structure and RNA binding. Although the human gene ID appended analysis revealed many functions involving purine binding and transporter activity within the top 50 altered functions (Table 4), when referenced to the zebrafish genome, adenosine receptor binding was the only function involving purine binding and transporter activity within the top 50 DEGs (p = 0.01).
Table 4.
| Name | Adjusted p-value |
|---|---|
| Guanyl ribonucleotide binding | 8.56E-13 |
| Guanyl nucleotide binding | 9.06E-13 |
| Purine ribonucleoside triphosphate binding | 3.25E-9 |
| Purine ribonucleoside binding | 4.13E-9 |
| Purine nucleoside binding | 4.36E-9 |
| Purine ribonucleotide binding | 7.88E-9 |
| Purine nucleotide binding | 1.03E-8 |
| Adenine transmembrane transporter activity | 3.90E-4 |
| Purine nucleobase transmembrane transporter activity | 1.91E-3 |
Discussion
Purine nucleobases evoked behaviours, caused neuronal responses, and evoked changes in gene expression. Although some of the responses were expected, such as ATP avoidance, many were not, including neuronal responses at a very low threshold and the expression of many genes with unclear relevance to nucleobase exposure or chemosensation.
Behaviour
Apart from four instances among 36 different time–odourant combinations, larval zebrafish did not respond to nucleobases. When responses were observed, nucleobases evoked avoidance (with only one exception), and the responses were dependent on nucleobase structure and embryo age. The data demonstrate that adenine-containing compounds may cause behavioural change depending on dpf. Recently, it was demonstrated that ATP may be enzymatically converted to adenosine at the olfactory epithelium and that adenosine activates a novel receptor (Wakisaka et al. 2017). Given that we noted changes in response to adenine, ATP, and AMP, it is possible that adenine is capable of stimulating the same receptor or that it has its own unique receptor. The first option may be unlikely, as Wakisaka et al. (2017) found that adenine did not lead to activation of the same glomerulus in the olfactory bulb that adenosine did. Regardless, our findings are in agreement with previous studies that showed that adenine-containing compounds evoked the most potent responses (Friend and Smith 1971; Carr et al. 1986).
Attractive responses to ATP and AMP were expected owing to the ability of these compounds to evoke feeding in other species (Friend and Smith 1971; Smith and Griend 1976; Mearns et al. 1987; Miyasaki and Harada 2003; Romero and Schal 2014). However, such responses were not observed in zebrafish larvae, likely because of fish age. A study of feeding on nucleotide-enriched agar showed that nucleotides deterred feeding in Atlantic salmon parr but stimulated feeding in adult rainbow trout (Mearns et al. 1987). This raises the question, is there a reason why younger fish are deterred by nucleotides? There are at least two potential explanations: (1) stimulus naivety and (2) stimulus significance. In the case of salmon parr, the fish have not yet made their oceanic migration and it is possible that the nucleotides used in the study (sourced from shrimp) were not yet familiar as food odourants. The same is possible for zebrafish larvae—they have not yet been exposed to food and therefore may not associate nucleotides with food. In support of this, adult zebrafish were attracted to adenosine-containing compounds (Wakisaka et al. 2017). Alternatively, considering that nucleotides are found in biological tissues such as blood, perhaps salmon parr and zebrafish larvae are prey (Mearns et al. 1987; Carr et al. 1996; Engeszer et al. 2007; Romero and Schal 2014), and so ATP indicates an alarm cue (e.g., recent release from a nearby sibling).
A relationship between the number of phosphates and the strength of the behavioural response was not observed. In studies of insects, decreased phosphorylation was associated with decreased stimulatory efficacy (Friend and Smith 1971; Smith and Griend 1976; Romero and Schal 2014). In the present study, there was no observed relationship between the number of phosphates and the capacity to evoke behaviours. However, we did not directly compare responses to AMP and ATP and so cannot draw definitive conclusions. To confirm our finding, future studies should include dual odourant trials (i.e., comparison of two odourants, one on each side of the attraction–avoidance apparatus).
We were surprised that no pyrimidines evoked responses, as cytidine- and uridine-containing nucleotides initiated gorging behaviour in the kissing bug, and CTP stimulated spiny lobster chemosensory cells (Friend and Smith 1971; Smith and Griend 1976; Carr et al. 1996). Based on these studies, we expected that the phosphate groups in nucleotides would drive the behavioural responses. We found the opposite, as it appears that for embryonic zebrafish, nucleobase structure is the determining factor. Interestingly, in abalone and oriental weatherfish (Misgurnus anguillicaudatus (Cantor, 1842)), neither CMP nor UMP increased feeding responses; however, the pyrimidine thymidine was effective (Brown et al. 2001). We suggest that pyrimidine responses be tested in adult zebrafish.
It was also surprising that H3NO, a potent alarm-inducing compound, did not evoke avoidance. However, when zebrafish larvae were placed in a flow-through chamber and forced to experience H3NO, they responded rapidly (≤1 min) with increased swimming activity and speed. Typically in adult fishes, alarm response is apparent in dashing, which may be followed by immobility or “freezing”. However, in adult zebrafish, H3NO has only been observed to evoke increases in activity (Speedie and Gerlai 2008; Parra et al. 2009; Mathuru et al. 2012; Kalueff et al. 2013; Gallus et al. 2016). Our study agrees with the adult data and demonstrates that alarm-like behaviour can be evoked by H3NO just days into zebrafish development.
Hypoxanthine did not evoke avoidance, which confirms earlier work in fathead minnows (Pimephales promelas Rafinesque, 1820) and finescale dace (Chrosomus neogaeus (Cope, 1867)), in which compounds that lacked a nitrogen-oxide functional group, including hypoxanthine, failed to evoke alarm responses (Brown et al. 2000). The results of the present study suggest that the nitrogen-oxide group is likely related to an alarm response and the basic purine ring structure is related to an avoidance response.
The nucleotide mixture did not evoke any avoidance or attraction response despite containing behaviourally active AMP and GMP. This may be a result of the ratio and combination of compounds within the mixture, or it may be because the active stimuli were lost in the noise of the inactive. Because nucleotides are most likely to appear in nature as mixtures, additional combinations should be tested that better represent the nucleotide composition of food and conspecific tissue extracts.
There was just one example of zebrafish attraction response—to GMP—and it was a true oddity because it occurred 3–4 min into the trial (no other responses were seen at this time). In contrast to GMP, guanosine evoked no response, suggesting that the presence of phosphate has the potential to alter odourant efficacy. However, because not all of the tested nucleotides evoked a response (UMP and CMP did not), the presence of phosphate alone does not appear sufficient to evoke a behavioural response. This leaves three possibilities: (1) odourant–receptor interaction is based on three-dimensional structure and is therefore influenced by the complete form of the nucleotide, (2) GMP circumvents the odourant–receptor interaction, or (3) this finding was a statistical aberration.
Olfactory-evoked behaviours vary with age
Odourant responses were observed almost exclusively at 5 and 7 dpf, not 6 dpf. This is interesting because previous studies have shown that zebrafish develop kin odour recognition at 6 dpf (Gerlach et al. 2008; Hinz et al. 2013). At 6 dpf, zebrafish larvae exhibit an increase in thyroid hormone receptor β mRNA and whole-body thyroxine (Liu and Chan 2002; Chang et al. 2012). In a salmonid species (Oncorhynchus kisutch Walbaum, 1792) known to imprint to the odours of the natal stream, elevated plasma thyroxine was associated with olfactory epithelium proliferation (Lema and Nevitt 2004). This behavioural and hormonal evidence has led to the theory that olfactory imprinting occurs at 6 dpf. If imprinting occurs at 6 dpf, it is possible that the dynamic status of the olfactory system at this time affects odourant interpretation. An alternative explanation for temporal changes in responses may be asynchronous expression of olfactory receptors, as studies have shown that the onset of expression of odourant receptors varies (Barth et al. 1996; Argo et al. 2003).
Physiological responses to nucleobases
Olfactory responses
In the current study, response at the olfactory epithelium should only be used to address three questions: (1) is the response to nucleobases similar to the response to known odourants (is there a concentration–response relationship), (2) is nucleobase sensitivity similar to sensitivities to known odourants, and (3) do nucleobases share receptors (does the presence of one diminish the response to another)? For a variety of reasons, drawing direct comparisons between behavioural responses of zebrafish larvae and olfactory responses of goldfish should be done with caution. Among the reasons are differences between species, developmental stages, and importantly, nucleobase exposure routes. Zebrafish larvae may be receiving nucleobase sensory input from numerous routes (e.g., the gustatory system (Hansen et al. 2002; Yacoob and Browman 2007; Oka and Korsching 2011) or solitary chemosensory cells (Kotrschal et al. 1997)), whereas goldfish responses were recorded from isolated olfactory epithelium. At a minimum, goldfish olfactory epithelial responses suggest that nucleobases may serve as odourants and, since adenine, adenosine, and guanosine tended to knock down responses to each other, that some nucleobases share common receptors. Recently, it was found that ATP is converted to adenosine in a three-step, two-enzyme system on the olfactory epithelium and that adenosine acts on a specific receptor (Wakisaka et al. 2017).
Some of the nucleobase-evoked responses (i.e., those to adenosine, hypoxanthine, and guanosine) were consistent with concentration dependency, as neuron generator potential responses increased between 1 × 10⁻⁹ and 1 × 10⁻⁷ mol/L. This suggests that zebrafish behavioural responses may have been partly due to olfaction. What was curious, however, was that the olfactory responses occurred between 1 × 10⁻⁹ and 1 × 10⁻⁷ mol/L and not between 1 × 10⁻⁷ and 1 × 10⁻⁵ mol/L. We selected the concentration range to capture responses similar to the sigmoidal responses to amino acids, which begin at approximately 1 × 10⁻⁸ mol/L and plateau at 1 × 10⁻³ mol/L (Hara and Zhang 1996; Friedrich and Korsching 1997; Baldwin et al. 2003; Tierney et al. 2007). Because robust responses were present at nucleobase concentrations of 1 × 10⁻⁹ mol/L, the olfactory epithelium appears to be more sensitive to nucleobases than amino acids. In support of this, Parra et al. (2009) found that H3NO evoked alarm responses at 1 × 10⁻⁹ mol/L. Olfactory responses at such high dilution are not unusual; rather, they are common to odourants considered “pheromones” (Rosenblum et al. 1991; Moore and Waring 1996; Stacey 2003). Responses to pheromones may occur at dilutions as high as 1 × 10⁻¹² mol/L (Li et al. 1995; Keller-Costa et al. 2014). We are not suggesting that nucleobases are pheromones (i.e., species-specific signals), but we do leave open the possibility that nucleobases are effective at high dilution and may evoke physiological responses.
Intriguingly, responses to adenine were independent of concentration over a large (10 000-fold) range. Perhaps adenine does not stimulate responses through an olfactory pathway. Olfactory neurons have cyclic nucleotide-gated (CNG) channels that open in response to elevated cyclic nucleotides (cAMP and cGMP), allowing for the influx of calcium and subsequent depolarization of the neuron (Goulding et al. 1992; Zheng and Zagotta 2004). Embryonic zebrafish begin expressing CNG cation channels in the olfactory placode at approximately 24 h post-fertilization.
Gene expression
Gene expression data revealed numerous DEGs following exposure to the mixture of ATP, AMP, adenosine, and adenine. Many genes and biological processes involved in purine binding, specifically guanine binding, were upregulated by the exposure, which was expected because the mixture consisted of purines. The upregulation of genes involved in GTP binding suggests increased cell signalling, which was not unexpected (Mombaerts 1999; Howard et al. 2001). G proteins are also involved in regulating the actin cytoskeleton, which may explain the upregulation of cytoskeleton-related genes (Matsumoto et al. 2004).
Although numerous genes encoding G proteins were upregulated by the exposure, none have been specifically associated with the recognition of exogenous purines. Many of the GTP-binding genes that were altered have not been fully characterized. These genes (and proteins) should be further studied to elucidate any involvement in exogenous nucleotide binding and chemosensation.
The human gene ID appended analysis of the zebrafish DEGs supported the results obtained from the zebrafish genome. Both sets of results revealed many of the same altered genes and molecular functions. Remarkably, the humanized mRNA analysis predicted that the larvae had been exposed to guanosine, which is similar to the exposure mixture used in this study.
Acknowledgements
We thank Patricia Leighton, Vlatka Vukojevic, Irtiza Oyon, and Elielma de Sousa. We extend sincere gratitude to the Aquatics Facility Staff, including Clarence Gerla, Aleah McCorry, and Jesse Edgington, and to Jason Dibbs, Jeffrey Johnston, Troy Locke, Ben McDonald, and Shelley Scott for help with equipment and techniques. We are also grateful to Russell Wyeth for his invaluable help with the videogram method. GH acknowledges start-up funds from the Department of Medicine at the Medical University of South Carolina. Lastly, we greatly appreciated the help of Dr. Viviane Verlhac. This work was funded by grants from DSM Nutritional Products and the Natural Sciences and Engineering Research Council of Canada to KBT.
References
Anders S, and Huber W. 2010. Differential expression analysis for sequence count data. Genome Biology, 11(10): R106.
Anders S, McCarthy DJ, Chen Y, Okoniewski M, Smyth GK, Huber W, et al. 2013. Count-based differential expression analysis of RNA sequencing data using R and Bioconductor. Nature Protocols, 8(9): 1765–1786.
Argo S, Weth F, and Korsching SI. 2003. Analysis of penetrance and expressivity during ontogenesis supports a stochastic choice of zebrafish odorant receptors from predetermined groups of receptor genes. European Journal of Neuroscience, 17(4): 833–843.
Baker ME, and Hardiman G. 2014. Transcriptional analysis of endocrine disruption using zebrafish and massively parallel sequencing. Journal of Molecular Endocrinology, 52(3): R241–R256.
Baldwin DH, Sandahl JF, Labenia JS, and Scholz NL. 2003. Sublethal effects of copper on coho salmon: impacts on nonoverlapping receptor pathways in the peripheral olfactory nervous system. Environmental Toxicology and Chemistry, 22(10): 2266–2274.
Barth AL, Justice NJ, and Ngai J. 1996. Asynchronous onset of odorant receptor expression in the developing zebrafish olfactory system. Neuron, 16(1): 23–34.
Bhinder G, and Tierney K. 2012. Olfactory-evoked activity assay for larval zebrafish. In Zebrafish protocols for neurobehavioral research. Edited by AV Kalueff andAM Stewart. Humana Press, New York City, New York. pp. 71–84.
Braubach OR, Wood H-D, Gadbois S, Fine A, and Croll RP. 2009. Olfactory conditioning in the zebrafish (Danio rerio). Behavioural Brain Research, 198(1): 190–198.
Brown GE, Adrian JC Jr, Smyth E, Leet H, and Brennan S. 2000. Ostariophysan alarm pheromones: laboratory and field tests of the functional significance of nitrogen oxides. Journal of Chemical Ecology, 26(1): 139–154.
Brown GE, Adrian JC Jr, and Shih ML. 2001. Behavioural responses of fathead minnows to hypoxanthine-3-N-oxide at varying concentrations. Journal of Fish Biology, 58(5): 1465–1470.
Brown GE, Adrian JC Jr, Naderi NT, Harvey MC, and Kelly JM. 2003. Nitrogen oxides elicit antipredator responses in juvenile channel catfish, but not in convict cichlids or rainbow trout: conservation of the Ostariophysan alarm pheromone. Journal of Chemical Ecology, 29(8): 1781–1796.
Bruch RC, and Rulli RD. 1988. Ligand binding specificity of a neutral l-amino acid olfactory receptor. Comparative Biochemistry and Physiology Part B: Comparative Biochemistry, 91(3): 535–540.
Carr WES, Gleeson RA, Ache BW, and Milstead ML. 1986. Olfactory receptors of the spiny lobster: ATP-sensitive cells with similarities to P2-type purinoceptors of vertebrates. Journal of Comparative Physiology A: Neuroethology, Sensory, Neural, and Behavioral Physiology, 158(3): 331–338.
Carr WES, Netherton JC III, Gleeson RA, and Derby CD. 1996. Stimulants of feeding behavior in fish: analyses of tissues of diverse marine organisms. The Biological Bulletin, 190(2): 149–160.
Chang J, Wang M, Gui W, Zhao Y, Yu L, and Zhu G. 2012. Changes in thyroid hormone levels during zebrafish development. Zoological Science, 29(3): 181–184.
Chen J, Bardes EE, Aronow BJ, and Jegga AG. 2009. ToppGene Suite for gene list enrichment analysis and candidate gene prioritization. Nucleic Acids Research, 37(Suppl. 2): W305–W311.
Colwill RM, and Creton R. 2011. Locomotor behaviors in zebrafish (Danio rerio) larvae. Behavioural Processes, 86(2): 222–229.
Conover WJ. 1980. Practical nonparametric statistics. John Wiley & Sons, Inc., New York, New York.
Davis-Turak J, Courtney SM, Hazard ES, Glen WB Jr, da Silveira WA, Wesselman T, et al. 2017. Genomics pipelines and data integration: challenges and opportunities in the research setting. Expert Review of Molecular Diagnostics, 17(3): 225–237.
Demain AL, Burg RW, and Hendlin D. 1965. Excretion and degradation of ribonucleic acid by Bacillus subtilis. Journal of Bacteriology, 89(3): 640–646.
Eden E, Navon R, Steinfeld I, Lipson D, and Yakhini Z. 2009. GOrilla: a tool for discovery and visualization of enriched GO terms in ranked gene lists. BMC Bioinformatics, 10(1): 48.
Engeszer RE, Patterson LB, Rao AA, and Parichy DM. 2007. Zebrafish in the wild: a review of natural history and new notes from the field. Zebrafish, 4(1): 21–40.
Evans RE, and Hara TJ. 1985. The characteristics of the electro-olfactogram (EOG): its loss and recovery following olfactory nerve section in rainbow trout (Salmo gairdneri). Brain Research, 330(1): 65–75.
Friedrich RW, and Korsching SI. 1997. Combinatorial and chemotopic odorant coding in the zebrafish olfactory bulb visualized by optical imaging. Neuron, 18: 737–752.
Friend WG, and Smith JJB. 1971. Feeding in Rhodnius prolixus: potencies of nucleoside phosphates in initiating gorging. Journal of Insect Physiology, 17(7): 1315–1320.
Gallus L, Marchesotti E, Scarfì S, Amaroli A, Franceschini V, Bettini S, et al. 2016. Effects of urea on the olfactory reception in zebrafish (Danio rerio). Journal of Biological Research: Bollettino della Società Italiana di Biologia Sperimentale, 89(1): 5868.
Gerlach G, Hodgins-Davis A, Avolio C, and Schunter C. 2008. Kin recognition in zebrafish: a 24-hour window for olfactory imprinting. Proceedings of the Royal Society B: Biological Sciences, 275(1647): 2165–2170.
Goulding EH, Ngai J, Kramer RH, Colicos S, Axel R, Siegelbaum SA, et al. 1992. Molecular cloning and single-channel properties of the cyclic nucleotide-gated channel from catfish olfactory neurons. Neuron, 8(1): 45–58.
Hansen A, Reutter K, and Zeiske E. 2002. Taste bud development in the zebrafish, Danio rerio. Developmental Dynamics, 223(4): 483–496.
Hara TJ, and Zhang C. 1996. Spatial projections to the olfactory bulb of functionally distinct and randomly distributed primary neurons in salmonid fishes. Neuroscience Research, 26(1): 65–74.
Hardiman G, Savage SJ, Hazard ES, Wilson RC, Courtney SM, Smith MT, et al. 2016. Systems analysis of the prostate transcriptome in African–American men compared with European–American men. Pharmacogenomics, 17(10): 1129–1143.
Hinz C, Kobbenbring S, Kress S, Sigman L, Müller A, and Gerlach G. 2013. Kin recognition in zebrafish, Danio rerio, is based on imprinting on olfactory and visual stimuli. Animal Behaviour, 85(5): 925–930.
Howard AD, McAllister G, Feighner SD, Liu Q, Nargund RP, Van der Ploeg LHT, et al. 2001. Orphan G-protein-coupled receptors and natural ligand discovery. Trends in Pharmacological Sciences, 22(3): 132–140.
Jones KA, and Hara TJ. 1985. Behavioural responses of fishes to chemical cues: results from a new bioassay. Journal of Fish Biology, 27(4): 495–504.
Kalueff AV, Gebhardt M, Stewart AM, Cachat JM, Brimmer M, Chawla JS, et al. 2013. Towards a comprehensive catalog of zebrafish behavior 1.0 and beyond. Zebrafish, 10(1): 70–86.
Keller-Costa T, Canário AVM, and Hubbard PC. 2014. Olfactory sensitivity to steroid glucuronates in Mozambique tilapia suggests two distinct and specific receptors for pheromone detection. Journal of Experimental Biology, 217: 4203–4212.
Kimmel CB, Ballard WW, Kimmel SR, Ullmann B, and Schilling TF. 1995. Stages of embryonic development of the zebrafish. Developmental Dynamics, 203(3): 253–310.
Kotrschal K, Krautgartner W-D, and Hansen A. 1997. Ontogeny of the solitary chemosensory cells in the zebrafish, Danio rerio. Chemical Senses, 22(2): 111–118.
Kozak I, Sasik R, Freeman WR, Sprague LJ, Gomez ML, Cheng L, et al. 2013. A degenerative retinal process in HIV-associated non-infectious retinopathy. PLoS ONE, 8(9): e74712.
Lema SC, and Nevitt GA. 2004. Evidence that thyroid hormone induces olfactory cellular proliferation in salmon during a sensitive period for imprinting. Journal of Experimental Biology, 207(19): 3317–3327.
Li J, Mack JA, Souren M, Yaksi E, Higashijima S, Mione M, et al. 2005. Early development of functional spatial maps in the zebrafish olfactory bulb. The Journal of Neuroscience, 25(24): 5784–5795.
Li W, Sorensen PW, and Gallaher DD. 1995. The olfactory system of migratory adult sea lamprey (Petromyzon marinus) is specifically and acutely sensitive to unique bile acids released by conspecific larvae. The Journal of General Physiology, 105(5): 569–587.
Lindsay SM, and Vogt RG. 2004. Behavioral responses of newly hatched zebrafish (Danio rerio) to amino acid chemostimulants. Chemical Senses, 29(2): 93–100.
Liu Y-W, and Chan W-K. 2002. Thyroid hormones are important for embryonic to larval transitory phase in zebrafish. Differentiation, 70(1): 36–45.
Love MI, Huber W, and Anders S. 2014. Moderated estimation of fold change and dispersion for RNA-seq data with DESeq2. Genome Biology, 15(12): 550.
MacPhail RC, Brooks J, Hunter DL, Padnos B, Irons TD, and Padilla S. 2009. Locomotion in larval zebrafish: influence of time of day, lighting and ethanol. NeuroToxicology, 30(1): 52–58.
Mathuru AS, Kibat C, Cheong WF, Shui G, Wenk MR, Friedrich RW, et al. 2012. Chondroitin fragments are odorants that trigger fear behavior in fish. Current Biology, 22(6): 538–544.
Matsumoto Y, Imai Y, Yoshida NL, Sugita Y, Tanaka T, Tsujimoto G, et al. 2004. Upregulation of the transcript level of GTPase activating protein KIAA0603 in T cells from patients with atopic dermatitis. FEBS Letters, 572(1–3): 135–140.
Mearns KJ, Ellingsen OF, Døving KB, and Helmer S. 1987. Feeding behaviour in adult rainbow trout and Atlantic salmon parr, elicited by chemical fractions and mixtures of compounds identified in shrimp extract. Aquaculture, 64(1): 47–63.
Miyasaki T, and Harada K. 2003. Effects of specific purine and pyrimidine compounds on the ingestion of test diets by the abalone Haliotis discus and the oriental weatherfish Misgurnus anguillicaudatus. Marine and Freshwater Research, 54(3): 235–241.
Mombaerts P. 1999. Seven-transmembrane proteins as odorant and chemosensory receptors. Science, 286(5440): 707–711.
Moore A, and Waring CP. 1996. Electrophysiological and endocrinological evidence that F-series prostaglandins function as priming pheromones in mature male Atlantic salmon (Salmo salar) parr. Journal of Experimental Biology, 199(10): 2307–2316.
Murad F, and Pak CYC. 1972. Urinary excretion of adenosine 3′,5′-monophosphate and guanosine 3′,5′-monophosphate. The New England Journal of Medicine, 286(26): 1382–1387.
Oka Y, and Korsching SI. 2011. Shared and unique G alpha proteins in the zebrafish versus mammalian senses of taste and smell. Chemical Senses, 36(4): 357–365.
Okabayashi T, Yoshimoto A, and Ide M. 1963. Occurrence of nucleotides in culture fluids of microorganisms. V. Excretion of adenosine cyclic 3′,5′-phosphate by Brevibacterium liquefaciens sp. n. Journal of Bacteriology, 86(5): 930–936.
Paolini P, Pick D, Lapira J, Sannino G, Pasqualini L, Ludka C, et al. 2014. Developmental and extracellular matrix-remodeling processes in rosiglitazone-exposed neonatal rat cardiomyocytes. Pharmacogenomics, 15(6): 759–774.
Parra KV, Adrian JC Jr, and Gerlai R. 2009. The synthetic substance hypoxanthine 3-N-oxide elicits alarm reactions in zebrafish (Danio rerio). Behavioural Brain Research, 205(2): 336–341.
Renaud L, da Silveira WA, Hazard ES, Simpson J, Falcinelli S, Chung D, et al. 2017. The plasticizer bisphenol A perturbs the hepatic epigenome: a systems level analysis of the miRNome. Genes, 8(10): E269.
Romero A, and Schal C. 2014. Blood constituents as phagostimulants for the bed bug, Cimex lectularius L. Journal of Experimental Biology, 217(4): 552–557.
Rosenblum PM, Sorensen PW, Stacey NE, and Peter RE. 1991. Binding of the steroidal pheromone 17α,20β-dihydroxy-4-pregnen-3-one to goldfish (Carassius auratus) olfactory epithelium membrane preparations. Chemical Senses, 16(2): 143–154.
Saier MH Jr, Feucht BU, and McCaman MT. 1975. Regulation of intracellular adenosine cyclic 3′:5′-monophosphate levels in Escherichia coli and Salmonella typhimurium. Evidence for energy-dependent excretion of the cyclic nucleotide. The Journal of Biological Chemistry, 250(19): 7593–7601.
Sato T, Saito K, Takezawa J, Fujishima T, Iijima T, Kuninaka A, et al. 1981. Urinary excretion of cyclic nucleotides and principal electrolytes in healthy humans of different ages. Clinica Chimica Acta, 110(2–3): 215–225.
Shamchuk AL, and Tierney KB. 2012. Phenotyping stimulus evoked responses in larval zebrafish. Behaviour, 149(10–12): 1177–1203.
Smith JJB, and Griend WG. 1976. Further studies on potencies of nucleotides as gorging stimuli during feeding in Rhodnius prolixus. Journal of Insect Physiology, 22(4): 607–611.
Speedie N, and Gerlai R. 2008. Alarm substance induced behavioral responses in zebrafish (Danio rerio). Behavioural Brain Research, 188(1): 168–177.
Stacey N. 2003. Hormones, pheromones and reproductive behavior. Fish Physiology and Biochemistry, 28(1–4): 229–235.
Tierney KB. 2015. Olfaction in aquatic vertebrates. In Handbook of olfaction and gustation: modern perspectives. Edited by RL Doty. Wiley-Blackwell, Hoboken, New Jersey. pp. 547–565.
Tierney KB. 2016. Chemical avoidance responses of fishes. Aquatic Toxicology, 174: 228–241.
Tierney KB, Singh CR, Ross PS, and Kennedy CJ. 2007. Relating olfactory neurotoxicity to altered olfactory-mediated behaviors in rainbow trout exposed to three currently-used pesticides. Aquatic Toxicology, 81(1): 55–64.
Trapnell C, Roberts A, Goff L, Pertea G, Kim D, Kelley DR, et al. 2012. Differential gene and transcript expression analysis of RNA-seq experiments with TopHat and Cufflinks. Nature Protocols, 7(3): 562–578.
Vitebsky A, Reyes R, Sanderson MJ, Michel WC, and Whitlock KE. 2005. Isolation and characterization of the laure olfactory behavioral mutant in the zebrafish, Danio rerio. Developmental Dynamics, 234(1): 229–242.
Wakisaka N, Miyasaka N, Koide T, Masuda M, Hiraki-Kajiyama T, and Yoshihara Y. 2017. An adenosine receptor for olfaction in fish. Current Biology, 27(10): 1437–1447.e4.
Westerfield M. 1993. The zebrafish book: a guide for the laboratory use of zebrafish (Brachydanio rerio). University of Oregon Press, Eugene, Oregon.
Wyeth RC, Braubach OR, Fine A, and Croll RP. 2011. Videograms: a method for repeatable unbiased quantitative behavioral analysis without scoring or tracking. In Zebrafish neurobehavioral protocols. Edited by AV Kalueff andJM Cachat. Humana Press, New York City, New York. pp. 15–33.
Yacoob SY, and Browman HI. 2007. Olfactory and gustatory sensitivity to some feed-related chemicals in the Atlantic halibut (Hippoglossus hippoglossus). Aquaculture, 263(1–4): 303–309.
Zheng J, and Zagotta WN. 2004. Stoichiometry and assembly of olfactory cyclic nucleotide-gated channels. Neuron, 42(3): 411–421.
Supplementary material
Supplementary Material 1 (DOCX / 19.9 MB)
- Download
- 19.94 MB
Information & Authors
Information
Published In

FACETS
Volume 3 • Number 1 • October 2018
Pages: 79 - 102
Editor: Imogen Coe
History
Received: 14 July 2017
Accepted: 25 September 2017
Version of record online: 2 February 2018
Corrected: 8 June 2018
Copyright
© 2018 Shamchuk et al. This work is licensed under a Creative Commons Attribution 4.0 International License (CC BY 4.0), which permits unrestricted use, distribution, and reproduction in any medium, provided the original author(s) and source are credited.
Data Availability Statement
All relevant data are within the paper, the Supplementary Material, and in the Gene Expression Omnibus (NCBI) (ncbi.nlm.nih.gov/geo/; accession number for sequencing data is GSE97016).
Key Words
Sections
Subjects
Plain Language Summary
How do fish respond to the odour of DNA?
Authors
Author Contributions
ALS, BJB, and KBT conceived and designed the study.
ALS, BJB, DDL, MQW, AG, CRL, and KT performed the experiments/collected the data.
All analyzed and interpreted the data.
KT, ESH, GH, and KBT contributed resources.
ALS, BJB, DDL, CRL, KT, ESH, GH, and KBT drafted or revised the manuscript.
Competing Interests
The authors have declared that no competing interests exist.
Metrics & Citations
Metrics
Other Metrics
Citations
Cite As
Angela L. Shamchuk, Brian J. Blunt, Danielle D. Lyons, Mo Qi Wang, Anastasia Gasheva, Carlie R. Lewis, Kirsten Tomlin, E. Starr Hazard, Gary Hardiman, and Keith B. Tierney. 2018. Nucleobase-containing compounds evoke behavioural, olfactory, and transcriptional responses in model fishes. FACETS.
3(1): 79-102. https://doi.org/10.1139/facets-2017-0101
Export Citations
If you have the appropriate software installed, you can download article citation data to the citation manager of your choice. Simply select your manager software from the list below and click Download.
Cited by
1. Bisphenol A alters retinal morphology, visually guided behavior, and thyroid hormone levels in zebrafish larvae
2. Triclosan and triclocarban weaken the olfactory capacity of goldfish by constraining odorant recognition, disrupting olfactory signal transduction, and disturbing olfactory information processing
3. Anti-Depressant Fluoxetine Hampers Olfaction of Goldfish by Interfering with the Initiation, Transmission, and Processing of Olfactory Signals
4. Microplastics impair olfactory-mediated behaviors of goldfish Carassius auratus
5. Aggregation Pheromone for an Invasive Mussel Consists of a Precise Combination of Three Common Purines
6. Bacterial Nucleobases Synergistically Induce Larval Settlement and Metamorphosis in the Invasive Mussel
Mytilopsis sallei
7. Differential copper-induced death and regeneration of olfactory sensory neuron populations and neurobehavioral function in larval zebrafish
8. Comparative effects of cadmium, zinc, arsenic and chromium on olfactory-mediated neurobehavior and gene expression in larval zebrafish (Danio rerio)