Naphthenic acid fraction compounds, produced by the extraction of bitumen from oil sands, alter survival and behaviour of juvenile yellow perch (Perca flavescens)
Abstract
We evaluated whether naphthenic acid fraction compounds (NAFCs) extracted from oil sand tailings adversely affect fish survival and behaviour. Following a before–after-control-impact design, we housed wild-caught juvenile yellow perch (Perca flavescens) in outdoor mesocosms to assess survival and behaviour under baseline conditions, then exposed fish to one of three treatments: negative control, 2 mg/L NAFC, or 15 mg/L NAFC. We performed behavioural assays (no-stimulus activity, food stimulus, and predator stimulus using a model bird) and assessed a comprehensive suite of endpoints (equilibrium losses, activity, shoaling, burst swimming, freezing, and space use). We found that exposure to 15 mg/L NAFCs substantially reduced fish survival and impaired fish equilibrium in all three behavioural tests. Furthermore, exposure to NAFCs impaired anti-predator behaviour: while the activity of control fish increased by two-fold in response to a predator stimulus, fish exposed to 2 or 15 mg/L NAFC did not change their activity levels after stimulation. No significant changes were observed in other behavioural endpoints. Overall, our findings suggest that a week-long exposure to NAFCs at concentrations commonly found in tailings ponds, constructed wetlands, and other mining-impacted waters may affect multiple facets of fish behaviour that could ultimately lead to reduced fitness in fish populations.
Introduction
In Canada's oil sands region, industrial operators have not been permitted to deliberately discharge effluent from the mining and extraction of bitumen, known as “oil sands process-affected water” (OSPW) (Martin 2015). Consequently, OSPW has accumulated over five decades in tailing ponds that cover over 120 square kilometres (Chow-Fraser and Rougeot 2022) and contain 1.4 trillion litres of fluid tailings (Alberta Energy Regulator 2021). The toxicity of OSPW to invertebrates, fish, amphibians, birds, and mammals is well established (reviewed by Li et al. 2017; Mahaffey and Dubé 2017), and one class of contaminants in OSPW of particular concern are the naphthenic acid fraction compounds (NAFCs; CnH2n+ZOxNαSβ, as defined by Headley et al. (2021)). Water quality guidelines for the protection of aquatic life do not exist for NAFCs but are currently under development, as a new policy framework may soon allow the industry to release treated OSPW to the environment (Government of Alberta 2015; Alberta Energy Regulator 2017). The current study responds to science needs identified for developing standards for OSPW release (Tanna et al. 2019) by examining how the behaviour of an important fish species in Canada's oil sands region is affected by exposure to NAFCs.
Behavioural alterations can be important sublethal endpoints for assessing the toxicity of environmental pollutants (Ford et al. 2021). Traditionally, regulatory guidelines for pollutants in aquatic ecosystems have largely been based on acute lethality thresholds and may include chronic impacts on development, growth, and reproduction, but unfortunately, risk assessments do not effectively utilize behavioural metrics to evaluate the environmental impacts of pollutants (Agerstrand et al. 2020; Ford et al. 2021). Behavioural endpoints can indicate linkages between physiological processes and population-level effects and can be influenced by several factors, including neuro-hormonal mechanisms and external stimuli (Zala and Penn 2004; Saaristo et al. 2018). As such, behavioural changes can be used to assess sensitive, sublethal responses to environmental pollutants (Scott and Sloman 2004). In addition, changes in behaviour can have immediate consequences for fitness through changes in growth, reproduction, and survival (Brodin and Johansson 2004; Smith and Blumstein 2008). These changes in individual fitness can in turn have important consequences for population dynamics and ecosystem functioning (Ford et al. 2021).
Though the exact mechanisms by which NAFCs may affect behaviour are not clear, chemical contaminants are known to alter fish activity in several ways. Disruption of the endocrine or chemosensory functions in fish may interfere with complex behaviours by making fish less active overall or by inhibiting their ability to detect or respond to stimuli (Saaristo et al. 2018). Both NAFC and OSPW exposure have been shown to disrupt endocrine and chemosensory pathways and thus may influence behaviour through these mechanisms (Kavanagh et al. 2012; Lari and Pyle 2017). In addition, differences in activity levels could also be attributed to changes in metabolic rate following NAFC exposure. Fish metabolism is influenced by the integration of several physiological functions and is associated with fish behaviour, and thus disruption of normal metabolic processes may have substantial influences on normal behaviour (Scott and Sloman 2004). An important receptor involved in the metabolism of aromatic hydrocarbons, which include NAFCs, is the ligand-dependent transcription factor, the aryl-hydrocarbon receptor (AhR). NAFCs may be agonists of the AhR and thus influence fish metabolism through this pathway. One study profiled the transcriptome of fish following embryonic exposure to NAFCs and found that gene networks involved in xenobiotic metabolism, drug metabolism, and xenobiotic clearance are most affected by NAFCs (Loughery et al. 2019). Marentette et al. (2017) found elevated levels of cyp1a1 mRNA transcripts in walleye embryos exposed to fresh NAFCs, suggesting that NAFC toxicity occurs by AhR-mediated metabolism. Other studies have found that NAFCs uncouple oxidative phosphorylation in fish mitochondria, which can increase the production of reactive oxygen species that impose oxidative stress and cell apoptosis (Rundle et al. 2018, 2021). As complex behaviour changes in fish are often altered by interfering with a combination of physiological systems, NAFCs may affect any particular endpoint in fish through multiple mechanisms.
Despite the potential consequences to fish populations of contaminant-induced behavioural changes, only a limited number of studies have examined the effects of exposure to OSPW contaminants on fish behaviour. Studies investigating the olfactory responses of rainbow trout (Oncorhynchus mykiss) found fish can smell and avoid small concentrations of OSPW introduced as point sources, and that olfaction may be impaired if fish are exposed to OSPW and are unable to escape (Lari and Pyle 2017; Reichert et al. 2017). Moreover, embryonic exposure to OSPW causes decreased activity, alters swim speed, and impairs alarm responses in zebrafish (Danio rerio), and these changes in behaviour are transgenerational (Philibert et al. 2019). Only one study to date has reported changes in fish behaviour in response to NAFCs specifically, showing embryonic exposure alters swimming activity in larval fathead minnows (Reynolds et al. 2022).
The aim of the present study was to investigate the effects of NAFC exposure on multiple facets of behaviour in juvenile yellow perch (Perca flavescens), a common sport and food fish found in waters within the oil sands region of northern Alberta (Wallace and McCart 1984). We hypothesized that NAFC exposure alters swim activity, impairs anti-predator behaviour, and inhibits foraging behaviour. We chose to assess swimming activity, anti-predator behaviour, and foraging behaviour because impairments in these behaviours have direct consequences for fish survival and fitness. Typical anti-predator behaviour in juvenile yellow perch includes increased shoal cohesion, increased freezing responses, decreased time moving, increased latency to resume feeding, and decreased foraging attempts following exposure to risky cues (Mirza and Chivers 2001; Harvey and Brown 2004). Thus, we predicted that fish exposed to NAFCs would show decreased shoal cohesion, freezing, and swimming activity when responding to either a predator stimulus or a food stimulus. This study provides an important novel context for the effects of OSPW-derived NAFCs on juvenile fish behaviour and thus provides important alternate endpoints for the development of criteria and policies governing the management of OSPW in tailings ponds in Canada's oil sands region.
Materials and methods
Experimental design
Our study followed a before–after-control-impact design (Underwood 1993) (Fig. 1a). After a period of acclimatization to captivity (4 days), groups of five wild-caught fish were held in replicate mesocosms filled with clean lake water for 1 week (hereafter, “baseline phase”), then exposed to one of three NAFC treatments for a second week (hereafter, “exposure phase”). The day NAFCs were added (i.e., 22 September 2020) is referred to as “day 0” (Fig. 1a). NAFC treatments consisted of three nominal concentrations (clean lake water as a negative control, 2 mg/L NAFC, and 15 mg/L NAFC), with four mesocosms per treatment distributed over the study area in a random block design (Fig. 1b). The experiment was conducted at the QE3 Living Lab, an outdoor experimental ecotoxicology facility on the property of the Queen's University's Biological Station near Elgin, Ontario, Canada. Animal husbandry and procedures were approved by the Queen's University Animal Care Committee (Orihel 2020–1829).
Fig. 1.
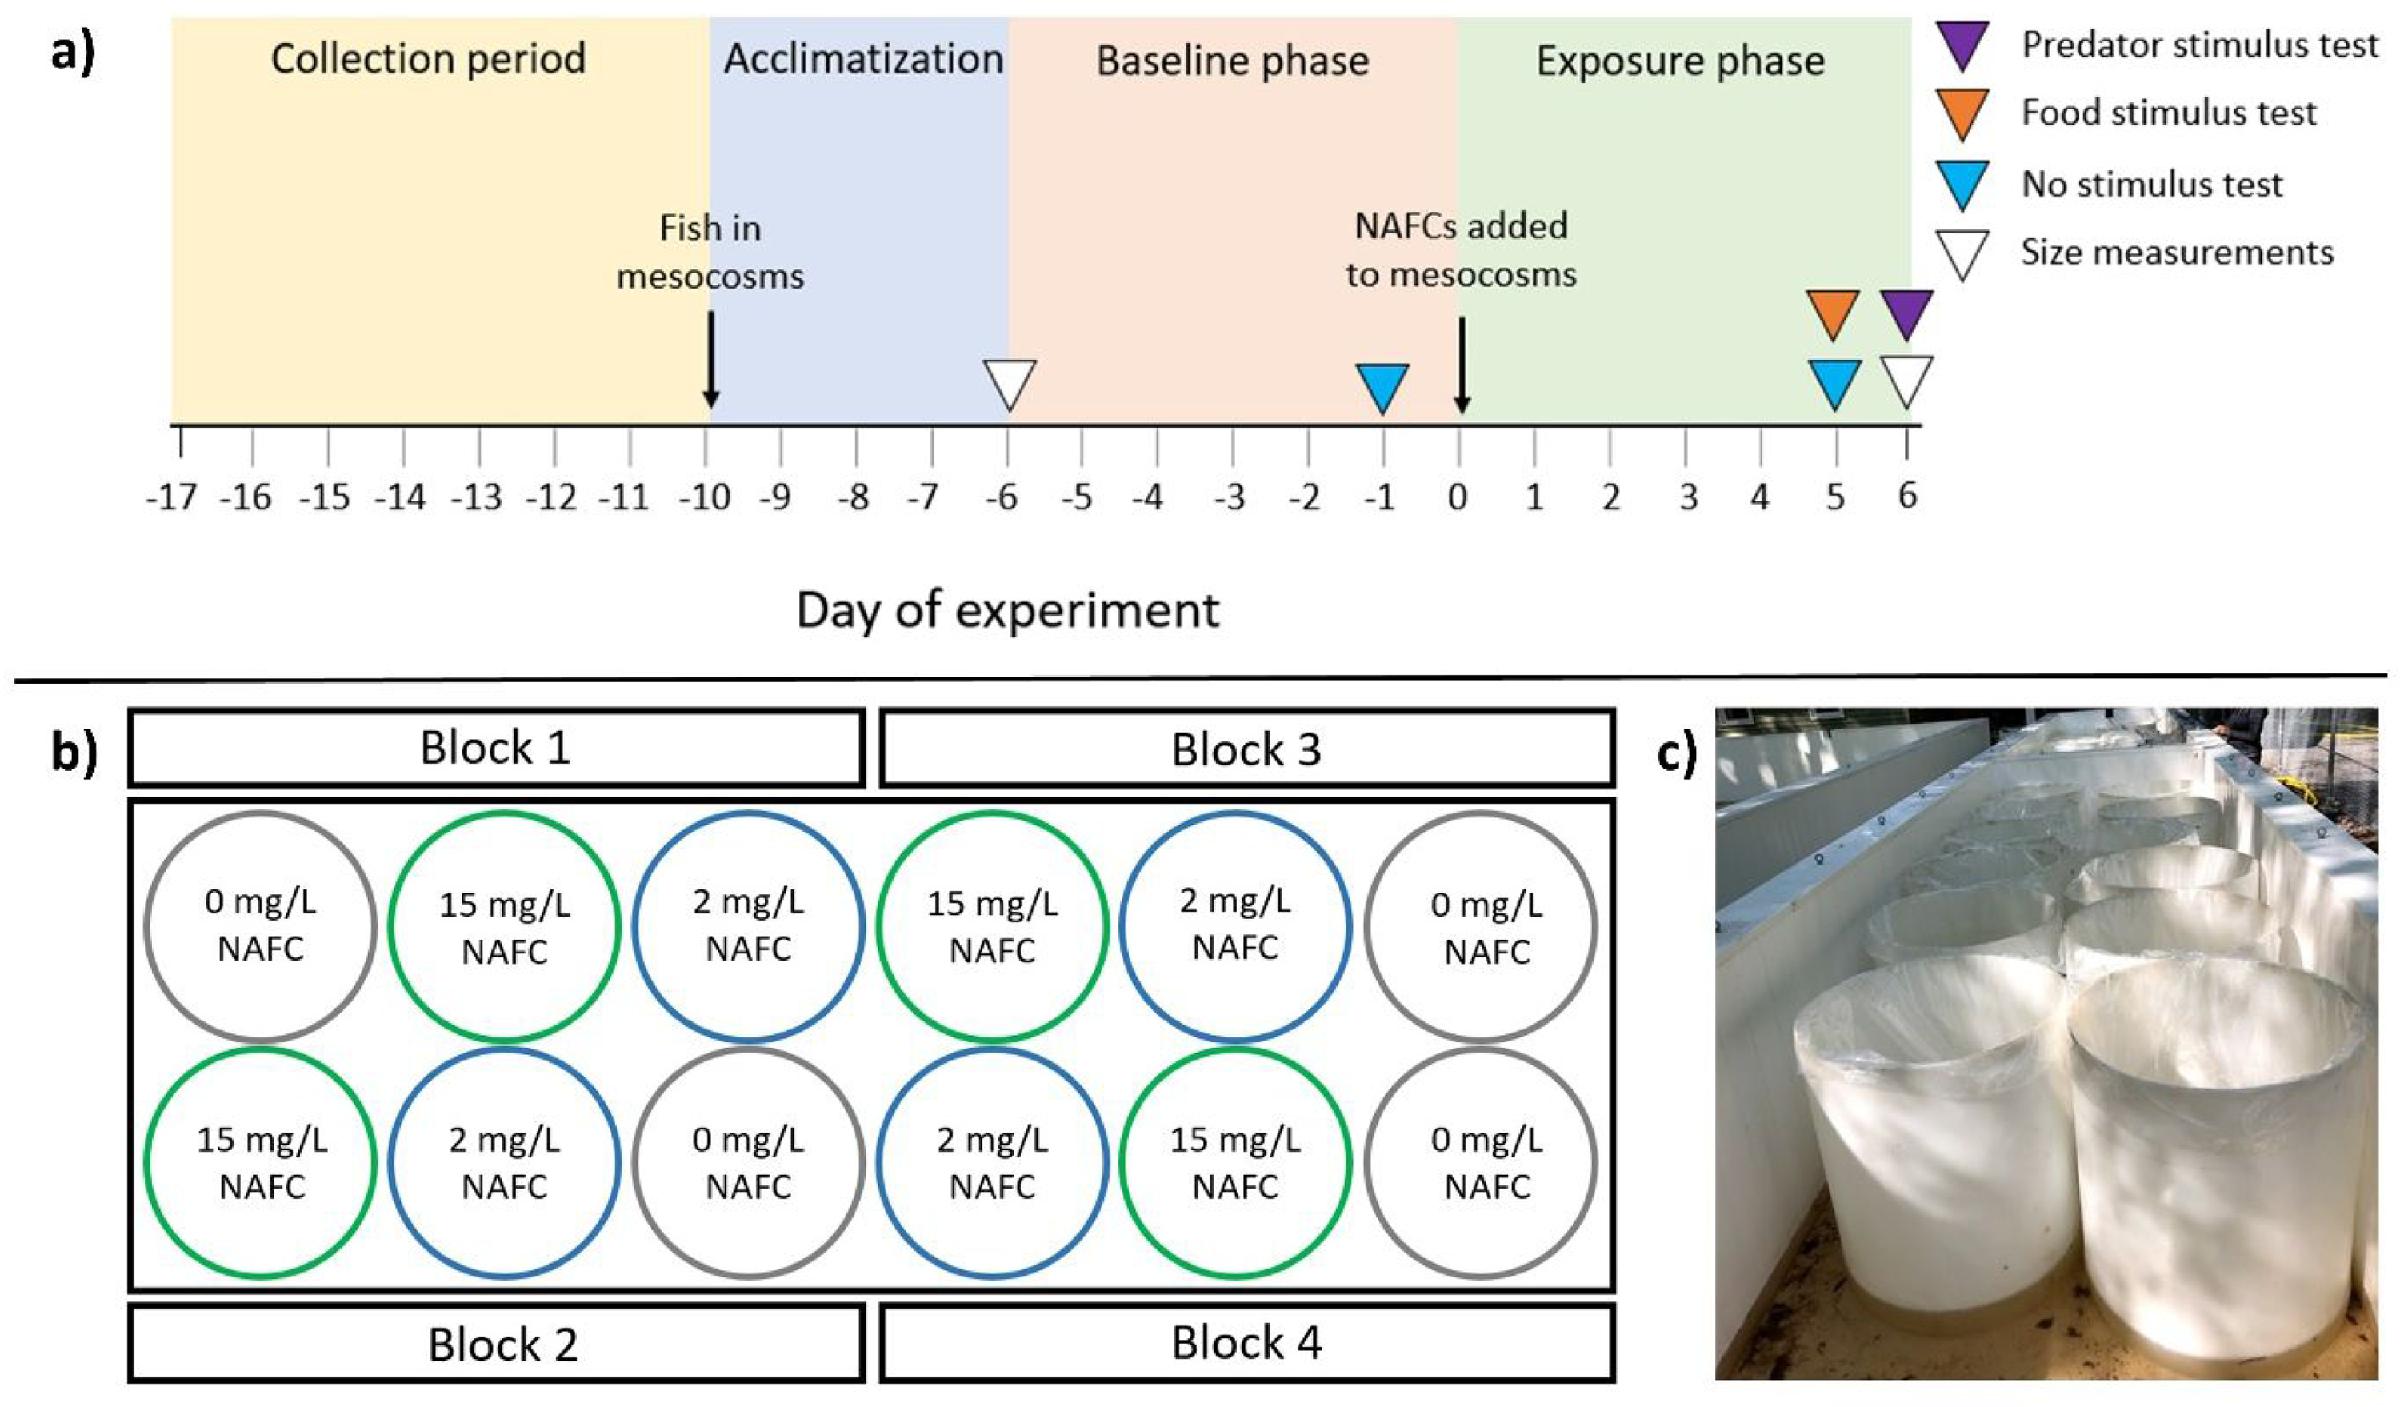
In early September 2020, juvenile yellow perch were collected from Warner Lake, Ontario (9.2 ha, mean depth 2.9 m, maximum depth 6.4 m, 44°33′′55′′N 76°19′′35′′W) using baited minnow traps (Gee; 42 × 19 cm, 6.4 mm square galvanized mesh). Captured fish were placed into 16 L holding containers filled with lake water and transported to shore, where they were transferred to aerated holding tanks (300 L). Fish of similar size (6.3 g ± 1.2 g mass, 6.9 cm ± 0.7 cm fork length, mean ± SD) were selected to reduce any associated individual variation in other measures (OECD 2013). Retained fish (n = 60) were transferred to the 12 outdoor mesocosms (5 fish per mesocosm) and acclimatized for 4 days to reduce the effects of handling stress on fish. The mesocosms (75 cm diameter × 91 cm height; Fig. 1c) were lined with food-grade polyethylene plastic bags and filled with 60 L of filtered water from Warner Lake. Fish were fed ad libitum daily with frozen brine shrimp (Artemia spp.) delivered through a plastic tube to reduce disturbance and habituate fish to the food delivery process prior to food stimulus tests. Water temperature, pH, dissolved oxygen, conductivity, salinity, and ammonia levels in the mesocosms were measured daily using Hana (H198129) and Hach meters (HQ40d) and ammonia test strips (API). Light intensity and temperature were monitored hourly using HOBO data loggers (Onert, Bourne, Massachusetts, USA). All water parameters remained within the recommended ranges for freshwater fish throughout the experiment (Tables S1 and S2) (OECD 2013). We monitored the mesocosms daily for any mortalities, and all fish were weighed (Thermo Fisher Scientific Denver Instrument P-403, ±0.001 g) and photographed (Canon EOS 100 D) at the beginning (day −6) and end of the experiment (day 6) or on the day they were recorded as a mortality. Photographs were later analyzed using ImageJ2 to determine fork length.
Preparation of NAFCs
This experiment used an NAFC extract prepared from a large volume sample from an active tailings pond in Canada's oil sands region. The preparation and analysis of this NAFC extract have been described in detail elsewhere (Marentette et al. 2015a, b; Bartlett et al. 2017; Reynolds et al. 2022). In summary, a large volume (<1000 L) of OSPW was acidified to pH < 2 and allowed to settle for 24 h prior to centrifugation. Following centrifugation, the insoluble pellet was resuspended in 0.1 N NaOH (pH 12) to solubilize organic acids and repeatedly centrifuged to remove suspended solids and humins. The alkaline mixture was filtered through a column of diethlyaminoethyl-cellulose (DEAE-cellulose) to remove high-molecular-weight humic-like materials. The alkaline DEAE-celluose column eluent solution was then subjected to repeated liquid-liquid extractions using DCM to remove neutral organics such as PACs. The total NAFC concentration of the extract was 2.64 × 10³ mg/L, as measured via negative-ion electrospray ionization high-resolution mass spectrometry (ESI-HRMS, Orbitrap) using a method similar to Headley et al. (2013). The extract was stored in darkness at pH 10 and 4 °C until diluted with lake water to nominal concentrations of 2 and 15 mg/L for this experiment. The initial pH of the NAFC treatments ranged from 8.7 to 10.0 and was titrated to 8.0 ± 0.1 with 0.1 mol/L hydrochloric acid. Throughout the experiment, pH values ranged from 7.0 to 7.8 for controls, 7.2 to 7.7 for the 2 mg/L NAFC treatments, and 7.0 to 7.7 for the 15 mg/L NAFC treatments (Table S1). Water samples from the treatment and control mesocosms were collected in amber glass bottles on day 0 (2 h after NAFC addition), day 3, and day 6 of the exposure phase, and stored at 4 °C until analysis to confirm target NAFC concentrations were achieved.
Quantification and analysis of NAFCs
NAFCs were extracted from mesocosm water samples following a previously reported procedure (Headley et al. 2002). Briefly, Biotage Isolute ENV + cartridges (Biotage, Uppsala, Sweden) were mounted in a solid-phase extraction (SPE) manifold, rinsed with 6 mL of MilliQ water, 6 mL of LCMS-grade methanol (Fisher Scientific, Hampton, NH, USA), and conditioned with 6 mL of MilliQ water. Samples were then acidified to pH < 2, and then extracted at approximately 5 mL/min under gentle vacuum (approximately 50–60 torr). Following sample loading, SPE cartridges were rinsed with 5–6 mL of MilliQ water under gravity to de-salt. Samples were eluted from cartridges with 6 mL of LCMS-grade methanol under gravity, then evaporated under gentle N2 flow in a water bath at approximately 40 °C. Samples were reconstituted into 50:50 acetonitrile:water with 0.1% NH4OH, then transferred to LCMS vials for analysis.
Concentrations of NAFCs were quantified using an external standard calibration method (Bauer et al. 2015) using NAFC extracts derived from OSPW (Rogers et al. 2002). This OSPW-derived NAFC mixture was originally quantified against a Kodak NA mixture via FTIR, as described by Rogers et al. (2002). Sample extracts were bracketed by calibration standards and blanks for every 10 samples. All samples were run in a single sequence batch, except where sample dilutions were required to reach the method's instrument linear calibration range between 1.0 and 100 mg/L, which were analyzed in a second batch with independent blanks and calibration brackets. The method detection limit (using 100 mL sample aliquots) was 0.10 mg/L, with an estimated extraction efficiency of 105% (rsd ≤ 4%). NAFC concentrations are reported as semiquantitative results as authentic reference standards are not available. Sample data from these non-targeted analyses were pre-processed in XCalibur version 2.2. (Thermo Fisher Scientific, Waltham, MA, USA), then formulae were assigned to accurate mass data at a level-4 identification confidence level (Schymanski et al. 2014) using Composer 1.5.6 software (Sierra Analytics, Modesto CA, USA). Formula assignment was limited to compounds between 100 and 500 m/z with a maximum tolerable mass error of ≤3 parts per million.
Quantification provided by HRMS and Orbitrap-MS should be considered semiquantitative. A lack of standardized NA or NAFCs, as well as a lack of agreement on analytical methodology, similarly limits all available methods from definitively quantifying NAFCs (Kovalchik et al. 2017). Further, there are many factors affecting ion abundances and ionization efficiency in a mass spectrometer, which will selectively promote or suppress the response factor of particular compounds and compound classes (Palacio Lozano et al. 2020). Comparisons based on spectral features, such as proportions of heteroatomic classes or particular formulae, must be interpreted only for relative trends and do not directly report absolute amounts of each.
Behavioural tests
We assessed three behaviours in assays at different time points: swim activity, foraging activity, and antipredator responses. All behavioural assays involved filming the groups of fish using overhead-mounted digital cameras (Canon HF R800; Fig. S1). Swim activity was assessed by filming the fish in their 60 L exposure mesocosms for 4 min in the absence of an introduced stimulus (“no-stimulus activity test”). A 4 min film time was chosen based on modified methods from Mathis and Smith (1993) and Chivers and Smith (1995). Videos of regular swim behaviour were recorded in the morning (9–11 am) during both the baseline (day −1) and exposure (day 5) phases. Foraging activity was assessed by filming the fish for 4 min periods before (pre-food stimulus) and after (post-food stimulus) a food stimulus was introduced on day 5 (“food stimulus test”). The food stimulus consisted of an injection of frozen brine shrimp (2 g) delivered through a plastic tube in the same manner that food was delivered throughout the experiment. To assess anti-predator behaviour, fish from each mesocosm were transferred together from the exposure mesocosms to 60 L cylindrical test tanks at the end of the exposure phase (day 6), allowed to acclimatize for 10 min, and then filmed for 4 min periods before (pre-predator stimulus) and after (post-predator stimulus) the introduction of a predator stimulus (“predator stimulus test”). The predator stimulus was a model bird head resembling the great blue heron (Ardea herodias; Fig. S1), a common local predator of juvenile yellow perch. The model was mounted on a rod, introduced at the centre of the test tank in a downward motion to strike the bottom of the tank, and then immediately retracted.
Behavioural endpoints
Behavioural videos were reviewed with the display overlaid with an 11 × 11 grid, where the grid width was approximately one fish body length (Fig. S2). During each behavioural test, we recorded the number of equilibrium losses (underbelly of a fish was visible); activity, indicated by the number of grid lines crossed; shoaling, indicated by a shoaling index (see below); number of burst swim events (sudden increase in velocity); total time spent frozen (seconds); and space use, indicated by a space use score (see below). Equilibrium losses, activity, burst events, and time spent frozen were all tracked continuously for each fish within a replicate trial (Table S3).
Shoaling activity and space use were scored every 15 s during behavioural tests as per previous experiments (Mathis and Smith 1993; Chivers and Smith 1995). Shoaling was scored using an index of shoal cohesiveness, where 1 = all fish were at least one body length away from their nearest neighbour and 5 = all five fish were within one body length of each other. Space use was assessed with the grid overlay divided into two zones of equal area encompassing the centre and outer perimeter of the mesocosm, with individual fish located in the outer zone scoring 1 and fish scoring 2 if they were in the middle zone (Fig. S2a). During food stimulus tests, a second space use score was assessed, where the grid overlay was divided into three equal areas and scores ranged from 1 for each fish in the farthest zone from the food injection site to 3 for each fish in the food injection zone (Fig. S2b). The scores for each measure at 15 s intervals were summed over the pre- and post-food stimulus periods for each test and then averaged by the number of fish present in the trial to give each trial period a final score. Final shoaling scores ranged from 0 to 1, where 0 indicates no time spent shoaling and 1 indicates the majority of the trial was spent shoaling. Space use (location) scores ranged from 0 to 2, where 0 indicates no time spent in the centre of the arena and 2 indicates the majority of the trial in the centre of the arena. Space use (location) scores in relation to a food stimulus ranged from 0 to 3, where 0 indicates no time spent near the food stimulus and 3 indicates the majority of the trial spent near the food stimulus. Behavioural data were extracted from the videos by an observer tracking an individual fish during each assessment, with corresponding exposure treatments unknown to minimize observer bias. To ensure behavioural observations were credited to the correct individual fish during assessments, each video was assessed multiple times, each time tracking and observing a different individual fish.
Statistical analyses
Statistical analyses were performed using R version 4.0.3 (R Core Team 2021). Model residuals were visually assessed to ensure assumptions for normality and homogeneity of variance were met. To test the influence of NAFCs on fish survival, we used generalized linear models (GLM) from the car package (Fox and Weisberg 2019), with proportions surviving to the end of the baseline phase and to the end of the exposure phase in each replicate and NAFC treatment as a fixed effect against a quasibinomial error distribution. In addition, we used Kaplan–Meier (K-M) survival analysis for daily survival to estimate survival probability throughout the experiment (Rich et al. 2010), followed by a log-rank test to assess differences in survival curves using the survival package in R (Therneau 2021). To determine the influence of NAFCs on behavioural endpoints for both the food stimulus and predator stimulus tests, we averaged responses across the fish in each mesocosm and used those mesocosm values as the experimental units in GLMs for both the pre- and post-stimulus periods, with NAFC treatment as a fixed effect. Finally, to test the influence of NAFCs on behavioural endpoints during the no-stimulus activity tests on day −1 and day 5, we used GLMs for each experimental phase with treatment as a fixed effect. For the behavioural endpoints, we used either Gaussian (grid lines crossed, shoaling and location scores, freeze time) or Poisson (equilibrium losses, burst swims) error distributions. Figures were generated using ggplot2 (Wickham 2016).
Results and discussion
NAFCs in mesocosm water
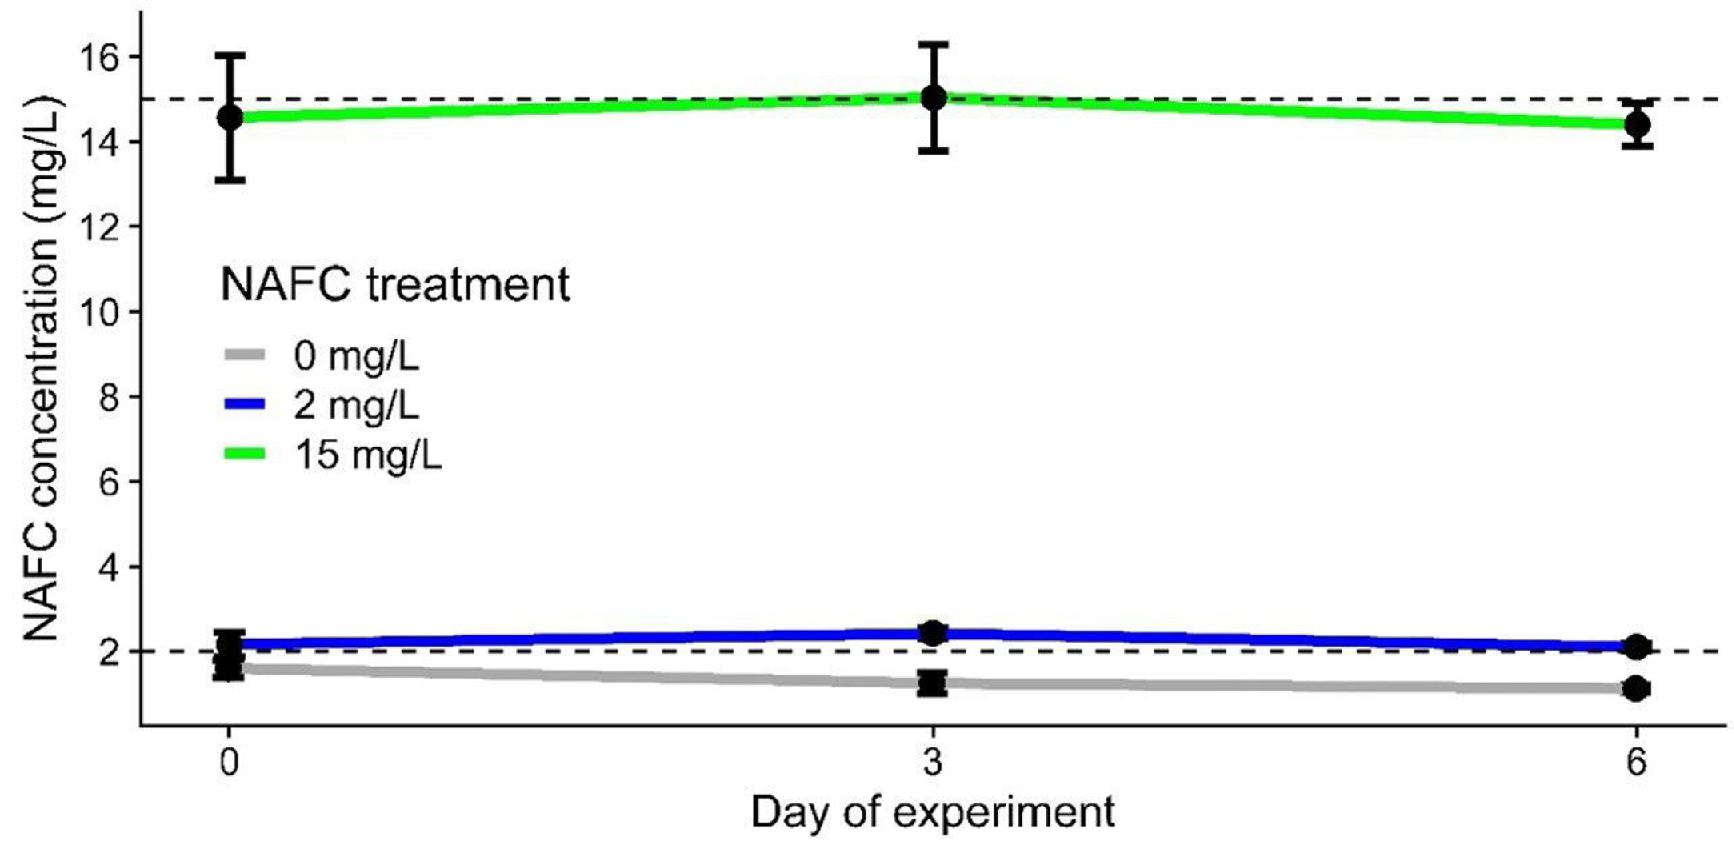
Concentrations of total NAFCs measured in water samples from NAFC-treated mesocosms were similar to nominal treatment levels (i.e., 2.1 ± 0.2 mg/L for the 2 mg/L treatment and 13.3 ± 5.1 mg/L for the 15 mg/L treatment; mean ± SD, n = 10–11/treatment) and were stable over time during the exposure phase (Fig. 2). These treatment concentrations are below those reported for fresh oil sands tailings (19.7–85 mg/L; Mahaffey and Dubé 2017) and are at the low end of the range of concentrations reported for reclamation ponds (5–40 mg/L; Anderson et al. 2012; Kavanagh et al. 2013) and bitumen-affected wetlands in Canada's oil sands region (3.3–72 mg/L; Vander Meulen et al. 2021a). Background concentrations of NAFCs in natural water in control mesocosms were 1.2 ± 0.3 mg/L (mean ± SD; n = 11), which is comparable to values we reported previously for natural lake water (∼0.5 mg/L) (Reynolds et al. 2022; Robinson et al. 2023) and reference wetlands in Canada's oil sands region unaffected by bitumen-derived inputs (Vander Meulen et al. 2021b). The background acid-extractable compounds that were detected in natural water included substantial amounts of z = 0 compounds (i.e., C9, C10, C16, and C18) that were likely fatty acids, as well as oxygen-rich formulae (e.g., O3-, O4-, O5-, and O6-containing formulae) reflective of ubiquitous humic and/or fulvic materials, similar to previous observations from Athabasca region surface waters observed with this method (Sun et al. 2017).
Fig. 2.
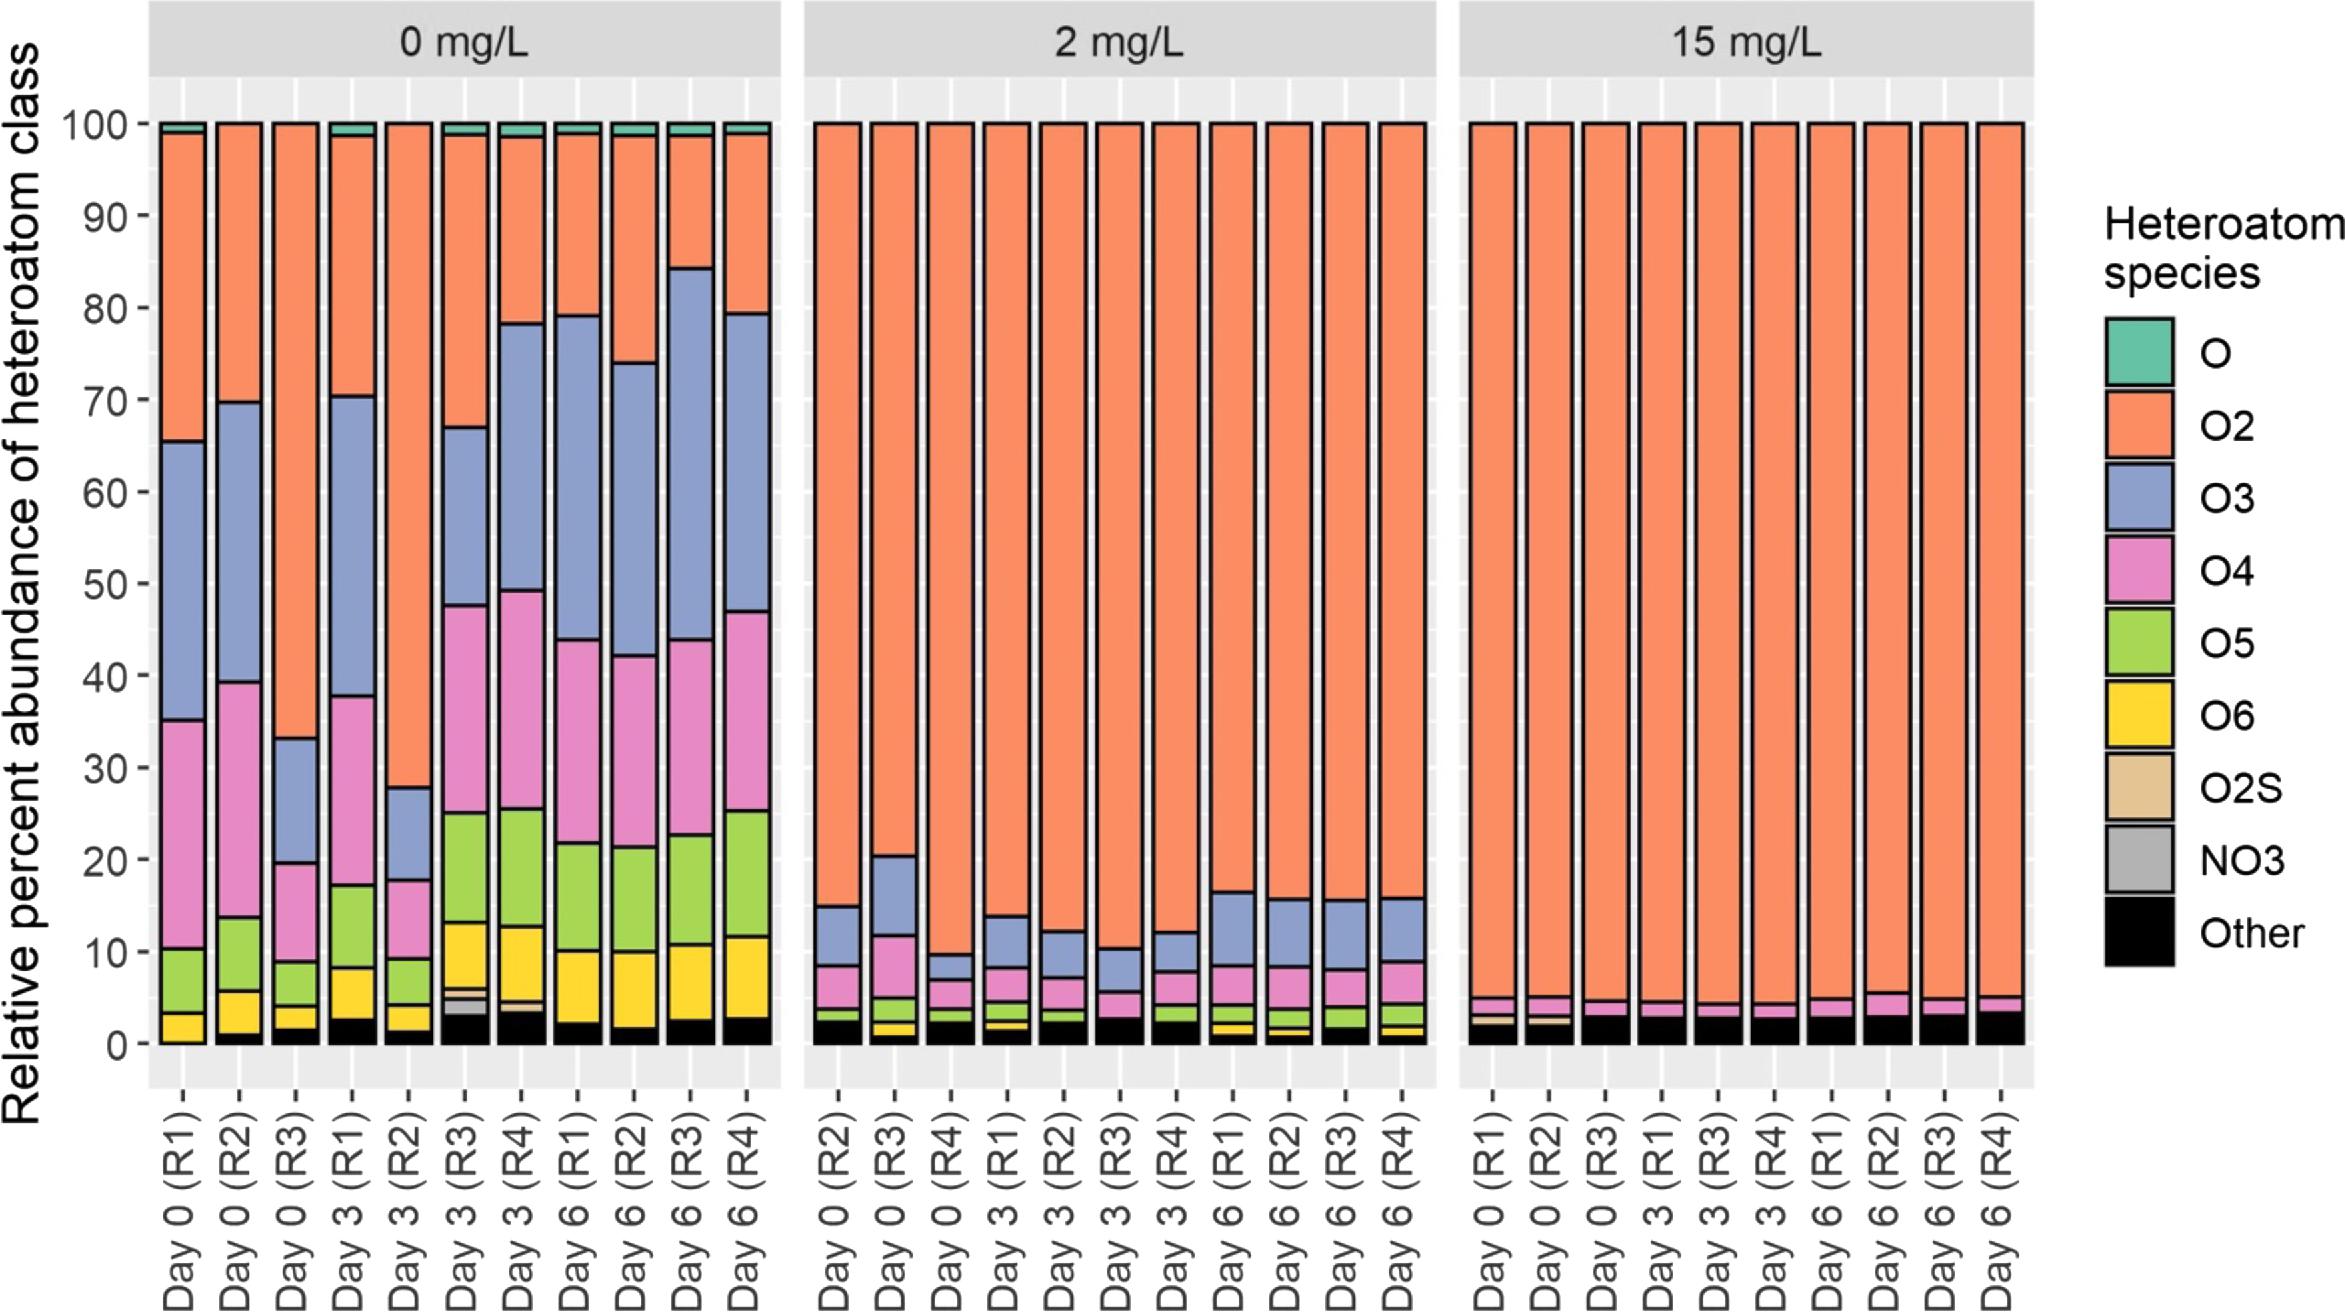
The NAFC extract used for our study was composed primarily of classical NAs (O2 species; Fig. 3) with 15–16 carbon atoms and 2–4 double bond equivalents. Although classical NAs have been implicated as a primary organic contaminant in OSPW (Morandi et al. 2015; Hughes et al. 2017), recent work has demonstrated that classical NAs are not the only cause for concern. Formulae that are more abundant in aged bitumen-derived inputs, which include compounds with oxygen-rich and/or aromatic bonding configurations (Bauer et al. 2019b), such as hydroxylated aldehydes and other oxidative structural moieties, can also cause deleterious effects (Sun et al. 2017; Bauer et al. 2019a). The molecular composition of OSPW may also include substantial amounts of O3- and O4-NAFCs (Vander Meulen et al. 2021a). The NAFC extract in this case appears to be composed primarily of classical NAs (Fig. 3), so associated toxic outcomes should be attributed to this specific compound class.
Fig. 3.
NAFC exposure reduced fish survival
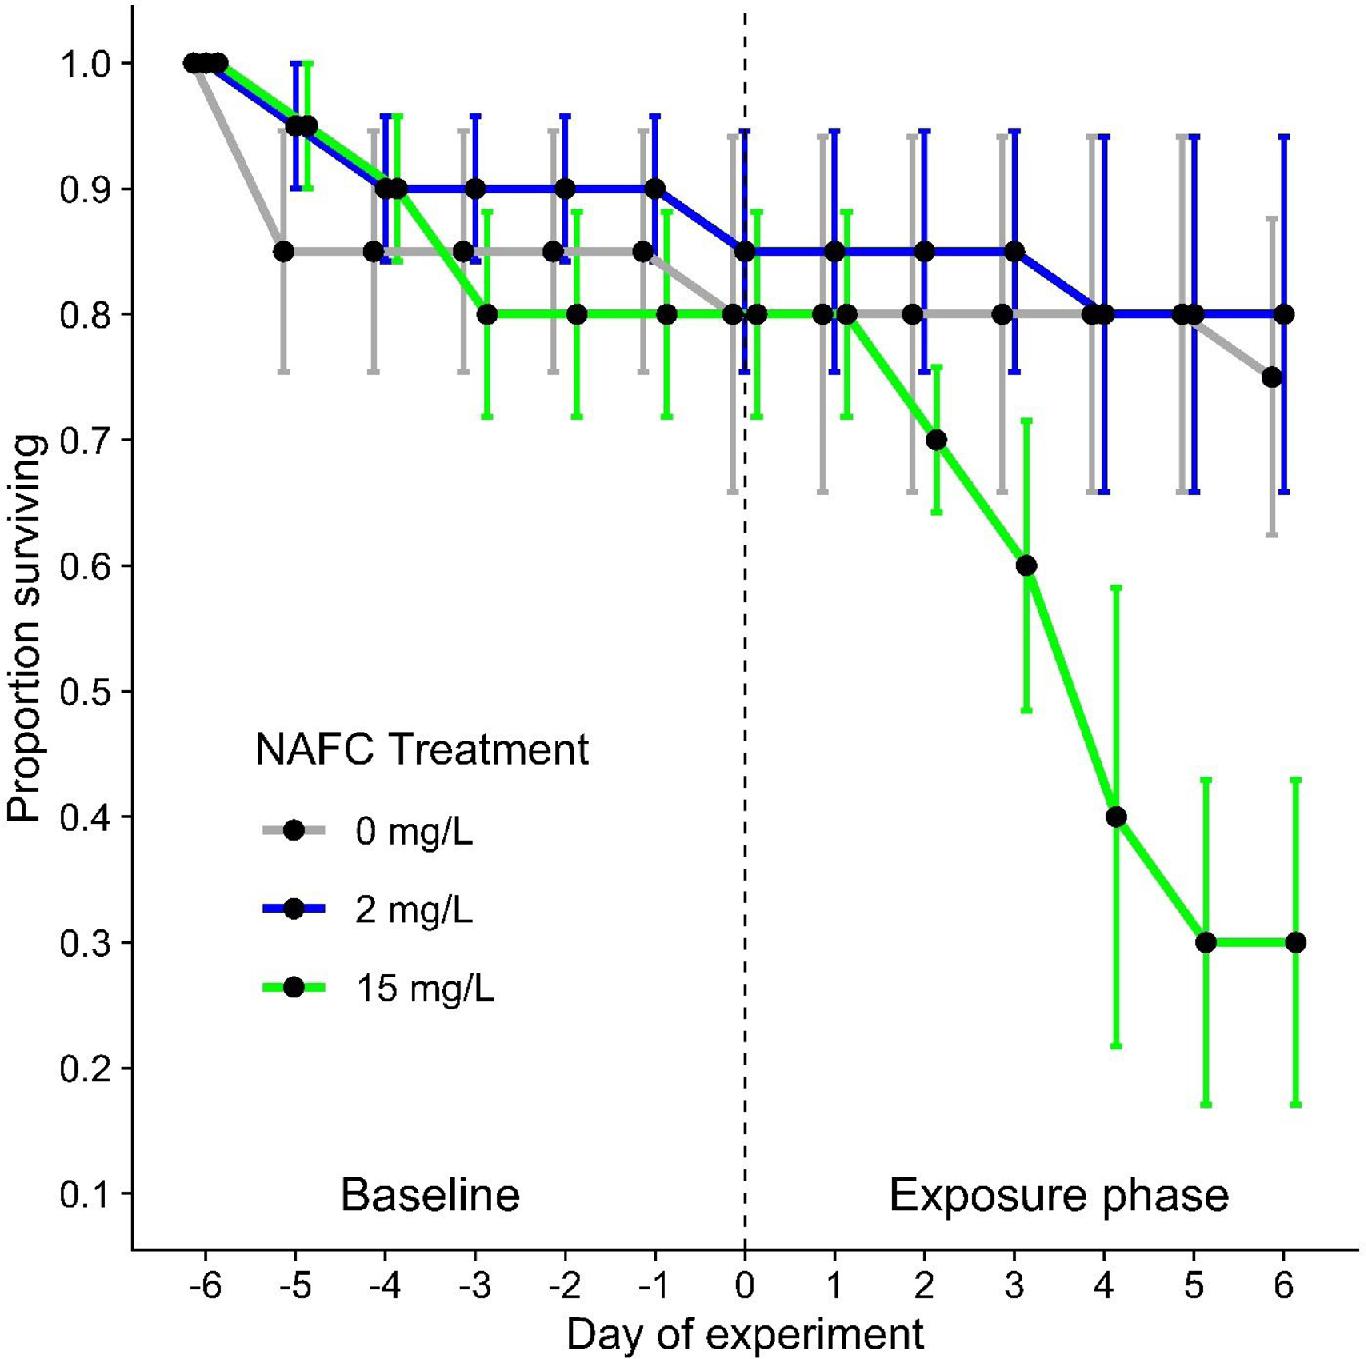
Exposure to 15 mg/L NAFCs substantially reduced fish survival. Fish exposed to the 15 mg/L NAFC treatment had average survival rates of 80% during the baseline phase that decreased to 25% after 6 days of NAFC exposure (Fig. 4; Fig. S4). In contrast, during the baseline and exposure phases, control fish had average survival rates of 80% and 75%, respectively, and fish exposed to the 2 mg/L NAFC treatment had average survival rates of 85% and 70%, respectively. Over the entire experiment, survival varied with NAFC treatment (GLM, F2,18 = 4.02, P = 0.036) and the treatment × exposure phase interaction (F2,18 = 3.88, P = 0.039), which was driven by decreased survival in the 15 mg/L treatment compared to the other two groups but not between exposure phases (F1,18 = 0.97, P = 0.34). Survival of yellow perch did not differ between treatments during the baseline phase (GLM, F2,9 = 0.072, P = 0.93), but did differ significantly between NAFC concentrations during the exposure phase (GLM, F2,9 = 7.25, P = 0.013), with the 15 mg/L treatment resulting in decreased survival (Fig. 4). However, K-M survival curves representing the entire experimental period identified significant differences between treatments (K-M; X2(2) = 14.3, P < 0.001; Fig. S4).
Fig. 4.
Our findings of substantially reduced yellow perch survival following exposure to 15 mg/L NAFCs provide important new context for the impacts of NAFCs on fish survival. A recent study on embryonic fathead minnows using the same NAFC extract reported an LC50 value of 28.5 mg/L and a 10% benchmark dose value of 22.3 mg/L (Reynolds et al. 2022). Laboratory-based studies using NAFCs derived from the same settling basin (Industry A, but sampled in different years) and using the same extraction method as this study reported an EC50 value for hatch success of 11 mg/L for walleye embryos and 23.2 mg/L for fathead minnow embryos (Marentette et al. 2015b). Another study using the same NAFC extract resulted in an LC50 value of 32.8 mg/L for fathead minnow embryos and an LC50 value of 51.8 mg/L for fathead minnow larvae (Kavanagh et al. 2012). Fathead minnow is a robust fish species with a higher tolerance to chemical exposure, whereas yellow perch tend to be more sensitive (Teather and Parrott 2006). A study involving young-of-the-year yellow perch reported 100% mortality in <96 h of exposure to 6.8 mg/L NAFCs isolated from surface waters of the West InPit (WIP) settling basin (Syncrude Canada Ltd.) (Nero et al. 2006). However, inconsistencies in source materials and chemical analysis methods may preclude direct comparisons of results between studies. Thus, our findings of reduced survival in yellow perch exposed to 15 mg/L NAFCs, a similar concentration to walleye LC50 values and a much lower concentration than LC50 values reported for fathead minnows using the same extract, highlight the differences in sensitivities between species. Comparing differences in sensitivities between fish species exposed to NAFCs allows for a more thorough understanding of how OSPW may affect aquatic communities. In addition, 15 mg/L NAFCs is at the low end of the range of concentrations reported for bitumen-affected wetlands in Canada's oil sands region (3.3–72 mg/L, Vander Meulen et al. 2021a). Our findings provide important information for establishing regulations for the safe release of NAFCs into aquatic ecosystems.
NAFC exposure impaired activity in fish
Total activity measured by the number of grid lines crossed during the observations tended to be greater in the post-stimulus periods than the pre-stimulus periods, with generally lower activity levels in the 15 mg/L treatment (Figs. 5d–5f). During the no-stimulus activity tests, there was no significant effect of treatment during the baseline phase on day −1 (GLM, F2.9 = 0.53, P = 0.61) or during the exposure phase on day 5 (GLM, F2,8 = 0.21, P = 0.82), although activity tended to be greater during the exposure phase (Fig. 5d). In the predator stimulus test, the number of grid lines crossed pre-predator stimulus did not vary significantly between NAFC concentrations (GLM, F2,8 = 1.9, P = 0.21), although activity levels were lower in the 15 mg/L treatment compared to the others (Fig. 5e). During the post-predator stimulus period, there was also no overall significant effect of treatment (GLM, F2,8 = 3.57, P = 0.078), but there was a clear stepwise pattern of lower activity level with increasing NAFC concentration (Fig. 5e). In the post-predator stimulus period of the predator stimulus test, fish crossed an average of 28 lines/min in the control treatment, 19 lines/min in the 2 mg/L NAFC treatment, and 5 lines/min in the 15 mg/L NAFC treatment. In the food stimulus test, the number of grid lines crossed did not vary significantly between treatments, either pre-food stimulus (GLM, F2,8 = 0.21, P = 0.82) or post-food stimulus (GLM, F2,8 = 0.71, P = 0.52), while the control treatment was associated with the highest observed activity levels (Fig. 5f). Our findings are consistent with Philibert et al. (2019), who reported decreased activity following an alarm cue stimulus consistent with an anti-predator response in fish exposed to OSPW during development. Similar decreases in activity and constrained anti-predator behaviours have been observed in fish exposed to crude oil (Barron et al. 2005; Kochhann et al. 2015; Lari et al. 2016) and polycyclic aromatic hydrocarbons (PACs) (Vignet et al. 2014; Vignet et al. 2015; Johansen et al. 2017).
Fig. 5.
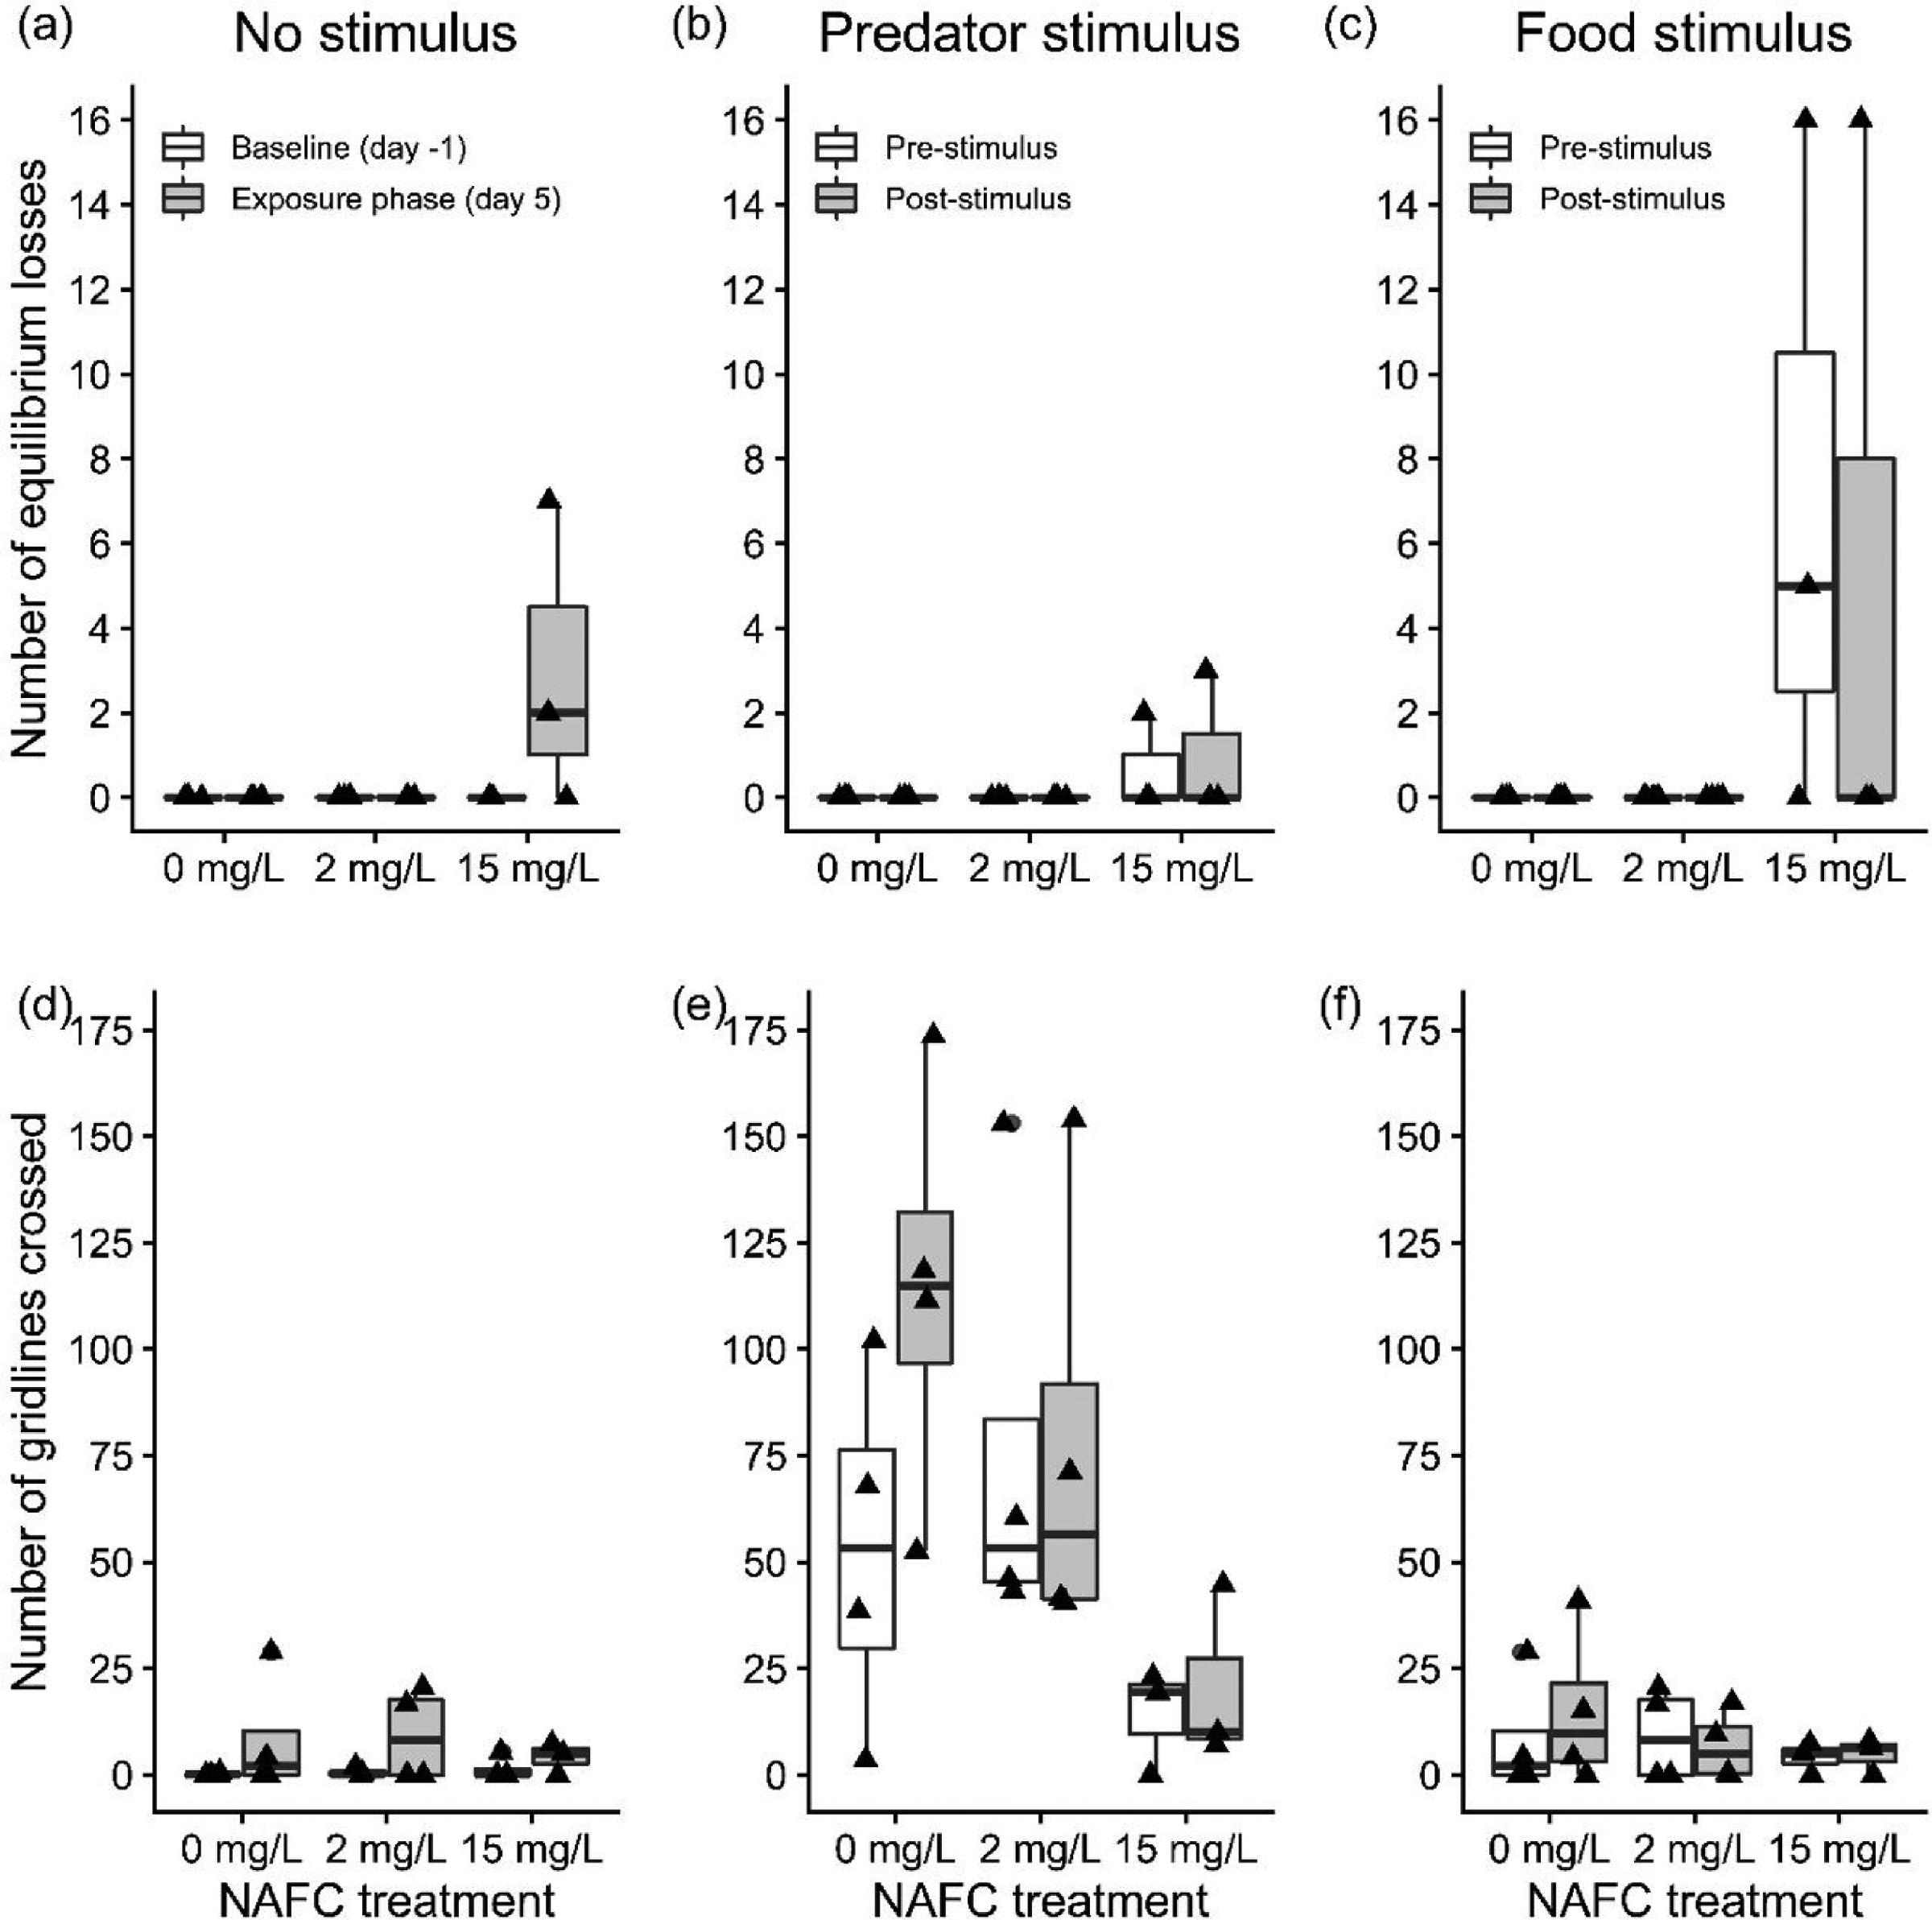
NAFC exposure impaired equilibrium in fish
The occurrence of equilibrium losses in yellow perch was significantly influenced by NAFC exposure in the three behavioural tests (Figs. 5a–5c), with fish in the 15 mg/L NAFC treatment being the only ones to lose equilibrium. In the no-stimulus activity test during the baseline phase, no equilibrium losses were observed, whereas fish in two out of three replicate mesocosms in the 15 mg/L treatment did lose equilibrium during the exposure phase (one twice and one seven times; Fig 5a), driving a significant effect of treatment in the exposure phase (GLM, F2,8 = 10.79, P = 0.0053). In the predator stimulus test, equilibrium losses significantly increased with NAFC exposure during both the pre-predator stimulus and post-predator stimulus periods (GLM, both F2,8 = 5.19, P = 0.036), although these equilibrium losses occurred in only one of the 15 mg/L NAFC replicate mesocosms (twice pre-predator stimulus and thrice post-predator stimulus; Fig. 5b). In the food stimulus test, equilibrium losses again occurred exclusively in the 15 mg/L treatment in both the pre-food stimulus (GLM, F2,8 = 11.4, P = 0.0046) and post-food stimulus (GLM, F2,8 = 5.19, P = 0.036) periods (Fig. 5c). Equilibrium losses have also been observed in juvenile pink salmon exposed to crude oil, which is notable as NAFCs are found in oil residues (Yang et al. 2021). Reynolds et al. (2022) observed similar equilibrium losses in recently hatched fathead minnows exposed to 21 and 29.5 mg/L of NAFCs, concentrations that were also associated with higher rates of mortality. One study suggests that loss of equilibrium in fish can serve as an alternate endpoint that can identify a larger portion of the population that is under stress and potential forthcoming mortality (Gosselin and Anderson 2020). If OSPW and NAFCs are released, fish in the Canadian oil sands region would not likely be statically exposed to contaminants as they were in this study, and thus it is relevant to understand both the immediate effects on survival and the changes in behaviour that decrease survival over time.
NAFC impacts on other behavioural endpoints
Examination of other behavioural endpoints (i.e., shoaling score [Figs. S5a–S5c], number of burst swim events [Fig. S5d–S5f], freezing time [Figs. S6a–S6c], and space use score [Figs. S6d–S6f]) yielded equivocal evidence that NAFC exposure caused alterations in these behaviours. In the no-stimulus activity test, fish shoaling score was independent of treatment in the baseline (GLM, F2,9 = 0.13, P = 0.88) and exposure (GLM, F2,7 = 2.41, P = 0.16) phases, with a marked decrease in shoaling in the 15 mg/L treatment during exposure (Fig. S5a). Similarly, during the predator stimulus test, shoaling scores were not significantly influenced by treatment in either the pre-predator stimulus (GLM, F2,7 = 0.86, P = 0.46) or the post-predator stimulus (GLM, F2,6 = 2.47, P = 0.15) periods, although there were trends towards greater shoaling scores post-predator stimulus in the two NAFC treatments compared to the controls (Fig. S5b). In the food stimulus test, shoaling scores differed significantly between treatments both pre-food stimulus (GLM, F2,7 = 5.54, P = 0.036) and post-food stimulus (GLM, F2,7 = 5.09, P = 0.043) periods, with these differences driven by shoaling scores that were 40%–50% lower in the shoals of fish exposed to 15 mg/L NAFCs compared to the 2 mg/L and control treatments (Fig. S5c). By the end of the experiment, there were notably smaller sample sizes of fish in the 15 mg/L NAFC treatment due to greater mortality. One replicate in the 15 mg/L treatment had 100% mortality, and one replicate had only one fish live to the end of the experiment, and thus this replicate could not be included in shoaling assessments during behavioural tests. In addition, observed changes in shoaling cannot be attributed to the food stimulus, as similar patterns of effect were found in both the pre- and post-food stimulus periods. Therefore, it is not conclusive if the observed change in shoaling was indeed a consequence of NAFC exposure.
The total number of burst swims did not differ significantly between NAFC treatments in any behavioural test (all P > 0.05; Fig. S5d). In the predator stimulus test, there were no differences in burst swims between treatments pre-predator stimulus (GLM, F2,8 = 1.04, P = 0.39), but there were significant differences between treatments post-predator stimulus (GLM, F2,8 = 5.38, P = 0.033), with the greatest number of burst swims observed in the control treatment (Fig. S5e). Fish in the food stimulus tests did not demonstrate any significant differences in burst swims between treatments in either the pre- or post-food stimulus periods (both P > 0.05; Fig. S5f).
Time spent frozen did not change significantly between NAFC treatments in any behavioural test (all P > 0.05), although times were uniformly greater during the exposure phase (175 ± 28 s, mean ± SD across all treatments) compared to the baseline phase (0 s) in the no-stimulus activity test (Fig. S6a). Freezing time during the predator stimulus test did not vary significantly between treatments in either the pre- (GLM, F2,8 = 2.0, P = 0.0.19) or post-predator stimulus (GLM, F2,8 = 1.09, P = 0.38) periods, although fish in the 15 mg/L treatment tended to spend more time frozen compared to the other groups in both sampling periods. Freezing time during the food stimulus did not vary between treatments in either period (all P > 0.05; Fig. S6c).
Space use as indicated by location score did not vary significantly between treatments in any behavioural test (all P > 0.05 (Figs. S6d–S6f), although location scores were consistently lower in the predator test (Fig. S6e) compared to the no-stimulus activity (Fig. S6d) and food stimulus (Fig. S6f) tests.
During the food stimulus test, space use and proximity to the food stimulus location did not vary significantly between treatments in either the pre-food stimulus (GLM, F2,8 = 1.42, P = 0.29; Fig. S7) or post-food stimulus (GLM, F2,8 = 1.33, P = 0.32; Fig. S7), indicating that fish did not change locations when a food stimulus was added to the mesocosm. Our findings are similar to those of Philibert et al. (2019), who found no difference in distance travelled or prey captured by fish exposed to OSPW during development. However, our findings contrast with those reported by Lari and Pyle (2017), who found that OSPW exposure impairs food searching behaviour in fish by disrupting their perception of foraging cues. The lack of response to a food stimulus that we observed may be attributed to the conditions of the behaviour tests rather than the potential effects of NAFC exposure. A lack of response to the food stimulus may have occurred because fish were fed daily and excess food was not removed from the test tanks. As such, fish had constant access to food throughout the day and may not have been motivated to respond overtly to the food stimulus during behavioural trials. As the ability to capture prey is essential for survival and is a complex behaviour that relies on visual perception, recognition, decision-making, and motor control (Muto and Kawakami 2013), future studies with adjusted methods may be warranted to further investigate if NAFCs can alter foraging behaviour in fish.
Environmental implications for wild fish
Our study experimentally manipulated the exposure of wild juvenile yellow perch to different concentrations of NAFCs in outdoor aquatic mesocosms to identify changes in fish survival and behaviour caused by NAFCs. Such survival and behavioural changes in response to NAFCs would have been impossible to isolate in a field study of wild fish in Canada's oil sands region. However, the changes in survival and behaviour we observed in yellow perch under experimental conditions could occur in wild fish under similar exposure scenarios in the oil sands region (e.g., in reclamation ponds constructed on former open-mine pits, in the case of an accidental breach of a tailings pond into a natural aquatic ecosystem, or possibly downstream of future outfalls releasing treated industrial effluent). If so, this could have implications for the health of fish populations. First, we observed a substantial reduction in survival in yellow perch exposed to 15 mg/L NAFCs. Previous studies spanning decades found exposure to OSPW in the range of 2–4 mg/L NAFCs has immunological and reproductive effects on yellow perch (van den Heuvel et al. 2012; Hogan et al. 2018). However, few studies have investigated the effects of NAFCs isolated from OSPW on yellow perch survival (Nero et al. 2006), and thus our findings provide important new information on the effects of NAFCs on yellow perch survival that can be compared to previous studies using NAFCs from the same settling basin and extraction methods (Kavanagh et al. 2012; Marentette et al. 2015b; Reynolds et al. 2022). Second, we observed that yellow perch exposed to 2 or 15 mg/L NAFCs changed fish activity in response to a predator stimulus. Changes in short-term activity can alter how fish encounter and respond to both resources and risks in the environment (Saaristo et al. 2018). Individuals that can quickly and accurately detect and assess risk are favoured by natural selection, and thus, disruption of a sensory or motor system due to contaminant exposure can have important implications for individual survival and fitness. Even small changes in fish survival can have a major impact on fish recruitment (Scott and Sloman 2004), and thus, increased susceptibility to predation, as a consequence of NAFC exposure could potentially lead to population declines. Third, we observed that yellow perch exposed to 15 mg/L NAFC experienced losses in equilibrium. If fish are unable to maintain equilibrium, this would affect their ability to forage for food, avoid predators, and reproduce with mates, among other normal activities critical for survival.
Conclusions
Currently, over 1 billion cubic meters of OSPW are stored in tailings ponds in Canada. A more comprehensive understanding of NAFC toxicity, particularly of the sublethal effects of chronic exposure to NAFCs, will help inform policy decisions regarding the safe elimination of tailing ponds from the landscape of Canada's oil sands region. We found that exposure to 15 mg/L NAFCs significantly decreased survival in juvenile yellow perch with an NAFC mixture primarily composed of classical naphthenic acids (i.e., O2-NAFCs). We also found that exposure to either 2 or 15 mg/L NAFCs impairs fish activity when responding to a predator stimulus. Moreover, we found that exposure to 15 mg/L NAFCs significantly increased the occurrence of equilibrium losses in juvenile perch. These NAFC concentrations are relevant to those found in OSPW in the oil sands region. This study is the first to demonstrate that NAFCs affect juvenile fish behaviours vital to survival and performance and thus provides important new context on sublethal effects on aquatic vertebrates associated with NAFCs. Future studies should prioritize the testing of NAFCs on a variety of native fish species and across multiple life stages, as well as model the predicted consequences that NAFC-induced behaviour changes may have on wild fish populations under different exposure scenarios.
Acknowledgements
Financial support for this research was provided by an Environment and Climate Change Canada Grant and Contribution (GCXE19S019 to DMO) and the Queen's University Research Leaders Fund (to DMO). We thank S. Gene (Queen's) for her hard work and support in the field, and Y. Wang and P. Blanchfield (Queen's) for their helpful advice on this project. We also thank two anonymous reviewers for providing helpful comments that improved this manuscript.
References
Agerstrand M., Arnold K., Balshine S., Brodin T., Brooks B.W., Maack G., et al. 2020. Emerging investigator series: use of behavioural endpoints in the regulation of chemicals. Environmental Science: Processes and Impacts, 22(1): 49–65. Available from https://www.ncbi.nlm.nih.gov/pubmed/31898699.
Alberta Energy Regulator. 2017. Directive 085: fluid tailings management for oil sands mining projects.
Alberta Energy Regulator. 2021. State of fluid tailings management for mineable oil sands, 2020. Calgary, Alberta.
Anderson J., Wiseman S.B., Moustafa A., El-Din M.G., Liber K., Giesy J.P. 2012. Effects of exposure to oil sands process-affected water from experimental reclamation ponds on Chironomus dilutus. Water Research, 46(6): 1662–1672. ISSN 0043-1354.
Barron M.G., Carls M.G., Short J.W., Rice S.D., Heintz R.A., Rau M., et al. 2005. Assessment of the phototoxicity of weathered Alaska North Slope crude oil to juvenile pink salmon. Chemosphere, 60(1): 105–110. Available from https://www.ncbi.nlm.nih.gov/pubmed/15910909.
Bartlett A.J., Frank R.A., Gillis P.L., Parrott J.L., Marentette J.R., Brown L.R., et al. 2017. Toxicity of naphthenic acids to invertebrates: extracts from oil sands process-affected water versus commercial mixtures. Environmental Pollution, 227: 271–279. https://www.ncbi.nlm.nih.gov/pubmed/28477551.
Bauer A.E., Frank R.A., Headley J.V., Milestone C.B., Batchelor S., Peru K.M., et al. 2019a. A preparative method for the isolation and fractionation of dissolved organic acids from bitumen-influenced waters. Science of the Total Environment, 671: 587–597. Available from https://www.ncbi.nlm.nih.gov/pubmed/30933815.
Bauer A.E., Frank R.A., Headley J.V., Peru K.M., Hewitt L.M., Dixon DG. 2015. Enhanced characterization of oil sands acid-extractable organics fractions using electrospray ionization-high-resolution mass spectrometry and synchronous fluorescence spectroscopy. Environmental Toxicology and Chemistry, 34(5): 1001–1008. Available from https://www.ncbi.nlm.nih.gov/pubmed/25615406.
Bauer A.E., Hewitt L.M., Parrott J.L., Bartlett A.J., Gillis P.L., Deeth L.E., et al. 2019b. The toxicity of organic fractions from aged oil sands process-affected water to aquatic species. Science of the Total Environment, 669: 702–710. Available from https://www.ncbi.nlm.nih.gov/pubmed/30893625.
Brodin T., Johansson F. 2004. Conflicting selection pressures on the growth/predation risk trade-off in a damselfly. Ecology, 85(11): 2927–2932.
Chivers D.P., Smith RJF. 1995. Free-living fathead minnows rapidly learn to recognize pike as predators. Journal of Fish Biology, 46(6): 949–954.
Chow-Fraser G., Rougeot A. 2022. 50 Years of sprawling tailings.
Ford A.T., Agerstrand M., Brooks B.W., Allen J., Bertram M.G., Brodin T., et al. 2021. The role of behavioral ecotoxicology in environmental protection. Environmental Science & Technology, 55(9): 5620–5628. Available from https://www.ncbi.nlm.nih.gov/pubmed/33851533.
Fox J., Weisberg S. 2019. An R companion to applied regression. 3rd ed. SAGE Publications, Inc, Thousand Oaks, CA. p. 608.
Gosselin J.L., Anderson JJ. 2020. Step-patterned survivorship curves: mortality and loss of equilibrium responses to high temperature and food restriction in juvenile rainbow trout (Oncorhynchus mykiss). PLoS One, 15(5): e0233699.
Government of Alberta. 2015. Lower Athabasca region: tailings management framework for the mineable Athabasca oil sands.
Harvey M.C., Brown GE. 2004. Dine or dash?: ontogenetic shift in the response of yellow perch to conspecific alarm cues. Environmental Biology of Fishes, 70(4): 345–352.
Headley J.V., Peru K.M., Vander Meulen I. 2021. Advances in mass spectrometry for molecular characterization of oil sands naphthenic acids and process chemicals in wetlands. Canadian Journal of Chemistry, 99(10): 821–830.
Headley J.V., Peru K.M., McMartin D.W., Winkler M. 2002. Determination of dissolved naphthenic acids in natural waters by using negative-ion electrospray mass spectrometry. Journal of AOAC International, 85(1): 182–187.
Headley J.V., Peru K.M., Mohamed M.H., Frank R.A., Martin J.W., Hazewinkel R.R., et al. 2013. Chemical fingerprinting of naphthenic acids and oil sands process waters – a review of analytical methods for environmental samples. Journal of Environmental Science and Health, Part A, 48(10): 1145–1163. Available from https://www.ncbi.nlm.nih.gov/pubmed/23647107.
Hogan N.S., Thorpe K.L., van den Heuvel MR. 2018. Opportunistic disease in yellow perch in response to decadal changes in the chemistry of oil sands-affected waters. Environmental Pollution, 234: 769–778.
Hughes S.A., Mahaffey A., Shore B., Baker J., Kilgour B., Brown C., et al. 2017. Using ultrahigh-resolution mass spectrometry and toxicity identification techniques to characterize the toxicity of oil sands process-affected water: the case for classical naphthenic acids. Environmental Toxicology and Chemistry, 36(11): 3148–3157. Available from https://www.ncbi.nlm.nih.gov/pubmed/28628243.
Johansen J.L., Allan B.J.M., Rummer J.L., Esbaugh AJ. 2017. Oil exposure disrupts early life-history stages of coral reef fishes via behavioural impairments. Nature Ecology & Evolution, 1(8): 1146–1152. Available from https://www.ncbi.nlm.nih.gov/pubmed/29046575.
Kavanagh R.J., Frank R.A., Burnison B.K., Young R.F., Fedorak P.M., Solomon K.R., et al. 2012. Fathead minnow (Pimephales promelas) reproduction is impaired when exposed to a naphthenic acid extract. Aquatic Toxicology, 116–117: 34–42. Available from https://www.ncbi.nlm.nih.gov/pubmed/22459411.
Kavanagh R.J., Frank R.A., Solomon K.R., Kraak G.V.D. 2013. Reproductive and health assessment of fathead minnows (Pimephales promelas) inhabiting a pond containing oil sands process-affected water. Aquatic Toxicology, 130–131: 201–209. ISSN 0166-445X.
Kochhann D., Meyersieck Jardim M., Valdez Domingos F.X., Val A.L. 2015. Biochemical and behavioral responses of the Amazonian fish Colossoma macropomum to crude oil: the effect of oil layer on water surface. Ecotoxicology and Environmental Safety, 111: 32–41. Available from https://www.ncbi.nlm.nih.gov/pubmed/25450912.
Kovalchik K.A., MacLennan M.S., Peru K.M., Headley J.V., Chen D.D.Y. 2017. Standard method design considerations for semi-quantification of total naphthenic acids in oil sands process affected water by mass spectrometry: A review. Front. Chem. Sci. Eng. 11: 497–507.
Lari E., Abtahi B., Hashtroudi MS. 2016. The effect of the water soluble fraction of crude oil on survival, physiology and behaviour of Caspian roach, Rutilus caspicus (Yakovlev, 1870). Aquatic Toxicology, 170: 330–334. Available from https://www.ncbi.nlm.nih.gov/pubmed/26377481.
Lari E., Pyle GG. 2017. Rainbow trout (Oncorhynchus mykiss) detection, avoidance, and chemosensory effects of oil sands process-affected water. Environmental Pollution, 225: 40–46. Available from https://www.ncbi.nlm.nih.gov/pubmed/28347902.
Li C., Fu L., Stafford J., Belosevic M., Gamal El-Din M. 2017. The toxicity of oil sands process-affected water (OSPW): a critical review. Science of the Total Environment, 601–602: 1785–1802. Available from https://www.ncbi.nlm.nih.gov/pubmed/28618666.
Loughery J.R., Marentette J.R., Frank R.A., Hewitt L.M., Parrott J.L., Martyniuk CJ. 2019. Transcriptome profiling in larval fathead minnow exposed to commercial naphthenic acids and extracts from fresh and aged oil sands process-affected water. Environmental Science & Technology, 53(17): 10435–10444. Available from https://www.ncbi.nlm.nih.gov/pubmed/31335129.
Mahaffey A., Dubé M. 2017. Review of the composition and toxicity of oil sands process-affected water. Environmental Reviews, 25(1): 97–114.
Marentette J.R., Frank R.A., Bartlett A.J., Gillis P.L., Hewitt L.M., Peru K.M., et al. 2015a. Toxicity of naphthenic acid fraction components extracted from fresh and aged oil sands process-affected waters, and commercial naphthenic acid mixtures, to fathead minnow (Pimephales promelas) embryos. Aquatic Toxicology, 164: 108–117. Available from https://www.ncbi.nlm.nih.gov/pubmed/25957715.
Marentette J.R., Frank R.A., Hewitt L.M., Gillis P.L., Bartlett A.J., Brunswick P., et al. 2015b. Sensitivity of walleye (Sander vitreus) and fathead minnow (Pimephales promelas) early-life stages to naphthenic acid fraction components extracted from fresh oil sands process-affected waters. Environmental Pollution, 207: 59–67. Available from https://www.ncbi.nlm.nih.gov/pubmed/26342575.
Marentette J.R., Sarty K., Cowie A.M., Frank R.A., Hewitt L.M., Parrott J.L., et al. 2017. Molecular responses of Walleye (Sander vitreus) embryos to naphthenic acid fraction components extracted from fresh oil sands process-affected water. Aquatic Toxicology, 182: 11–19. Available from https://www.ncbi.nlm.nih.gov/pubmed/27842271.
Martin JW. 2015. The challenge: safe release and reintegration of oil sands process-affected water. Environmental Toxicology and Chemistry, 34(12): 2682. Available from https://www.ncbi.nlm.nih.gov/pubmed/26605865.
Mathis A., Smith RJF. 1993. Intraspecific and cross-superorder responses to chemical alarm signals by brook stickleback. Ecology, 74(8): 2395–2404.
Mirza R.S., Chivers DP. 2001. Do juvenile yellow perch use diet cues to assess the level of threat posed by intraspecific predators? Behaviour, 138: 1249–1258.
Morandi G.D., Wiseman S.B., Pereira A., Mankidy R., Gault I.G., Martin J.W., et al. 2015. Effects-directed analysis of dissolved organic compounds in oil sands process-affected water. Environmental Science & Technology, 49(20): 12395–12404. Available from https://www.ncbi.nlm.nih.gov/pubmed/26381019.
Muto A., Kawakami K. 2013. Prey capture in zebrafish larvae serves as a model to study cognitive functions. Frontiers in Neural Circuits, 7 110. Available from https://www.ncbi.nlm.nih.gov/pubmed/23781176.
Nero V., Farwell A., Lee L.E.J., Van Meer T., MacKinnon M.D., Dixon DG. 2006. The effects of salinity on naphthenic acid toxicity to yellow perch: gill and liver histopathology. Ecotoxicology and Environmental Safety, 65(2): 252–264.
OECD. 2013. Test No. 210: fish, early-life stage toxicity test. OECD Guidelines for the Testing of Chemicals. Section 2.
Palacio Lozano D.C., Thomas M.J., Jones H.E., Barrow M.P. 2020. Annual review of analytical chemistry petroleomics: tools, challenges, and developments. Annual Review of Analytical Chemistry, 13: 405–430.
Philibert D.A., Lyons D.D., Qin R., Huang R., El-Din M.G., Tierney K.B. 2019. Persistent and transgenerational effects of raw and ozonated oil sands process-affected water exposure on a model vertebrate, the zebrafish. Science of the Total Environment, 693: 133611. https://www.ncbi.nlm.nih.gov/pubmed/31634996.
R Core Team. 2021. R: a language and environment for statistical computing. R Foundation for Statistical Computing, Vienna, Austria.
Reichert M., Blunt B., Gabruch T., Zerulla T., Ralph A., Gamal El-Din M., et al. 2017. Sensory and behavioral responses of a model fish to oil sands process-affected water with and without treatment. Environmental Science & Technology, 51(12): 7128–7137. Available from https://www.ncbi.nlm.nih.gov/pubmed/28525709.
Reynolds J.S., Jackson B.L., Madison B.N., Elvidge C.K., Frank R.A., Hasler C.T., et al. 2022. Fathead minnows exposed to organic compounds from oil sands tailings as embryos have reduced survival, impaired development, and altered behaviors that persist into larval stages. Environmental Toxicology and Chemistry. 41(5): 1319–1332. Available from https://www.ncbi.nlm.nih.gov/pubmed/35188283.
Rich J.T., Neely J.G., Paniello R.C., Voelker C.C.J., Nussenbaum B., Wang E.W. 2010. A practical guide to understanding Kaplan–Meier curves. Otolaryngology – Head and Neck Surgery, 143(3): 331–336.
Robinson C.E., Elvidge C.K., Frank R.A., Headley J.V., Hewitt L.M., Little A.G., et al. 2023. Naphthenic acid fraction compounds reduce the reproductive success of wood frogs (Rana sylvatica) by affecting offspring viability. Environmental Science & Technology, 52(18): 10803–10811.
Rogers V. V., Liber K., MacKinnon M. D. 2002. Isolation and characterization of naphthenic acids from Athabasca oil sands tailings pondwater. Chemosphere, 48(5): 519–527.
Rundle K.I., Sharaf M.S., Stevens D., Kamunde C., van den Heuvel MR. 2018. Oil sands derived naphthenic acids are oxidative uncouplers and impair electron transport in isolated mitochondria. Environmental Pollution, 316: 120455.
Rundle K.I., Sharaf M.S., Stevens D., Kamunde C., van den Heuvel MR. 2021. Adamantane carboxylic acids demonstrate mitochondrial toxicity consistent with oil sands-derived naphthenic acids. Environmental Advances, 5: 100092.
Saaristo M., Brodin T., Balshine S., Bertram M.G., Brooks B.W., Ehlman S.M., et al. 2018. Direct and indirect effects of chemical contaminants on the behaviour, ecology and evolution of wildlife. Proceedings of the Royal Society B, 285(1885). Available from https://www.ncbi.nlm.nih.gov/pubmed/30135169.
Schymanski E.L., Jeon J., Gulde R., Fenner K., Ruff M., Singer H.P., Hollender J. 2014. Identifying Small Molecules via High Resolution Mass Spectrometry: Communicating Confidence. Environmental Science & Technology, 48(4): 2097–2098.
Scott G.R., Sloman KA. 2004. The effects of environmental pollutants on complex fish behaviour: integrating behavioural and physiological indicators of toxicity. Aquatic Toxicology, 68(4): 369–392. Available from https://www.ncbi.nlm.nih.gov/pubmed/15177953.
Smith B.R., Blumstein DT. 2008. Fitness consequences of personality: a meta-analysis. Behavioral Ecology, 19(2): 448–455.
Sun C., Shotyk W., Cuss C.W., Donner M.W., Fennell J., Javed M., et al. 2017. Characterization of naphthenic acids and other dissolved organics in natural water from the Athabasca Oil Sands Region, Canada, Environmental Science & Technology, 51(17): 9524–9532. Available from https://www.ncbi.nlm.nih.gov/pubmed/28726392.
Tanna R.N., Redman A.D., Frank R.A., Arciszewski T.J., Zubot W.A., Wrona F.J., et al. 2019. Overview of existing science to inform oil sands process water release: a technical workshop summary. Integrated Environmental Assessment and Management, 15(4):519–527. https://www.ncbi.nlm.nih.gov/pubmed/30908840.
Teather K., Parrott J. 2006. Assessing the chemical sensitivity of freshwater fish commonly used in toxicological studies. Water Quality Research Journal, 41(1): 100–105.
Therneau TM. 2021. A package for survival analysis in R. R package version 3.2-11. Available from https://CRAN.R-project.org/package=survival.
Underwood AJ. 1993. The mechanics of spatially replicated sampling programs to detect environmental impacts in a variable world. Australian Journal of Ecology, 18(1): 99–116.
van den Heuvel M.R., Hogan N.S., Roloson S.D., Van Der Kraak G.J. 2012. Reproductive development of yellow perch (Perca flavescens) exposed to oil sands–affected waters. Environmental Toxicology and Chemistry, 31: 654–662.
Vander Meulen I.J., Klemish J.L., Peru K.M., Chen D.D.Y., Pyle G.G., Headley JV. 2021a. Molecular profiles of naphthenic acid fraction compounds from mine lease wetlands in the Athabasca oil sands region. Chemosphere, 272: 129892. https://www.ncbi.nlm.nih.gov/pubmed/33601202.
Vander Meulen I.J., Schock D.M., Parrott J.L., Mundy L.J., Pauli B.D., Peru K.M., et al. 2021b. Characterization of naphthenic acid fraction compounds in water from Athabasca oil sands wetlands by Orbitrap high-resolution mass spectrometry. Science of the Total Environment, 780: 146342. Available from https://www.ncbi.nlm.nih.gov/pubmed/33770601.
Vignet C., Joassard L., Lyphout L., Guionnet T., Goubeau M., Le Menach K., et al. 2015. Exposures of zebrafish through diet to three environmentally relevant mixtures of PAHs produce behavioral disruptions in unexposed F1 and F2 descendant. Environmental Science and Pollution Research, 22(21): 16371–16383. Available from https://www.ncbi.nlm.nih.gov/pubmed/25639250.
Vignet C., Le Menach K., Lyphout L., Guionnet T., Frere L., Leguay D., et al. 2014. Chronic dietary exposure to pyrolytic and petrogenic mixtures of PAHs causes physiological disruption in zebrafish—part II: behavior. Environmental Science and Pollution Research, 21(24): 13818–13832. Available from https://www.ncbi.nlm.nih.gov/pubmed/24671398.
Wallace R.R., McCart PJ. 1984. The fish and fisheries of the Athabasca River Basin: status and environmental requirements. Oil Sands Research and Information Network (OSRIN), Government of Alberta Reports. Alberta Environment and Sustainable Resource Development, Edmonton, Alberta.
Wickham H. 2016. ggplot2: elegant graphics for data analysis. Springer-Verlag, New York.
Yang Z., Zhang G., Yang C., Shah K., Hollebone B.P., Laforest S., et al. 2021. Occurrence and characterisation of naphthenic acid fraction components in oil residues and sediments stranded on the shoreline of Chedabucto Bay, Nova Scotia, Canada. Environmental Earth Sciences, 80: 669.
Zala S.M., Penn D.J. 2004. Abnormal behaviours induced by chemical pollution: a review of the evidence and new challenges.Animal Behaviour, 68(4): 649–664.
Supplementary material
Supplementary Material 1 (DOCX / 3.16 MB).
- Download
- 3.17 MB
Information & Authors
Information
Published In
FACETS
Volume 9 • January 2024
Pages: 1 - 12
Editor: Irene Gregory-Eaves
History
Received: 8 August 2022
Accepted: 8 August 2023
Version of record online: 1 February 2024
Copyright
© 2024 The Author(s). This work is licensed under a Creative Commons Attribution 4.0 International License (CC BY 4.0), which permits unrestricted use, distribution, and reproduction in any medium, provided the original author(s) and source are credited.
Data Availability Statement
The data are available at https://github.com/JessieReynolds/NAFCYellowPerchStudy.
Key Words
Sections
Subjects
Authors
Author Contributions
Conceptualization: JSR, DMO
Data curation: JSR, IJVM
Formal analysis: JSR, CKE, IJVM
Investigation: JSR, IJVM
Methodology: JSR, DMO
Project administration: DMO
Resources: CTH, RAF, JVH, LMH, DMO
Supervision: DMO
Visualization: JSR, CKE
Writing – original draft: JSR, IJVM, DMO
Writing – review & editing: JSR, CKE, IJVM, CTH, RAF, JVH, LMH, DMO
Competing Interests
The authors declare that they have no known competing financial interests or personal relationships that could have appeared to influence the work reported in this paper.
Funding Information
Environment and Climate Change Canada: GCXE19S019
Queen's University: Queen's University Research Leaders
Metrics & Citations
Metrics
Other Metrics
Citations
Cite As
Jessie S. Reynolds, Chris K. Elvidge, Ian J. Vander Meulen, Caleb T. Hasler, Richard A. Frank, John V. Headley, L. Mark Hewitt, and Diane M. Orihel. 2024. Naphthenic acid fraction compounds, produced by the extraction of bitumen from oil sands, alter survival and behaviour of juvenile yellow perch (Perca flavescens). FACETS.
9(): 1-12. https://doi.org/10.1139/facets-2022-0176
Export Citations
If you have the appropriate software installed, you can download article citation data to the citation manager of your choice. Simply select your manager software from the list below and click Download.
There are no citations for this item