Open access

Freshwater influence is associated with differences in bone mineral density and armour configuration in threespine stickleback (Gasterosteus aculeatus)

Publication: FACETS
25 June 2018

Abstract

Threespine stickleback (Gasterosteus aculeatus Linnaeus, 1758) exhibit a well-documented reduction in plate number associated with adaptation to freshwater environments. We tested the hypothesis that changes in plate number are accompanied by changes in plate bone mineral density and plate shape, reflecting the presence of a complex plate “armour” phenotype and a complex adaptive response to different selective pressures in changing habitats. We used traditional and novel morphometric techniques to characterize armour traits from stickleback occupying three marine habitats and one tidally influenced freshwater stream in southwestern British Columbia. Stickleback inhabiting marine environments share a conserved plate phenotype that includes a full complement of highly mineralized plates that exhibit a characteristic density profile along the plate. Stickleback inhabiting tidally influenced fresh water display an average reduction in plate number along with increased variation in number and reduced total mineralization despite maintenance of a marine-like density profile. Further, we found that although mineralization and armour shape are correlated with size, after accounting for size variation in both traits remains attributable to habitat. Our results hint at an important role for development in structuring phenotypic variation during the process of adaptive change in stickleback.

Introduction

Although the incorporation of genetic theory and genomic approaches have resulted in substantial gains toward understanding the processes that produce phenotypic variation in nature, it is clear that considerable work remains to be done to understand the nature and complexity of the links between genotype, phenotype, and environmental context that ultimately produce the phenotypes upon which selection can act (Travisano and Shaw 2013). Within this framework, quantitative studies of phenotypic variation and the detailed characterization of phenotypic complexity remain key to uncovering the developmental and environmental contexts that organisms experience (Mallarino et al. 2011; Jamniczky et al. 2015a, 2015b; Higham et al. 2016).
The threespine stickleback (Gasterosteus aculeatus Linnaeus, 1758) is an important model for the study of rapid adaptive change and evolution in response to habitat variation. A distinctive feature of this fish is the presence of elaborate bony structural elements, including spines and lateral plates, which act as parts of a functional armour complex thought to be primarily for resisting predation (Reimchen 1983; but see Kynard (1979) and Huntingford (1981) for discussion of the relationship between plate number and aggression in males). Threespine stickleback are known to exhibit parallel changes in plate phenotype, as since the last major glaciation they have repeatedly moved from a marine environment to colonize freshwater lakes and streams (
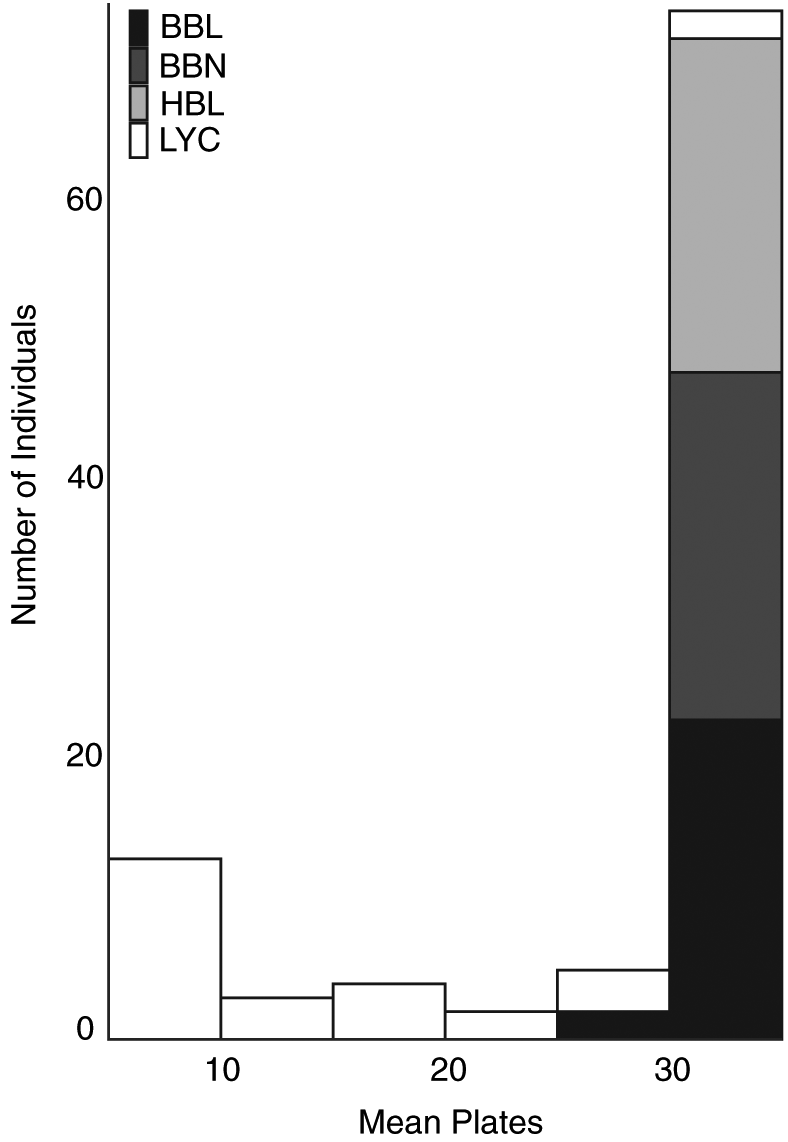
Bell and Foster (1994)). This phenotypic variation has largely been characterized by a reduction in plate number. Adult marine stickleback normally exhibit between 30 and 36 bony lateral plates, whereas freshwater forms show a range of variation, with those populations that are well established in freshwater habitats exhibiting between zero and nine bony lateral plates (Hagen and Gilbertson 1972; Bell and Foster 1994). Plates tend to be lost from the back and the middle of the fish, whereas anterior plates are largely retained to support the spines (Reimchen 1983).
Allelic variation at the eda locus in threespine stickleback produces variation in both plate number and size (Colosimo et al. 2004; Cresko et al. 2004; Colosimo et al. 2005), and plate number has been shown to be highly heritable (Hagen and Gilbertson 1973; Hermida et al. 2002; Aguirre et al. 2004). However, approximately 30% of variation in plate number is not explained by variation in eda (Colosimo et al. 2004), and recent work has shown that a reduction in plate number results from selection on both the plates themselves and on other correlated traits controlled, in part, by eda (Rennison et al. 2015).
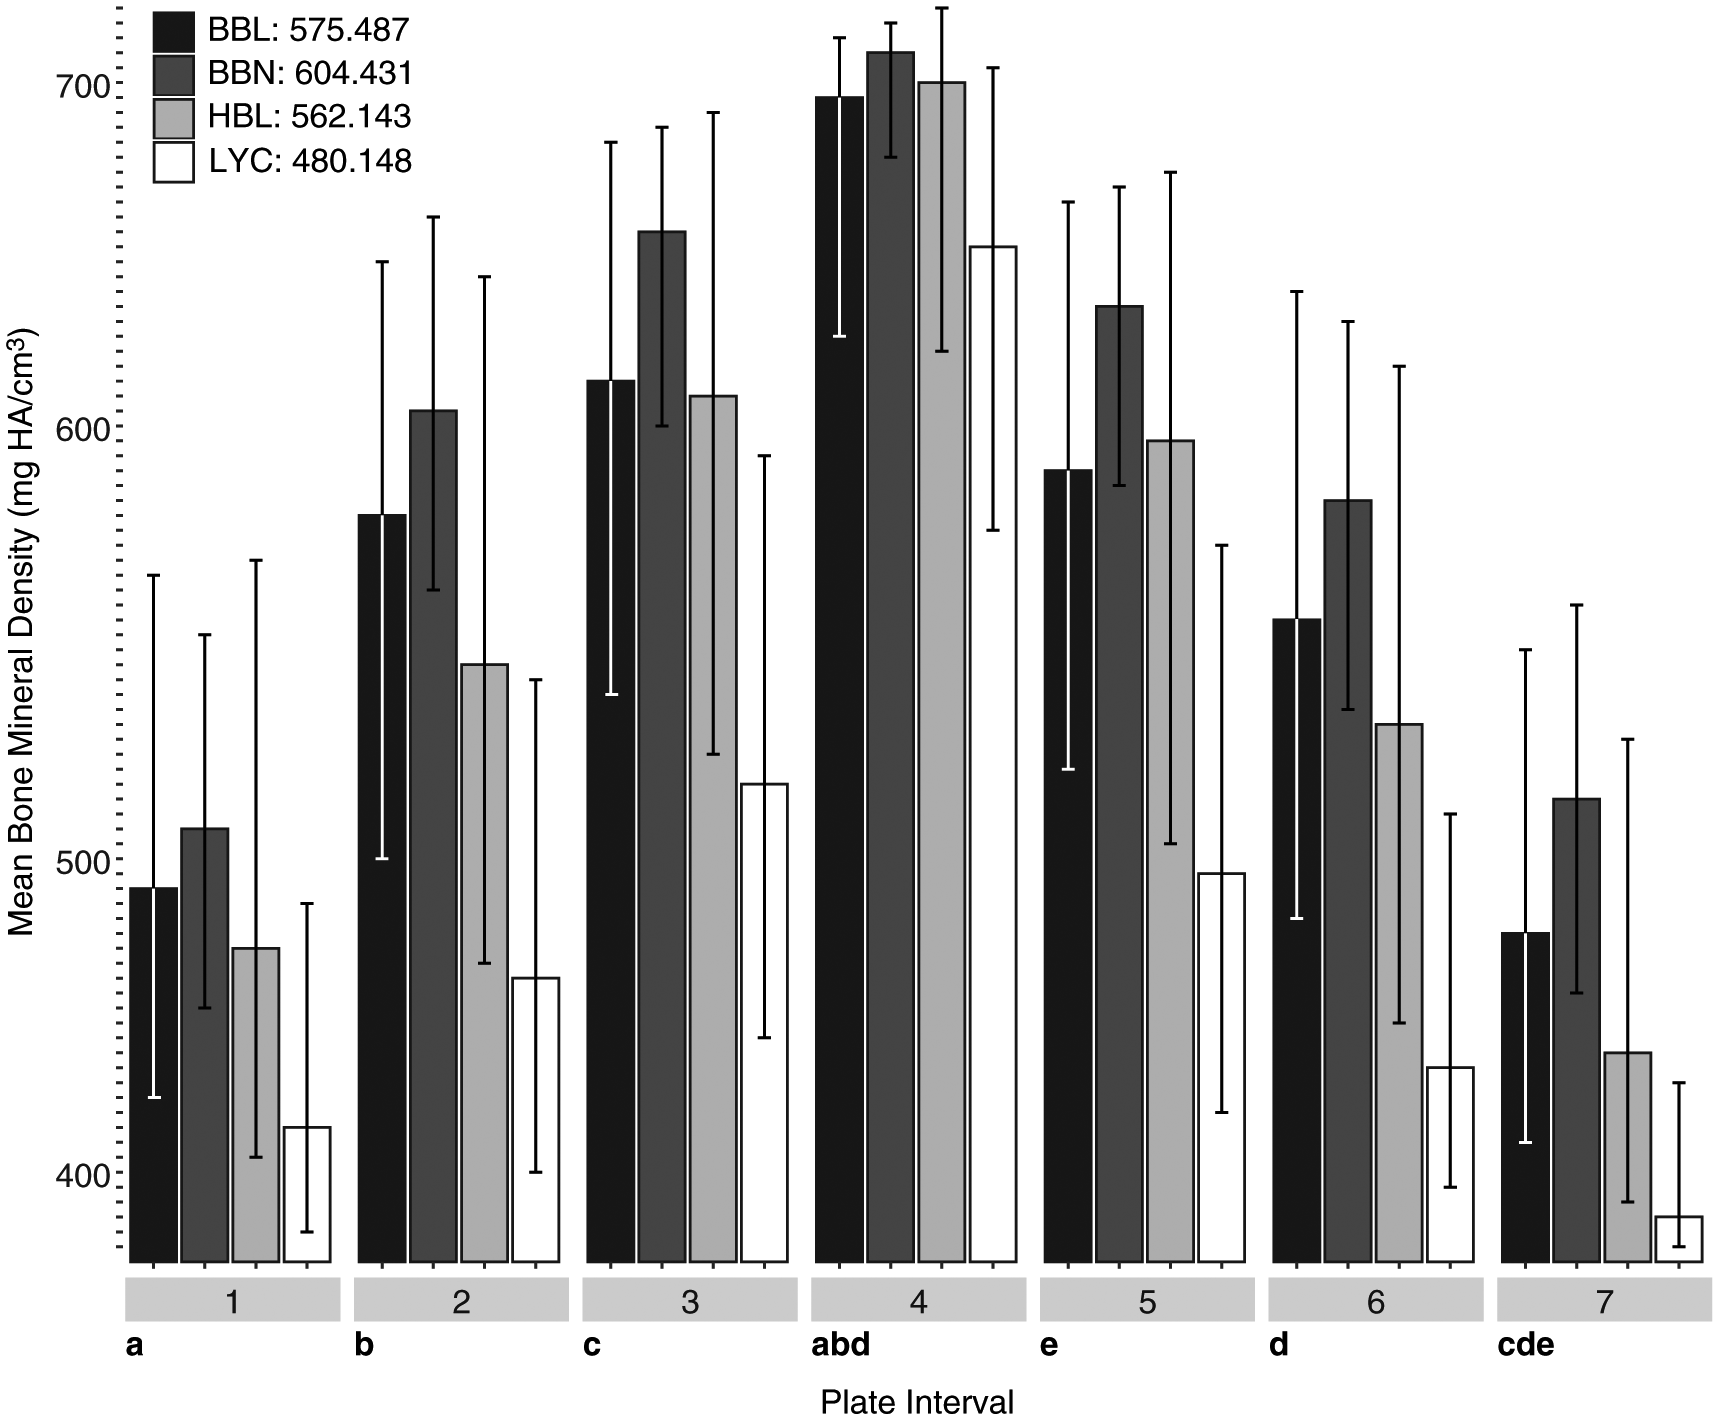
Plate loss has been extensively studied, and several different hypotheses regarding the putative driver(s) behind repeated loss of plates during invasion of fresh water have been proposed, including changes in calcium availability and the cost of mineralization (Giles 1983; Marchinko and Schluter 2007; Smith et al. 2014), salinity (Hansson et al. 2016), gradient (Baumgartner and Bell 1984), maneuverability (Taylor and McPhail 1986; Bergstrom 2002), buoyancy (Myhre and Klepaker 2009), and predation pressure (Hagen and Gilbertson 1972; Reimchen 2000; Kitano et al. 2008). The relative importance of these factors in producing a selective environment that favours plate reduction is still largely unknown, but it has been shown that complete morphs (sensu Hagen and Gilbertson 1972) exhibit reduced fitness in freshwater environments, and that there may, in fact, be multiple ways to achieve the selective advantage of low-platedness in the face of competing environmental challenges (Barrett et al. 2008; Leinonen et al. 2012). Further, it has been shown that divergent selection acting with gene flow can maintain plate morph polymorphism despite directional selection acting on genes known to influence plate phenotype (Raeymaekers et al. 2014).
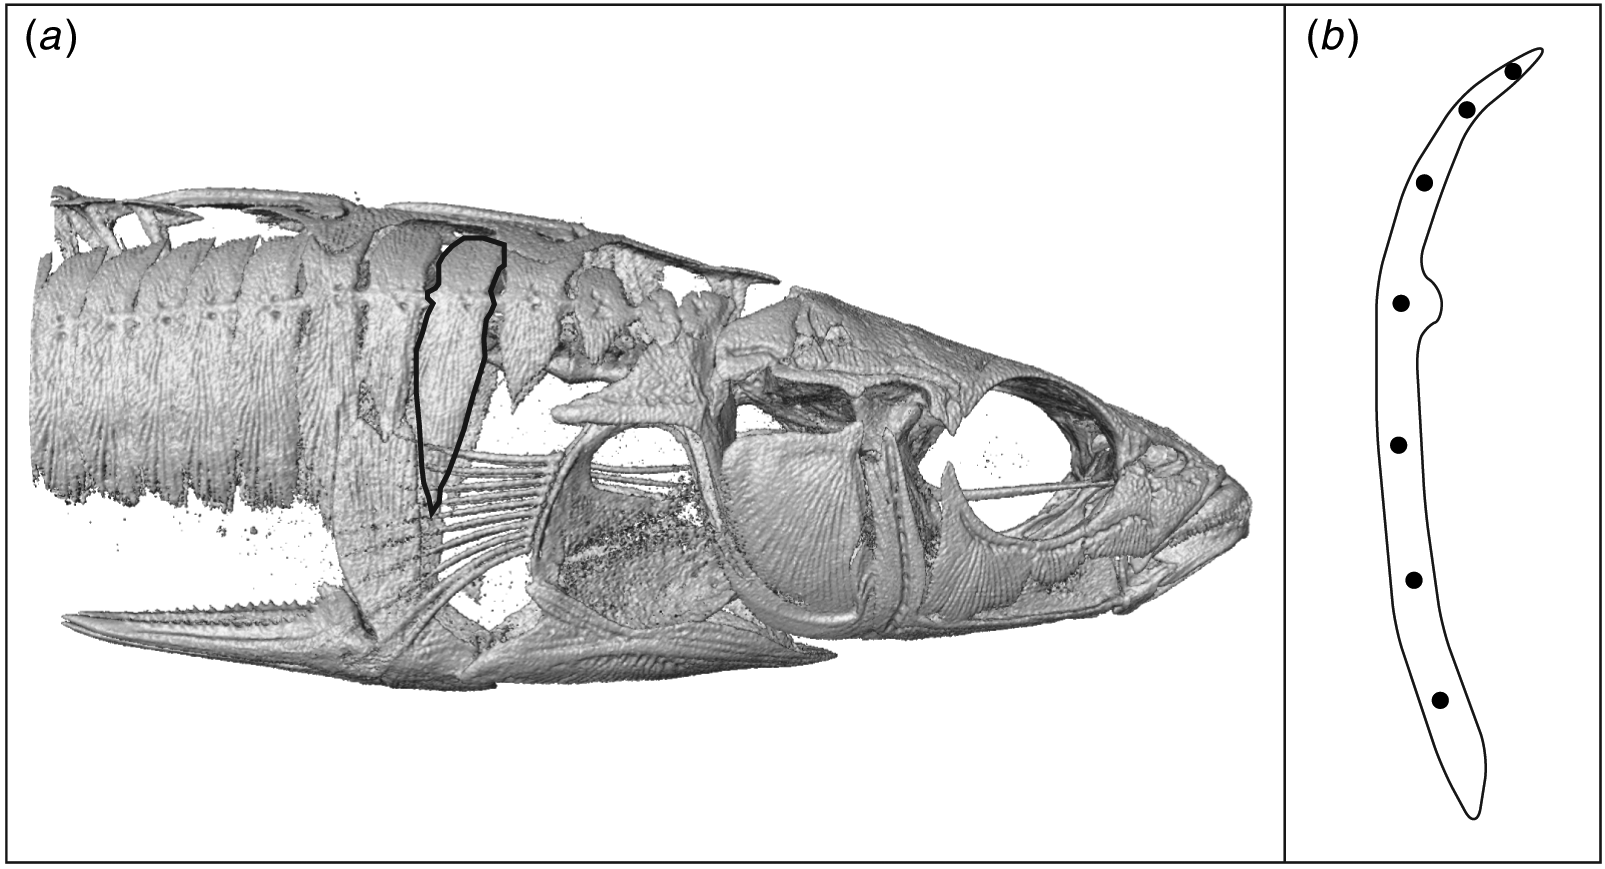
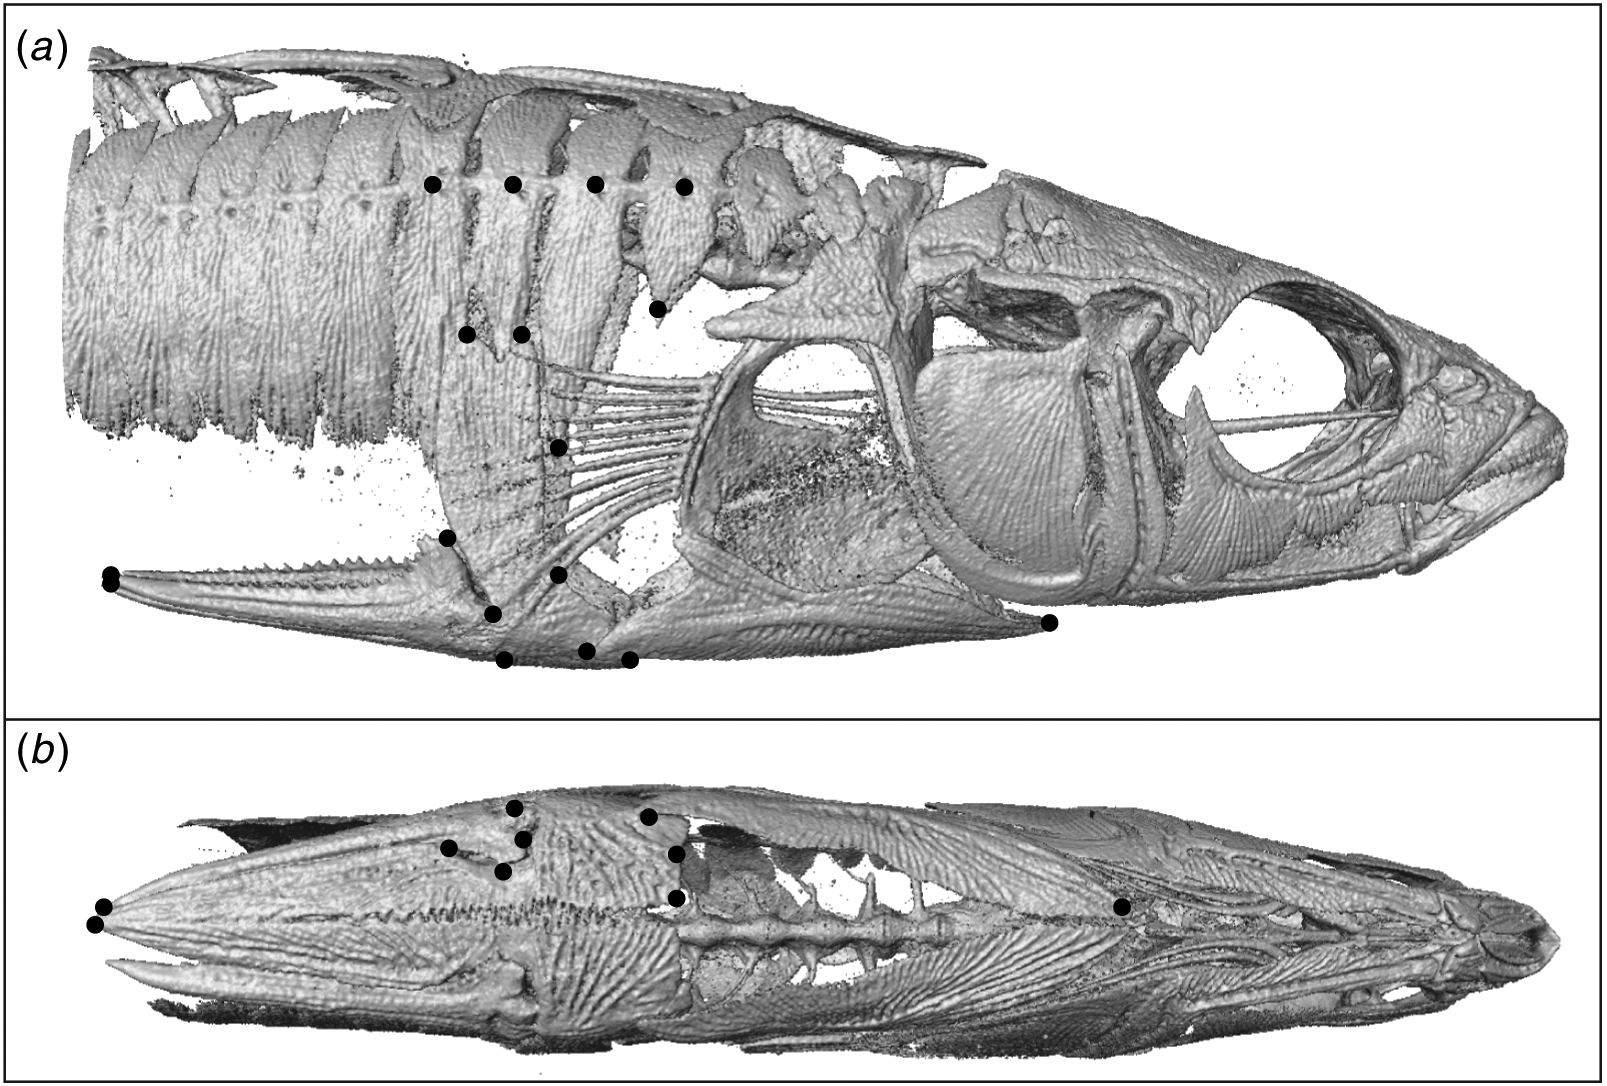
Other phenotypic characteristics of plates such as plate composition and size, as well as the relationship between plate phenotype and other aspects of stickleback morphology, remain less well studied and are likely to harbor evolutionarily important variation relevant at the level of both species and population. Stickleback plates are composed of acellular dermal bone (Sire et al. 2009) and lend themselves well to highly detailed imaging studies. Detailed descriptions of plate microstructure produced using scanning electron microscopy (Lees et al. 2012) indicate the presence of species-specific variation. Previous work using micro-computed tomography has focused on plate structure within a single anadromous population (Song et al. 2010), and on comparisons among stickleback occupying different habitats (Wiig et al. 2016). Substantial variation exists in multiple parameters that is correlated with, but not entirely explained by, salinity, and although both of these studies examined mineralization, they used only single-point measurements to characterize this aspect of plate phenotype. Plate size has also been shown to vary among different populations (Miller and Hubbs 1969; Colosimo et al. 2004), and plate number has also been linked to a range of other phenotypic characteristics including body shape, fin shape, and gill raker number (Gross 1977; Wootton 1984).
It has long been assumed that marine stickleback form a single, panmictic population across large geographical areas (Withler and McPhail 1985; Taylor and McPhail 1999; Hohenlohe et al. 2010). Yet, evidence of adaptive divergence and population sub-structure within the marine environment has recently emerged (DeFaveri and Merilä 2013; DeFaveri et al. 2013). Such structure is partially reflected in the presence of previously underappreciated marine population-level phenotypic variation in complex traits including cranial and postcranial features (DeFaveri and Merilä 2013; Jamniczky et al. 2015a, 2015b; M.R.J. Morris, personal communication, 2017). The assumption that marine sticklebacks form a single homogenous population extends to plate phenotypes, where marine fishes have been found to be consistently completely plated (Bell and Foster 1994), albeit with varying standing genetic variation for eda, whereas other phenotypic characteristics of plates have not been extensively considered. The nature of the genetic and environmental mechanisms that underlie the maintenance of phenotypic variation in sticklebacks in the marine environment remains poorly understood, and we propose that this may be, in part, due to the inability of relatively superficial trait descriptions (such as plate counts) to adequately describe features of organisms that selection actually sees.
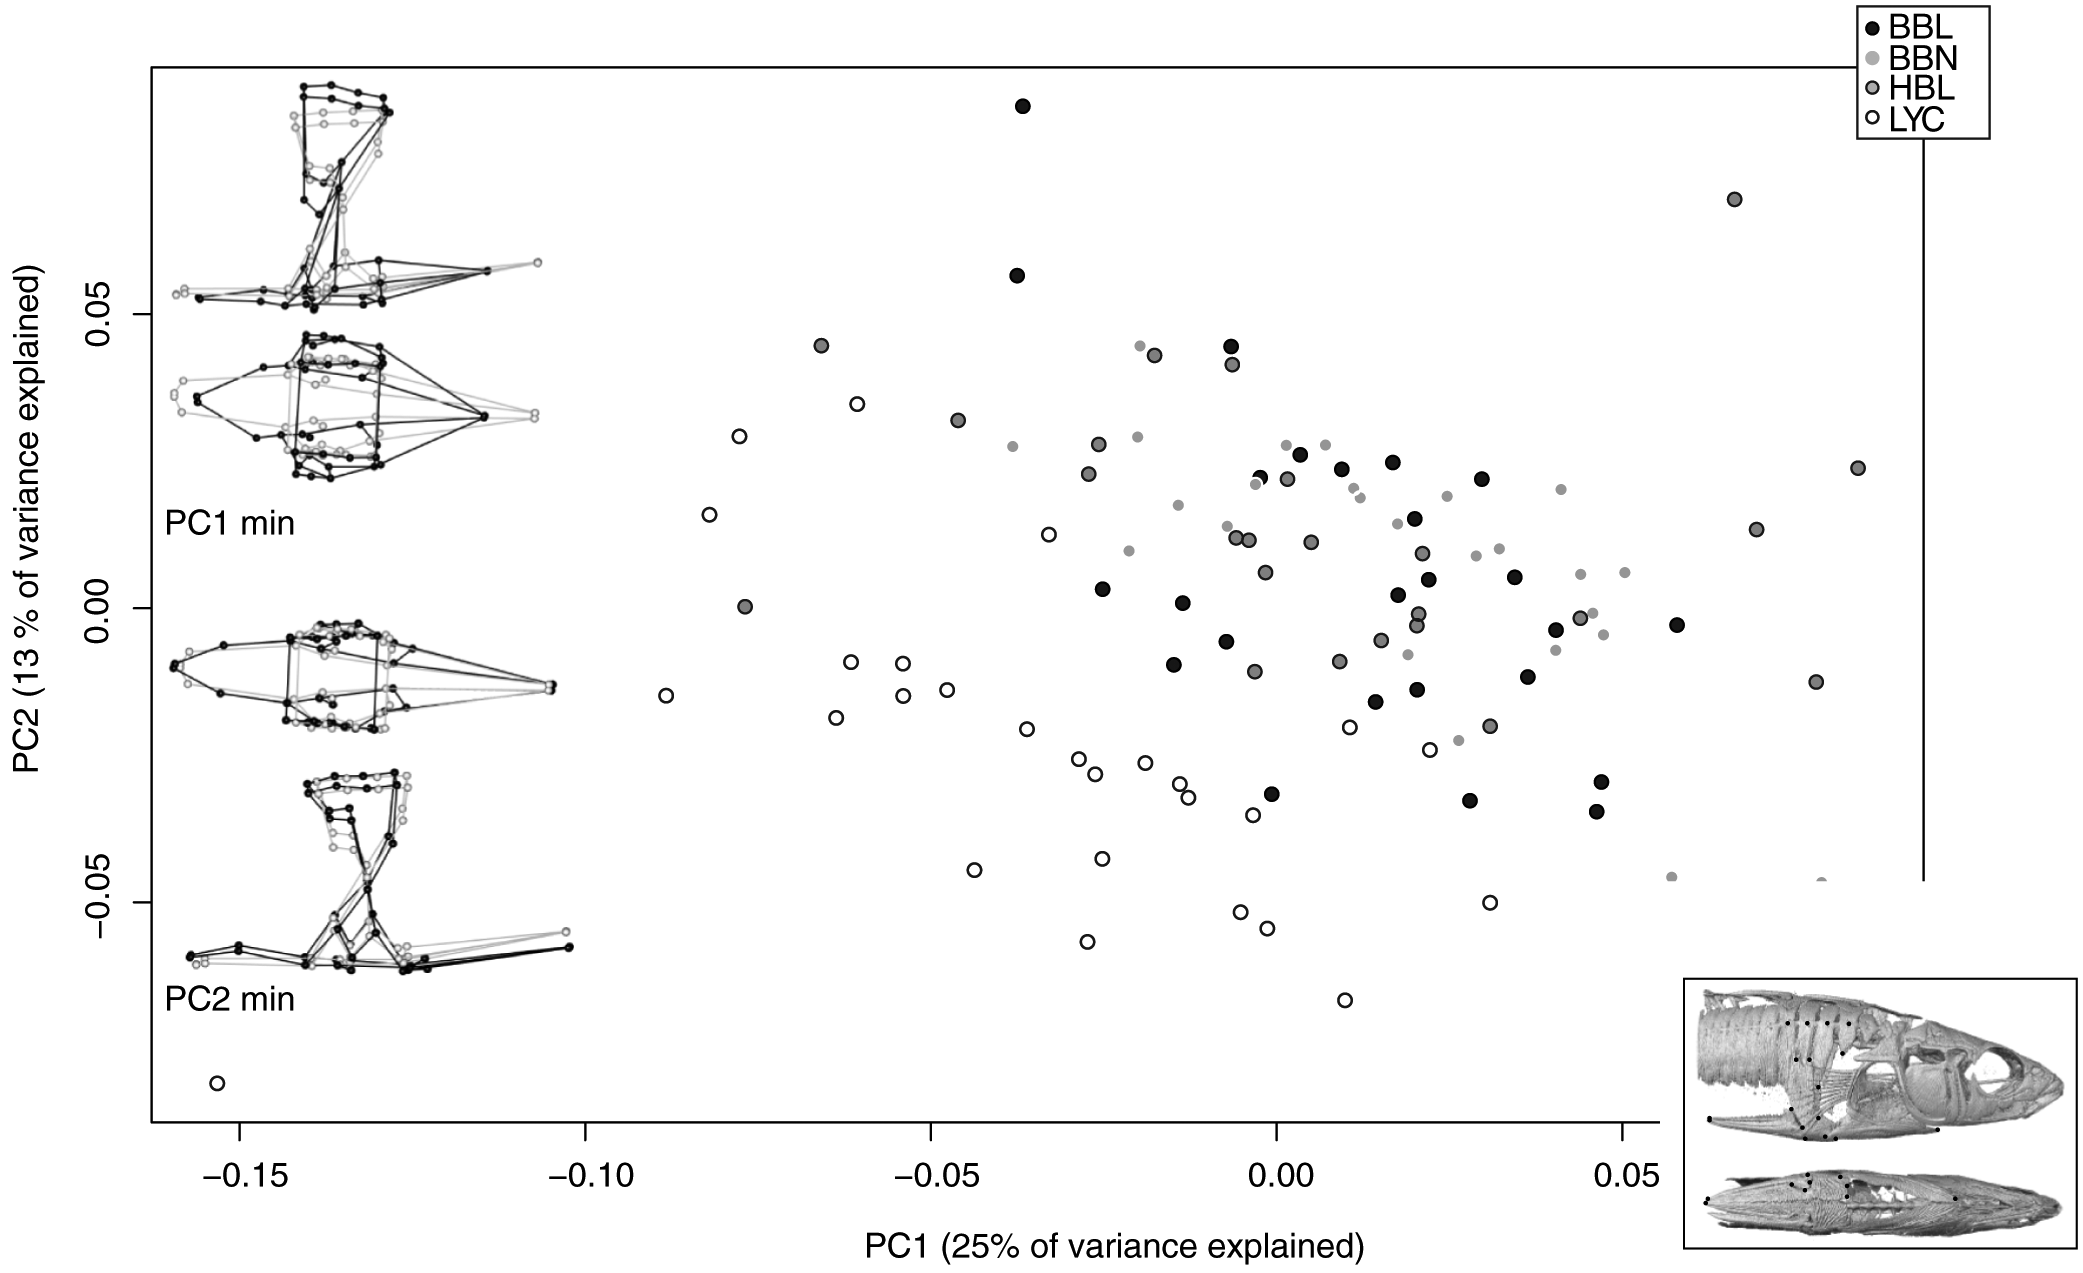
Based on new evidence of diversity in marine populations, we used both traditional histological tools and novel imaging and analysis techniques to more completely characterize threespine stickleback plate phenotype and armour morphology to test the hypotheses that (1) plates are a complex trait with multiple variable phenotypes and (2) that the influence of water type will be apparent in these plate phenotypes. We predicted that plate phenotype will vary within marine habitats as well as in comparison with a population inhabiting a tidally influenced freshwater stream within the same watershed, and that changes to plate phenotype that are correlated with exposure to fresh water will include a reduction in number, decreases in bone mineral density, and changes in shape reflecting the reduction of the extent of the armour complex due to the reduced availability of minerals essential to bone formation in this habitat.

Materials and methods

Specimen collection

Adult fish (standard length ≥40 mm) representing four different habitats from the Pender Harbour region, located on the Sunshine Coast of British Columbia, were used in this study. These habitats include the marine Hospital Bay Lagoon (HBL; 49°37′53.4″N, 124°1′48.0″W; n = 24), Bargain Bay Narrows (BBN; 49°36′59.9″N, 124°1′50.3″W; n = 25), Bargain Bay Lagoon (BBL; 49°36′48.6″N, 124°1′46.9″W; n = 25), and the tidally influenced Lily Creek (LYC; 49°37′13.4″N, 124°1′43.2″W; n = 27). A total of 101 specimens were collected in the spring of 2014 using minnow traps, and were euthanized using an overdose of Eugenol (>400 mg/L; Grush et al. 2004; Sigma-Aldrich). All collection and euthanasia procedures were in accordance with the Canadian Council for Animal Care and the British Columbia Ministry of Forests, Lands, and Natural Resources Operations (University of Calgary Animal Care Permit AC13-0040; BC Fish Collection Permit SU14-92793). Specimens were immediately fixed in 10% neutral buffered formalin for 24 h, and then placed in 70% ethanol for long term storage.

Plate counts and morphology

All fish were scanned as described below, and subsequently stained with Alizarin Red S (Sigma-Aldrich, Oakville, Ontario) as described by Bell (1979). Lateral plates were then counted on both sides using an Olympus (Olympus Canada, Inc., Richmond Hill, Ontario) dissecting microscope. Fish were assigned to “low” (<10 plates per side), “partial” (10–30 plates per side), or “complete” (>30 plates per side) plate phenotypes, following extensive previous work (e.g., Hagen and Gilbertson 1972; Ziuganov 1983). Plates were counted for both sides twice, and averaged to assign fish to plate phenotypes. Standard length (tip of lower jaw to posterior end of hypural bone) was also measured for each specimen.

Three-dimensional (3D) imaging and bone mineral density measurement

Fish were imaged using a Scanco μCT35 instrument (Scanco Medical AG, Brütisellen, Switzerland), using a standardized multiple-scanning protocol at a resolution of 20.00 μm (70 kV, 114 μA, 20.5 mm field of view and a 200 ms integration time). Raw data were thresholded and reconstructed into slice stacks for further analysis using identical parameters for every specimen.
Bone mineral density (BMD) was estimated by estimating hydroxyapatite content (mg HA/cm3) via threshold values obtained from μCT and related to the mineral equivalent using a calibration phantom (calibration was repeated weekly; Bouxsein et al. 2010). BMD was obtained in a grid pattern on the first complete lateral plate (plate five, numbered from the cranial end). This plate was sampled through the anterior margin toward the posterior, taking nine measurements across the plate at seven intervals from dorsal to ventral (Fig. 1). These measurements were repeated three times for each fish, and then a mean value for BMD was calculated for each plate interval for each fish by averaging across slices and repeated measurements. Habitat means for intervals and for whole plates were calculated from these data. BMD data were obtained using IPL software (Scanco Medical AG, Brütisellen, Switzerland).
Fig. 1.
Fig. 1. Bone mineral density measurement strategy. (a) shows a right lateral view of a Gasterosteus aculeatus specimen with the plate of interest outlined. The plate was sampled through the anterior margin toward the posterior, taking nine measurements across the plate at seven intervals from dorsal to ventral, as shown in (b). This specimen is a member of the Bargain Bay Lagoon population.

Statistical analysis of bone mineral density

Analysis of covariance (ANCOVA) was used to test for the presence of significant differences in mean BMD among all four habitats, with fish size (represented by the natural log of standard length) as a covariate. Significant differences in BMD were identified using Tukey post hoc testing, and a Bonferroni adjustment for multiple comparisons was applied where appropriate. Multiple analysis of covariance (MANCOVA) was used to identify differences within each plate interval, again with fish size (represented by the natural log of standard length) as a covariate, and followed by ANCOVA within each interval to identify differences among habitats. Finally, analysis of variance (ANOVA) was used to test for the presence of significant differences in mean BMD among plate intervals. All statistical analyses of bone mineral density were conducted using R version 3.4.2 (R Core Team 2017).

Geometric morphometric analysis of armour shape and size

Isosurfaces were created using Amira version 5.4 (FEI Imaging, Thermo Fisher Scientific, Waltham, Massachusetts) from the reconstructed μCT data. Twenty bilateral landmarks were collected in Amira from each individual to represent the shape of the armour apparatus in 3D coordinate space (Fig. 2, Table 1). Landmarks were Procrustes-transformed to remove variance related to translation, rotation, and scale (Dryden and Mardia 1998). Procrustes ANOVA was used to test for the presence of significant effects of size and habitat on armour shape, with effect sizes for these analyses reported as Z-scores (Collyer et al. 2015). All significance testing was conducted using 1000-round permutation tests. All morphometric analyses were conducted using R version 3.4.2 (R Core Team 2017) and the geomorph package version 3.05 (Adams and Otárola-Castillo 2013).
Fig. 2.
Fig. 2. Landmarks collected for this study. A total of 20 bilateral landmarks were collected from each specimen. (a) left lateral view; (b) ventral view. Some landmarks are visible in both orientations. This specimen is a member of the Bargain Bay Lagoon population.
Table 1.
Table 1. Geometric morphometric landmarks collected for this study.
Landmark No.Landmark name
1Anterior tip of ectocoracoid
2Posterior tip of ectocoracoid
3Anterior tip of pelvic plate
4Anterior midline of pelvic plate at suture
5Minimum of pelvic plate at trochlear joint
6Maximum of pelvic process
7Posterior tip of pelvic process
8Anterior minimum of ascending branch of pelvic girdle
9Anterodorsal maximum of ascending branch of pelvic girdle
10Posterodorsal maximum of ascending branch of pelvic girdle
11Posteroventral maximum of ascending branch of pelvic girdle at trochlear joint
12Dorsal-most tip of pelvic spine
13Ventral-most tip of pelvic spine
14Posterior tip of pelvic spine
15Midline of plate 4 at lateral pore
16Ventral tip of plate 4
17Midline of plate 5 at lateral pore
18Ventral tip of plate 5
19Midline of plate 6 at lateral pore
20Midline of plate 7 at lateral pore

Results

Plate counts and morphology

All individuals from the marine BBL, BBN, and HBL habitats were completely plated, with the exception of one individual from BBL, whereas the LYC habitat contained all three plate phenotypes (Fig. 3). The “partial” individual from the BBL locality was found to have 32 plates on the right side, but only 27 on the left, giving an average of 29.5 plates. Other fish with left–right variation varied by only one or two plates. Only three individuals in the LYC habitat were found to be completely plated.
Fig. 3.
Fig. 3. Plate counts for Gasterosteus aculeatus from four localities in Madeira Park, British Columbia. Plates were counted under a dissecting microscope, following Alizarin red staining. Reported counts represent an average of left and right sides. BBL, Bargain Bay Lagoon; BBN, Bargain Bay Narrows; HBL, Hospital Bay Lagoon; LYC, Lily Creek.

Bone mineral density

Fish from two of the three marine habitats were found to have significantly greater mean plate BMD than fish from the LYC habitat (BBL-LYC and BBN-LYC p < 0.01), and fish from the three marine habitats did not vary significantly in mean plate BMD among themselves (p > 0.05 for all comparisons). Although size was a significant source of variance, there was no interaction between size and BMD across the plate and therefore an interaction term was not included in the final model (Tables 2 and 3).
Table 2.
Table 2. Comparison of mean bone mineral density among habitats for the entire plate using analysis of covariance (ANCOVA).
 DfSSMSFp
SL1228786228786112.7882e-16
BMD353440178138.8723.34e-5
Residuals961947312028

Note: BMD, bone mineral density; Df, degrees of freedom; F, F-value; MS, mean square; p, p-value; SL, natural log of standard length; SS, sum of squares.

Table 3.
Table 3. Results of the Tukey post hoc testing for significant differences in the adjusted mean bone mineral density among habitats for the entire plate.
Comparisonp
BBN–BBL0.999
HBL–BBL0.347
BBN–HBL0.333
BBL–LYC0.003
BBN–LYC0.003
HBL–LYC0.261

Note: BBL, Bargain Bay Lagoon; BBN, Bargain Bay Narrows; HBL, Hospital Bay Lagoon; LYC, Lily Creek; p, p-value.

BMD varied across the plate, with the densest region located in the middle of the plate, represented by interval 4, which was significantly denser than both the superior and inferior regions of the plate (Fig. 4). BMD was relatively reduced following a similar pattern on either side of interval 4 in all four habitats, such that intervals 1 and 7, 2 and 6, and 3 and 5 were similar to each other and density tapered toward the superior and inferior aspects of the plate.
Fig. 4.
Fig. 4. Mean bone mineral density across seven plate intervals for Gasterosteus aculeatus from four localities in Madeira Park, British Columbia. Bone mineral density (BMD) is represented by hydroxyapatite content (see text for details). Legend values are population mean BMD values (mg HA/cm3). Mean plate interval values (mg HA/cm3) are as follows: plate interval 1: 479.473; plate interval 2: 554.297; plate interval 3: 599.005; plate interval 4: 694.072; plate interval 5: 579.730; plate interval 6: 529.343; plate interval 7: 452.946. BBL, Bargain Bay Lagoon; BBN, Bargain Bay Narrows; HBL, Hospital Bay Lagoon; LYC, Lily Creek. Error bars indicate standard deviation. Shared letters along the x-axis indicated a significant comparison using ANCOVA with standard length as a covariate (Bonferroni adjusted, α = 0.05).
MANCOVA indicated significant differences in all seven intervals between the grouped marine and freshwater habitats (p < 0.05; Table 4). Detailed hypothesis testing using ANCOVA for each plate interval revealed significant differences among LYC fish and those from at least one marine habitat for all but the first and fourth intervals, and significantly lower BMD than all fish from all three marine habitats in the third interval (p < 0.05). Once again, although size was a significant source of variance, there was no interaction between size and BMD within plate intervals, and therefore interaction terms were not included in these models.
Table 4.
Table 4. Summary of the comparison of bone mineral density among habitats for each plate interval using multiple analysis of covariance (MANCOVA).
 DfPillaiFnDfdDfp
SL10.5616216.47147908.478e-14
BMD30.491692.5763212762.586e-4
Residuals96

Note: BMD, bone mineral density; Df, degrees of freedom; dDf, denominator degrees of freedom; F, F-value; nDf, numerator degrees of freedom; p, p-value; SL, natural log of standard length.

Armour shape and size

Procrustes ANOVA revealed that size (as represented by standard length) had a significant effect on armour shape, and that in the case of armour shape there was an interaction between size and habitat. We, therefore, included an interaction term in the final model for armour shape, and found a significant effect of habitat on armour shape after controlling for size (Table 5). Principal component analysis of an “allometry-free” data set consisting of regression residuals added back to the mean landmark configuration for each group revealed that shape differences between armour configurations differentiate fish from the LYC habitat from fish captured in the marine habitats (Fig. 5). Fish from the LYC habitat clustered toward the negative end of both PC1 and PC2 axes. This region of morphospace represents a broader armour configuration and reduction of the distance between the ascending branch of the pelvic girdle and the point of articulation of the plate with the vertebral column, and also includes a shortening of the distance between the anterior portion of the pectoral girdle and the tips of the pelvic spines. LYC fish are also more variable than those from the marine habitats, occupying a larger region of morphospace than the marine specimens.
Table 5.
Table 5. Comparison of armour shape among habitats using Procrustes analysis of variance (ANOVA).
 DfSSMSFZp
SL10.033790.033795.61234.55120.001
Habitat30.085620.0285404.74036.60880.001
SL: habitat30.025470.0084901.41012.14290.024
Residuals930.559920.006021

Note: BBL, Bargain Bay Lagoon; BBN, Bargain Bay Narrows; BMD, bone mineral density; Df, degrees of freedom; F, F-value; HBL, Hospital Bay Lagoon; LYC, Lily Creek; MS, mean square; p, p-value; SL, natural log of standard length; SS, sum of squares; Z, effect size.

Fig. 5.
Fig. 5. Principal component analysis of Procrustes-transformed, allometry-adjusted landmark data. Insets present configurations in the region of morphospace represented by the negative ends of PC1 and PC2. Grey configurations represent the mean configuration, whereas black configurations represent the negative end of the PC axis. BBL, Bargain Bay Lagoon; BBN, Bargain Bay Narrows; HBL, Hospital Bay Lagoon; LYC, Lily Creek; PC, principal component.

Discussion

Our results demonstrate that lateral plate phenotypes in threespine stickleback are a complex trait. We used a quantitative approach to describe changes in armour phenotype that occur as threespine stickleback invade a freshwater habitat from their ancestral marine environment. To our knowledge, this is the first time a conserved bone mineral density profile along plates has been documented, as well as variation in density among habitats. We identify a relationship between size and density, as well as relationships among armour size, shape, and habitat.

Plate number is reduced overall, but becomes more variable under the influence of fresh water

We used traditional staining methods to confirm that in the system described here, as in most other marine–freshwater stickleback systems, stickleback inhabiting a tidally influenced habitat display a notable reduction in armour plate number (Fig. 3). It is interesting to note that in the tidally influenced habitat considered here, we found both a group of low-plated individuals (n = 13) and a group of partially-plated individuals (n = 11) with at least 10, but fewer than 30, plates. Although we do not have genetic information for these habitats, and it is certainly possible that gene flow is influencing our results, these data indicate that the “low-plated” allele is not fixed in LYC. We also note that we observed a reduction in plate size dorsoventrally among fish from the LYC habitat, which is consistent with previous work (Leinonen et al. 2012; Wiig et al. 2016) and lends support to the paedomorphosis hypothesis proposed as a mechanism for plate reduction (Bell 1981), whereby slowing of the developmental program for plates produces smaller plates in adult fish. It is possible that the production of this phenotype is mediated by cis-regulation of GDF6 (Indjeian et al. 2016), and further work is required to elucidate the gene regulatory networks that may underlie this observation. Alternatively, it is also possible that the results we observe are due to a plastic response to salinity in these habitats. Thus, further study using a common garden framework will help to clarify the relative roles of plasticity and selection in this system.

Bone mineral density is reduced in fresh water, but plate density profile is maintained

Measurement of hydroxyapatite content across the entire plate revealed both a significant effect of size on bone mineral density as well as a conserved plate bone density profile independent of fish size (Fig. 4). This profile describes a structure that is densest near the dorsoventral midpoint of the plate (interval 4) and tapers to its lowest densities at its dorsal and ventral extremes (intervals 1 and 7). This profile was recovered in fish from all four habitats, and although the relative density of the plate in LYC individuals was significantly lower at every measurement interval except the first and fourth, the shape of the profile remained unchanged, with the densest point identified at interval 4 and tapering to the least dense at intervals 1 and 7. This result suggests that although these animals’ skeletons show changes in response to novel selective pressures in their new habitat, the functional complex to which the armour plates belong may be maintained.
Plate interval 4 corresponds to the point at which the plate articulates with the vertebral column via the epiplural rib as well as with the preceding and following plate, and the plate measured in this study (plate 5) also articulates with the anterior edge of the pelvic girdle (Fig. 1). Armour plates both alone and in association with spines clearly have a protective function (Reimchen 1992; Reimchen 1994; Reimchen 2000). Although fish occupying fresh water reduce both the number and density of their plates, those that retain some plates, such as the fish described here, always retain the anterior plate complement, as has been documented elsewhere (Reimchen 1983). This retention is due, at least in part, to the role of the anterior plates in supporting the spines (Reimchen 1983), but other possible biomechanical functions for plates are less well understood. Swimming performance and plate number have been shown to be negatively correlated (Bergstrom 2002), but the biomechanical interactions between plates and the axial skeleton remain undocumented. Our results indicate the conservation of a mineralization profile that we hypothesize may be responsible for maintenance of structural integrity in the face of reduction of total plate number. Once again, further work is required to elucidate the functional role(s) of lateral plates and the ways in which these might be altered in changing environments. It is important to note that plate ossification begins from the neuromast at the center of the plate and moves toward the dorsal and ventral edges (e.g., Igarashi 1964; Igarashi 1970; Pistore 2018); an alternative hypothesis would be that the pattern observed merely reflects that plates are developmentally “older” in their central regions and have had longer to accumulate bone. Rejection of the latter hypothesis would require comparison of bone mineral density in a sample of adult stickleback of known age to determine if the pattern observed here is lost in older specimens. A balance between bone deposition and removal maintains skeletal form throughout life, and the fact that we obtain a similar plate density pattern across three representative marine habitats in a sample containing adult fish is an argument against this pattern being a feature restricted to younger specimens. Once again, further work is required to test this hypothesis explicitly. In addition, our study included only three fully plated LYC individuals, which precluded direct comparison between these and their fully plated marine counterparts. Important future work will involve comparisons of bone mineral density among different LYC plate morphs as well as between fully plated morphs of LYC and marine individuals.

Armour complex shape is influenced by both size and habitat

We found that allometric size is a major determinant of shape differences among armour phenotypes. There remains a significant effect of habitat on shape after controlling for allometry (Fig. 5), which is consistent with previous work documenting substantial differences in cranial shape among occupants of these habitats (Jamniczky et al. 2015a, 2015b). Fish from the LYC habitat occupy a larger portion of morphospace indicating greater variability in phenotype, but generally display a more compact armour configuration that is both dorsoventrally and anteroposteriorly reduced but does not include any apparently major, possibly functionally important, configuration changes. This is again consistent with both our bone mineral density findings and with previous work indicating an overall reduction in the elaboration of the skeleton in fresh water habitats (Leinonen et al. 2012; Wiig et al. 2016), likely by paedomorphosis (Bell 1981). Future studies should focus on the functional role(s) of lateral plates as they relate to trophic morphology and swimming performance, as well as previously documented defensive functions, to better elucidate the nature of the possible functional constraints hinted at in our results. Further, it is likely that sexual dimorphism is influencing our results to some extent, given that dimorphism has been found in other studies of plate phenotype (e.g., Moodie and Reimchen 1976; Reimchen et al. 2016), as well as in many other stickleback traits (e.g., Kitano et al. 2007; Aguirre et al. 2008; Spoljaric and Reimchen 2008; Aguirre and Akinpelu 2010; Leinonen et al. 2011; McGee and Wainwright 2013; Reimchen et al. 2016), but sex data are unfortunately not available for this data set. Further work should certainly test specific hypotheses about the relationship of sex to plate phenotype in G. aculeatus.

Conclusions and future directions

The importance of the quantitative characterization of complex phenotypes in an evolutionary context is becoming increasingly clear. The presence of a conserved density profile along the dorsoventral length of the stickleback lateral plate that remains conserved despite reductions in overall density and plate number under the influence of fresh water suggests that selection is acting on more than plate number alone. In addition, our evidence for the conservation of the armour complex structure, namely the relationship between the lateral plates and girdles, across populations suggests that these additional phenotypes have functional significance and vary in association with habitat.
It is possible that there exist functional constraints that influence the ways in which plates can be reduced in freshwater environments (Reimchen 1983) despite strong selection for such reduction. Better conceptualization of such constraints requires additional investigation of the different possible functional roles of lateral plates, as well as a more detailed parsing of the environmental, ecological, and developmental effects that may be driving changes in plate phenotype. Future work should also focus on understanding the regulatory mechanisms that control plate development to better understand the interplay between genes, function, and ecology in the stickleback system.

Acknowledgements

The authors wish to thank A. Pistore, S. Vanderzwan, E. Bowles, and M. Morris for technical assistance and helping to improve early drafts. The constructive comments of five anonymous reviewers are also much appreciated. This research was supported in part by Natural Sciences and Engineering Research Council of Canada grants to HAJ and SMR. The Bamfield Marine Sciences Centre provided key support in the execution of this research.

References

Adams DC, and Otárola-Castillo E. 2013. geomorph: an R package for the collection and analysis of geometric morphometric shape data. Methods in Ecology and Evolution, 4(4): 393–399.
Aguirre WE, and Akinpelu O. 2010. Sexual dimorphism of head morphology in three-spined stickleback Gasterosteus aculeatus. Journal of Fish Biology, 77(4): 802–821.
Aguirre WE, Doherty PK, and Bell MA. 2004. Genetics of lateral plate and gillraker phenotypes in a rapidly evolving population of threespine stickleback. Behaviour, 141(11/12): 1465–1483.
Aguirre WE, Ellis KE, Kusenda M, and Bell MA. 2008. Phenotypic variation and sexual dimorphism in anadromous threespine stickleback: implications for postglacial adaptive radiation. Biological Journal of the Linnaean Society, 95(3): 465–478.
Barrett RDH, Rogers SM, and Schluter D. 2008. Natural selection on a major armor gene in threespine stickleback. Science, 322(5899): 255–257.
Baumgartner JV, and Bell MA. 1984. Lateral plate morph variation in California populations of the threespine stickleback, Gasterosteus aculeatus. Evolution, 38(3): 665–674.
Bell MA. 1979. Low-plate morph of the threespine stickleback breeding in salt water. Copeia, 1979(3): 529–533.
Bell MA. 1981. Lateral plate polymorphism and ontogeny of the complete plate morph of threespine sticklebacks (Gasterosteus aculeatus). Evolution, 35(1): 67–74.
Bell MA, and Foster SA. 1994. The evolutionary biology of the threespine stickleback. Oxford University Press, New York City, New York. 584 p.
Bergstrom CA. 2002. Fast-start swimming performance and reduction in lateral plate number in threespine stickleback. Canadian Journal of Zoology, 80(2): 207–213.
Bouxsein ML, Boyd SK, Christiansen BA, Guldberg RE, Jepsen KJ, and Müller R. 2010. Guidelines for assessment of bone microstructure in rodents using micro-computed tomography. Journal of Bone and Mineral Research, 25: 1468–1486.
Collyer ML, Sekora DJ, and Adams DC. 2015. A method for analysis of phenotypic change for phenotypes described by high-dimensional data. Heredity, 115: 357–365.
Colosimo PF, Peichel CL, Nereng K, Blackman BK, Shapiro MD, Schluter D, et al. 2004. The genetic architecture of parallel armor plate reduction in threespine sticklebacks. PLoS Biology, 2(5): E109.
Colosimo PF, Hosemann KE, Balabhadra S, Villareal G Jr, Dickson M, Grimwood J, et al. 2005. Widespread parallel evolution in sticklebacks by repeated fixation of ectodysplasin alleles. Science, 307(5717): 1928–1933.
Cresko WA, Amores A, Wilson C, Murphy J, Currey M, Phillips P, et al. 2004. Parallel genetic basis for repeated evolution of armor loss in Alaskan threespine stickleback populations. Proceedings of the National Academy of Sciences USA, 101(16): 6050–6055.
DeFaveri J, and Merilä J. 2013. Evidence for adaptive phenotypic differentiation in Baltic Sea sticklebacks. Journal of Evolutionary Biology, 26(8): 1700–1715.
DeFaveri J, Jonsson PR, and Merilä J. 2013. Heterogeneous genomic differentiation in marine threespine sticklebacks: adaptation along an environmental gradient. Evolution, 67(9): 2530–2546.
Dryden IL, and Mardia KV. 1998. Statistical shape analysis. John Wiley & Sons, New York City, New York. 376 p.
Giles N. 1983. The possible role of environmental calcum levels during the evolution of phenotypic diversity in Outer Hebridean populations of the Three-spined stickleback, Gasterosteus aculeatus. Journal of Zoology, 199(4): 535–544.
Gross HP. 1977. Adaptive trends of environmentally sensitive traits in the three-spined stickleback, Gasterosteus aculeatus L. Journal of Zoological Systematics and Evolutionary Research, 15: 252–278.
Grush J, Noakes DLG, and Moccia RD. 2004. The efficacy of clove oil as an anesthetic for the Zebrafish, Danio rerio (Hamilton). Zebrafish, 1(1): 46–53.
Hagen DW, and Gilbertson LG. 1972. Geographic variation and environmental selection in Gasterosteus aculeatus L. in the Pacific Northwest, America. Evolution, 26(1): 32–51.
Hagen DW, and Gilbertson LG. 1973. The genetics of plate morphs in freshwater threespine sticklebacks. Heredity, 31(1): 75–84.
Hansson TH, Fischer B, Mazzarella AB, Voje KL, and Vøllestad LA. 2016. Lateral plate number in low-plated threespine stickleback: a study of plasticity and heritability. Ecology and Evolution, 6(10): 3154–3160.
Hermida M, Fernández C, Amaro R, and Miguel ES. 2002. Heritability and “evolvability” of meristic characters in a natural population of Gasterosteus aculeatus. Canadian Journal of Zoology, 80(3): 532–541.
Higham TE, Rogers SM, Langerhans RB, Jamniczky HA, Lauder GV, Stewart WJ, et al. 2016. Speciation through the lens of biomechanics: locomotion, prey capture and reproductive isolation. Proceedings of the Royal Society B: Biological Sciences, 283(1838): 20161294.
Hohenlohe PA, Bassham S, Etter PD, Stiffler N, Johnson EA, and Cresko WA. 2010. Population genomics of parallel adaptation in threespine stickleback using sequenced RAD tags. PLoS Genetics, 6(2): e1000862.
Huntingford F. 1981. Further evidence for an association between lateral scute number and aggressiveness in the Threespine Stickleback, Gasterosteus aculeatus. Copeia, 1981(3): 717–720.
Igarashi K. 1964. Observation on the development of the scutes in land-locked form of threespine stickleback, Gasterosteus aculeatus aculeatus Linnaeus. Bulletin of the Japanese Society for the Science of Fish, 30: 95–103.
Igarashi K. 1970. Formation of the scutes in the marine form of the threespined stickleback, Gasterosteus aculeatus aculeatus (L.). Annotations Zoologicae Japonensis, 43: 34–42.
Indjeian VB, Kingman GA, Jones FC, Guenther CA, Grimwood J, Schmutz J, et al. 2016. Evolving new skeletal traits by cis-regulatory changes in bone morphogenetic proteins. Cell, 164(1–2): 45–56.
Jamniczky HA, Barry TN, and Rogers SM. 2015a. Eco-evo-devo in the study of adaptive divergence: examples from threespine stickleback (Gasterosteus aculeatus). Integrative & Comparative Biology, 55(1): 166–178.
Jamniczky HA, Campeau S, Barry TN, Skelton J, and Rogers SM. 2015b. Three-dimensional morphometrics for quantitative trait locus analysis: tackling complex questions with complex phenotypes. Evolutionary Biology, 42(3): 260–271.
Kitano J, Mori S, and Peichel CL. 2007. Sexual dimorphism in the external morphology of the threespine stickleback (Gasterosteus aculeatus). Copeia, 2007(2): 336–349.
Kitano J, Bolnick DI, Beauchamp DA, Mazur MM, Mori S, Nakano T, et al. 2008. Reverse evolution of armor plates in the threespine stickleback. Current Biology, 18(10): 769–774.
Kynard BE. 1979. Nest habitat preference of low plate number morphs in threespine sticklebacks (Gasterosteus aculeatus). Copeia, 1979(3): 525–528.
Lees J, Märss T, Wilson MVH, Saat T, and Špilev H. 2012. The sculpture and morphology of postcranial dermal armor plates and associated bones in gasterosteiforms and syngnathiforms inhabiting Estonian coastal waters. Acta Zoologica, 93(4): 422–435.
Leinonen T, Cano JM, and Merilä J. 2011. Genetic basis of sexual dimorphism in the threespine stickleback Gasterosteus aculeatus. Heredity, 106(2): 218–227.
Leinonen T, McCairns RJS, Herczeg G, and Merilä J. 2012. Multiple evolutionary pathways to decreased lateral plate coverage in freshwater threespine sticklebacks. Evolution, 66(12): 3866–3875.
Mallarino R, Grant PR, Grant BR, Herrel A, Kuo WP, and Abzhanov A. 2011. Two developmental modules establish 3D beak-shape variation in Darwin’s finches. Proceedings of the National Academy of Sciences, 108(10): 4057–4062.
Marchinko KB, and Schluter D. 2007. Parallel evolution by correlated response: lateral plate reduction in threespine stickleback. Evolution, 61(5): 1084–1090.
McGee MD, and Wainwright PC. 2013. Sexual dimorphism in the feeding mechanism of threespine stickleback. Journal of Experimental Biology, 216(5): 835–840.
Miller RR, and Hubbs CL. 1969. Systematics of Gasterosteus aculeatus, with particular reference to intergradation and introgression along the Pacific Coast of North America: a commentary on a recent contribution. Copeia, 1969(1): 52–69.
Moodie GEE, and Reimchen TE. 1976. Phenetic variation and habitat differences in Gasterosteus populations of the Queen Charlotte Islands. Systematic Zoology, 25(1): 49–61.
Myhre F, and Klepaker T. 2009. Body armour and lateral-plate reduction in freshwater three-spined stickleback Gasterosteus aculeatus: adaptations to a different buoyancy regime? Journal of Fish Biology, 75(8): 2062–2074.
Pistore AE. 2018. Ontogeny of population-specific phenotypic variation in the threespine stickleback. M.Sc. thesis, University of Calgary, Calgary, Alberta. 128 p.
R Core Team. 2017. R: a language and environment for statistical computing. R Foundation for Statistical Computing, Vienna, Austria.
Raeymaekers JA, Konijnendijk N, Larmuseau MH, Hellemans B, De Meester L, and Volckaert FA. 2014. A gene with major phenotypic effects as a target for selection vs. homogenizing gene flow. Molecular Ecology, 23(1): 162–181.
Reimchen TE. 1983. Structural relationships between spines and lateral plates in threespine stickleback (Gasterosteus aculeatus). Evolution, 37(5): 931–946.
Reimchen TE. 1992. Injuries on stickleback from attacks by a toothed predator (Oncorhyncus) and implications for the evolution of lateral plates. Evolution, 46(4): 1224–1230.
Reimchen TE. 1994. Predators and morphological evolution in threespine stickleback. In The evolutionary biology of the threespine stickleback. Edited by MA Bell and SA Foster. Oxford University Press, New York City, New York. pp. 240–276.
Reimchen TE. 2000. Predator handling failures of lateral plate morphs in Gasterosteus aculeatus: functional implications for the ancestral plate condition. Behaviour, 137(7/8): 1081–1096.
Reimchen TE, Steeves D, and Bergstrom CA. 2016. Sex matters for defense and trophic traits of threespine stickleback. Evolutionary Ecology Research, 17: 459–485.
Rennison DJ, Heilbron K, Barrett RD, and Schluter D. 2015. Discriminating selection on lateral plate phenotype and its underlying gene, Ectodysplasin, in threespine stickleback. The American Naturalist, 185: 150–156.
Sire JY, Donoghue PCJ, and Vickaryous MK. 2009. Origin and evolution of the integumentary skeleton in non-tetrapod vertebrates. Journal of Anatomy, 214(4): 409–440.
Smith C, Spence R, Barber I, Przybylski M, and Wootton RJ. 2014. The role of calcium and predation on plate morph evolution in the three-spined stickleback (Gasterosteus aculeatus). Ecology and Evolution, 4(18): 3550–3554.
Song J, Reichert S, Kallai I, Gazit D, Wund M, Boyce MC, et al. 2010. Quantitative microstructural studies of the armor of the marine threespine stickleback (Gasterosteus aculeatus). Journal of Structural Biology, 171(3): 318–331.
Spoljaric MA, and Reimchen TE. 2008. Habitat-dependent reduction of sexual dimorphism in geometric body shape of Haida Gwaii threespine stickleback. Biological Journal of the Linnean Society, 95: 505–516.
Taylor EB, and McPhail JD. 1986. Prolonged and burst swimming in anadromous and freshwater threespine stickleback, Gasterosteus aculeatus. Canadian Journal of Zoology, 64: 416–420.
Taylor EB, and McPhail JD. 1999. Evolutionary history of an adaptive radiation in species pairs of threespine sticklebacks (Gasterosteus): insights from mitochondrial DNA. Biological Journal of the Linnaean Society, 66: 271–291.
Travisano M, and Shaw RG. 2013. Lost in the map. Evolution, 67(2): 305–314.
Wiig E, Reseland JE, Ostbye K, Haugen HJ, and Vollestad LA. 2016. Variation in lateral plate quality in threespine stickleback from fresh, brackish and marine water: a micro-computed tomography study. PLoS ONE, 11(10): e0164578.
Withler RE, and McPhail JD. 1985. Genetic variability in freshwater and anadromous sticklebacks (Gasterosteus aculeatus) of southern British Columbia. Canadian Journal of Zoology, 63: 528–533.
Wootton RJ. 1984. A functional biology of sticklebacks. University of California Press, Berkeley, California. 265 p.
Ziuganov VV. 1983. Genetics of osteal plate polymorphism and microevolution of threespine stickleback (Gasterosteus aculeatus L.). Theoretical and Applied Genetics, 65: 239–246.

Information & Authors

Information

Published In

cover image FACETS
FACETS
Volume 3Number 1October 2018
Pages: 665 - 681
Editor: Steven J. Cooke

History

Received: 10 November 2017
Accepted: 9 April 2018
Version of record online: 25 June 2018

Data Availability Statement

All relevant data are within the paper.

Key Words

  1. threespine stickleback
  2. plates
  3. plate count
  4. bone mineral density
  5. phenotypic variation
  6. geometric morphometrics

Sections

Subjects

Authors

Affiliations

Heather A. Jamniczky [email protected]
Department of Cell Biology & Anatomy, Cumming School of Medicine, University of Calgary, 3330 Hospital Drive NW, Calgary, AB T2N 4Z6, Canada
Amie Le
Department of Cell Biology & Anatomy, Cumming School of Medicine, University of Calgary, 3330 Hospital Drive NW, Calgary, AB T2N 4Z6, Canada
Tegan N. Barry
Department of Biological Sciences, University of Calgary, 2500 University Drive NW, Calgary, AB T2N 1N4, Canada
Sean M. Rogers
Department of Biological Sciences, University of Calgary, 2500 University Drive NW, Calgary, AB T2N 1N4, Canada

Author Contributions

HAJ, TNB, and SMR conceived and designed the study.
AL and TNB performed the experiments/collected the data.
All analyzed and interpreted the data.
HAJ and SMR contributed resources.
All drafted or revised the manuscript.

Competing Interests

HAJ is currently serving as a Subject Editor for FACETS, but was not involved in review or editorial decisions regarding this manuscript.

Metrics & Citations

Metrics

Other Metrics

Citations

Cite As

Export Citations

If you have the appropriate software installed, you can download article citation data to the citation manager of your choice. Simply select your manager software from the list below and click Download.

Cited by

1. Freshwater Colonization, Adaptation, and Genomic Divergence in Threespine Stickleback
2. Evolution of static allometry and constraint on evolutionary allometry in a fossil stickleback

View Options

View options

PDF

View PDF

Get Access

Media

Media

Other

Tables

Share Options

Share

Share the article link

Share on social media