Muted responses to Ag accumulation by plankton to chronic and pulse exposure to silver nanoparticles in a boreal lake
Abstract
Silver nanoparticles (AgNPs) are an emerging class of contaminants with the potential to impact ecosystem structure and function. AgNPs are antimicrobial, suggesting that microbe-driven ecosystem functions may be particularly vulnerable to AgNP exposure. Predicting the environmental impacts of AgNPs requires in situ investigation of environmentally relevant dosing regimens over time scales that allow for ecosystem-level responses. We used 3000 L enclosures installed in a boreal lake to expose plankton communities to chronic and pulse AgNP dosing regimens with concentrations mimicking those recorded in natural waters. We compared temporal patterns of plankton responses, Ag accumulation, and ecosystem metabolism (i.e., daily ecosystem respiration, gross primary production, and net ecosystem production) for 6 weeks of chronic dosing and 3 weeks following a pulsed dose. Ag accumulated in microplankton and zooplankton, but carbon-specific Ag was nonlinear over time and generally did not predict plankton response. Ecosystem metabolism did not respond to either AgNP exposure type. This lack of response corresponded with weak microplankton responses in the chronic treatments but did not reflect the stronger microplankton response in the pulse treatment. Our results suggest that lake ecosystem metabolism is somewhat resistant to environmentally relevant concentrations of AgNPs and that organismal responses do not necessarily predict ecosystem-level responses.
Graphical Abstract
Introduction
Silver nanoparticles (AgNPs) are used in many industries because of their antimicrobial properties (Vance et al. 2015). As AgNP use increases, so do the risks associated with environmental exposure. Bacteria (Li et al. 2010; Yuan et al. 2013), algae (Griffitt et al. 2008; Navarro et al. 2008), and invertebrates (Griffitt et al. 2008; Blinova et al. 2013) have shown acute sensitivity to AgNP exposure at μg/L concentrations. Release of ionic silver (Ag+) (Navarro et al. 2008; Kennedy et al. 2010) and interactions between nanoparticles and surficial and internal cell structures (Morones et al. 2005; Fabrega et al. 2009) contribute to AgNP toxicity, whereas nanoparticle size, surface area, and coating all influence toxicity intensity (Kennedy et al. 2015). Classic toxicology assays are useful for establishing the relative toxicity of AgNPs, but they typically use simplified conditions and toxin concentrations exceeding estimated natural exposure levels (low μg/L; Maurer-Jones et al. 2013; Lead et al. 2018) and may therefore have limited relevance to natural ecosystems (Rosi-Marshall and Royer 2012).
Investigations of the responses of biotic communities to AgNPs under natural conditions have found that physicochemical conditions such as pH (Fabrega et al. 2009), ionic strength (Gao et al. 2009), nutrient availability (Das et al. 2014; Norman et al. 2015), and dissolved organic matter (DOM; Fabrega et al. 2009; Bone et al. 2012; Kennedy et al. 2012; Unrine et al. 2012; Quigg et al. 2013) affect AgNP bioavailability and toxicity. AgNP exposure can affect microbe abundance (Colman et al. 2014), production (Das et al. 2012a), photosynthetic activity (Gil-Allue et al. 2015), exoenzyme activity (Colman et al. 2012; Das et al. 2012a), and stoichiometry (Das et al. 2014). However, these studies were typically of short duration (but see Lowry et al. 2012; Colman et al. 2013, 2014). Given their antimicrobial properties, AgNPs are expected to primarily affect microbial communities in natural environments. The way microbial communities respond to AgNPs will likely have important implications for the many ecosystem functions driven by microbial activity. AgNPs have been shown to alter microbial processes that contribute to elemental fluxes at the ecosystem scale, including activity of enzymes associated with carbon, nitrogen, and sulfur cycling; microbial respiration; and organic matter decomposition (Tlili et al. 2017; Vasileiadis et al. 2018).
Microbial communities respond to perturbations through many mechanisms (reviewed by Shade et al. 2012) including physiological plasticity (Evans and Hofmann 2012), shifts in taxonomic composition (Allison and Martiny 2008), and avoidance behaviour such as dormancy (Lennon and Jones 2011). These mechanisms contribute to community resistance and resilience, defined in a toxicological context by Clements and Rohr (2009) as a community’s capacity to preserve or restore structure and function when exposed to contaminants, respectively. The effectiveness of these mechanisms depends on the type of disturbance, i.e., short-term, high-intensity pulse disturbance or long-term, continuous press disturbance (Shade et al. 2012). Both press and pulse AgNP exposure scenarios are likely via wastewater discharge and industrial spills, respectively (Blaser et al. 2008; Bernhardt et al. 2010). Still, there remains a dearth of investigations of microbial responses to chronic AgNP exposure (Lead et al. 2018).
Freshwater ecosystems are a primary area of concern for AgNP exposure (Bernhardt et al. 2010). Microbial community responses to AgNPs may influence the magnitude and distribution of Ag accumulation within these communities and thus within food webs. Community responses that alter cell abundance, size, and exudate production will likely affect Ag accumulation by the community because AgNPs interact with cell surfaces and exudates (Miao et al. 2009; Stevenson et al. 2013; Leclerc and Wilkinson 2014). Microbial community responses to AgNPs may also have implications for Ag trophic transfer because diet is an important AgNP exposure pathway for zooplankton (McTeer et al. 2014).
Our primary goals were to compare the temporal patterns of the response of a boreal lake grazing-based food web (microbes, phytoplankton, and zooplankton) to trophic Ag accumulation following chronic or pulse AgNP exposure and to assess the corresponding response of plankton-driven ecosystem metabolism over time scales capturing plankton food web dynamics. These goals were part of a larger experiment investigating the response of plankton biomass, diversity, and production to AgNP exposure and the behaviour of AgNPs in natural waters, the results of which are published elsewhere (Furtado et al. 2014, 2015; Blakelock et al. 2016; Vincent et al. 2017). We predicted that (i) Ag accumulation would predict biotic responses and (ii) ecosystem function would reflect these responses and be maintained or recover quickly when exposed to chronic AgNP addition but be impaired after exposure to a pulse of AgNPs.
Materials and methods
Experimental design
We installed 12 mesocosms in Lake 239 (L239) at the IISD Experimental Lakes Area in northwestern Ontario, Canada, on 18 June 2012. As described by Furtado et al. (2015), mesocosms were cylindrical enclosures approximately 2 m in diameter, 1.6–1.7 m in depth, and open to the sediments (Curry Industries, Winnipeg, Manitoba, Canada). Mesocosms were seeded with zooplankton (≥80 μm, 311 individuals/L) collected from L239 from a depth of 20 m to the surface using vertical net hauls.
We used 1.0 mg/mL stock solutions of 50 nm spherical polyvinylpyrollidone- (PVP) or citrate-coated AgNPs (NanoComposix, San Diego, California, USA) suspended in Milli-Q water (18.2 MΩ·cm) and 2 mmol citrate buffer, respectively. Ag concentrations in stock solutions were verified using inductively coupled plasma mass spectroscopy (ICP-MS) following acid (4% HNO3) digestion. Mean PVP- and citrate-coated particle diameter (determined by dynamic light scattering by the supplier) was 53.6 and 54.9 nm, respectively (Furtado et al. 2015). Further details were given by Furtado et al. (2014, 2015).
Starting on 23 June 2012, we added 0, 0.89, 3.56, and 14.24 mg of PVP-coated AgNPs every other day for 39 d to control, low, medium, and high chronic treatments, respectively, for a total of 0, 17.8, 71.2, and 284.8 mg AgNPs added to each treatment, respectively. Target final nominal concentrations (3000 L estimated mesocosm volume) in control, low, medium, and high chronic treatments were 0, 6, 24, and 95 μg PVP AgNP/L, respectively. The citrate treatment received citrate-coated AgNPs in the same dosing regimen as the high chronic treatment. Mesocosms were mixed after each AgNP addition with care taken not to disturb sediments.
On 11 July 2012, mesocosms assigned to the pulse treatment received a single dose of 240 mg of PVP-capped AgNPs to achieve a target nominal concentration of 80 μg AgNP/L. Treatments were replicated twice. Mesocosms were mixed after AgNP addition as described above.
The study reported here was part of a larger investigation of AgNP fate in natural waters and the effects of AgNP exposure on biotic communities. Detailed descriptions of collection and analysis of many of the variables we correlate to ecosystem metabolism have been published elsewhere (AgNP fate and behaviour: Furtado et al. 2014, 2015; bacterioplankton abundance, production, and stoichiometry: Blakelock et al. 2016; phytoplankton and zooplankton biomass and community structure: Vincent et al. 2017). We include brief descriptions of these methods below along with detailed descriptions of our calculations of ecosystem metabolism and Ag accumulation in the food web, which are not published elsewhere.
Field sampling
Plankton were sampled once prior to the initial AgNP addition and weekly thereafter. Mesocosms were gently mixed before sampling. Microplankton (phytoplankton and microbes) were collected from surface water after first being screened through a 35 μm mesh to remove large particles. Zooplankton were collected with a 10 L Schindler-Patalas trap (53 μm mesh, three deployments in each enclosure at 1 m depth).
Sample processing
Total Ag concentration (TAg) in screened water was quantified by ICP-MS after acidification (4% HNO3) and digestion at 70 °C for 6 h (Furtado et al. 2014, 2015).
We divided algae into large (0.7–35 μm) and small (0.7–1.2 μm) size fractions. For the large fraction, two subsamples of screened water were filtered onto ashed glass fiber filters (average pore size 0.7 μm). As described by Vincent et al. (2017), filters were dried at 60 °C and carbon (C) content was measured using a carbon nitrogen elemental analyzer. Two additional subsamples were filtered onto glass fiber filters, which were frozen and analyzed for chlorophyll a (chl) using a cold ethanol extraction (Sartory and Grobbelaar 1984) and quantification via fluorometry. A final subsample was filtered onto a 0.8 μm polycarbonate membrane, which was stored in 4% nitric acid and digested at 70 °C for 2 h. The digested solution was filtered (0.45 μm nylon filter) and analyzed for Ag using ICP-MS. C, chl, and Ag concentrations of the small fraction were quantified similarly using 1.2 μm prefiltered screened water (Blakelock et al. 2016).
Bacteria in samples of screened water were counted via flow cytometry after staining with SYBR Green I, and heterotroph production was quantified using 3H-labelled leucine incorporation assays (Blakelock et al. 2016). Cell-specific production (fg C/cell/d) was calculated as heterotroph production (fg C/L/d) divided by cell abundance (# cells/L).
Zooplankton sample processing and community responses were described by Vincent et al. (2017). Collected samples were split using a plankton wheel. Half of the sample was preserved in 2% sugar-buffered formalin and half was filtered through an 80 μm mesh, dried at 60 °C for 24 h, and acidified with 4% nitric acid for Ag analysis. Individuals in preserved zooplankton samples collected from control and high chronic treatments were identified to genus and species (when possible). Individual lengths were measured, and published length–weight regressions (Persson and Ekbohm 1980; Malley et al. 1989) were used to quantify total biomass in units of C, which was scaled to mesocosm volume. We assumed that zooplankton biomass was 45% C (Andersen and Hessen 1991). Zooplankton Ag was quantified from acidified samples as described for microplankton.
Ecosystem metabolism
Hourly, water from each mesocosm was sequentially pumped past probes that measured dissolved oxygen concentration (DO), temperature (Fast Response Oxygen Optode, #4330F, Aanderaa Instruments), and chlorophyll a fluorescence (Cyclops-7, Hoskins Scientific), and it was then recirculated back into each mesocosm. A data logger (Campbell Scientific, CR1000) controlled the pump and valve system and recorded the data. The pumping system had a small reservoir volume that resulted in carry-over between adjacent mesocosms. We estimate that <1% of total mesocosm volume was exchanged over the course of the experiment.
Daily ecosystem respiration (ER), gross primary production (GPP), and net ecosystem production (NEP) were calculated from diurnal changes in DO concentration corrected for reaeration (calculated using wind speed and barometric pressure from a nearby meteorological station) using the “book keeping” method reviewed by Staehr et al. (2010). All equations used below are adapted from those found in table 2 in Staehr et al. (2010).
DO concentrations are adjusted to account for physical exchange across the lake surface according to the following governing equation (Odum 1956):where F is atmospheric oxygen exchange, and A is a term including all other processes affecting DO (assumed to be negligible). Change in DO concentration over time was measured empirically by the optical probe. F was calculated by comparing DO concentration at saturation with the atmosphere (a function of temperature, salinity, and barometric pressure; detailed equations found in Staehr et al. 2010) to the measured value after accounting for wind speed measured at a nearby meteorological station.
This method assumes that photosynthesis is not occurring during darkness. Therefore, hourly ER rate (g O2 m−3 h−1) was calculated by correcting the mean change in DO concentration observed during darkness for F according to the following equation:where Z mix is the depth to which the water column feely mixes, assumed to be the entire mesocosm depth. This method also assumes that ER rate is constant over 24 h. Therefore, daily ER (g O2 m−3 d−1) was calculated by multiplying the ER rate by 24.
Both respiration and photosynthesis are occurring during daylight hours. Therefore, the change in DO concentration observed during daylight is the net result of these two processes. Hourly NEP rate (g O2 m−3 h−1) during daylight was calculated by correcting the mean change in DO concentration observed during daylight for F according to the following equation:
The amount of NEP during the daylight period (g O2 m−3 daylight period−1) was calculated by multiplying the hourly NEP rate during daylight by the number of daylight hours.
Daily GPP (g O2 m−3 d−1) was then calculated by subtracting the amount of ER during the daylight period (a negative O2 flux) from the amount of NEP during the daylight period according to this equation:where ERdaylight period is equal to ERhourly multiplied by the number of daylight hours.
Daily NEP (g O2 m−3 d−1) was then derived by the difference between daily GPP and daily ER.
Data analysis
We used logarithm response ratios (LRR) to evaluate community and ecosystem responses to AgNP exposure over time. LLR were calculated as the natural logarithm of the value of the response variable (e.g., chl/L) measured in a treatment mesocosm divided by the mean of the response variable from the two control mesocosms. Negative and positive LRR indicate suppressed and stimulated treatment responses, respectively, compared to the controls. LRR of ER, GPP, and NEP were calculated using weekly means of daily values. Mean LRR, or effect sizes, were compared to zero using single sample t tests. Carbon-specific Ag in each biotic compartment was calculated by dividing Ag concentration (Ag/L) by the carbon content (C/L). We used the Bonferroni-corrected α = 0.0002 to evaluate LRR statistical significance.
Results and discussion
Microplankton response during chronic exposure
Mesocosms assigned to control and chronic treatments had similar phytoplankton biomass (as estimated by chlorophyll a concentration) in both the large- and small-size fractions, bacterial abundance, bacterial production, and zooplankton abundance (Blakelock et al. 2016; Vincent et al. 2017) prior to the initial AgNP addition on 23 June 2012. Zooplankton communities contained Cyclopoida, Calanoida, and Cladocera in roughly equal proportions in terms of abundance (Vincent et al. 2017). Furtado et al. (2015) described an increase in TAg concentration in chronic treatments over 6 weeks to ∼25–35, 7, and 4 μg/L in high (and citrate), medium, and low treatments, respectively. Ag+ concentration was below detection throughout the experiment likely due to complexation with DOM (Furtado et al. 2015). Final TAg in the control and low treatments were similar, likely due to carry-over from the automated sampler.
Effect size temporal trends and their correlation with Ag/C differed between microbial autotrophs and heterotrophs in chronic treatments (Fig. 1). All microplankton responses were relatively weak in chronic treatments (Figs. 1a–1d). None of the effect sizes was significantly different from zero (following Bonferroni correction for multiple comparisons; Table S1). Autotroph biomass and heterotroph cell-specific production effect sizes broadly tracked Ag/C over time (Figs. 1a, 1b, 1d–1f). In contrast, heterotroph abundance effect size was most negative during peak Ag/C (Figs. 1c, 1e, 1f).
Fig. 1.
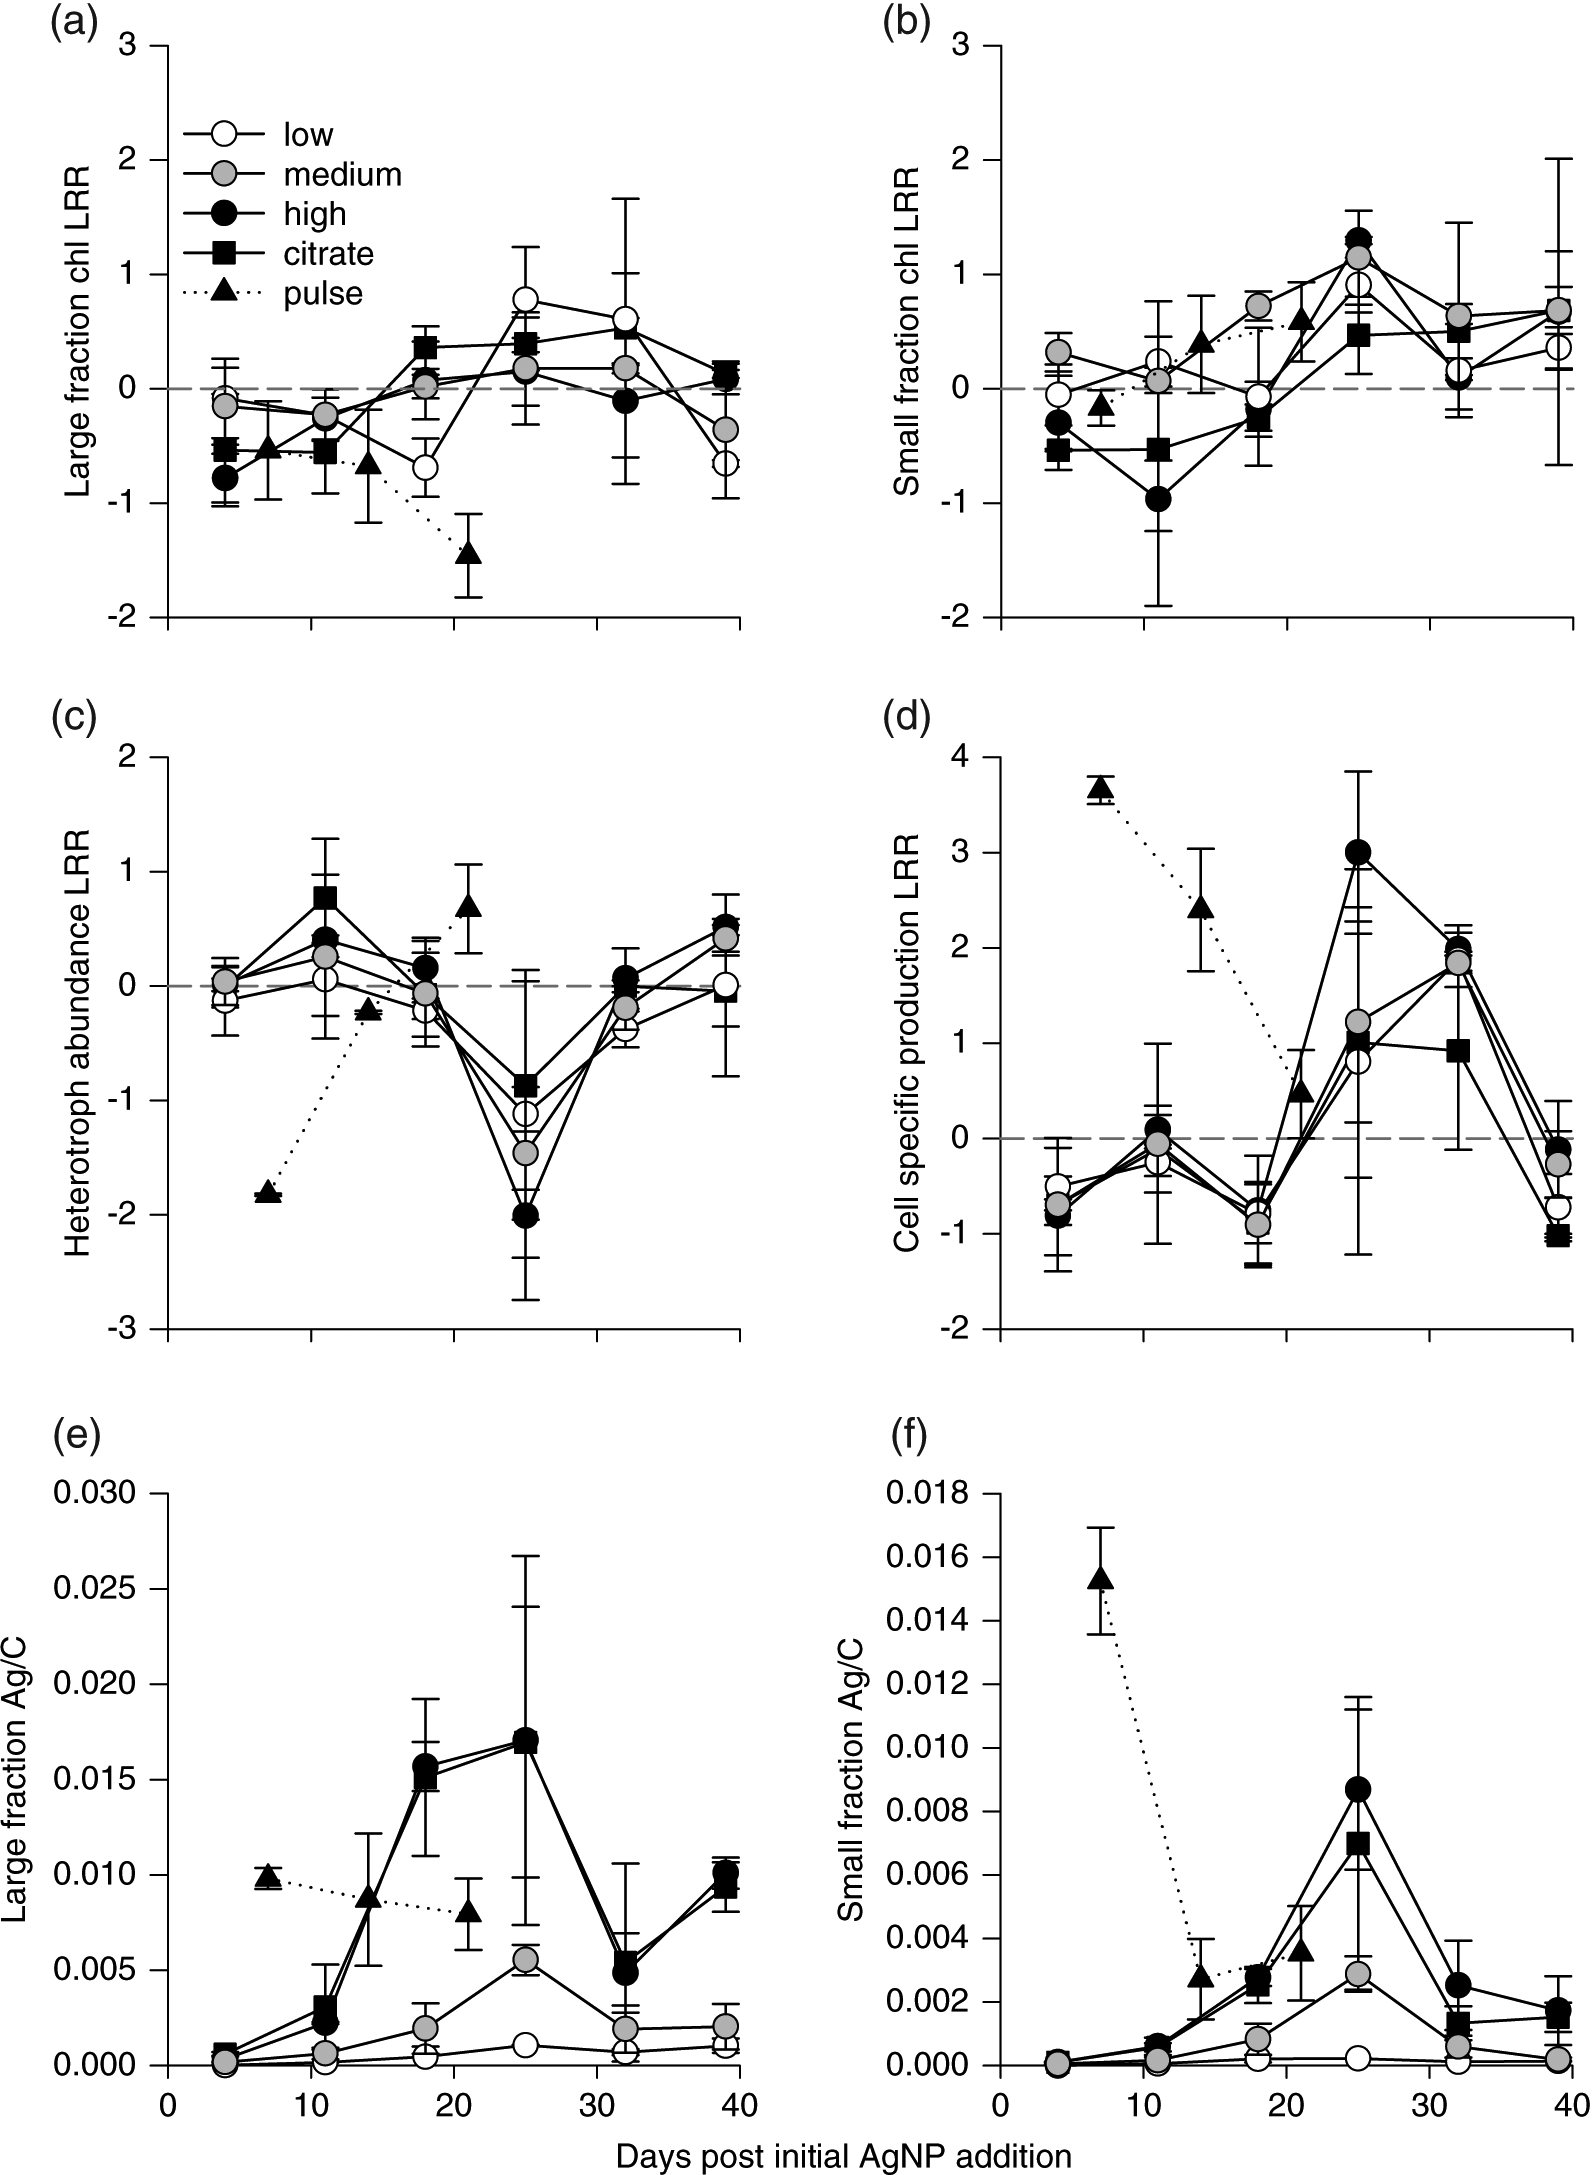
The weak responses we observed match our prediction that microplankton communities should be resistant to gradually increasing AgNP exposure, and this is consistent with the direct comparisons of phytoplankton and bacterioplankton abundance between treatment and control mesocosms (Blakelock et al. 2016; Vincent et al. 2017). This contrasts with the strong negative impacts of acute AgNP exposure on algae observed by others (Navarro et al. 2008; Oukarroum et al. 2012; Das et al. 2014; Ribeiro et al. 2014) as well as with the initial negative responses in the pulsed AgNP mesocosms that were exposed to much higher concentrations at the beginning of the experiment (Figs. 1a–1d; Blakelock et al. 2016; Vincent et al. 2017). This result suggests that the exposure regime (low and slow vs. high and fast) can strongly affect the nature and strength of effects on natural plankton communities.
Acclimation may have been facilitated by the complexation of AgNPs and Ag+ with DOM, which decreases Ag+ bioavailability (Bone et al. 2012; Colman et al. 2012; Blinova et al. 2013), an important determinant of AgNP toxicity (Navarro et al. 2008; Miao et al. 2009; Xiu et al. 2012). In their model of AgNP fate, Furtado et al. (2015) showed that DOM in L239 sequestered 40%–100% of the AgNP-derived Ag+, depending on dissolution rate. It is important to note that the low statistical power of our study may have also contributed to our failure to detect significant responses. Variance between the two replicate mesocosms within each treatment was quite high and may have hindered our ability to detect small but potentially biologically meaningful effects. We likely underestimated the overall within-treatment variance because variance between control mesocosms is not accounted for by using the mean of the two replicate control mesocosms as the denominator in the LRR calculation (see Data Analysis).
Microplankton response following pulse exposure
Mesocosms assigned to the pulse treatment had similar phytoplankton biomass in both the large- and small-size fractions, bacterial abundance, bacterial production, and zooplankton abundance as the control treatments immediately prior to the pulse addition on 11 July 2012 (Blakelock et al. 2016; Vincent et al. 2017). Note that in some cases these conditions differed from those immediately prior to the beginning of the chronic additions 18 d before. For example, Calanoida were absent from zooplankton communities in control and pulse mesocosms (Vincent et al. 2017). TAg in the pulse treatment was ∼70 μg/L following AgNP addition and ∼30 μg/L after 21 d (Furtado et al. 2014, 2015). Mean AgNP size declined to ≤30 nm (determined by single particle ICP-MS) after 14 d (Furtado et al. 2014).
Responses to pulse AgNP exposure varied with microplankton size and among trophic groups. We predicted that pulse AgNP exposure would elicit strong negative responses followed by a recovery phase. However, similar to what we observed in the chronic treatments, none of the effect sizes were significantly different from zero. Autotrophs in the large-size fraction did not respond as predicted (Fig. 1a), as their biomass effect sizes, although negative, were initially similar in magnitude to those observed in chronic treatments and then decreased further. The biomass of autotrophs in the small-size fraction even increased after an initial small drop and quickly became positive (Fig. 1b). The largest effect size we observed was the initial response of cell-specific production to pulsed AgNP exposure, but this response was positive and occurred coincident with the most Ag/C accumulation, which is contrary to our prediction. Although the effect size was not statistically significant, Blakelock et al. (2016) reported statistically significantly more production in the pulse treatments when directly compared with the controls. Patterns of microbial heterotroph effect sizes more closely followed our prediction, responding strongly but not statistically significantly to pulse exposure (Figs. 1c, 1d).
Patterns of Ag accumulation in microplankton
Variable microplankton responses to AgNPs and Ag accumulation in our study may reflect both changes in AgNP exposure and changing community size structure through time. We propose two mechanisms that link food web dynamics with particulate Ag accumulation in pelagic systems (Fig. 2): (i) temporal patterns of biotic responses reflect biotic turnover driven by differences in Ag tolerance among taxa and (ii) shifts in food web biomass and structure contribute to particulate Ag accumulation. Our model assumes an Ag-naive microplankton composed of heterotrophs and large and small autotrophs with each group containing Ag-sensitive, semi-tolerant, and tolerant taxa (Das et al. 2012b).
Fig. 2.
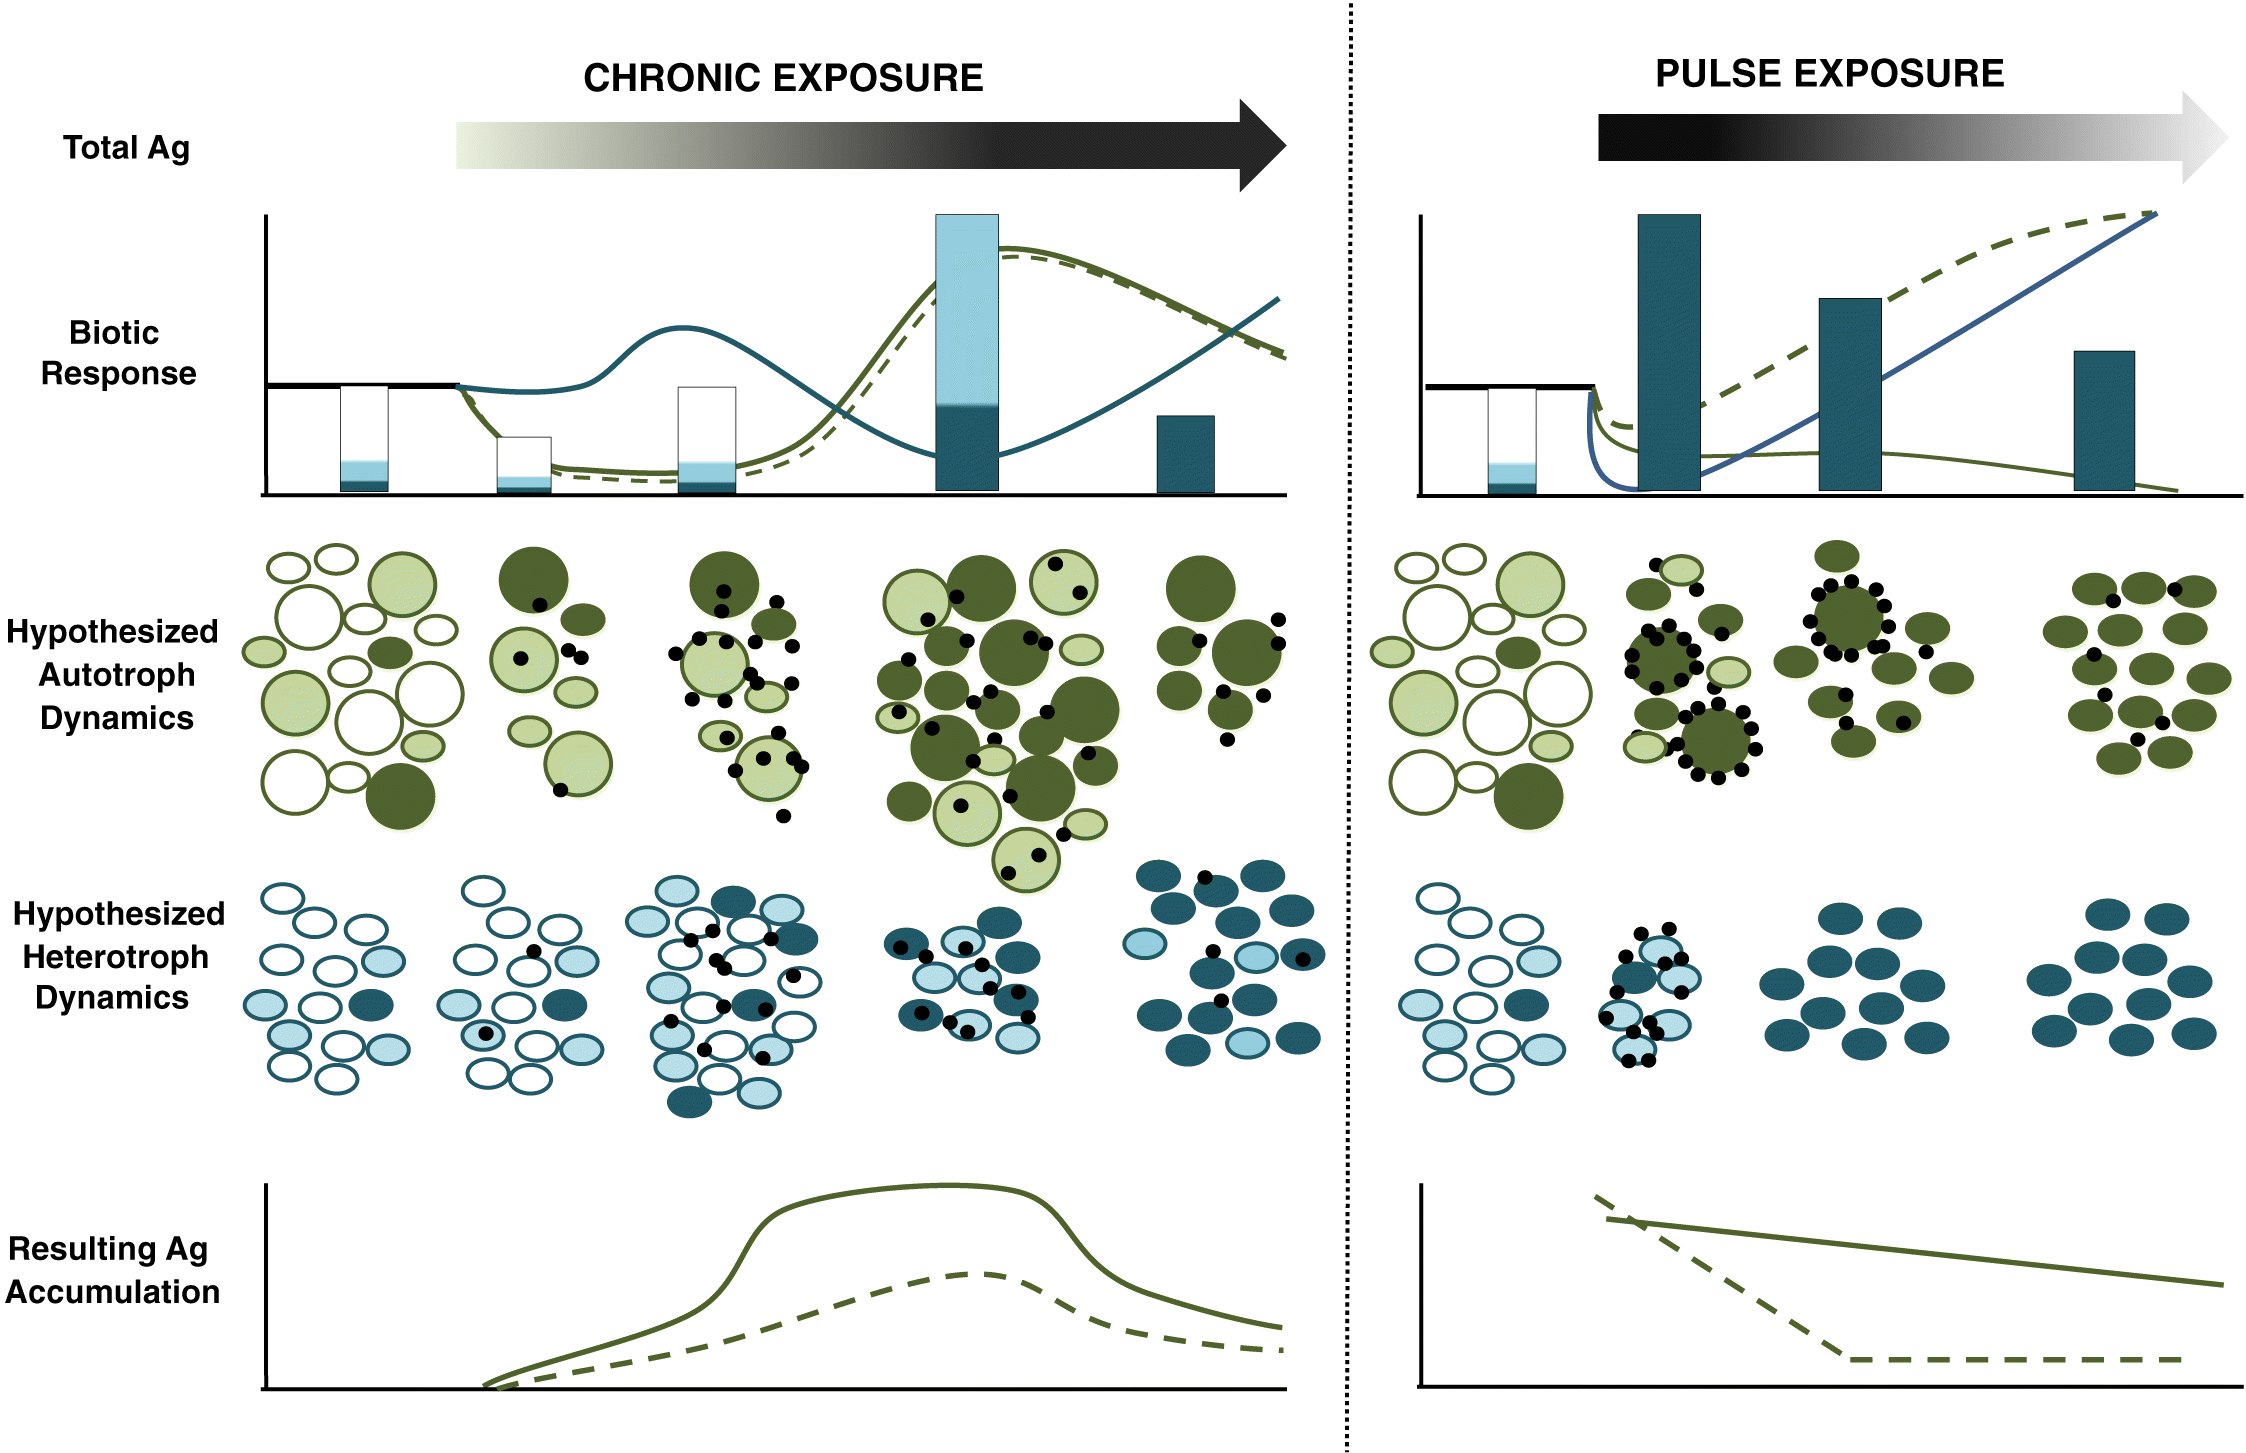
Consistent with the first mechanism, we would expect that chronic AgNP exposure results in gradual changes in sensitivity to AgNP exposure by algal communities based, at least partly, on variation in Ag tolerance among groups. If so, the nonlinear temporal pattern of autotroph biomass effect size we observed may have resulted from the loss of Ag-sensitive taxa after initial AgNP exposure, followed by an increase in populations of semi-tolerant and tolerant taxa, and the eventual loss of semi-tolerant taxa. The fact that all three dosing levels followed the same pattern of changing response size suggests that this result was not triggered by cumulative Ag dose alone, as TAg concentrations differed among treatments (Furtado et al. 2015).
In contrast, the relatively linear temporal response patterns observed following pulse exposure likely reflected differential sensitivity among planktonic taxa to AgNP exposure. The loss of all but the most Ag-tolerant taxa in all three biotic compartments could explain the negative abundance effect size observed within 7 d of the AgNP addition. The resistance threshold (sensu Clements and Rohr 2009) was reached more quickly in pulse compared with chronic exposure followed by the establishment of an alternative stable state characterized by smaller taxa. We suspect that both dosing regimens resulted in Ag-tolerant taxa over time. The final (39 d) heterotrophic microplankton community in chronic treatments was more abundant but less productive compared with the controls. In contrast, the heterotrophs at the end of the experiment in the pulse treatment exhibited greater productivity (i.e., higher cell-specific production) compared with the controls. After 21 d pulse exposure was also dominated by small autotrophs, whereas there was little evidence of a size shift following 39 d of chronic exposure.
Ecosystem response to AgNP exposure
We predicted that the effects of AgNP addition on microplankton would cause shifts in ecosystem function. However, we found little evidence that AgNP exposure affected ecosystem metabolism. Metabolism effect sizes were not significant in either of the dosing regimens (Table S1). In chronic treatments, ER and GPP effect sizes generally became more positive as the experiment progressed (Fig. 3). In the pulse treatment, ER and GPP effect sizes were initially negative but became positive after 14 d. NEP effect size was quite small in both exposure regimens.
Fig. 3.
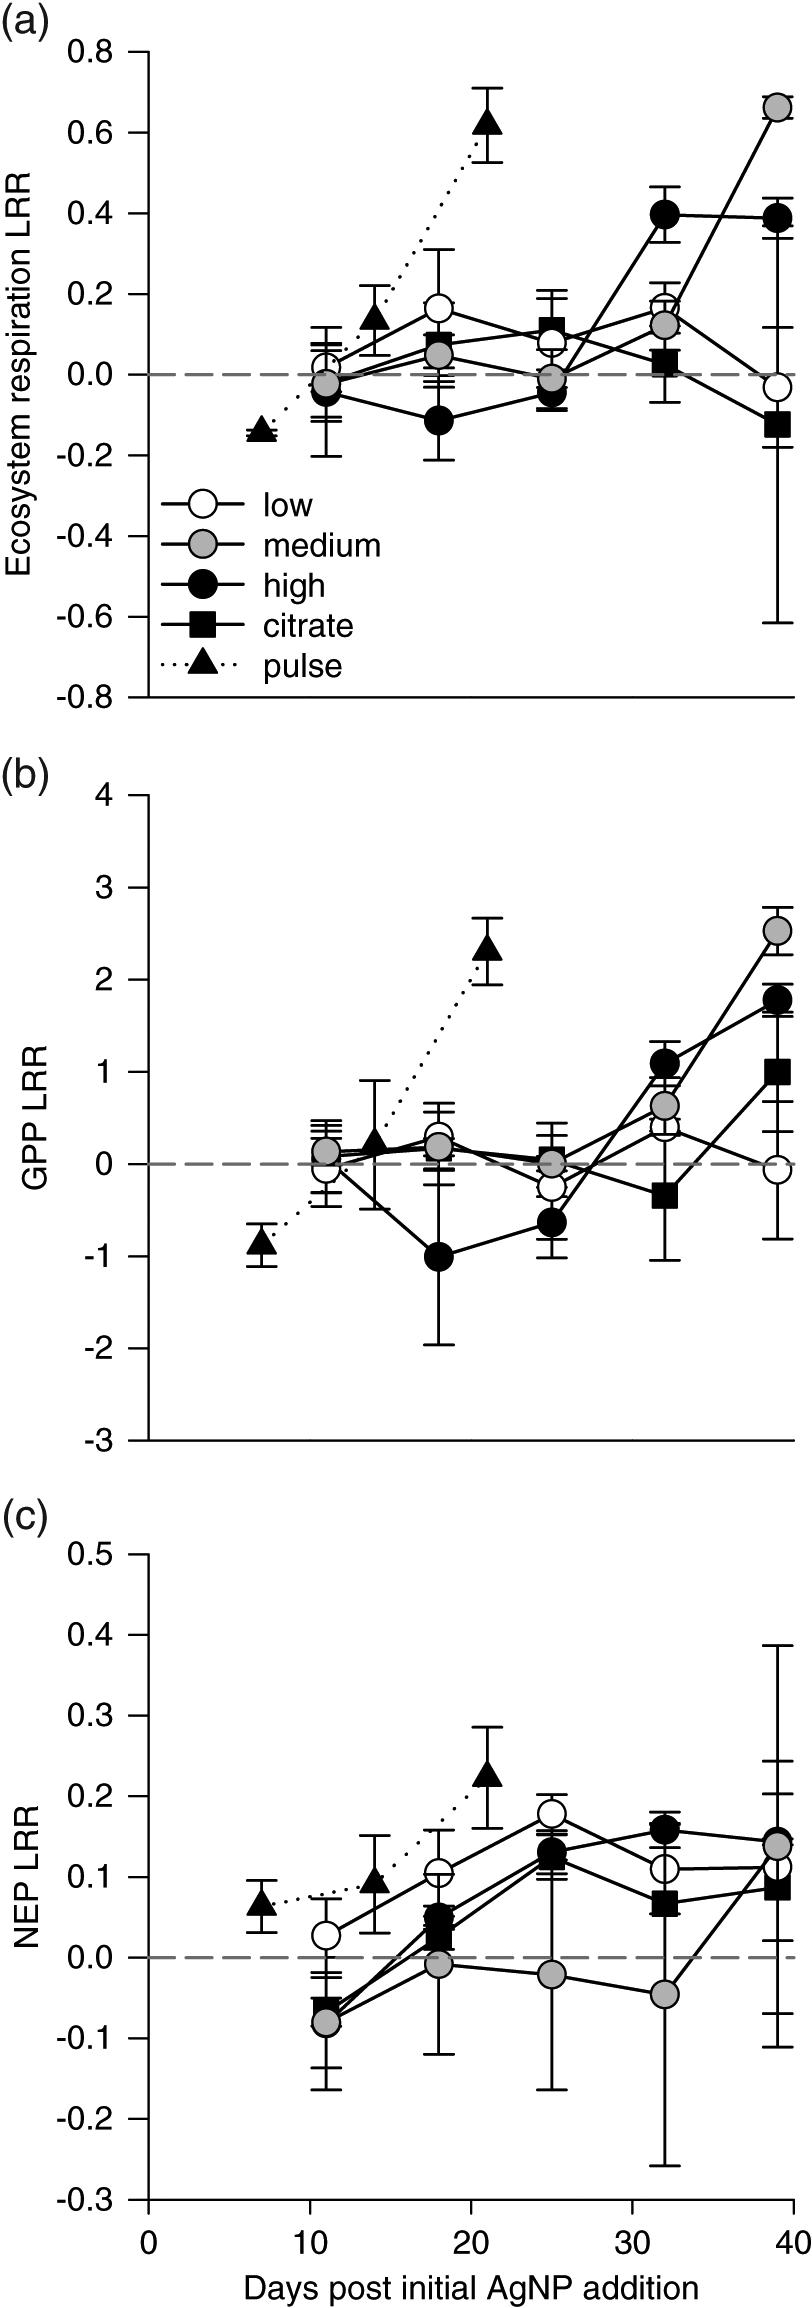
The lack of ecosystem metabolism response in pulse treatments was surprising given the sustained suppression of large algae (Vincent et al. 2017). This finding suggests that C fixation by small autotrophs compensated for the loss of large taxa or that sediments, macrophytes, and periphyton contributed significantly to whole-lake C dynamics (Vadeboncoeur et al. 2001). It is not clear whether these compartments were strongly affected by AgNP exposure. Understanding how AgNPs affect benthic versus pelagic production is a critical area of research, as the relative importance of these compartments will likely change with eutrophication (Vadeboncoeur et al. 2008; Althouse et al. 2014).
Zooplankton response and Ag accumulation
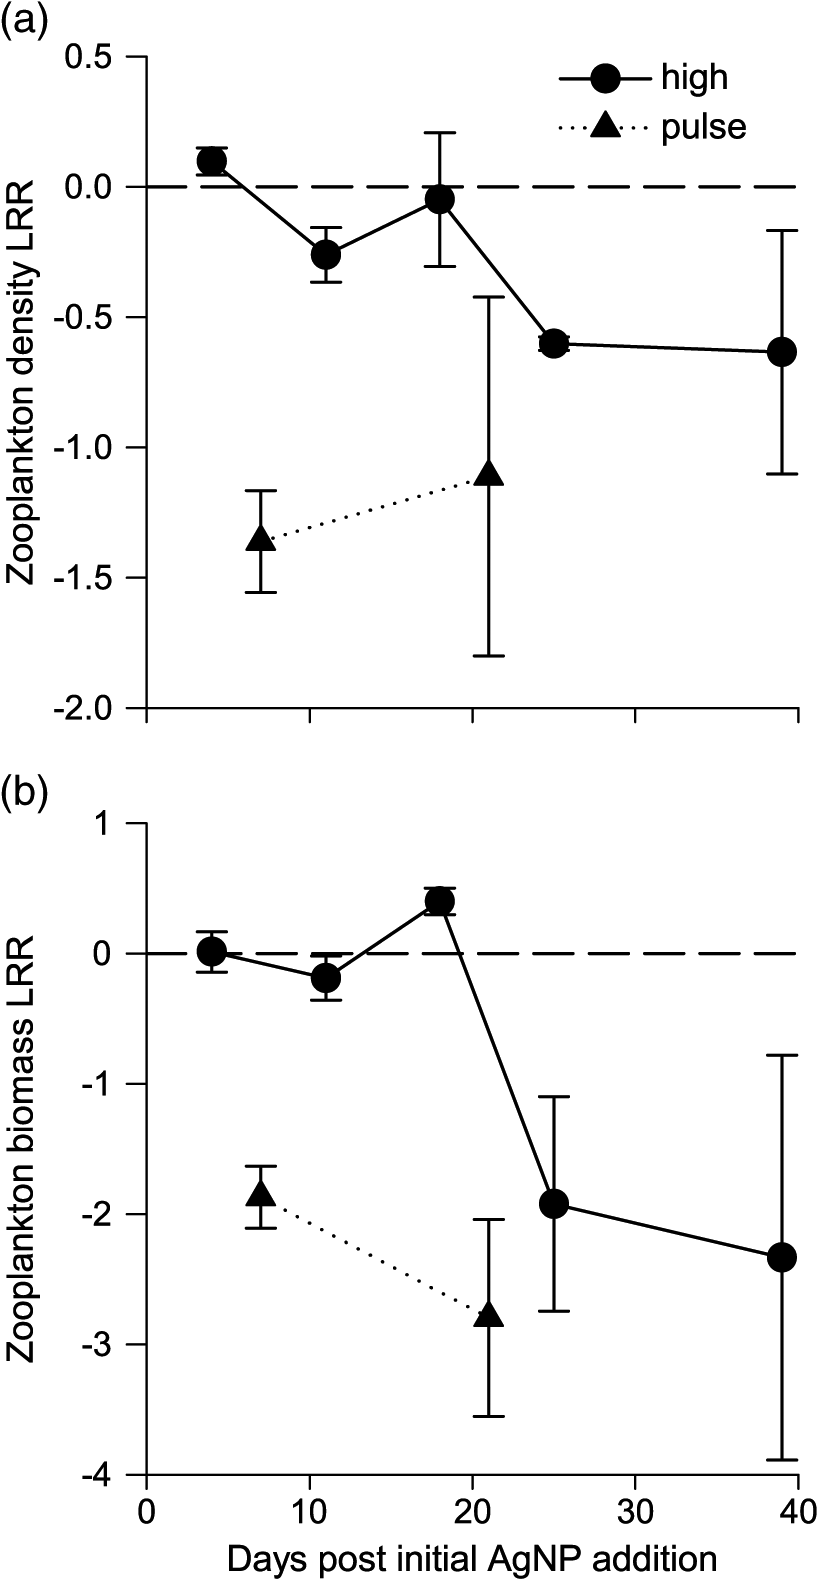
Zooplankton initially showed no or only small effects before responding negatively to chronic AgNP exposure after 25 d, whereas pulsed addition of AgNP had an immediate negative effect on zooplankton abundance and biomass (Fig. 4). These results are consistent with direct comparisons of zooplankton biomass and abundance between treatment and control means (Vincent et al. 2017). Zooplankton biomass effect sizes were the most negative that we observed. However, no zooplankton effect sizes were significant (Table S2), likely due to the large variance between replicates as previously discussed.
Fig. 4.
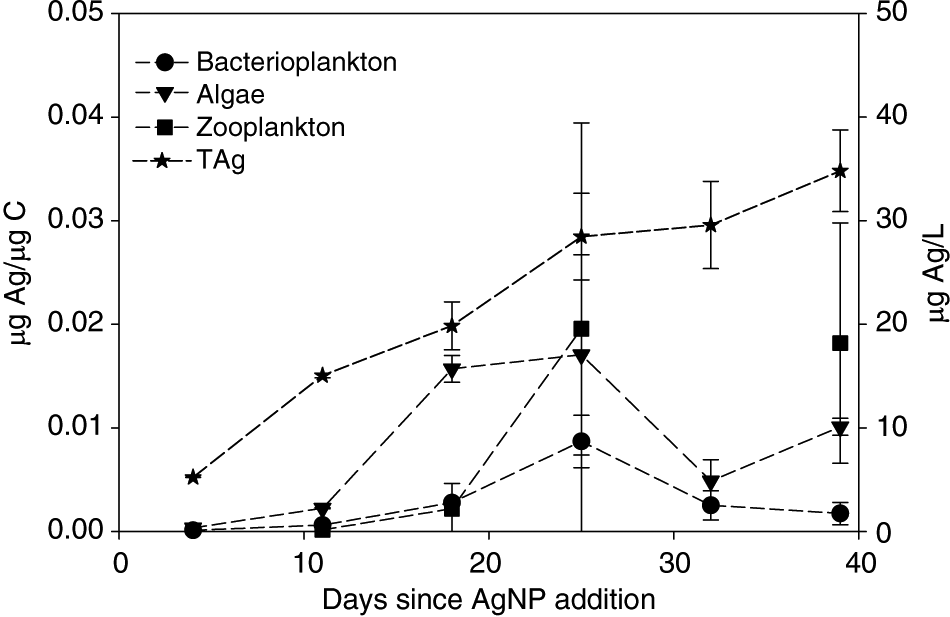
Zooplankton accumulated Ag during chronic addition. Zooplankton Ag/C tracked the Ag/C of their food resources and not the water column (Fig. 5) indicating that diet was likely an important source of Ag for zooplankton in our study. This is supported by the fact that zooplankton from our study accumulated approximately two orders of magnitude more Ag than Daphnia magna exposed to Ag via water alone (Zhao and Wang 2010), suggesting an additional Ag source in our study. Zooplankton may accumulate Ag via the consumption of Ag-laden algal cells or Ag–organic matter complexes. Particulate or ionic Ag bound externally to zooplankton carapaces may also have contributed to zooplankton Ag loads, although the relative importance of such surface sorption is unclear (Zhao and Wang 2010).
Fig. 5.
Conclusion
We show that temporal patterns of lake plankton responses, including abundance and production, are complex and nonlinear following two realistic AgNP exposure scenarios and do not necessarily reflect Ag accumulation in the food web. We also show that ecosystem metabolism was not affected by chronic or pulse AgNP exposure at environmentally relevant concentrations in “limnocorral” mesocosms in an oligotrophic boreal lake. Although neither dosing regimen influenced lake metabolism, this lack of response appeared to occur through different mechanisms. Ecosystem metabolism was unaffected following chronic AgNP exposure due the resilience of plankton communities as evidenced by little change in biomass, abundance, and production. In contrast, lack of ecosystem metabolism response following pulse AgNP exposure may be due to compensatory processing by benthic organisms as phytoplankton showed negative responses to pulse AgNP exposure, at least initially. AgNP impacts on plankton community structure or Ag accumulation within plankton food webs were not necessarily predictive of ecosystem-level responses. These results highlight the importance of supplementing classic toxicological approaches with longer in situ investigations for understanding and predicting the environmental impacts of AgNPs and suggest that ecosystem-level responses to AgNP exposure should not be assumed from community-level responses.
Acknowledgements
We thank Andrew Scott, Nicole Wagner, Jonathan Martin, Jillian Fischer, Nicole Novodvorský, Daniel Braun, and Paul Finigan for help with sample collection and processing and Michael Paterson, Ken Sandilands, Alain Dupuis, Mark Lyng, and Lee Hrenchuk for logistical support. We also thank Mike Stainton and Morris Holoka for help designing and deploying the autosampler. This study was funded by Canada’s Natural Sciences and Engineering Council, Environment Canada, and IISD-ELA.
References
Allison SD, and Martiny JBH. 2008. Resistance, resilience, and redundancy in microbial communities. Proceedings of the National Academy of Sciences of the United States of America, 105(Suppl. 1): 11512–11519.
Althouse B, Higgins S, and Vander Zanden MJ. 2014. Benthic and planktonic primary production along a nutrient gradient in Green Bay, Lake Michigan, USA. Freshwater Science, 33(2): 487–498.
Andersen T, and Hessen DO. 1991. Carbon, nitrogen, and phosphorus content of freshwater zooplankton. Limnology and Oceanography, 36(4): 807–814.
Bernhardt ES, Colmana BP, Hochellab MF, Cardinalec BJ, Nisbetc RM, Richardsond CJ, et al. 2010. An ecological perspective on nanomaterial impacts in the environment. Journal of Environmental Quality, 39(6): 1954–1965.
Blakelock GC, Xenopoulos MA, Norman BC, Vincent JL, and Frost PC. 2016. Effects of silver nanoparticles on bacterioplankton in a boreal lake. Freshwater Biology, 61(12): 2211–2220.
Blaser SA, Scheringer M, MacLeod M, and Hungerbuhler K. 2008. Estimation of cumulative aquatic exposure and risk due to silver: contribution of nano-functionalized plastics and textiles. Science of the Total Environment, 390(2–3): 396–409.
Blinova I, Niskanen J, Kajankari P, Kanarbik L, Käkinen A, Tenhu H, et al. 2013. Toxicity of two types of silver nanoparticles to aquatic crustaceans Daphnia magna and Thamnocephalus platyurus. Environmental Science and Pollution Research, 20(5): 3456–3463.
Bone AJ, Colman BP, Gondikas AP, Newton KM, Harrold KH, Cory RM, et al. 2012. Biotic and abiotic interactions in aquatic microcosms determine fate and toxicity of Ag nanoparticles: Part 2—Toxicity and Ag speciation. Environmental Science and Technology, 46(13): 6925–6933.
Clements WH, and Rohr JR. 2009. Community responses to contaminants: using basic ecological principles to predict ecotoxicological effects. Environmental Toxicology and Chemistry, 28(9): 1789–1800.
Colman BP, Wang SY, Auffan M, Wiesner MR, and Bernhardt ES. 2012. Antimicrobial effects of commercial silver nanoparticles are attenuated in natural streamwater and sediment. Ecotoxicology, 21(7): 1867–1877.
Colman BP, Arnaout CL, Anciaux S, Gunsch CK, Hochella MF, Kim B, et al. 2013. Low concentrations of silver nanoparticles in biosolids cause adverse ecosystem responses under realistic field scenario. PLoS ONE, 8(2): e57189.
Colman BP, Espinasse B, Richardson CJ, Matson CW, Lowry GV, Hunt DE, et al. 2014. Emerging contaminant or an old toxin in disguise? Silver nanoparticle impacts on ecosystems. Environmental Science and Technology, 48(9): 5229–5236.
Das P, Xenopoulos MA, Williams CJ, Hoque ME, and Metcalfe CD. 2012a. Effects of silver nanoparticles on bacterial activity in natural waters. Environmental Toxicology and Chemistry, 31(1): 122–130.
Das P, Williams CJ, Fulthorpe RR, Hoque ME, Metcalfe CD, Xenopoulos MA. 2012b. Changes in bacterial community structure after exposure to silver nanoparticles in natural waters. Environmental Science and Technology, 46(16): 9120–9128.
Das P, Metcalfe CD, and Xenopoulos MA. 2014. Interactive effects of silver nanoparticles and phosphorus on phytoplankton growth in natural waters. Environmental Science and Technology, 48(8): 4573–4580.
Evans TG, and Hofmann GE. 2012. Defining the limits of physiological plasticity: how gene expression can assess and predict the consequences of ocean change. Philosphical Transactions of the Royal Society B-Biological Sciences, 367(1596): 1733–1745.
Fabrega J, Fawcett SR, Renshaw JC, and Lead JR. 2009. Silver nanoparticle impact on bacterial growth: effect of pH, concentration, and organic matter. Environmental Science and Technology, 43(19): 7285–7290.
Furtado LM, Hoque ME, Mitrano DM, Ranville JF, Cheever BM, Frost PC, et al. 2014. The persistence and transformation of silver nanoparticles in littoral lake mesocosms monitored using various analytical techniques. Environmental Chemistry, 11(4): 419–430.
Furtado LM, Norman BC, Xenopoulos MA, Frost PC, Metcalfe CD, Hintelmann H. 2015. Environmental fate of silver nanoparticles in boreal lake ecosystems. Environmental Science and Technology, 49(14): 8441–8450.
Gao J, Youn S, Hovsepyan A, Llaneza VL, Wang Y, Bitton G, et al. 2009. Dispersion and toxicity of selected manufactured nanomaterials in natural river water samples: effects of water chemical composition. Environmental Science and Technology, 43(9): 3322–3328.
Gil-Allue C, Schirmer K, Tlili A, Gessner MO, and Behra R. 2015. Silver nanoparticle effects on stream periphyton during short-term exposures. Environmental Science and Technology, 49(2): 1165–1172.
Griffitt RJ, Luo J, Gao J, Bonzongo JC, and Barber DS. 2008. Effects of particle composition and species on toxicity of metallic nanomaterials in aquatic organisms. Environmental Toxicology and Chemistry, 27(9): 1972–1978.
Kennedy AJ, Hull MS, Bednar AJ, Goss JD, Gunter JC, Bouldin JL, et al. 2010. Fractionating nanosilver: importance for determining toxicity to aquatic test organisms. Environmental Science and Technology, 44(24): 9571–9577.
Kennedy AJ, Chappell MA, Bednar AJ, Ryan AC, Laird JG, Stanley JK, et al. 2012. Impact of organic carbon on the stability and toxicity of fresh and stored silver nanoparticles. Environmental Science and Technology, 46(19): 10772–10780.
Kennedy AJ, Hull MS, Diamond S, Chappell M, Bednar AJ, Laird JG, et al. 2015. Gaining a critical mass: a dose metric conversion case study using silver nanoparticles. Environmental Science and Technology, 49(20): 12490–12499.
Lead JR, Batley GE, Alvarez PJJ, Croteau M, Handy RD, McLaughlin MJ, et al. 2018. Nanomaterials in the environment: behaviour, fate, bioavailability, and effects—an updated review. Environmental Toxicology and Chemistry, 37(8): 2029–2063.
Leclerc S, and Wilkinson KJ. 2014. Bioaccumulation of nanosilver by Chlamydomonas reinhardtii—nanoparticle or the free ion? Environmental Science and Technology, 48(1): 358–364.
Lennon JT, and Jones SE. 2011. Microbial seed banks: the ecological and evolutionary implications of dormancy. Nature Reviews Microbiology, 9(2): 119–130.
Li WR, Xie XB, Shi QS, Zeng HY, OU-Yang YS, Chen YB. 2010. Antibacterial activity and mechanism of silver nanoparticles on Escherichia coli. Applied Microbiology and Biotechnology, 85(4): 1115–1122.
Lowry GV, Espinasse BP, Badireddy AR, Richardson CJ, Reinsch BC, Bryant LD, et al. 2012. Long-term transformation and fate of manufactured Ag nanoparticles in a simulated large scale freshwater emergent wetland. Environmental Science and Technology, 46(13): 7027–7036.
Malley DF, Lawrence SG, MacIver MA, and Findlay WJ. 1989. Range of variation in estimates of dry weight for planktonic Crustacea and Rotifer from temperate North American lakes. Canada Department of Fisheries and Oceans Canadian Technical Report of Fisheries and Aquatic Sciences 1666. Fisheries and Oceans, Ottawa, Ontario, iv + 49 p.
Maurer-Jones MA, Gunsolus IL, Murphy CJ, and Haynes CL. 2013. Toxicity of engineered nanoparticles in the environment. Analytical Chemistry, 85(6): 3036–3049.
McTeer J, Dean AP, White KN, and Pittman JK. 2014. Bioaccumulation of silver nanoparticles into Daphnia magna from a freshwater algal diet and the impact of phosphate availability. Nanotoxicology, 8(3): 305–316.
Miao AJ, Schwehr KA, Xu C, Zhang SJ, Luo Z, Quiggb A, et al. 2009. The algal toxicity of silver engineered nanoparticles and detoxification by exopolymeric substances. Environmental Pollution, 157(11): 3034–3041.
Morones JR, Elechiguerra JL, Camacho A, Holt K, Kouri JB, Ramírez JT, et al. 2005. The bactericidal effect of silver nanoparticles. Nanotechnology, 16(10): 2346–2353.
Navarro E, Piccapietra F, Wagner B, Marconi F, Kaegi R, Odzak N, et al. 2008. Toxicity of silver nanoparticles to Chlamydomonas reinhardtii. Environmental Science and Technology, 42(23): 8959–8964.
Norman BC, Xenopoulos MA, Braun D, and Frost PC. 2015. Phosphorus availability alters the effects of silver nanoparticles on periphyton growth and stoichiometry. PLoS ONE, 10(6): e129328.
Odum HT. 1956. Primary production in flowing waters. Limnology and Oceanography, 1(2): 102–117.
Oukarroum A, Bras S, Perreault F, and Popovic R. 2012. Inhibitory effects of silver nanoparticles in two green algae, Chlorella vulgaris and Dunaliella tertiolecta. Ecotoxicology and Environmental Safety, 78: 80–85.
Persson G, and Ekbohm G. 1980. Estimation of dry-weight in zooplankton populations—methods applied to crustacean populations from lakes in the Kuokkel area, Northern Sweden. Archiv für Hydrobiologie, 89: 225–246.
Quigg A, Chin WC, Chen CS, Zhang S, Jiang Y, Miao AJ, et al. 2013. Direct and indirect toxic effects of engineered nanoparticles on algae: role of natural organic matter. ACS Sustainable Chemistry and Engineering, 1(7): 686–702.
Ribeiro F, Gallego-Urreab JA, Jurkschat J, Crossley A, Hassellöv M, Taylor C, et al. 2014. Silver nanoparticles and silver nitrate induce high toxicity to Pseudokirchneriella subcapitata, Daphnia magna and Danio rerio. Science of the Total Environment, 466–467: 232–241.
Rosi-Marshall EJ, and Royer TV. 2012. Pharmaceutical compounds and ecosystem function: an emerging research challenge for aquatic ecologists. Ecosystems, 15(6): 867–880.
Sartory DP, and Grobbelaar JU. 1984. Extraction of chlorophyll a from freshwater phytoplankton for spectrophotometric analysis. Hydrobiologia, 114(3): 177–187.
Shade A, Peter H, Allison SD, Baho DL, Berga M, Bürgmann H, et al. 2012. Fundamentals of microbial community resistance and resilience. Frontiers in Microbiology, 3: 1-19.
Staehr PA, Bade D, Van de Bogert MC, Koch GR, Williamson C, Hanson P, et al. 2010. Lake metabolism and the diel oxygen technique: state of the science. Limnology and Oceanography Methods, 8(11): 628–644.
Stevenson LM, Dickson H, Klanjscek T, Keller AA, McCauley E, Nisbet RM. 2013. Environmental feedbacks and engineered nanoparticles: mitigation of silver nanoparticle toxicity to Chlamydomonas reinhardtii by algal-produced organic compounds. PLoS ONE, 8(9): e74456.
Tlili A, Jabiol J, Behra R, Gil-Allue C, and Gessner MO. 2017. Chronic exposure effects of silver nanoparticles on stream microbial decomposer communities and ecosystem functions. Environmental Science and Technology, 51: 2447–2455.
Unrine JM, Colman BP, Bone AJ, Gondikas AP, and Matson CW. 2012. Biotic and abiotic interactions in aquatic microcosms determine fate and toxicity of Ag nanoparticles. Part 1. Aggregation and dissolution. Environmental Science and Technology, 46(13): 6915–6924.
Vadeboncoeur Y, Lodge DM, and Carpenter SR. 2001. Whole-lake fertilization effects on distribution of primary production between benthic and pelagic habitats. Ecology, 82(4): 1065–1077.
Vadeboncoeur Y, Peterson G, Vander Zanden MJ, and Kalff J. 2008. Benthic algal production across lake size gradients: interactions among morphometry, nutrients, and light. Ecology, 89(9): 2542–2552.
Vance ME, Kuiken T, Vejerano EP, McGinnis SP, Hochella MF, Rejeski D, et al. 2015. Nanotechnology in the real world: redeveloping the nanomaterial consumer products inventory. Beilstein Journal of Nanotechnology, 6:1769–1780.
Vasileiadis S, Brunetti G, Marzouk E, Wakelin S, Kowalchuk G, Lombi E, et al. 2018. Silver toxicity thresholds for multiple soil microbial biomarkers. Environmental Science and Technology, 52: 8745–8755.
Vincent JL, Paterson MJ, Norman BC, Gray EP, Ranville JF, Scott AB, et al. 2017. Chronic and pulse exposure effects of silver nanoparticles on natural lake phytoplankton and zooplankton. Ecotoxicology, 26(4): 502–515.
Xiu ZM, Zhang QB, Puppala HL, Colvin VL, and Alvarez PJJ. 2012. Negligible particle-specific antibacterial activity of silver nanoparticles. Nano Letters, 12(8): 4271–4275.
Yuan ZH, Li JG, Cui L, Xu B, Zhang H, Yu CP. 2013. Interaction of silver nanoparticles with pure nitrifying bacteria. Chemosphere, 90(4): 1404–1411.
Zhao CM, and Wang WX. 2010. Biokinetic uptake and efflux of silver nanoparticles in Daphnia magna. Environmental Science and Technology, 44(19): 7699–7704.
Supplementary material
Supplementary Material 1
- Download
- 19.40 KB
Information & Authors
Information
Published In
FACETS
Volume 4 • Number 1 • June 2019
Pages: 566 - 583
Editor: Nelson O’Driscoll
History
Received: 11 November 2018
Accepted: 24 June 2019
Version of record online: 7 November 2019
Copyright
© 2019 Norman et al. This work is licensed under a Creative Commons Attribution 4.0 International License (CC BY 4.0), which permits unrestricted use, distribution, and reproduction in any medium, provided the original author(s) and source are credited.
Data Availability Statement
All data generated and analyzed during this study are included in this published article (and its Supplementary Information files) and other published articles from the study (cited within this article). The data sets analyzed during the current study are available from the corresponding author on reasonable request.
Key Words
Sections
Subjects
Plain Language Summary
Plankton accumulate but are resistant to silver nanoparticles
Authors
Author Contributions
PCF and MAX conceived and designed the study.
BCN, GCB, and JLV performed the experiments/collected the data.
BCN, PCF, SNH, MEH, KC, and MAX analyzed and interpreted the data.
PCF, SNH, and MAX contributed resources.
BCN, PCF, SNH, and MAX drafted or revised the manuscript.
Competing Interests
The authors have declared that no competing interests exist.
Metrics & Citations
Metrics
Other Metrics
Citations
Cite As
Beth C. Norman, Paul C. Frost, Graham C. Blakelock, Scott N. Higgins, Md Ehsanul Hoque, Jennifer L. Vincent, Katarina Cetinic, and Marguerite A. Xenopoulos. 2019. Muted responses to Ag accumulation by plankton to chronic and pulse exposure to silver nanoparticles in a boreal lake. FACETS.
4(1): 566-583. https://doi.org/10.1139/facets-2018-0047
Export Citations
If you have the appropriate software installed, you can download article citation data to the citation manager of your choice. Simply select your manager software from the list below and click Download.
Cited by
1. Isotopic‐based evidence for reduced benthic contributions to fish after a whole‐lake addition of nanosilver
2. Effect of wastewater from industries on freshwater ecosystem: threats and remedies