Open access

Global estrogen receptor-α knockout has differential effects on cortical and cancellous bone in aged male mice

Publication: FACETS
21 May 2020

Abstract

Estrogen receptor-α knockout (ERKO) in female rodents results in bone loss associated with increased osteocyte sclerostin expression; whether this also occurs in males is unknown. Here, we examined the effects of ERKO on femoral cortical geometry, trabecular microarchitecture, and osteocyte sclerostin expression of the femur and lumbar vertebrae. At 14 months of age, male ERKO and wild-type (WT) littermates (n = 6 per group) were sacrificed, and femora and vertebra were collected. Cortical geometry and trabecular microarchitecture were assessed via micro-computed tomography; osteocyte sclerostin expression was assessed via immunohistochemistry. ANCOVA with body weight was used to compare ERKO and WT for cortical geometry; t-tests were used for all other outcomes. Regardless of skeletal site, ERKO mice had greater trabecular bone volume and trabecular number and decreased trabecular separation compared with WT. In the femoral diaphysis, ERKO had lower total area, cortical area, and cortical thickness compared with WT. The percentage of sclerostin+ osteocytes was increased in ERKO animals in cortical bone but not in cancellous bone of the femur or the lumbar vertebrae. In conclusion, ERKO improved trabecular microarchitecture in aged male mice, but negatively altered femoral cortical geometry associated with a trend towards increased cortical sclerostin expression.

Introduction

Epidemiological evidence supports a strong positive relationship between bioavailable estrogen and bone mass in both women and men (Khosla et al. 2001; Piot et al. 2019). Estrogen actions are mediated in part by estrogen binding to the estrogen receptor (ER), which is found in two isoforms, ERα and ERβ. Both ERα and ERβ are found in bone; however, ERα is more prevalent in cortical bone, whereas ERβ is more widely distributed in cancellous bone (Onoe et al. 1997). ERα and ERβ knockout mouse models have been used to determine the significance of this differential expression in the growth and maintenance of bone mass. Male ERα knockout (ERKO) mice generally show increased cancellous bone but decreased cortical bone mass, whereas male ERβ knockout mice show equivalent bone mass when compared with wild-type (WT) mice (Vico and Vanacker 2010). However, total bone mass is only one determinant of bone strength (Ammann and Rizzoli 2003; Fonseca et al. 2014), and reduction in estrogen signaling can affect all levels of bone’s hierarchal structure (Khosla et al. 2012; Khalid and Krum 2016), which collectively determine fracture resistance.
Male ERKO mice have decreased absolute longitudinal bone growth (Vidal et al. 2000; Vandenput et al. 2001; Parikka et al. 2005) relative to their WT counterparts. Young male ERKO mice have decreased cortical bone area, cortical thickness (Vidal et al. 2000; Callewaert et al. 2009), and biomechanical bending strength (Vidal et al. 2000), but increased cancellous bone mineral density (BMD) and trabecular number compared with WT mice (Lindberg et al. 2001; Callewaert et al. 2009). Aged male ERKO mice have a similar phenotype, with decreased cortical bone area (Vandenput et al. 2001; Parikka et al. 2005) compared with WT. Although cancellous BMD is greater in male ERKO mice, trabecular microarchitecture has not been examined in an aged male ERKO mouse model. Considering the significant role that trabecular microarchitecture plays in biomechanical bone strength (Oftadeh et al. 2015), analysis of the trabecular microarchitecture of aged male ERKO animals is important.
Ultimately, the three-dimensional structure of bone is controlled via activity of osteoblasts, osteoclasts, and osteocytes. Osteocytes express sclerostin, a protein that down-regulates bone formation by inhibition of Wnt signaling (Delgado-Calle et al. 2017) through paracrine actions on local osteoblasts and osteoclasts (Robling et al. 2008; Moustafa et al. 2012). Sclerostin expression is regulated by several external factors such as age and mechanical loading as well as endogenous hormones such as IGF-I, parathyroid hormone, androgens, and estrogens (Delgado-Calle et al. 2017). In women and female rodent models, estrogen status is inversely related to sclerostin expression, whether measured via serum sclerostin concentrations (Mirza et al. 2010; Mödder et al. 2011a; Kim et al. 2015a) or sclerostin mRNA or protein expression in the bone (Kim et al. 2012; Fujita et al. 2014; Jia et al. 2014). In men, circulating sclerostin is negatively correlated with testosterone concentrations (Di Nisio et al. 2015), though correlation does not prove direct regulation. In fact, estrogen treatment of elderly men decreased circulating sclerostin, whereas testosterone treatment did not (Mödder et al. 2011b). This implies that estrogen directly regulates circulating sclerostin in men, though the direct impact on bony sclerostin and whether this regulatory role requires ERα is still unknown. Thus, further studies looking at the effect of estrogen on bone sclerostin expression in males are warranted.
In addition to direct ERα-mediated effects, estrogen affects bone indirectly by impacting metabolic health. Reduction in ERα activity is associated with increased body weight (Callewaert et al. 2009), as well as metabolic dysfunction, including insulin resistance (Faulds et al. 2012) and type 2 diabetes (Bryzgalova et al. 2006), all of which are associated with decreased bone quality (Starup-Linde and Vestergaard 2016) and an increased risk of fracture (Janghorbani et al. 2007; Merlotti et al. 2010; Compston 2013). However, the relative contributions of these indirect metabolic effects to the overall skeletal phenotype of male ERKO mice has yet to be evaluated.
In this study, we compare aged male ERKO mice with their age-matched WT counterparts. We hypothesized that aged male ERKO mice would have improved trabecular microarchitecture in both the femur and the lumbar vertebrae, as well as decreased femoral length, mineral content, and cortical bone area compared with WT mice. Additionally, we hypothesized that, versus WT, male ERKO mice would have a higher percentage of sclerostin-positive (Sost+) osteocytes in cortical bone.

Methods

Experimental design

This study is part of a larger study investigating the effects of ERKO on glycemic control, inflammation, and hepatic steatosis in aged, male mice (Winn et al. 2018). Heterozygote ERα−/+ mice on a C57BL/6J background were bred at our facility to produce male homozygote (ERα−/−) and littermate WT mice, as previously described (Lubahn et al. 1993; Eddy et al. 1996). Briefly, development of the ERα−/− mouse was accomplished by homologous recombination and insertion of a neomycin sequence containing premature stop codons and polyadenylation sequences into a Not1site in exon 2 of the mouse estrogen receptor gene, resulting in an interruption of gene transcription, but not full removal of the gene (Lubahn et al. 1993; Eddy et al. 1996; Rubanyi et al. 1997). Knockout was verified via western blot (Winn et al. 2018). After weaning, mice were fed standard rodent chow ((3.3 kcal/g of food), 13% kcal fat, 57% kcal carbohydrate, and 30% kcal protein, 5001, LabDiet, St. Louis, Missouri, USA) ad libitum until 14 months of age, providing two experimental groups: ERKO and WT controls (n = 6–7/group). All mice were pair-housed (mixed genotypes) in a temperature-controlled environment at 25 °C, with a 0700–1900 light, 1900–0700 dark cycle. Body weight and food intake were measured weekly, and body composition was measured by a nuclear magnetic resonance imaging whole-body composition analyzer (EchoMRI 4in1/1100; Echo Medical Systems, Houston, Texas, USA) on conscious mice one week prior to sacrifice. At 14 months of age, mice were euthanized following a 5-h fast. Blood samples were collected via cardiac puncture and centrifuged; plasma was separated, frozen in liquid nitrogen, and stored at −80 °C for further analysis. Circulating estradiol and fasting insulin, glucose, and lipids were measured as previously described (Winn et al. 2018). Femurs, tibiae, forelimbs, and lumbar vertebrae were harvested, wrapped in PBS-soaked gauze, frozen in liquid nitrogen, and stored at −80 °C for further analysis. All procedures were approved in advance by the University of Missouri Institutional Animal Care and Use Committee.

Cortical geometry and trabecular microarchitecture

Micro-computed tomographic (μCT) imaging of the right femur and the fourth lumbar vertebrae was performed using a high-resolution imaging system (Xradia 520 Versa, ZEISS, Oberkochen, Germany). The methods used were in accordance with guidelines for the use of μCT in rodents put forth by the American Society of Bone and Mineral Research (Bouxsein et al. 2010). Scans were acquired using an isotropic voxel size of 0.012 mm, a peak X-ray tube potential of 50 kV, and a 4-s exposure time. Trabecular bone microarchitecture was evaluated in a 0.5-mm region of interest directly above the growth plate of the distal femur, representing the distal metaphysis, and in a 0.5-mm region of interest of the lumbar vertebral body above the intervertebral disc. Cortical bone cross-sectional geometry was evaluated at a 1-mm region of interest beginning at the end of the third trochanter, representing the diaphysis. The optimize threshold function was used to delineate mineralized bone from soft tissue. Scans were analyzed using BoneJ software (Doube et al. 2010) (National Institutes of Health public domain), and measures of cortical geometry and trabecular microarchitecture were collected. Outcomes for cortical geometry included: femur length (Le), total cross-sectional area inside the periosteal envelope (Tt.Ar), marrow area (Ma.Ar), cortical bone area (Ct.Ar), cortical area fraction (Ct.Ar/Tt.Ar), mean cortical thickness (Ct.Th), and robustness (R, total bone area over length calculated as R = Tt.Ar/Le). Outcomes for trabecular microarchitecture included: total volume (TV, volume of region of interest), bone volume (BV, volume of region segmented as bone), bone volume fraction (BV/TV), connectivity density (Conn.D, degree of trabeculae connectivity normalized to TV), mean trabecular thickness (Tb.Th), trabecular separation (Tb.Sp, distance between trabeculae), trabecular number (Tb.N, average number of trabeculae per unit length calculated as 1/(Tb.Th + Tb.Sp) (Bruker-microCT 2012)), structural model index (SMI), and degree of anisotropy (DA).

Cortical collagen and advanced glycated end-product (AGE) content

Left femur diaphyses were flushed of marrow, acid-hydrolyzed with 6 N HCl, dried overnight, and reconstituted in 0.001 N HCl. The hydrolysate was used to measure collagen and AGE content. Collagen content was estimated by determination of hydroxyproline via colorimetric assay using Chloramine T and Erlich’s reagents (Sigma–Aldrich, St. Louis, Missouri, USA) compared with a hydroxyproline standard (Sigma–Aldrich, St. Louis, Missouri, USA). Total AGEs were quantified by fluorescence with excitation at 360 nm and an emission of 460 nm using quinine as a standard (Thermo Fisher Scientific, Waltham, Massachusetts, USA) (Tang et al. 2007).

Ash and mineral content

Right forelimbs (humerii, ulnae, and radii) were cleaned of all soft tissue, weighed, and defatted in hexane and diethyl ether each for 24 h. Following lipid extraction, forelimbs were dried to a constant weight at 60 °C. Forelimbs were then placed in a muffle furnace (800 °C) overnight to collect ash. Final weight of ash content was recorded, and the ashed forelimbs were analyzed for calcium and phosphorus content via inductive coupled plasma-optical emission spectroscopy (Agricultural Chem Station, University of Missouri, Columbia, Missouri, USA). Results are expressed as gram of calcium or phosphorus per 100 g of ash (g/100 g).

Osteocyte sclerostin expression

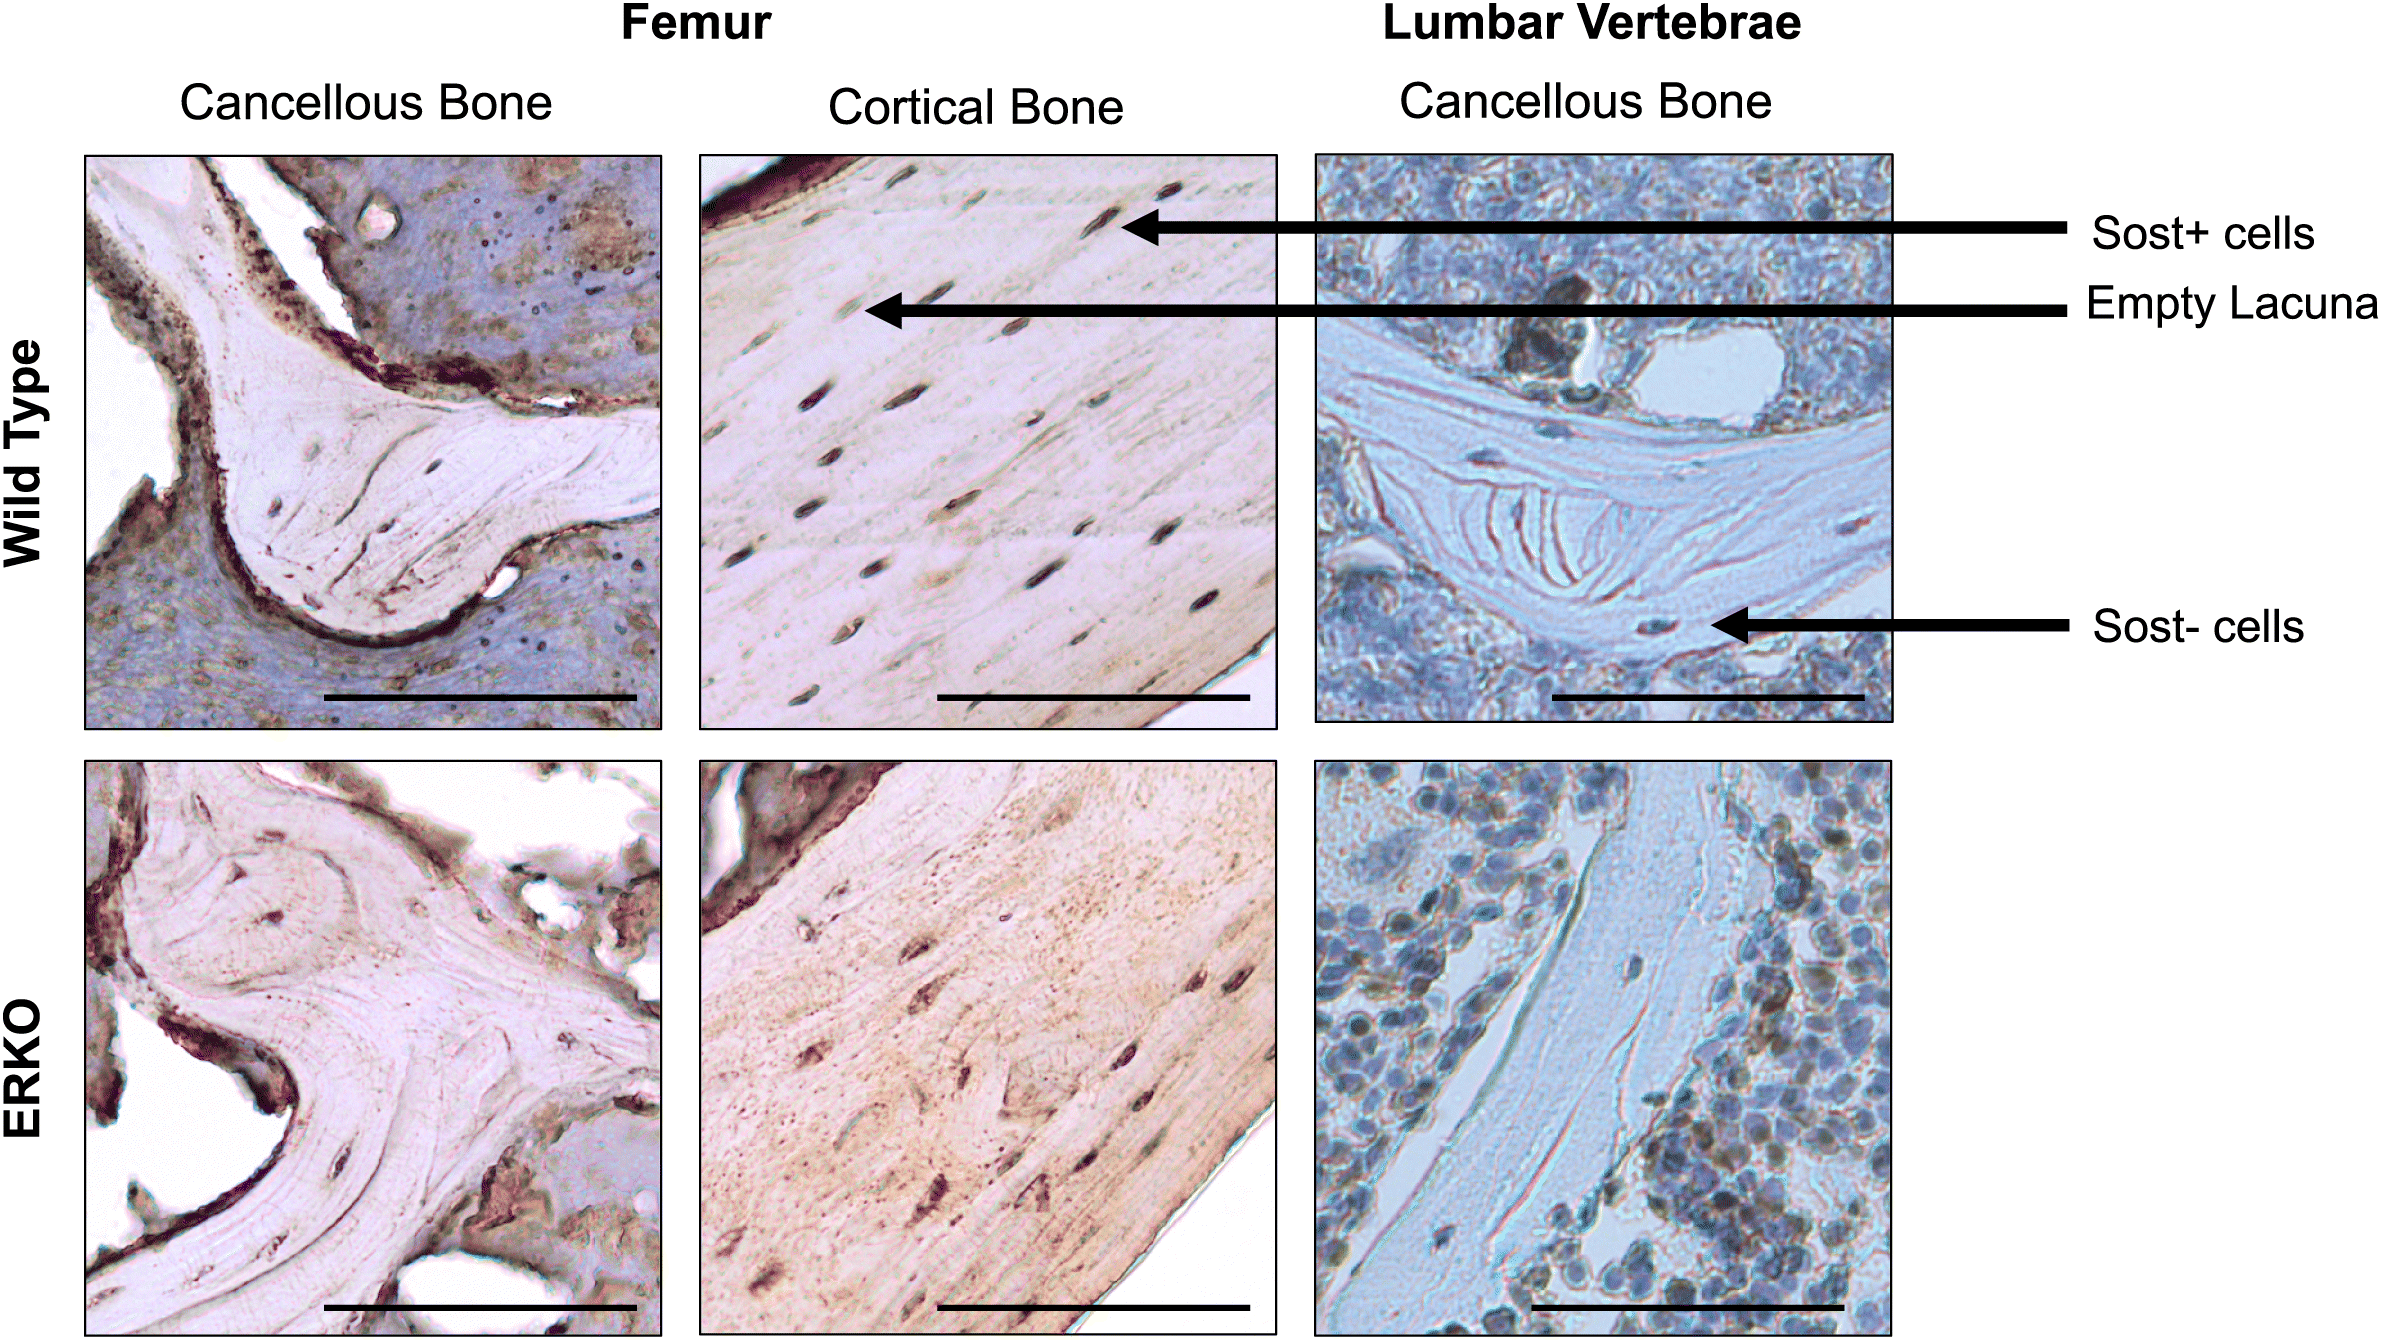
Right femurs and lumbar vertebrae were fixed in 10% formalin for 48 h at 4 °C and then decalcified in 14% ethylenediaminetetraacetic acid (EDTA) at 4 °C. Decalcified femurs were embedded in paraffin wax blocks, and 5-μm sections were taken longitudinally down the midline of the femur. Lumbar vertebrae were embedded in paraffin wax and 5-μm sections were taken transversely through the vertebral body. The sections were dried and deparaffinized, and then underwent enzymatic antigen retrieval using a 1× solution (20 μg/mL) of protease K (Fisher Scientific, Hampton, New Hampshire, USA) in Tris-EDTA buffer (Fisher Scientific, Hampton, New Hampshire, USA), followed by blocking of endogenous peroxidase activity (3% H2O2, Ricca Chemical, Arlington, Texas, USA) and avidin and biotin expression (Avidin Biotin Blocking Solution, Thermo Scientific, Waltham, Massachusetts, USA). Sections were then incubated in anti-sclerostin primary antibodies (Abcam, Cambridge, UK) overnight at 4 °C. Secondary antibody binding and detection were accomplished using the Vectastain Elite ABC kit (Vector Laboratories, Burlingame, California, USA), with diaminobenzidine (ImmPACT DAB, Vector Laboratories, Burlingame, California, USA) as the chromogen. Sections were counterstained with hematoxylin (Fisher Scientific, Hampton, New Hampshire, USA), dried, and mounted. Sections were analyzed at 20× for sclerostin expression. Sost+ osteocytes were defined as osteocytes exhibiting brown staining, and sclerostin negative (Sost−) osteocytes were defined as osteocytes exhibiting blue (hematoxylin) staining. Data are reported as percent Sost+ osteocytes. In addition to Sost+ and Sost− osteocytes, empty osteocytic lacunae revealed by hematoxylin staining were counted, and data are reported as percent empty lacunae, as previously described by Pereira et al. (2017). For cortical bone, percent Sost+ osteocytes were counted in a 1 mm region directly below the third trochanter, and for trabecular bone, percent Sost+ osteocytes were counted in the region directly above the growth plate, to correlate with the μCT data.

Statistical analysis

Student’s t-tests were used to test for significant differences between groups (ERKO vs. WT) for metabolic outcomes, material properties, trabecular microarchitecture, and percentage of Sost+ osteocytes. Body weight is a strong predictor of cortical bone mass, so cortical geometry was assessed by one-way ANCOVA with final body weight included as a covariate. Pearson correlations between metabolic outcomes (body weight, body fat percentage, and serum insulin and glucose) and circulating estradiol concentrations from the parent study (Winn et al. 2018) and bone outcomes (trabecular microarchitecture, cortical geometry, sclerostin expression) were performed to determine direct effects of genotype versus indirect effects of metabolic health on bone outcomes. Data are presented as means ± SEM or adjusted means ± SEM. Statistical significance was set at p < 0.05. All analyses were performed using SPSS software (SPSS/25.0, SPSS, Chicago, Illinois, USA).

Results

Metabolic characteristics

The metabolic characteristics for these animals have been previously published as part of a larger study (Winn et al. 2018) and the results have been summarized in Table 1. Briefly, ERKO mice had higher body fat percentage (p = 0.026), fasting glucose (p = 0.024) and triglycerides (p = 0.013) compared with WT mice. No differences were detected between groups in body weight, absolute food intake, circulating estradiol, or fasting levels of insulin, total cholesterol, high-density lipoprotein, low-density lipoprotein, or nonesterified fatty acids.
Table 1.
Table 1. Metabolic characteristics of male ERα−/− mice (ERKO) and wild-type (WT) mice.
OutcomeWTERKOp
Body mass (g)33.6 ± 1.039.0 ± 3.10.148
Body fat percentage16.81 ± 0.4624.80 ± 2.830.034*
Average food intake (g/d)5.10 ± 0.484.10 ± 0.250.188
Blood glucose (mg/dL)227 ± 20321 ± 290.024*
Insulin (uU/L)36.4 ± 9.636.8 ± 8.80.974
Cholesterol (mg/dL)62 ± 479 ± 80.099
High-density Lipoprotein (mg/dL)32 ± 338 ± 20.103
Low-density Lipoprotein (mg/dL)5 ± 0.66 ± 10.591
Triglycerides (mg/dL)122 ± 6147 ± 60.013*
Nonesterified Fatty Acids (mmol/L)0.49 ± 0.110.52 ± 0.050.763
Circulating estradiol (pg/mL)7.1 ± 2.08.5 ± 1.30.567

Note: Data are means ± SEM, n = 6 per group. Significance between groups (p < 0.05) is indicated by asterisk (*). Adapted from Winn et al. (2018).

Femoral cortical geometry

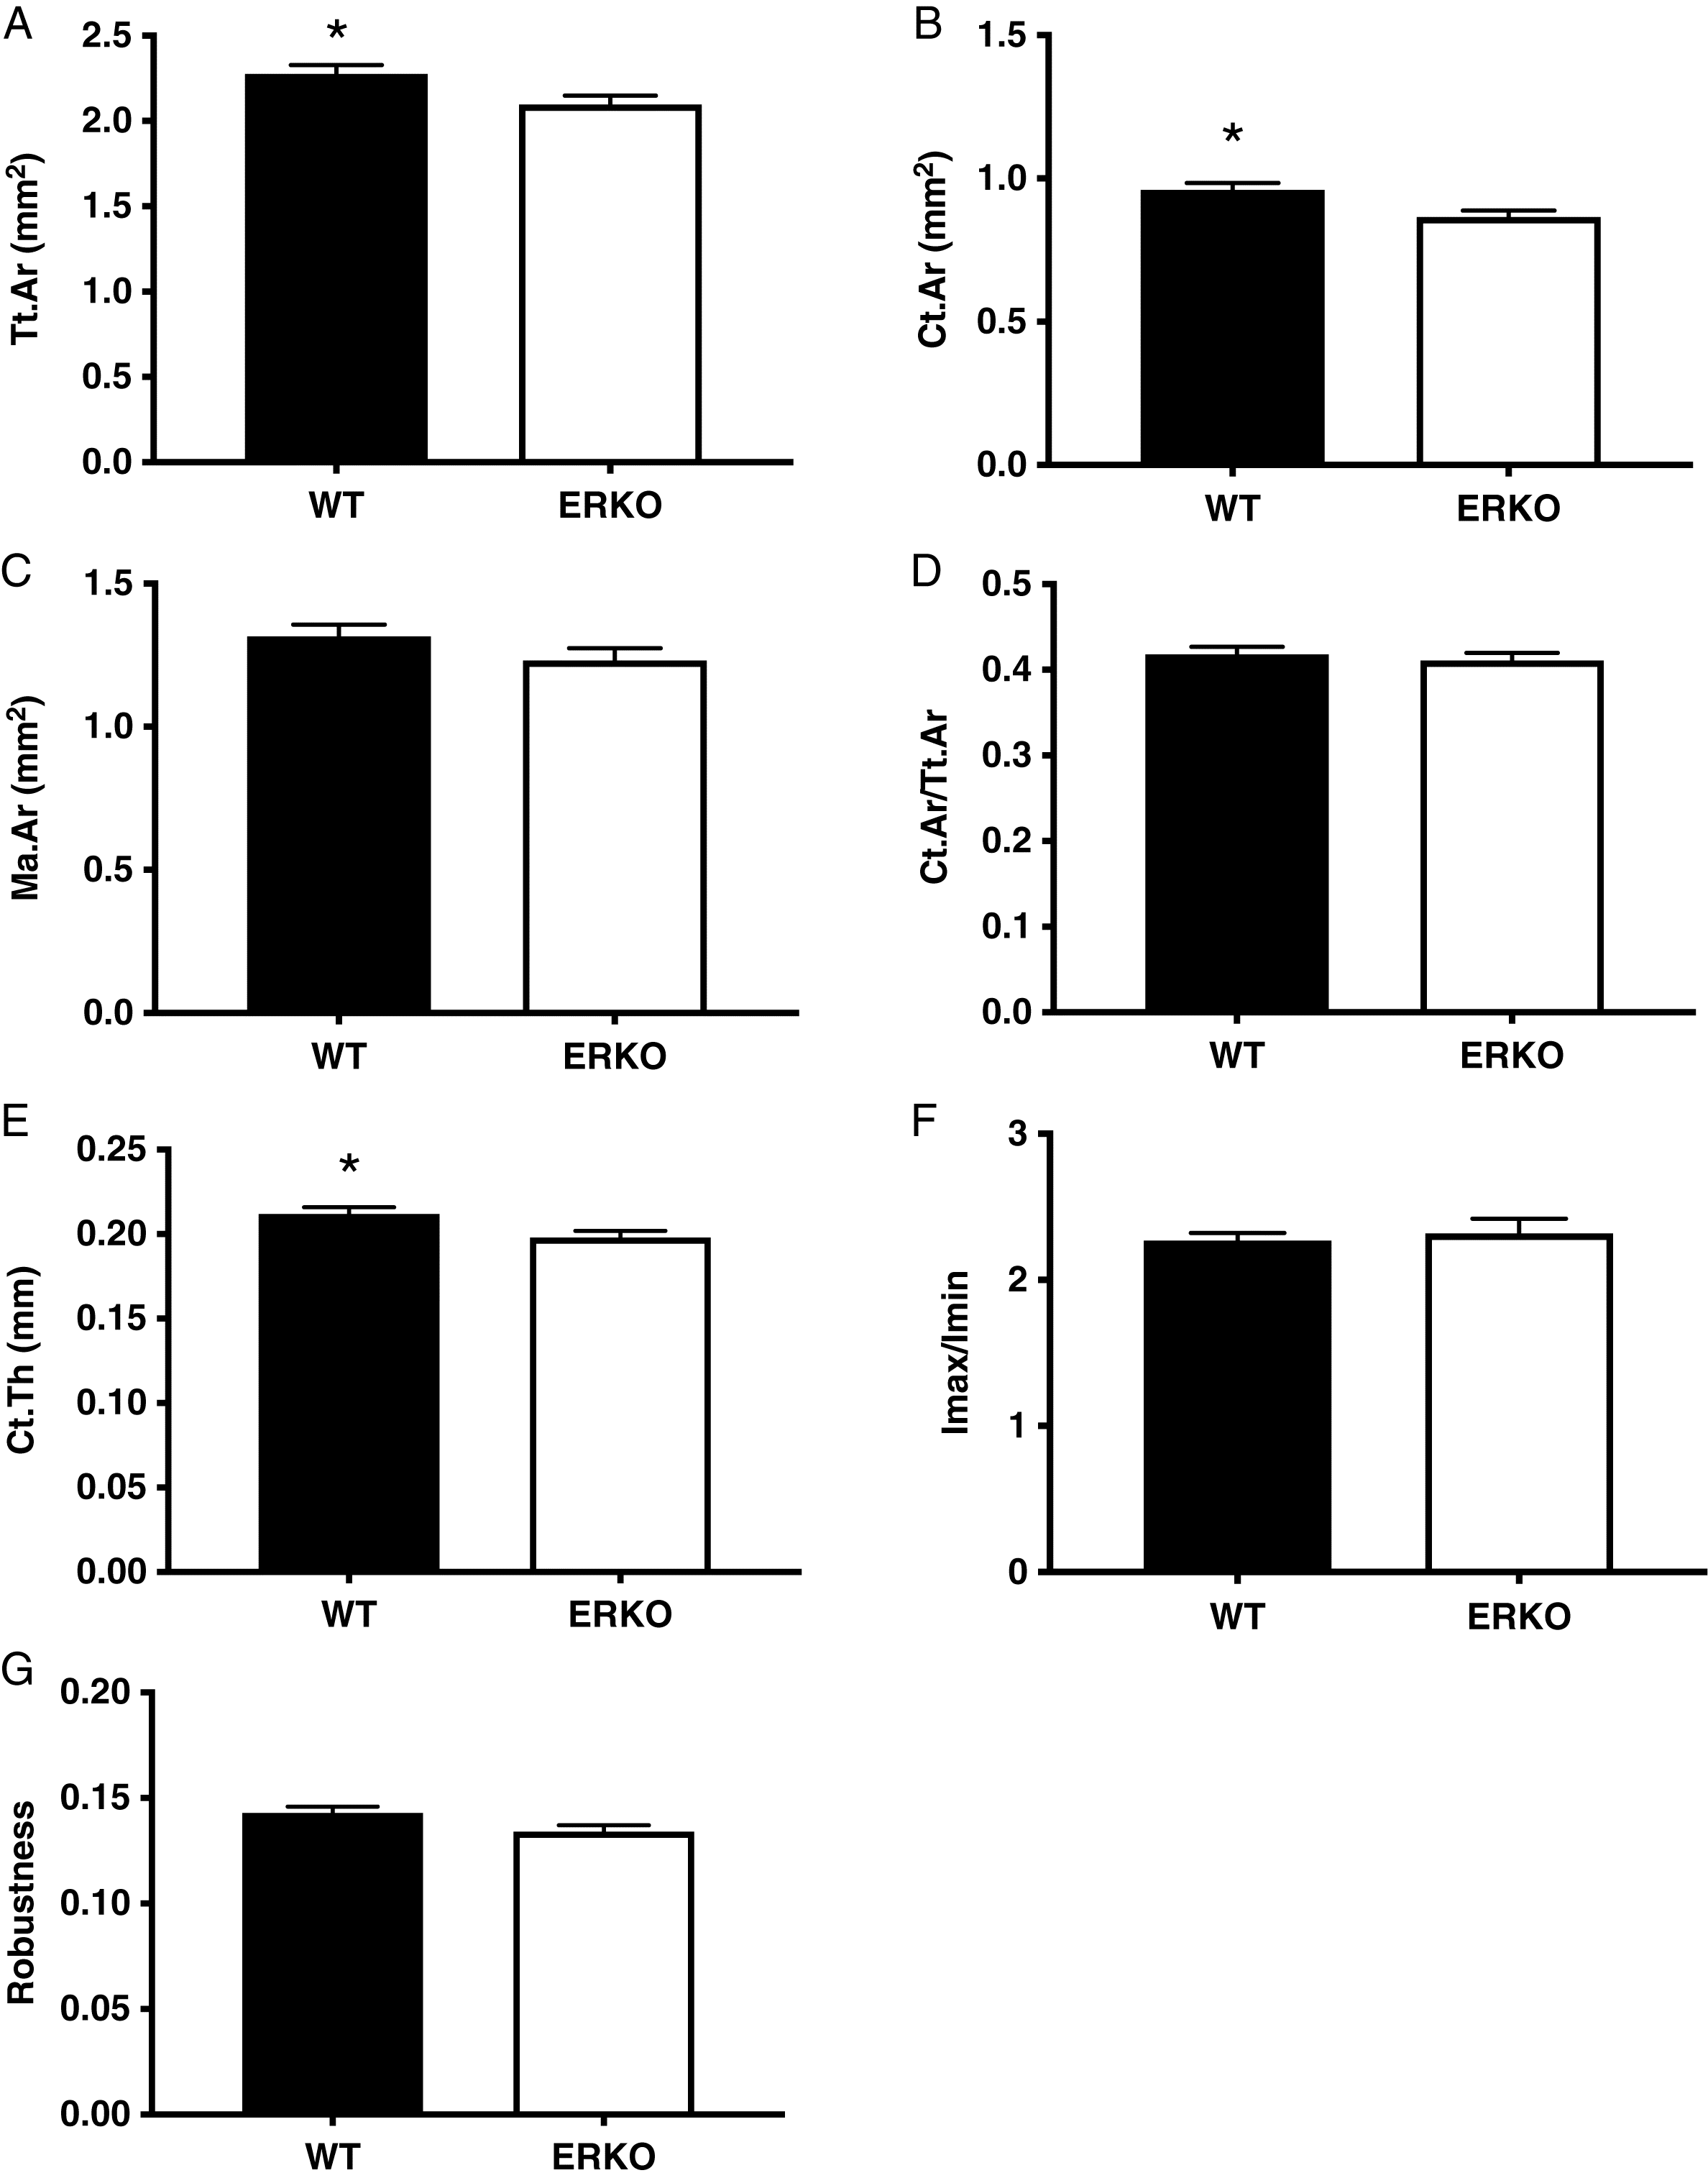
Femur length was not different between WT and ERKO animals (WT: 15.80 ± 0.17 mm and ERKO: 15.73 ± 0.17 mm; p = 0.788), though there was a trend toward an increase in robustness in the WT group over the ERKO animals (WT: 0.143 ± 0.003 mm and ERKO: 0.134 ± 0.003 mm; p = 0.075). ERKO mice showed significantly lower Tt.Ar (ERKO: 2.096 ± 0.052 mm2 and WT: 2.277 ± 0.052 mm2; p = 0.042), Ct.Ar (ERKO: 0.865 ± 0.023 mm2 and WT: 0.961 ± 0.023 mm2; p = 0.018), and Ct.Th (ERKO: 0.198 ± 0.004 mm and WT: 0.212 ± 0.004 mm; p = 0.047) compared with WT animals. There were no differences between groups in Ma.Ar (WT: 1.315 ± 0.042 mm2 and ERKO: 1.232 ± 0.042 mm2; p = 0.205) or Ct.Ar/Tt.Ar (WT: 0.418 ± 0.009 and ERKO: 0.411 ± 0.009; p = 0.629). No differences were seen in the Imax/Imin ratio, a measure of the circularity of the diaphysis (Shaw and Stock 2009), between groups (WT: 2.287 ± 0.113 and ERKO: 2.364 ± 0.113; p = 0.655) (Fig. 1).
Fig. 1.
Fig. 1. Cortical geometry of the femur in male ERα−/− mice (ERKO) compared with wild-type (WT) counterparts. (A) Total area, (B) cortical area, (C) marrow area, (D) cortical-to-total area ratio, (E) cortical thickness, (F) Imax/Imin, and (G) robustness. Data are adjusted mean ± SEM, n = 6 per group. Significance between groups (p < 0.05) is indicated by asterisk (*). Note: Tt.Ar, total cross-sectional area inside the periosteal envelope; Ct.Ar, cortical bone area; Ma. Ar, marrow area; Ct.Ar/Tt.Ar, cortical area fraction; Ct.Th, mean cortical thickness.

Femoral trabecular microarchitecture

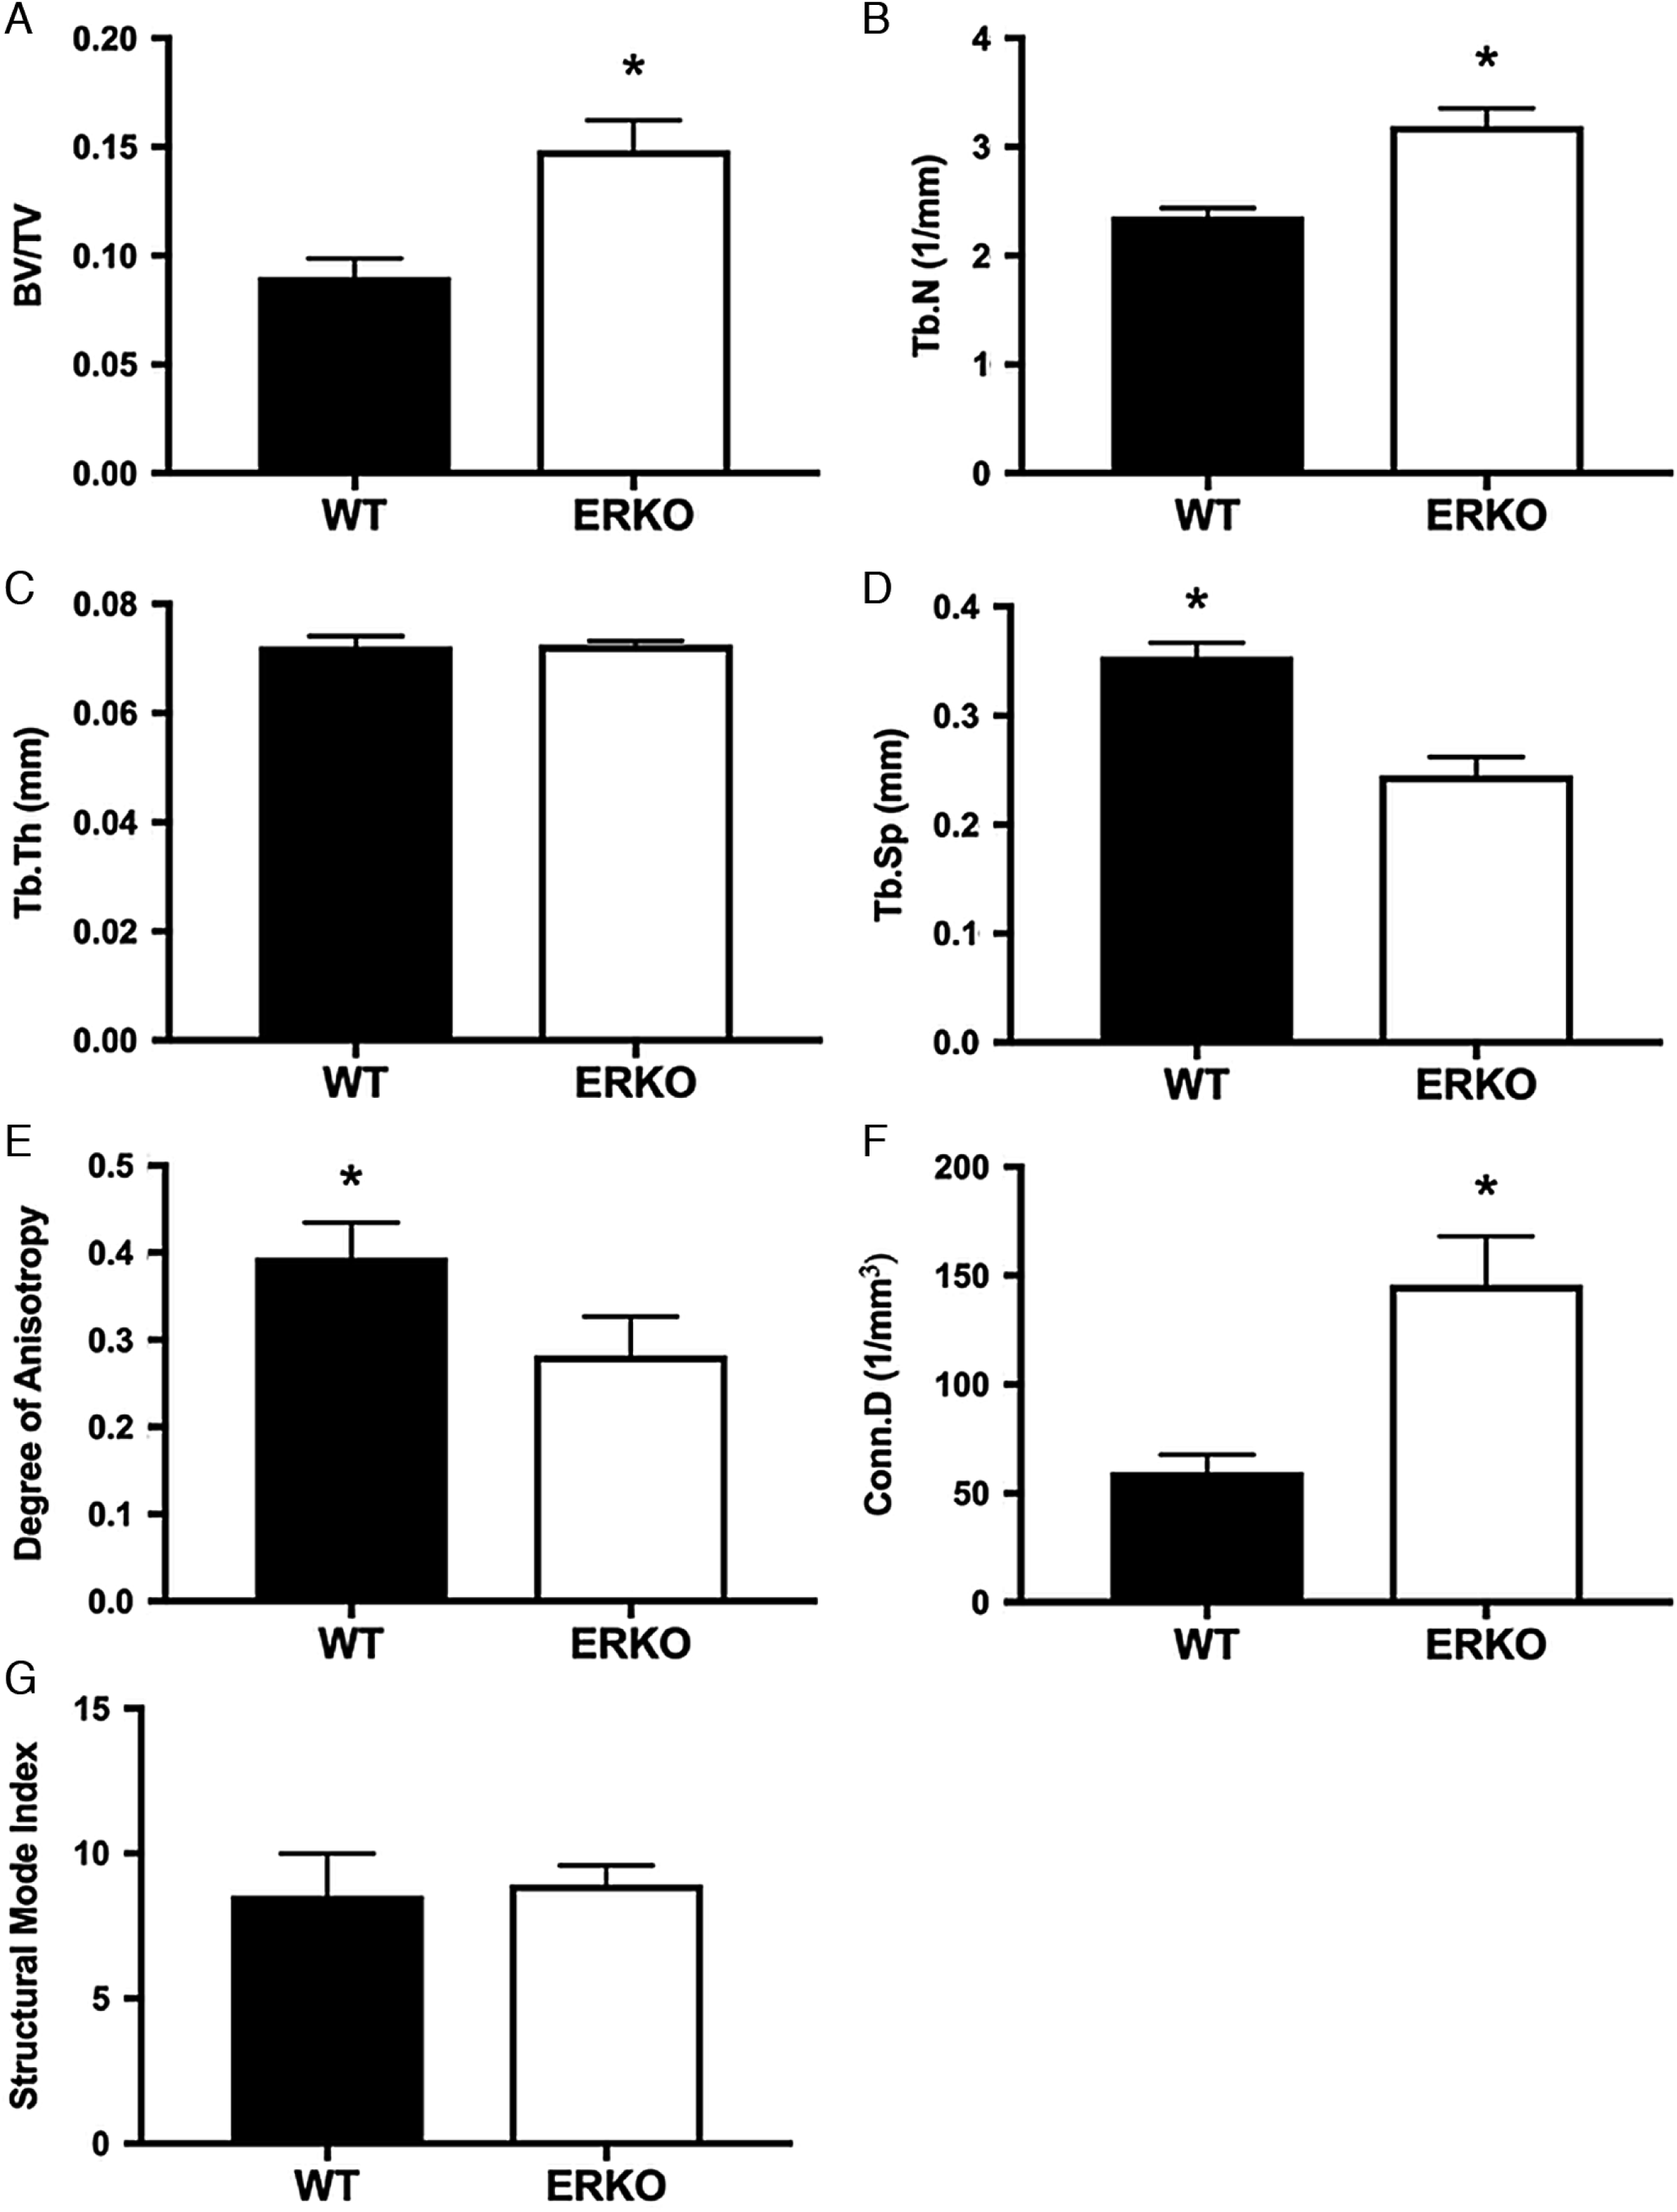
ERKO mice had significantly higher BV/TV (ERKO: 0.149 ± 0.011 and WT: 0.090 ± 0.011; p = 0.002), Tb.N (ERKO: 3.192 ± 0.128 mm−1 and WT: 2.360 ± 0.128 mm−1; p = 0.001), and Conn.D (ERKO: 145.69 ± 16.76 mm−3 and WT: 59.76 ± 16.76 mm−3; p = 0.005), compared with WT animals. ERKO mice had significantly lower Tb.Sp (ERKO: 0.245 ± 0.015 mm and WT: 0.354 ± 0.015 mm; p = 0.001) and DA (ERKO: 0.263 ± 0.029 and WT: 0.373 ± 0.027; p = 0.021) compared with WT animals. Tb.Th (ERKO: 0.073 ± 0.001 mm and WT: 0.072 ± 0.001 mm; p = 0.875) and SMI (ERKO: 8.927 ± 1.120 and WT: 8.548 ± 1.120; p = 0.816) were not different between groups (Fig. 2).
Fig. 2.
Fig. 2. Trabecular microarchitecture of the distal femur in male ERα−/− mice (ERKO) compared with wild-type (WT) counterparts. (A) Trabecular bone volume, (B) trabecular number, (C) trabecular thickness, (D) trabecular separation, (E) degree of anisotropy, (F) connectivity density, and (G) structural mode index. Data are mean ± SEM, n = 6 per group. Significance between groups (p < 0.05) is indicated by asterisk (*). Note: BV/TV, bone volume fraction; Tb.n, trabecular number; Tb.Th, mean trabecular thickness; Tb.Sp, trabecular separation; Conn.D, connectivity density.

Vertebral trabecular microarchitecture

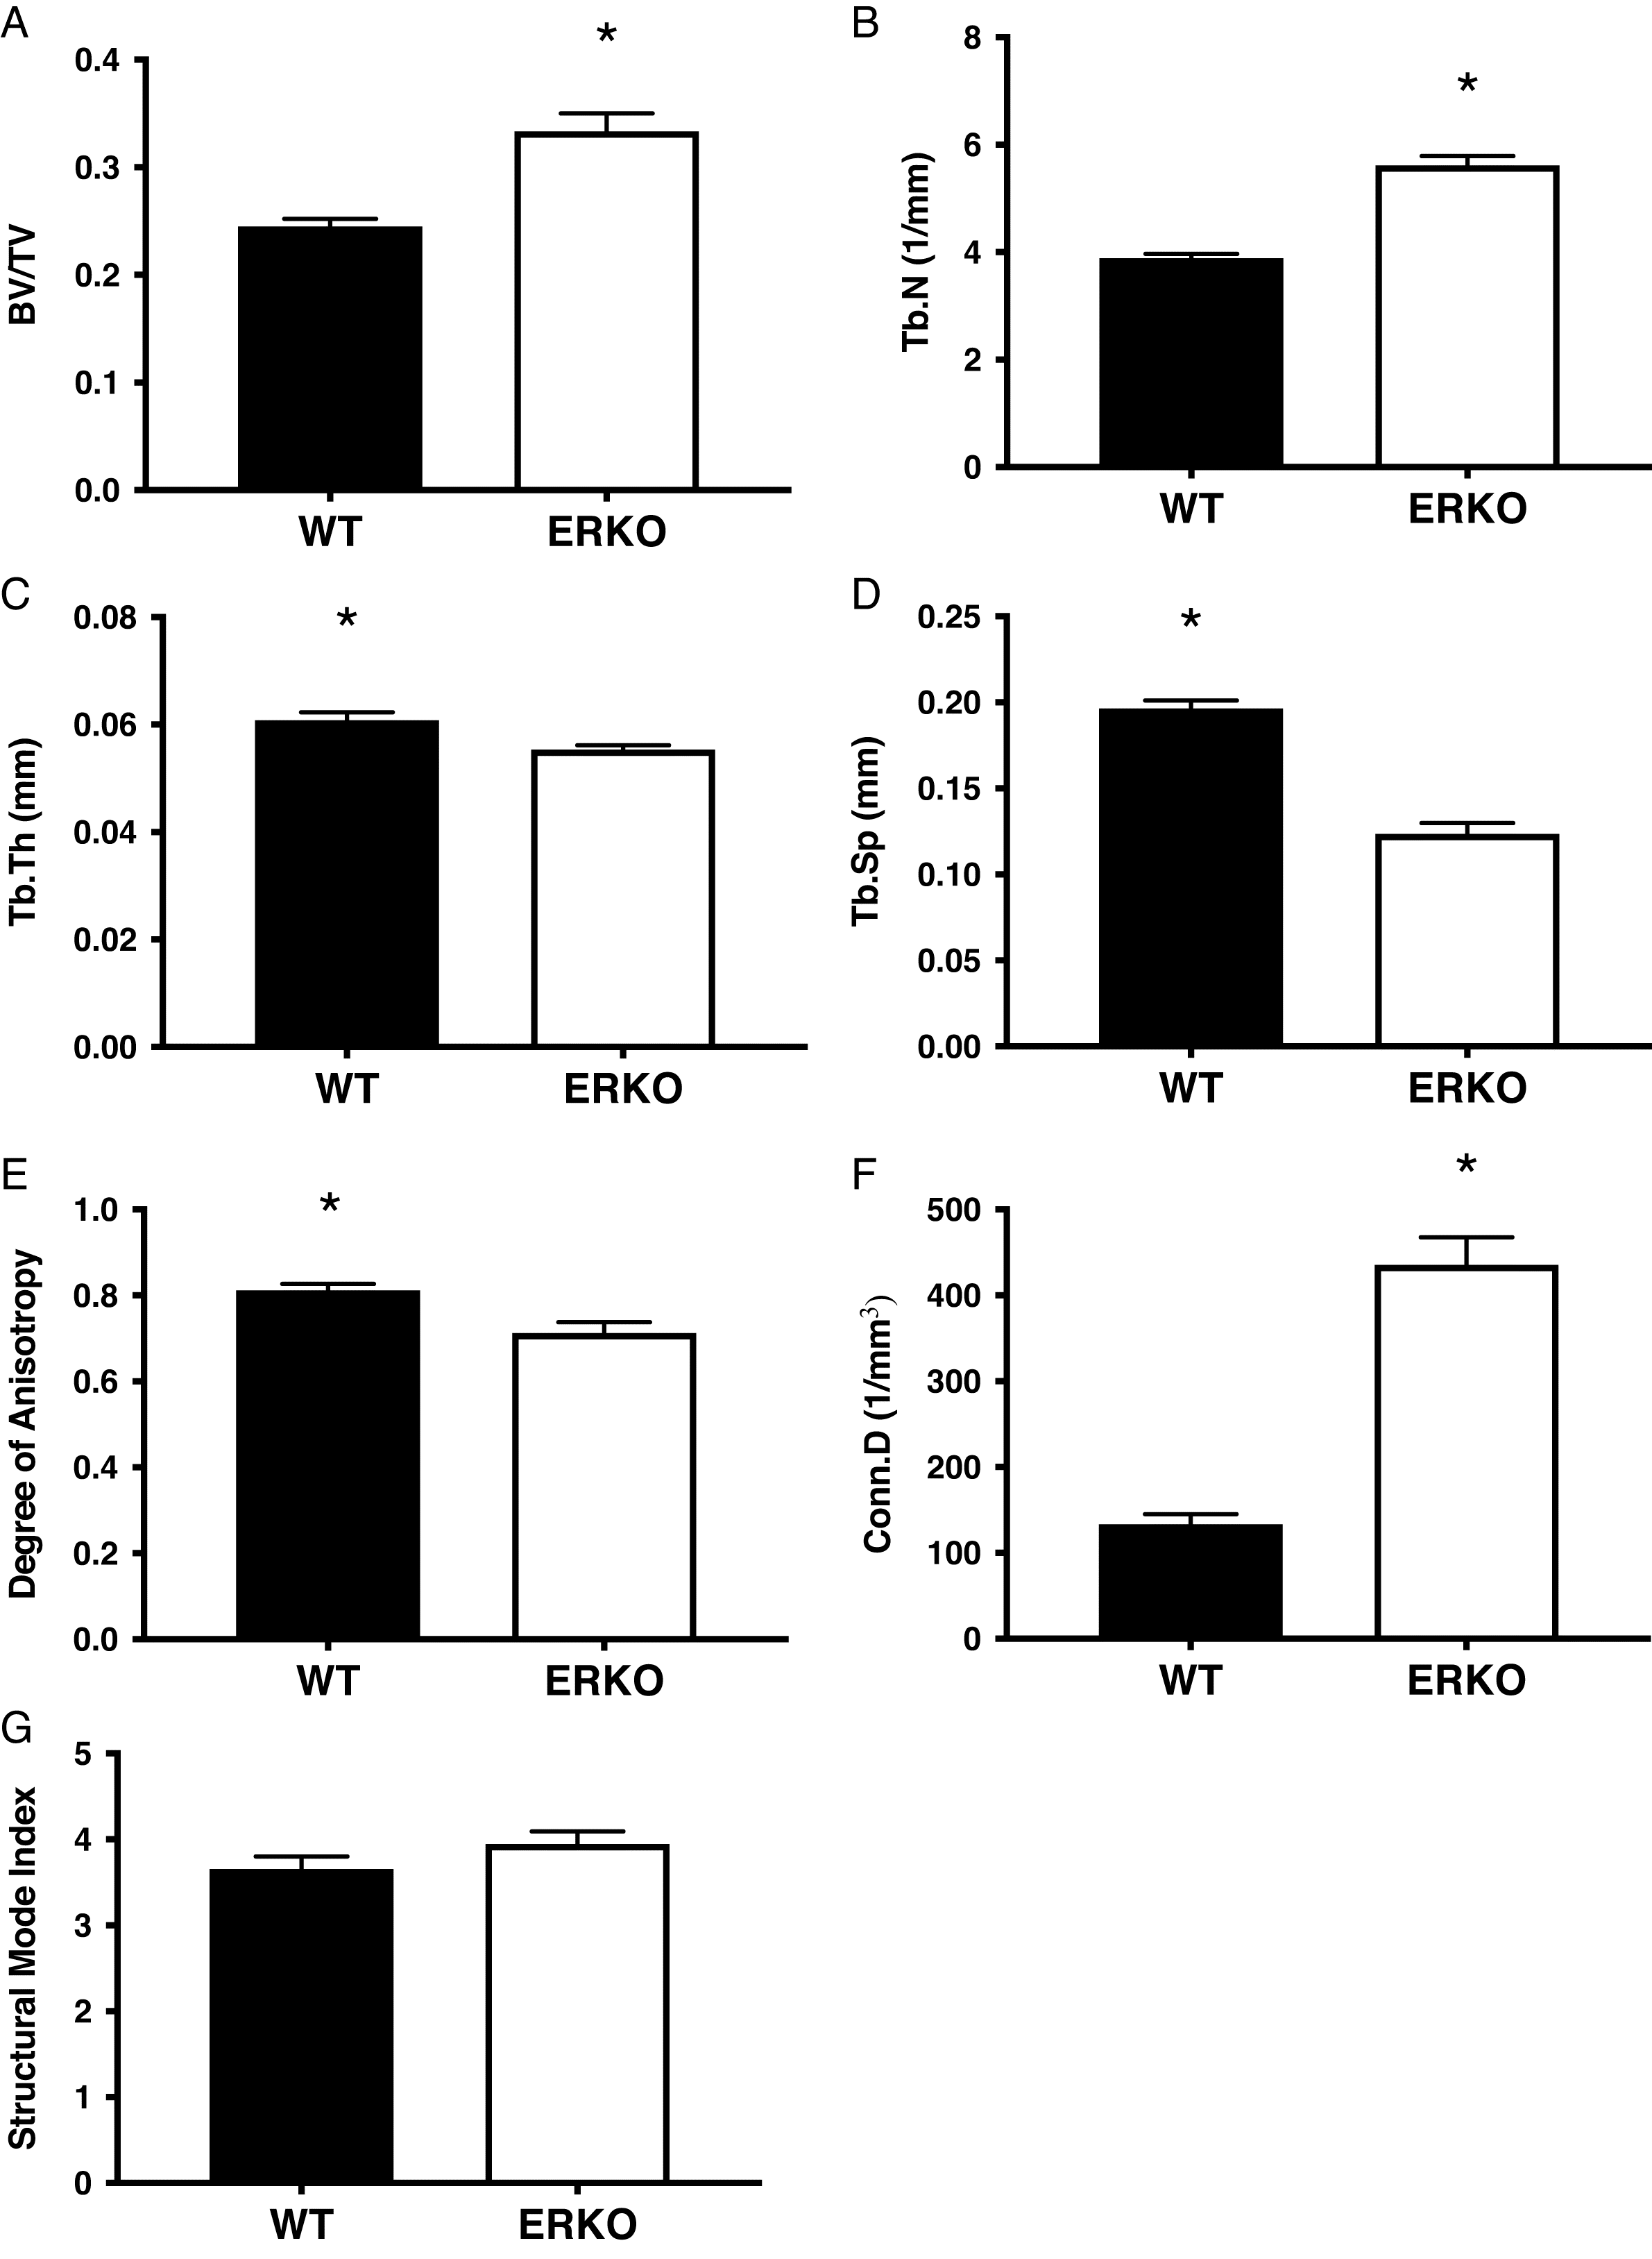
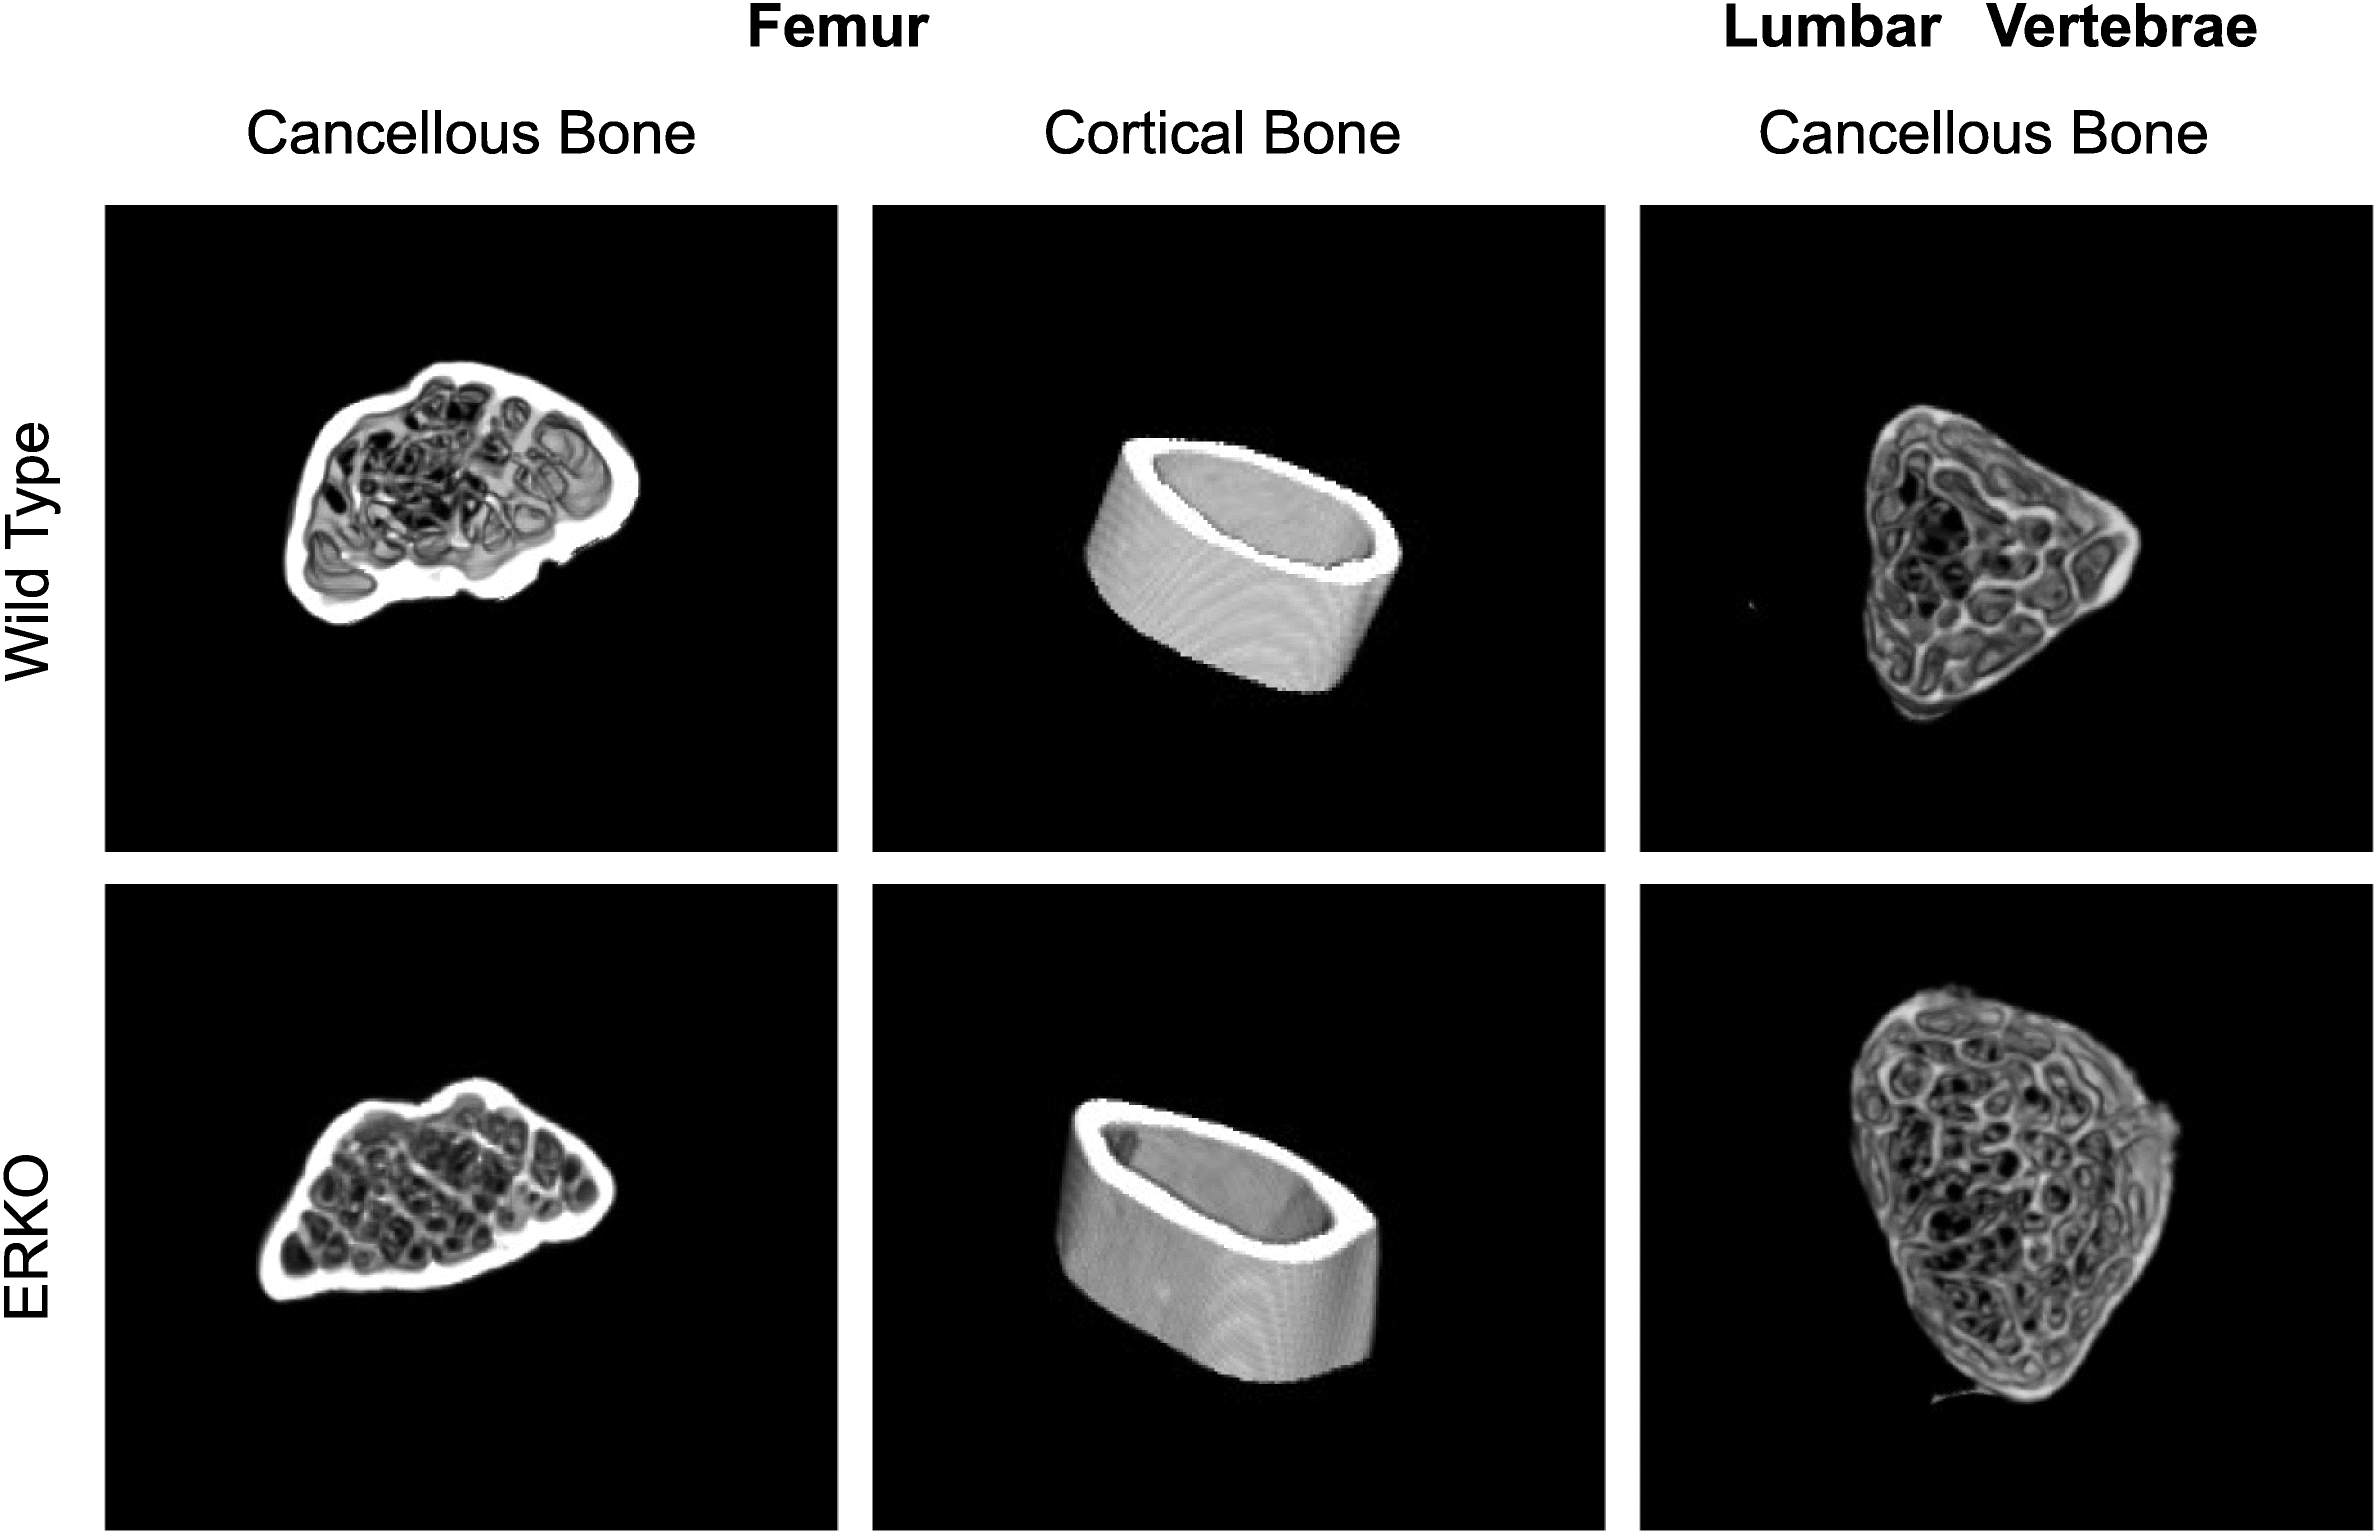
ERKO mice had significantly higher BV/TV (ERKO: 0.334 ± 0.013 and WT: 0.245 ± 0.013; p = 0.001), Tb.N. (ERKO: 5.616 ± 0.137 mm−1 and WT: 3.891 ± 0.137 mm−1; p = 0.001), and Conn.D (ERKO: 435.42 ± 24.28 mm−3 and KO: 133.36 ± 24.28 mm−3; p = 0.001) compared with WT mice. ERKO mice had significantly lower Tb.Th (ERKO: 0.055 ± 0.001 mm and WT: 0.061 ± 0.001 mm; p = 0.008), Tb.Sp. (ERKO: 0.124 ± 0.005 mm and WT: 0.197 ± 0.005; p = 0.001), and DA (ERKO: 0.713 ± 0.021 and WT: 0.812 ± 0.021; p = 0.007) compared with WT mice. There was no significant difference in SMI (ERKO: 3.946 ± 0.146 and WT: 3.656 ± 0.146; p = 0.187) between groups (Figs. 3 and 4).
Fig. 3.
Fig. 3. Trabecular microarchitecture of the lumbar vertebrae in male ERα−/− mice (ERKO) compared with wild-type (WT) counterparts. (A) Trabecular bone volume, (B) trabecular number, (C) trabecular thickness, (D) trabecular separation, (E) degree of anisotropy, (F) connectivity density, and (G) structural mode index. Data are mean ± SEM, n = 6 per group. Significance between groups (p < 0.05) is indicated by asterisk (*). Note: BV/TV, bone volume fraction; Tb.n, trabecular number; Tb.th, mean trabecular thickness; Tb.Sp, trabecular separation; Conn.D, connectivity density.
Fig. 4.
Fig. 4. 3-D reconstructions of regions of interest in cortical and cancellous bone in ERα−/− mice (ERKO) compared with wild-type (WT) counterparts.

Femoral cortical collagen and AGE content

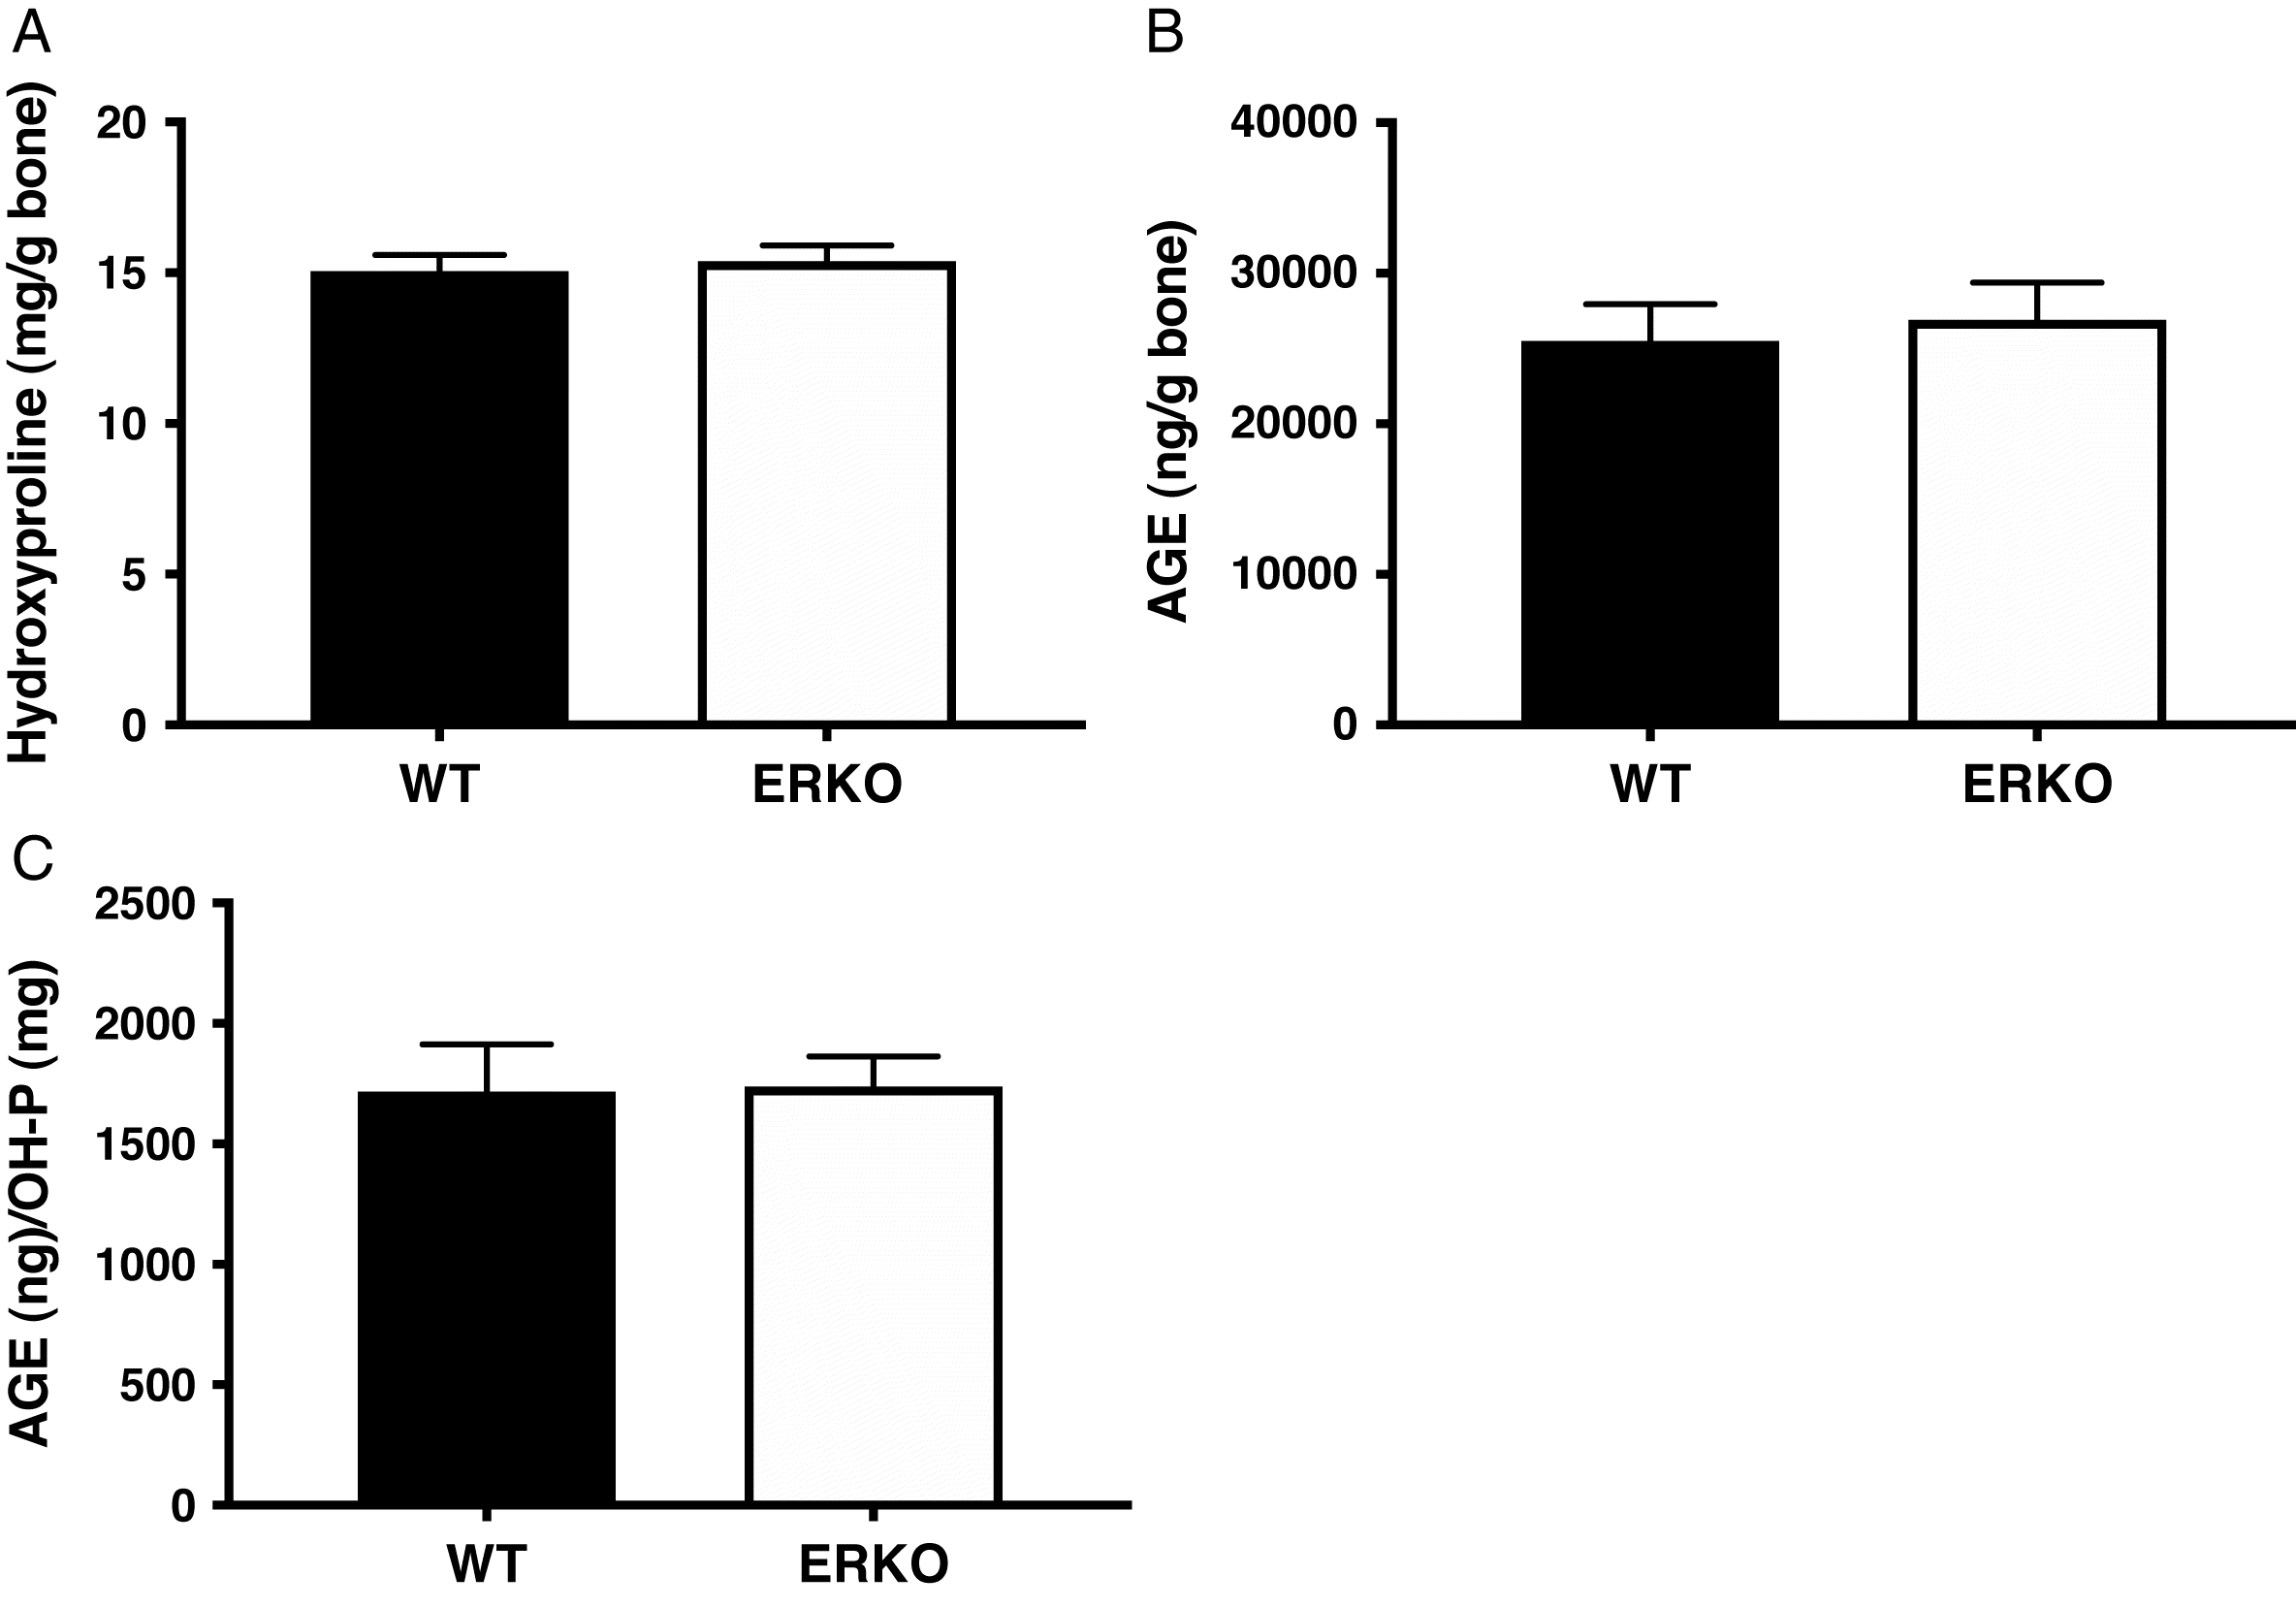
No differences were seen in total femoral collagen content (mg hydroxyproline/g bone) between groups (WT: 15.05 ± 1.32 and ERKO: 15.39 ± 1.34; p = 0.654). There were no differences in total femoral AGE content (ng quinine/mg bone) between groups (WT: 25.53 ± 5.93 and ERKO: 26.92 ± 6.49; p = 0.697). Relative to total collagen content, there also were no differences in AGE content (ng quinine/mg hydroxyproline) between groups (WT: 1718.1 ± 477.6 and ERKO: 1739.0 ± 332.3; p = 0.928) (Fig. 5).
Fig. 5.
Fig. 5. Femoral cortical collagen and advanced glycated end-products in male ERα−/− mice (ERKO) compared with wild-type (WT) counterparts. (A) Hydroxyproline, (B) advanced glycated end-products (AGE), and (C) AGE normalized to hydroxyproline content. Data are mean ± SEM, n = 6 per group. Significance between groups (p < 0.05) is indicated by asterisk (*).

Ash and mineral content

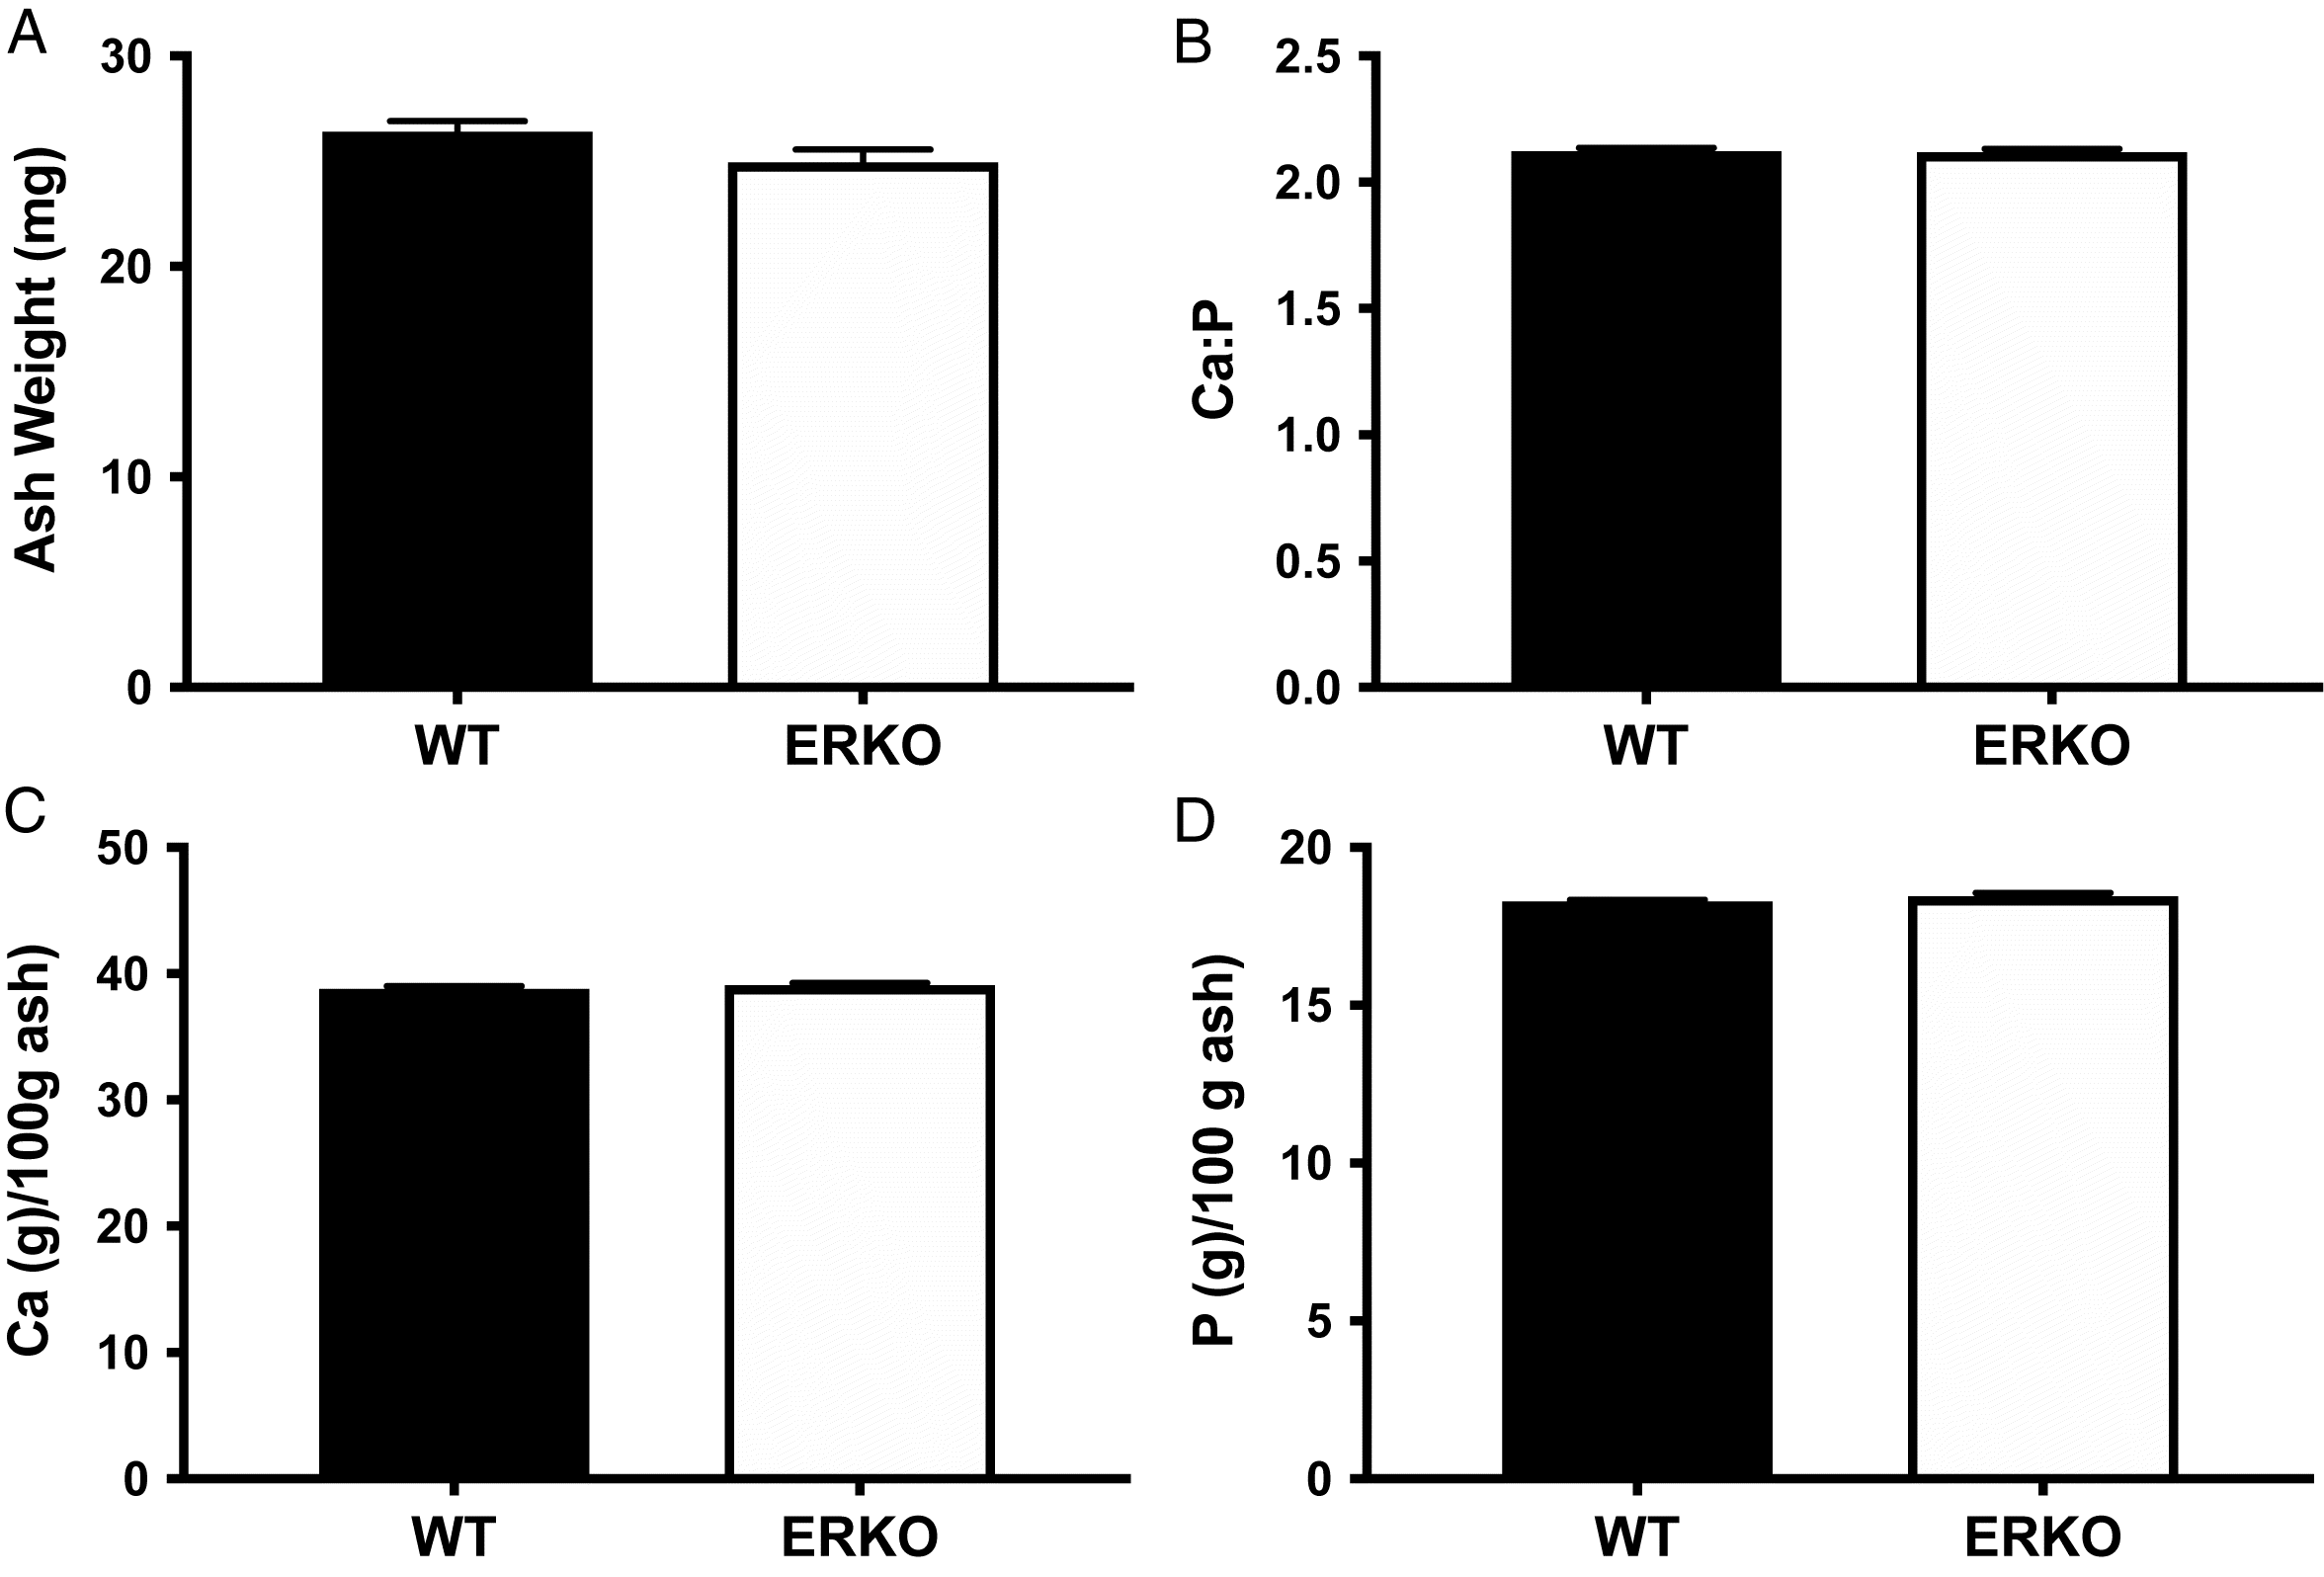
There were no differences in total ash weight between groups (WT: 26.42 ± 0.55 mg and ERKO 24.97 + 0.55 mg; p = 0.092). No differences in calcium content (g Ca/100 g ash) were detected between groups (WT: 38.83 ± 0.45 and ERKO: 39.11 ± 0.42; p = 0.286). There were no differences in phosphorus content (g P/100 g ash; WT: 18.26 ± 0.14 and ERKO: 18.46 ± 0.26; p = 0.181) or the calcium to phosphorus ratio between groups (WT: 2.12 ± 0.03 and ERKO: 2.12 ± 0.03; p = 0.834) (Fig. 6).
Fig. 6.
Fig. 6. Forelimb ash and mineral content in male ERα−/− mice (ERKO) compared with wild-type (WT) counterparts. (A) Total ash weight, (B) calcium-to-phosphorus ratio, (C) calcium, and (D) phosphorus. Data are mean ± SEM, n = 6 per group. Significance between groups (p < 0.05) is indicated by asterisk (*).

Osteocyte sclerostin expression

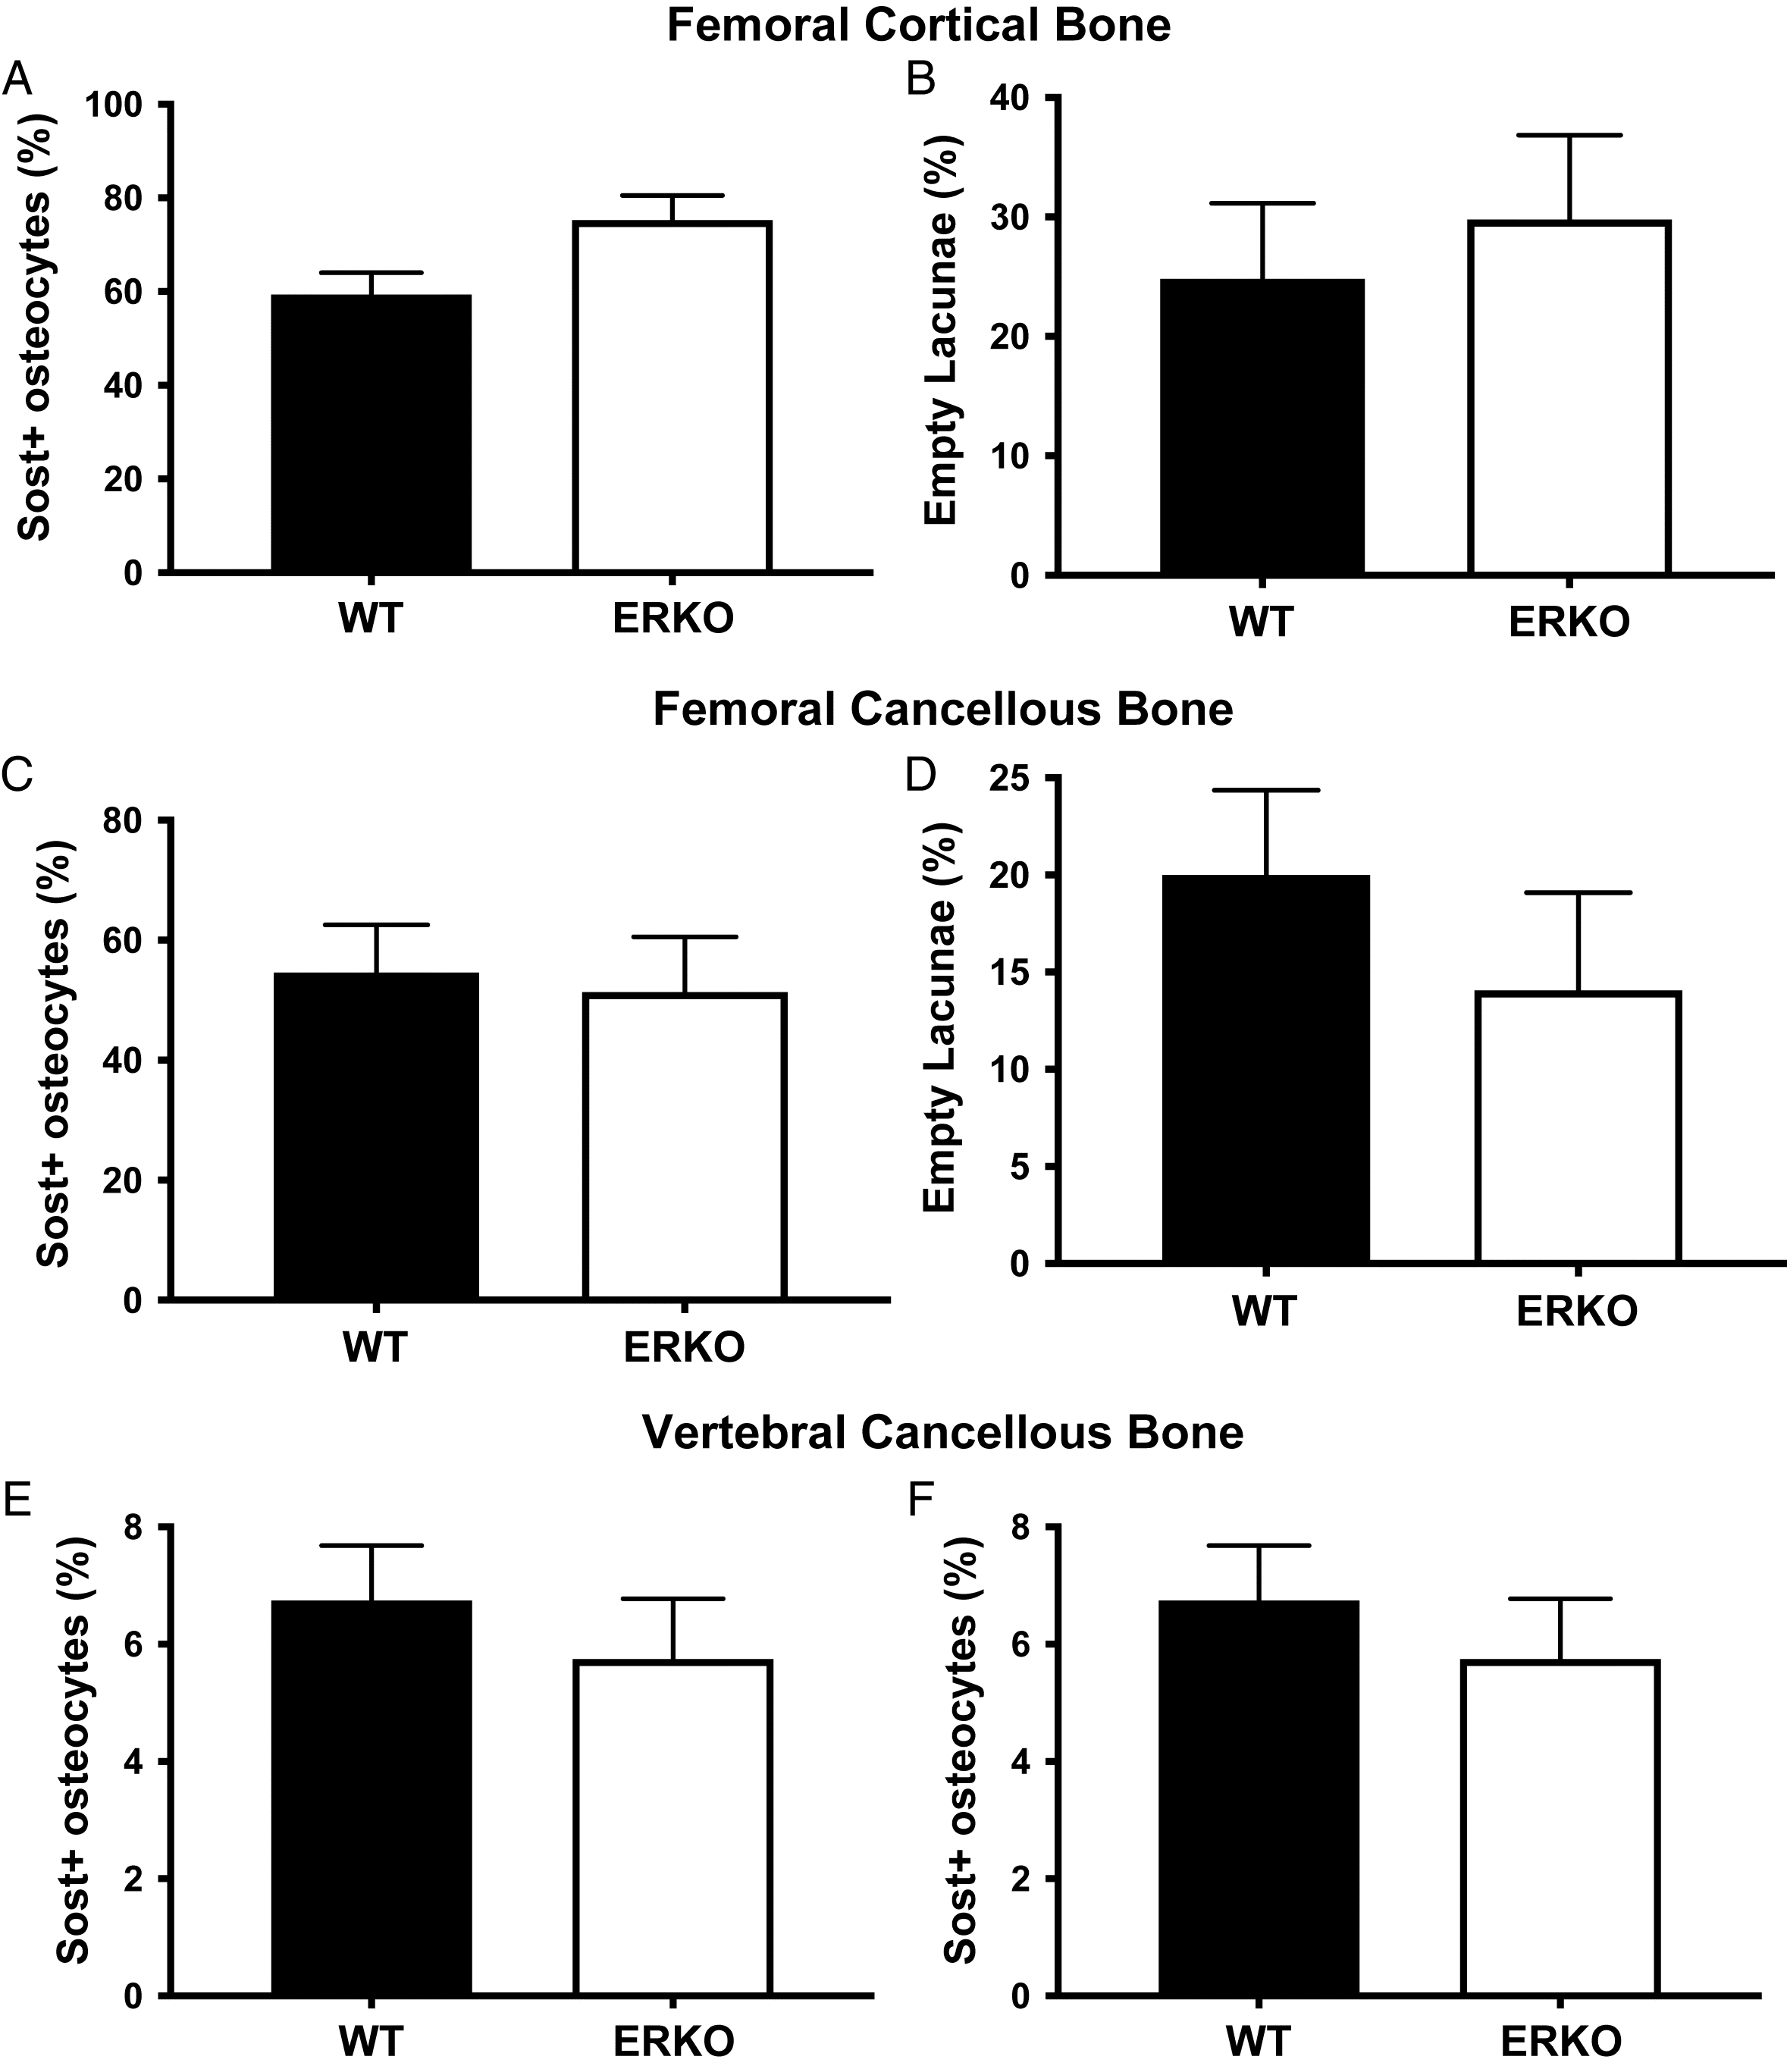
There was a trend towards an increase in percentage of Sost+ osteocytes in ERKO animals compared with WT (WT: 59.35% ± 4.69% and ERKO: 75.30% ± 5.25%; p = 0.058) in the cortical bone of the femoral diaphysis, but there were no differences in cancellous bone of the femoral metaphysis (WT: 54.61% ± 7.93% and ERKO: 51.39% ± 9.15%; p = 0.801) or the lumbar vertebrae (WT: 6.75% ± 0.94% and ERKO: 5.75% ± 1.03%; p = 0.491). No differences were detected in percentage of empty lacunae between WT and ERKO animals in cortical bone of the femoral diaphysis (WT: 24.82% ± 6.32% and ERKO: 29.79% ± 7.07%; p = 0.617), or cancellous bone of the femoral metaphysis (WT: 20.01% ± 4.35% and ERKO: 14.07% ± 5.03%; p = 0.413), or the lumbar vertebrae (WT: 13.31% ± 2.85% and ERKO: 20.55% ± 3.12%; p = 0.119) (Figs. 7 and 8).
Fig. 7.
Fig. 7. Osteocyte sclerostin expression and empty lacunae in male ERα−/− mice (ERKO) compared with wild-type (WT) counterparts. (A) Percent Sost+ osteocytes in cortical bone, (B) percent empty lacunae in cortical bone, (C) percent Sost+ osteocytes in cancellous bone of the femur, (D) percent empty lacunae in cancellous bone of the femur, (E) percent Sost+ osteocytes in cancellous bone of the vertebrae, and (F) percent empty lacunae in cancellous bone of vertebrae. Data are mean ± SEM, n = 6 per group. Significance between groups (p < 0.05) is indicated by asterisk (*). Note: Sost+, sclerostin positive.
Fig. 8.
Fig. 8. Representative photos of sclerostin staining in cortical and cancellous bone in male ERα−/− mice (ERKO) and wild-type (WT) counterparts. Scale bar represents 100 μm. Note: Sost+, sclerostin positive; Sost-, sclerostin negative.

Metabolic influences on skeletal outcomes

Since ERKO can alter metabolic function, and metabolic health can have significant impact on the skeletal phenotype, we determined whether impaired metabolic health was associated with any skeletal outcomes. There were significant positive correlations between circulating fasting glucose and BV/TV of the femoral distal metaphysis (r = 0.666, p = 0.018), Tb.N (r = 0.670, p = 0.017), and Conn.D (r = 0.623, p = 0.031). There were significant negative correlations between circulating fasting glucose and Tb.Sp (r = −0.668, p = 0.018) and DA (r = −0.634, p = 0.036) of the femoral distal metaphysis. In the lumbar vertebrae, there were significant positive correlations between fasting glucose and BV/TV (r = 0.672, p = 0.017) and Tb.N (r = 0.594, p = 0.042), and a significant negative correlation between fasting glucose and Tb.Sp. (r = −0.622, p = 0.031).
We tested trabecular outcomes with fasting glucose as a covariate to assess the influence of circulating glucose on the group differences seen. In the femoral distal metaphysis, significant differences between groups remained in Tb.N (without glucose: ERKO: 3.192 ± 0.128 mm−1 and WT: 2.360 ± 0.128 mm−1, p = 0.001; with glucose: ERKO: 3.111 ± 0.143 mm−1 and WT 2.441 ± 0.143 mm−1, p = 0.015) and Tb.Sp (without glucose: ERKO: 0.245 ± 0.015 mm and WT: 0.354 ± 0.015 mm, p = 0.001; with glucose: ERKO: 0.254 ± 0.017 and WT: 0.345 ± 0.017, p = 0.008) when glucose was included as a covariate. Significant group differences (KO vs. WT) changed to trending group differences in BV/TV (without glucose: ERKO: 0.149 ± 0.011 and WT: 0.090 ± 0.011, p = 0.002; with glucose: ERKO: 0.142 ± 0.013 and WT: 0.097 ± 0.013, p = 0.056) and Conn.D (without glucose: ERKO: 145.69 ± 16.76 mm−3 and WT: 59.76 ± 16.76 mm−3, p = 0.005; with glucose: ERKO: 136.72 ± 19.21 mm−3 and WT: 68.73 ± 19.21 mm−3, p = 0.051). Significant group differences in DA were abolished when circulating fasting glucose was included as a covariate (without glucose: ERKO: 0.263 ± 0.029 and WT: 0.373 ± 0.027, p = 0.021; with glucose: ERKO: 0.282 ± 0.034 and WT: 0.358 ± 0.030, p = 0.172). In the lumbar vertebrae, significant group differences remained in BV/TV (without glucose: ERKO: 0.334 ± 0.013 and WT: 0.245 ± 0.013, p = 0.001; with glucose: ERKO: 0.325 ± 0.014 and WT: 0.253 ± 0.014, p = 0.011), Tb.N (without glucose: ERKO: 5.616 ± 0.137 mm−1 and WT: 3.891 ± 0.137 mm−1, p = 0.001; with glucose: ERKO: 5.603 ± 0.165 mm−1 and WT: 3.904 ± 0.165 mm−1, p = 0.001), and Tb.Sp (without glucose: ERKO: 0.124 ± 0.005 mm and WT: 0.197 ± 0.005, p = 0.001; with glucose: ERKO: 0.125 ± 0.006 mm and WT: 0.195 ± 0.006, p = 0.001). There were no significant relationships between circulating estradiol concentrations, fasting insulin concentrations, or percentage Sost+ osteocytes and other outcomes.

Discussion

In this study, we showed that ERKO had differential effects on cancellous and cortical bone in aged male mice. ERKO animals showed changes in cancellous bone microarchitecture of the femoral distal metaphysis and lumbar vertebrae, which others have shown to be associated with increased fracture resistance (Ebbesen et al. 1999; Oxlund et al. 2001). By contrast, ERKO resulted in detrimental changes in cortical bone geometry of the femoral diaphysis compared with WT counterparts. This is the first study to assess sclerostin expression in a male ERKO model. ERKO did not increase sclerostin expression in cancellous bone of the distal femoral metaphysis or the lumbar vertebrae; however, sclerostin expression trended towards an increase in cortical bone of the femoral diaphysis. Furthermore, the skeletal effects of ERKO were not attributable to differences in overall metabolic health between ERKO and WT, implying that the skeletal phenotype is primarily attributed to the ERKO.
The morphological changes seen in the cortical bone in this study are supported by previous studies (Vidal et al. 2000; Lindberg et al. 2001; Callewaert et al. 2009). Estrogen and the estrogen receptors have significant, cell-specific roles in the development and maintenance of bone mass (reviewed in Khosla et al. 2012; Khalid and Krum 2016), which directly influence bone remodeling. Estrogen blocks osteocyte and osteoblast apoptosis, induces osteoblast differentiation, increases osteoclast apoptosis, and reduces osteoclast differentiation through a direct suppression of receptor activator of NFκB ligand (RANKL) expression (Syed and Khosla 2005; Khosla et al. 2012). Estrogen indirectly reduces osteoclast differentiation through increased expression of osteoprotegerin, a decoy receptor for RANKL (Shevde et al. 2000; Bord et al. 2003). ERα specifically is required for the maintenance of cortical bone mass, as we can see in cell-specific ERα knockouts. When ERα was deleted from osteoblast precursors, femoral BMD and cortical thickness were reduced compared with WT animals, indicating that ERα controls cortical bone formation through actions on progenitor cells (Almeida et al. 2013). This agrees with our results, since we only saw detrimental changes in cortical geometry and not in trabecular microarchitecture of the femur or vertebrae. However, when ERα was deleted from mature osteocytes only, trabecular bone volume of the lumbar vertebrae decreased, which is in contrast with our results (Windahl et al. 2013). This is most likely due to the difference in cell-type; the deletion of ERα in just the osteocyte possibly produces a small enough effect on estrogen signaling that ERβ is not required to compensate as it often does in a whole-body model, though further studies in this area are needed.
As expected in a global knockout model, the improvements in vertebral trabecular microarchitecture were consistent with those observed in the femur and support our original hypothesis. The improvements we saw in trabecular microarchitecture of the femur are also consistent with previous studies done in younger male ERKO mice (Lindberg et al. 2001; Callewaert et al. 2009). These improvements can be explained by the greater presence of ERβ in cancellous bone where ERβ and ERα appear to have similar actions and both play a role in maintaining total bone mass (Khalid and Krum 2016). However, one characteristic in our study that did not match previous studies is the lack of differences in femoral length. This could be in part due to the age of our animals compared with other studies, as mice do not fully close their epiphyseal plates and slowly continue longitudinal growth after sexual maturity (Kilborn et al. 2002; Jilka 2013).
Another possible cellular action of estrogen is the downregulation of sclerostin (Kim et al. 2015b), which would also directly affect bone remodeling. In women, estrogen treatment decreased sclerostin mRNA concentrations in bone biopsy samples (Fujita et al. 2014), but here we were the first to explore how a decrease in ERα could affect sclerostin expression in a male model. We hypothesized that, similar to previous female rodent models (Kim et al. 2012; Jia et al. 2014), the reduction in estrogen signaling would increase osteocyte sclerostin expression in male ERKO mice, as measured by immunohistochemistry. We observed increased osteocyte sclerostin expression in cortical bone in the ERKO animals that approached statistical significance (p = 0.058), supporting the hypothesis that ERα plays role in the control of sclerostin expression. Interestingly, we only saw this change in the cortical bone, which directly correlated with the morphological effects also seen in the cortical bone. Therefore, we propose that downregulation of sclerostin is an important cellular action of estrogen in the overall control of bone remodeling and bone mass maintenance in cortical bone, and further studies are warranted.
Bone mass declines with aging, due to an imbalance in bone formation and resorption that favors increased bone loss (Chan and Duque 2002; Khosla 2013). In addition, serum concentrations of sclerostin increase with age in humans (Khosla 2013; Roforth et al. 2014; Hay et al. 2016), although serum concentrations of sclerostin are not always reflective of sclerostin expression in the bone (Delgado-Calle et al. 2017). For instance, bone needle biopsies of the iliac crest showed no difference in bone levels of sclerostin mRNA between young and old women, despite an increase in circulating sclerostin with age (Roforth et al. 2014). However, in rodent models, there is a distinct increase in sclerostin as the animals age, whether measured by immunohistochemistry (Thompson et al. 2016) or protein and gene expression (Ota et al. 2013). Since the present study used an aged rodent model, it is possible that differences caused by ERα knockout were obscured by age-related increases in sclerostin (Ota et al. 2013; Thompson et al. 2016). Further studies are warranted to fully explore the importance of ERα in osteocyte sclerostin expression throughout the lifespan.
In addition to direct ERα-mediated effects on the bone, decreased ERα expression is associated with increased body weight (Callewaert et al. 2009) and metabolic dysfunction, including insulin resistance (Faulds et al. 2012) and type 2 diabetes (Bryzgalova et al. 2006). These metabolic health concerns are associated with decreased bone quality (Starup-Linde and Vestergaard 2016) and an increased risk of fracture (Janghorbani et al. 2007; Merlotti et al. 2010; Compston 2013). In this study, ERKO mice were metabolically unhealthy, characterized by increased body fat percentage, glucose intolerance, liver steatosis, and increased fasting glucose and triglyceride concentrations (Winn et al. 2018). We observed significant correlations between fasting glucose concentrations and trabecular microarchitecture outcomes, such as Tb.Sp, Tb.N, Tb.Th, BV/TV, DA, and Conn.D in both the femoral metaphysis and the lumbar vertebrae. Thus, to determine if the improvements in trabecular microarchitecture seen in the ERKO animals could be partly due to differences in glucose levels, we tested group differences with fasting glucose as a covariate. After accounting for differences in fasting glucose, the effect of ERKO on Tb.Sp, Tb.N, and Tb.Th remained, implying a direct effect of the loss of ERα activity on trabecular microarchitecture in the femur and vertebrae.
It is important to note that ERKO does not exactly mimic estrogen deficiency, given that estrogen signaling may occur via ERβ and there are ligand-independent effects of the ERα receptor (Manolagas et al. 2013). In addition, female ERKO mice tend to have higher circulating estrogen levels (Vico and Vanacker 2010), which could overemphasize the role of ERβ. However, in our study there were no differences in circulating estradiol between groups, which corroborates other studies done with male ERKO animals (Nanjappa et al. 2018; Winn et al. 2018). Another important note is that the knockout model used in this study is not a complete gene knockout, as it is achieved by splicing the neo cassette rather than removal of the full gene. In this and previous studies, this method has shown to be an effective knockout model, in that the interruption of the gene reduces estrogen receptor expression to levels undetectable by western blot (Lubahn et al. 1993; Iafrati et al. 1997). In addition, previous studies have shown that this knockout model has significantly reduced estrogen receptor activity, which manifests as significant phenotypic differences that can be attributed to the difference in the estrogen receptor gene (Lubahn et al. 1993; Eddy et al. 1996; Heine et al. 2000).
One limitation of this study was that these mice were global ERKO mice, which did not allow for the distinction between osteocyte-, osteoblast-, or osteoclast-specific actions. Other studies have aimed to elucidate these cell-specific actions (reviewed in Khalid and Krum (2016)), but none of them have looked at sclerostin expression, which makes this study novel. Another limitation was the lack of biomechanical strength data. While detrimental effects on cortical strength can be inferred, based on previous literature correlating a loss of cortical mass and thickness with a loss of biomechanical strength (Ammann and Rizzoli 2003), we did not have the ability to test to biomechanical strength due to previous cracks and fractures that were revealed in the μCT analysis. Biomechanical strength can also be effected by the material properties of the bone, such as mineral composition and heterogeneity, collage composition and amount of crosslinking, and crystallinity of the material (Bala and Seeman 2015; Unal et al. 2018). While we saw no differences in mineral or collagen composition, the effects of ERα on other material properties are worth exploring.
Conclusion

In conclusion, ERKO had differential effects on cortical and cancellous bone in aged male mice. Specifically, ERKO significantly improved trabecular microarchitecture of both the femur and lumbar vertebrae, but negatively altered cortical geometry of the femur, which supports a significant role for ERα in the maintenance of cortical bone mass. We also found a trend towards an increase in the percentage of Sost+ osteocytes in the cortical bone of the femoral diaphysis, suggesting a possible mechanism for the altered cortical geometry and thus a regulatory role for ERα in osteocyte sclerostin expression in cortical bone. Taken together, these data warrant further studies to explore the effect of ERKO on osteocyte sclerostin expression.

Acknowledgements

This study was supported in part by grants from National Institutes of Health (NIH) K01 HL-125503 (to J.P.) and American Egg Board #00050021 (to N.C.W.). The VUMC Hormone Assay and Analytical Services Core is supported by NIH grants DK059637 and DK020593. We greatly acknowledge the technical assistance of Michelle Gastecki and Gabriela Lin. We also thank the University of Missouri (MU) Veterinary Medicine Diagnostic Laboratory (VMDL) and the MU X-Ray Microanalysis Core (MizzoμX) for their technical assistance.

References

Almeida M, Iyer S, Martin-Millan M, Bartell SM, Han L, Ambrogini E, et al. 2013. Estrogen receptor-α signaling in osteoblast progenitors stimulates cortical bone accrual. The Journal of Clinical Investigation, 123(1): 394–404.
Ammann P, and Rizzoli R. 2003. Bone strength and its determinants. Osteoporosis International, 14: 13–18.
Bala Y, and Seeman E. 2015. Bone’s material constituents and their contribution to bone strength in health, disease, and treatment. Calcified Tissue International, 97: 308–326.
Bord S, Ireland DC, Beavan SR, and Compston JE. 2003. The effects of estrogen on osteoprotegerin, RANKL, and estrogen receptor expression in human osteoblasts. Bone, 32(2): 136–141.
Bouxsein ML, Boyd SK, Christiansen BA, Guldberg RE, Jepsen KJ, and Müller R. 2010. Guidelines for assessment of bone microstructure in rodents using micro-computed tomography. Journal of Bone and Mineral Research, 25(7): 1468–1486.
Bruker-microCT. 2012. Morphometric parameters measured by Skyscan™ CT—analyser software. Reference Manual. pp. 1–49 [online]: Available from bruker-microct.com/next/CTAn03.pdf.
Bryzgalova G, Gao H, Ahrén B, Zierath JR, Galuska D, Steiler TL, et al. 2006. Evidence that oestrogen receptor-α plays an important role in the regulation of glucose homeostasis in mice: insulin sensitivity in the liver. Diabetologia, 49: 588–597.
Callewaert F, Venken K, Ophoff J, De Gendt K, Torcasio A, van Lenthe GH, et al. 2009. Differential regulation of bone and body composition in male mice with combined inactivation of androgen and estrogen receptor-α. The FASEB Journal, 23(1): 232–240.
Chan GK, and Duque G. 2002. Age-related bone loss: old bone, new facts. Gerontology, 48(2): 62–71.
Compston J. 2013. Obesity and bone. Current Osteoporosis Reports, 11: 30–35.
Delgado-Calle J, Sato AY, and Bellido T. 2017. Role and mechanism of action of sclerostin in bone. Bone, 96: 29–37.
Di Nisio A, De Toni L, Speltra E, Rocca MS, Taglialavoro G, Ferlin A, et al. 2015. Regulation of sclerostin production in human male osteocytes by androgens: experimental and clinical evidence. Endocrinology, 156(12): 4534–4544.
Doube M, Kłosowski MM, Arganda-Carreras I, Cordelières FP, Dougherty RP, Jackson JS, et al. 2010. BoneJ: free and extensible bone image analysis in ImageJ. Bone, 47(6): 1076–1079.
Ebbesen EN, Thomsen JS, Beck-Nielsen H, Nepper-Rasmussen HJ, and Mosekilde L. 1999. Age- and gender-related differences in vertebral bone mass, density, and strength. Journal of Bone and Mineral Research, 14(8): 1394–1403.
Eddy EM, Washburn TF, Bunch DO, Goulding EH, Gladen BC, Lubahn DB, et al. 1996. Targeted disruption of the estrogen receptor gene in male mice causes alteration of spermatogenesis and infertility. Endocrinology, 137(11): 4796–4805.
Faulds MH, Zhao C, Dahlman-Wright K, and Gustafsson JÅ. 2012. The diversity of sex steroid action: regulation of metabolism by estrogen signaling. Journal of Endocrinology, 212: 3–12.
Fonseca H, Moreira-Gonçalves D, Coriolano HJ, and Duarte JA. 2014. Bone quality: the determinants of bone strength and fragility. Sports Medicine, 44(1): 37–53.
Fujita K, Roforth MM, Demaray S, McGregor U, Kirmani S, McCready LK, et al. 2014. Effects of estrogen on bone mRNA levels of sclerostin and other genes relevant to bone metabolism in postmenopausal women. Journal of Clinical Endocrinology and Metabolism, 99(1): E81–E88.
Hay E, Bouaziz W, Funck-Brentano T, and Cohen-Solal M. 2016. Sclerostin and bone aging: a mini-review. Gerontology, 62: 618–623.
Heine PA, Taylor JA, Iwamoto GA, Lubahn DB, and Cooke PS. 2000. Increased adipose tissue in male and female estrogen receptor-α knockout mice. Proceedings of the National Academy of Sciences of the United States of America, 97(23): 12729–12734.
Iafrati MD, Karas RH, Aronovitz M, Kim S, Sullivan TR Jr, Lubahn DB, et al. 1997. Estrogen inhibits the vascular injury response in estrogen receptor α-deficient mice. Nature Medicine, 3(5): 545–548.
Janghorbani M, Van Dam RM, Willett WC, and Hu FB. 2007. Systematic review of type 1 and type 2 diabetes mellitus and risk of fracture. American Journal of Epidemiology, 166(5): 495–505.
Jia HB, Ma JX, Ma XL, Yu JT, Feng R, Xu LY, et al. 2014. Estrogen alone or in combination with parathyroid hormone can decrease vertebral MEF2 and sclerostin expression and increase vertebral bone mass in ovariectomized rats. Osteoporosis International, 25: 2743–2754.
Jilka RL. 2013. The relevance of mouse models for investigating age-related bone loss in humans. The Journals of Gerontology Series A: Biological Sciences and Medical Sciences, 68(10): 1209–1217.
Khalid AB, and Krum SA. 2016. Estrogen receptors alpha and beta in bone. Bone, 87: 130–135.
Khosla S. 2013. Pathogenesis of age-related bone loss in humans. The Journals of Gerontology Series A: Biological Sciences and Medical Sciences, 68(10): 1226–1235.
Khosla S, Melton LJ, and Riggs BL. 2001. Estrogens and bone health in men. Calcified Tissue International, 69: 189–192.
Khosla S, Oursler MJ, and Monroe DG. 2012. Estrogen and the skeleton. Trends in Endocrinology & Metabolism, 23: 576–581.
Kilborn SH, Trudel G, and Uhthoff H. 2002. Review of growth plate closure compared with age at sexual maturity and lifespan in laboratory animals. Journal of the American Association for Animal Laboratory Science, 41(5): 21–26 [online]: Available from ingentaconnect.com/content/aalas/jaalas/2002/00000041/00000005/art00005#.
Kim BJ, Bae SJ, Lee SY, Lee YS, Baek JE, Park SY, et al. 2012. TNF-α mediates the stimulation of sclerostin expression in an estrogen-deficient condition. Biochemical and Biophysical Research Communications, 424: 170–175.
Kim RY, Yang HJ, Song YM, Kim IS, and Hwang SJ. 2015a. Estrogen modulates bone morphogenetic protein-induced sclerostin expression through the Wnt signaling pathway. Tissue Engineering Part A, 21(13–14): 2076–2088.
Kim W, Chung Y, Kim SH, Park S, Bae JH, Kim G, et al. 2015b. Increased sclerostin levels after further ablation of remnant estrogen by aromatase inhibitors. Endocrinology and Metabolism, 30: 58–64.
Lindberg MK, Erlandsson M, Alatalo SL, Windahl S, Andersson G, Halleen JM, et al. 2001. Estrogen receptor alpha, but not estrogen receptor beta, is involved in the regulation of the OPG/RANKL (osteoprotegerin/receptor activator of NF-kappa B ligand) ratio and serum interleukin-6 in male mice. The Journal of Endocrinology, 171(3): 425–433.
Lubahn DB, Moyer JS, Golding TS, Couse JF, Korach KS, and Smithies O. 1993. Alteration of reproductive function but not prenatal sexual development after insertional disruption of the mouse estrogen receptor gene. Proceedings of the National Academy of Sciences of the United States of America, 90: 11162–11166 [online]: Available from pnas.org/content/90/23/11162.full.pdf.
Manolagas SC, O’Brien CA, and Almeida M. 2013. The role of estrogen and androgen receptors in bone health and disease. Nature Reviews Endocrinology, 9(10): 699–712.
Merlotti D, Gennari L, Dotta F, Lauro D, and Nuti R. 2010. Mechanisms of impaired bone strength in type 1 and 2 diabetes. Nutrition, Metabolism and Cardiovascular Diseases, 20: 683–690.
Mirza FS, Padhi ID, Raisz LG, and Lorenzo JA. 2010. Serum sclerostin levels negatively correlate with parathyroid hormone levels and free estrogen index in postmenopausal women. The Journal of Clinical Endocrinology & Metabolism, 95(4): 1991–1997.
Mödder UI, Clowes JA, Hoey K, Peterson JM, McCready L, Oursler MJ, et al. 2011a. Relation of age, gender, and bone mass to circulating sclerostin levels in women and men. Journal of Bone and Mineral Research, 26(2): 373–379.
Mödder UI, Clowes JA, Hoey K, Peterson JM, McCready L, Oursler MJ, et al. 2011b. Regulation of circulating sclerostin levels by sex steroids in women and in men. Journal of Bone and Mineral Research, 26(1): 27–34.
Moustafa A, Sugiyama T, Prasad J, Zaman G, Gross TS, Lanyon LE, et al. 2012. Mechanical loading-related changes in osteocyte sclerostin expression in mice are more closely associated with the subsequent osteogenic response than the peak strains engendered. Osteoporosis International, 23(4): 1225–1234.
Nanjappa MK, Mesa AM, Tevosian SG, de Armas L, Hess RA, Bagchi IC, et al. 2018. Membrane estrogen receptor 1 is required for normal reproduction in male and female mice. Journal of Endocrinology and Reproduction, 21(1): 1–14.
Oftadeh R, Perez-Viloria M, Villa-Camacho JC, Vaziri A, and Nazarian A. 2015. Biomechanics and mechanobiology of trabecular bone: a review. Journal of Biomechanical Engineering, 137(1): 010802.
Onoe Y, Miyaura C, Ohta H, Nozawa S, and Suda T. 1997. Expression of estrogen receptor β in rat bone. Endocrinology, 138(10): 4509–4512.
Ota K, Quint P, Ruan M, Pederson L, Westendorf JJ, Khosla S, et al. 2013. Sclerostin is expressed in osteoclasts from aged mice and reduces osteoclast-mediated stimulation of mineralization. Journal of Cellular Biochemistry, 114(8): 1901–1907.
Oxlund H, Dalstra M, and Andreassen TT. 2001. Statin given perorally to adult rats increases cancellous bone mass and compressive strength. Calcified Tissue International, 69(5): 299–304.
Parikka V, Peng Z, Hentunen T, Risteli J, Elo T, Väänänen HK, et al. 2005. Estrogen responsiveness of bone formation in vitro and altered bone phenotype in aged estrogen receptor-a-deficient male and female mice. European Journal of Endocrinology, 152: 301–314.
Pereira M, Gohin S, Lund N, Hvid A, Smitham PJ, Oddy MJ, et al. 2017. Sclerostin does not play a major role in the pathogenesis of skeletal complications in type 2 diabetes mellitus. Osteoporosis International, 28(1): 309–320.
Piot A, Chapurlat RD, Claustrat B, and Szulc P. 2019. Relationship between sex steroids and deterioration of bone microarchitecture in older men: the prospective STRAMBO Study. Journal of Bone and Mineral Research, 34(9): 1562–1573.
Robling AG, Niziolek PJ, Baldridge LA, Condon KW, Allen MR, Alam I, et al. 2008. Mechanical stimulation of bone in vivo reduces osteocyte expression of Sost/sclerostin. Journal of Biological Chemistry, 283(9): 5866–5875.
Roforth MM, Fujita K, McGregor UI, Kirmani S, McCready LK, Peterson JM, et al. 2014. Effects of age on bone mRNA levels of sclerostin and other genes relevant to bone metabolism in humans. Bone, 59: 1–6.
Rubanyi GM, Freay AD, Kauser K, Sukovich D, Burton G, Lubahn DB, et al. 1997. Vascular estrogen receptors and endothelium-derived nitric oxide production in the mouse aorta. Gender difference and effect of estrogen receptor gene disruption. The Journal of Clinical Investigation, 99(10): 2429–2437.
Shaw CN, and Stock JT. 2009. Intensity, repetitiveness, and directionality of habitual adolescent mobility patterns influence the tibial diaphysis morphology of athletes. American Journal of Physical Anthropology, 140(1): 149–159.
Shevde NK, Bendixen AC, Dienger KM, and Pike JW. 2000. Estrogens suppress RANK ligand-induced osteoclast differentiation via a stromal cell independent mechanism involving c-Jun repression. Proceedings of the National Academy of Sciences of the United States of America, 97(14): 7829–7834.
Starup-Linde J, and Vestergaard P. 2016. Biochemical bone turnover markers in diabetes mellitus—a systematic review. Bone, 82: 69–78.
Syed F, and Khosla S. 2005. Mechanisms of sex steroid effects on bone. Biochemical and Biophysical Research Communications, 328(3): 688–696.
Tang SY, Zeenath U, and Vashishth D. 2007. Effects of non-enzymatic glycation on cancellous bone fragility. Bone, 40(4): 1144–1151.
Thompson ML, Jimenez-Andrade JM, and Mantyh PW. 2016. Sclerostin immunoreactivity increases in cortical bone osteocytes and decreases in articular cartilage chondrocytes in aging mice. Journal of Histochemistry and Cytochemistry, 64(3): 179–189.
Unal M, Creecy A, and Nyman JS. 2018. The role of matrix composition in the mechanical behavior of bone hhs public access. Current Osteoporosis Reports, 16(3): 205–215.
Vandenput L, Ederveen AG, Erben RG, Stahr K, Swinnen JV, Van Herck E, et al. 2001. Testosterone prevents orchidectomy-induced bone loss in estrogen receptor-α knockout mice. Biochemical and Biophysical Research Communications, 285(1): 70–76.
Vico L, and Vanacker JM. 2010. Sex hormones and their receptors in bone homeostasis: insights from genetically modified mouse models. Osteoporosis International, 21(3): 365–372.
Vidal O, Lindberg MK, Hollberg K, Baylink DJ, Andersson G, Lubahn DB, et al. 2000. Estrogen receptor specificity in the regulation of skeletal growth and maturation in male mice. Proceedings of the National Academy of Sciences of the United States of America, 97(10): 5474–5479.
Windahl SH, Börjesson AE, Farman HH, Engdahl C, Movérare-Skrtic S, Sjögren K, et al. 2013. Estrogen receptor-α in osteocytes is important for trabecular bone formation in male mice. Proceedings of the National Academy of Sciences of the United States of America, 110(6): 2294–2299.
Winn NC, Jurrissen TJ, Grunewald ZI, Cunningham RP, Woodford ML, Kanaley JA, et al. 2018. Estrogen receptor alpha signaling maintains immunometabolic function in males and is obligatory for exercise-induced amelioration of nonalcoholic fatty liver. American Journal of Physiology—Endocrinology and Metabolism, 316(2): E156–E167.

Information & Authors

Information

Published In

cover image FACETS
FACETS
Volume 5Number 1January 2020
Pages: 328 - 348
Editor: Vance L. Trudeau

History

Received: 5 August 2019
Accepted: 25 February 2020
Version of record online: 21 May 2020

Data Availability Statement

All relevant data are within the paper.

Key Words

  1. estrogen
  2. estrogen receptor knockout
  3. bone mass
  4. sclerostin expression

Sections

Subjects

Authors

Affiliations

Rebecca K. Dirkes
Nutrition and Exercise Physiology, University of Missouri, 204 Gwynn Hall, Columbia, MO 65211, USA
Nathan C. Winn
Nutrition and Exercise Physiology, University of Missouri, 204 Gwynn Hall, Columbia, MO 65211, USA
Current affiliation: Department of Molecular Physiology and Biophysics, Vanderbilt University, Nashville, TN 37212, USA.
Thomas J. Jurrissen
Nutrition and Exercise Physiology, University of Missouri, 204 Gwynn Hall, Columbia, MO 65211, USA
Dennis B. Lubahn
Department of Biochemistry, University of Missouri, 117 Schweitzer Hall, Columbia, MO 65211, USA
Child Health, University of Missouri, 400 N. Keene Street, Suite 010, Columbia, MO 65211, USA
Victoria J. Vieira-Potter
Nutrition and Exercise Physiology, University of Missouri, 204 Gwynn Hall, Columbia, MO 65211, USA
Jaume Padilla
Nutrition and Exercise Physiology, University of Missouri, 204 Gwynn Hall, Columbia, MO 65211, USA
Child Health, University of Missouri, 400 N. Keene Street, Suite 010, Columbia, MO 65211, USA
Dalton Cardiovascular Research Center, University of Missouri, 134 Research Park Dr., Columbia, MO 65211, USA
Pamela S. Hinton [email protected]
Nutrition and Exercise Physiology, University of Missouri, 204 Gwynn Hall, Columbia, MO 65211, USA

Author Contributions

VJV-P, JP, and PSH conceived and designed the study.
RKD, NCW, and TJJ performed the experiments/collected the data.
RKD, NCW, and PSH analyzed and interpreted the data.
DBL contributed resources.
RKD and PSH drafted or revised the manuscript.

Competing Interests

The authors have declared that no competing interests exist.

Metrics & Citations

Metrics

Other Metrics

Citations

Cite As

Export Citations

If you have the appropriate software installed, you can download article citation data to the citation manager of your choice. Simply select your manager software from the list below and click Download.

Cited by

1. Aromatase deficiency in transplanted bone marrow cells improves vertebral trabecular bone quantity, connectivity, and mineralization and decreases cortical porosity in murine bone marrow transplant recipients
2. Gestational and lactational exposure to BPA or BPS has minimal effects on skeletal outcomes in adult female mice
3. Gestational and lactational exposure to BPA, but not BPS, negatively impacts trabecular microarchitecture and cortical geometry in adult male offspring
4. Voluntary Wheel Running Partially Compensates for the Effects of Global Estrogen Receptor-α Knockout on Cortical Bone in Young Male Mice

View Options

View options

PDF

View PDF

Get Access

Media

Media

Other

Tables

Share Options

Share

Share the article link

Share on social media