SciSpends: an exploratory survey investigating nonreimbursed expenses in biological sciences
Abstract
Socio-economic barriers to participation in science are harmful to the enterprise. One barrier is the phenomenon of scientists paying for expenses related to the conduct of research that are not reimbursed (which we termed “Scispends” for social media discourse). We conducted an online survey that asked self-selecting respondents to report the amount of money they spent on nonreimbursed expenses, including both costs incurred in the past 12 months and one-time startup costs associated with their current position. We received 857 responses that met criteria for inclusion and reported descriptive statistics summarizing nonreimbursed expenses across career stages. We found the median total of nonreimbursed expenses for the past 12 months was $1680 and the median one-time expenses were $2700, and that as a proportion of income these expenses were highest for those earliest in their careers. We found 13% of respondents spent more on unreimbursed expenses than they earned in a year. All cost categories were skewed, with most respondents reporting little or no expense, whereas a minority experienced high expenses. These results should be interpreted with caution due to survey’s exploratory design, but they suggest that formal surveys should be conducted by scientific societies, funding agencies, and academic institutions to properly assess the causes of nonreimbursed expenses and determine how this barrier can be minimized.
Graphical Abstract
Introduction
Many of the great challenges facing society today are best addressed with an abundance of high-quality scientific evidence, mobilized to inform good decision-making (Marleau and Girling 2017). It follows that any obstacle to producing this evidence and making it available for use is therefore contrary to the interests of society. Since science is done by people, it means we need to identify and remove barriers to participation and success in the scientific enterprise.
The ideals of scientific exploration are egalitarian, but the practice of the discipline is not. Structural barriers play a part in determining who does and does not get to be a successful scientist. A large body of literature exists investigating how gender (Wennerås and Wold 1997; Mählck 2001; West et al. 2013; Serio 2016), race (Harper 2012; Sheth 2019), sexuality (Bilimoria and Stewart 2009; Yoder and Mattheis 2016), and other intersecting factors (Gilmartin et al. 2006) shape science and the institutions that practice it. Critically, these factors also shape who is able to access and remain in careers in science and engineering (Tao 2018; Murgia and Poggio 2019; Tao and McNeely 2019). These barriers are unfair and lead to an overrepresentation of people from privileged backgrounds within the scientific enterprise. Further, gender and racial minorities produce work of higher novelty, yet have that work cited less than scientists in the majority (Hofstra et al. 2020). These factors combine to limit the breadth and diversity of scientists, which in turn threatens to reduce the impact and quality of science as a whole (Valantine and Collins 2015).
One aspect of science that has received little formal attention is the practice of scientists paying out-of-pocket to conduct research—where costs incurred to do science are not reimbursed by employers or research grants (which we termed “SciSpends,” associated with the hashtag #SciSpends on Twitter). While we hear many anecdotes that scientists at all career stages subsidize their own research programs with personal finances, whether this practice is widespread is unknown. To date, articles written on this subject have been largely anecdotal or have focused primarily on conferences (Reed 2017; Hong 2018; Malloy 2020). Stories abound of scientists forced to spend their own money on institutional fees beyond tuition (Langin 2019), to purchase necessary research equipment (Hall 2015; Freund 2017), or even to participate in unpaid or “pay to work” schemes to gain experience (Fournier and Bond 2015). None of these costs are avoidable luxuries; on the contrary, they are core to the profession of science. Therefore, it is important to determine the magnitude of such expenses and what types of costs scientists incur to develop policy to rectify this obvious barrier to participation for those who do not have financial means.
In this study, we deployed an online survey to ask scientists about how much money they spend to do their research that is not reimbursed by employers or grants. We asked respondents to report the magnitude of their contributions and on what items they spend these funds on. We divided cost categories into those costs that are incurred once, at the start of a new position (e.g., office furniture purchase), and those from the past 12 months that could represent recurring expenses in science (e.g., conference attendance). In doing so, we have generated what is to our knowledge the first published exploration of the issue of nonreimbursed expenditures in biological science.
Materials and methods
We conducted our survey of personal expenditures in science using Google Forms. In our questionnaire, we asked 52 questions, with an estimated completion time of 15 min (Supplementary Material 1). The first eight questions were demographic in nature, and served to identify where respondents were located, in what sector they were employed, and to identify their career stage (with 14 options, including “other”).
Income, expenses, and related questions
We asked respondents to report the amount of money they had spent on one-time startup costs that they incurred to take on their current position, as well as the sum of costs they had incurred in the past 12 months (which can be considered costs that may recur going forward). In all cases, we specified that we only wanted sums that represented expenses that were not reimbursed—anything that was reimbursed was to be excluded from these sums. From here on in the present paper, when we reference expenses, we specifically mean expenses that were not reimbursed by an employer.
Questions on costs were organized into a range of categories, which are described in Table 1. We generated the categories a priori when we designed the study, based on personal experience and discussions with colleagues, and we piloted an early version of the survey among peers to ensure the questions were clear and unambiguous. These cost categories included direct research expenses, as well as expenses that are necessary to participate in the scientific enterprise but are not research themselves (such as conference-related fees). In establishing these categories, we aimed to capture as wide a range of potential expenses as possible and acknowledge that there may not be consensus about whether all these categories should be reimbursable. We also asked respondents to report their income in the past 12 months, although we made this response optional. Our survey requested that all respondents report these values in US dollars, and we assume that respondents complied. We also asked a short series of related questions, such as the length of time it typically takes for reimbursement and how many conferences the individual had attended in the past 12 months (Table 2). Near survey completion, respondents were optionally able to provide brief free-form comments to explain or supplement their quantitative responses.
Table 1.
| Category | Time span | Expense type | Specific directions |
|---|---|---|---|
| Income | Past 12 months (optional) | — | All income from scholarships, research stipends, teaching, base salary, etc. |
| Expense | One-time | Startup | Travel to job interview |
| Relocation expenses | |||
| Personal computer, monitors, etc. (excluding specialized computers) | |||
| Office furniture | |||
| Field and lab | Training to conduct research (e.g., first aid, marine safety) | ||
| Clothing and personal gear (Personal Protective Equipment) | |||
| Software for research | |||
| Field equipment | |||
| Lab equipment | |||
| Past 12 months | Conferences | Conference fees | |
| Travel to conference (e.g., airfare, train, boat) | |||
| Travel at conference (e.g., bus fare, taxi) | |||
| Food during conference, excluding alcohol | |||
| Accommodations at conference | |||
| Printing costs (for posters, leaflets, handouts) | |||
| Childcare while attending conference | |||
| Care of animals while attending conference | |||
| Field and lab | Accommodations in field | ||
| Transportation to and from field sites | |||
| Food excluding alcohol | |||
| Bench fees, or other costs for using lab space | |||
| Childcare during fieldwork | |||
| Animal care during fieldwork | |||
| Other | Publication fees | ||
| Professional memberships | |||
| Tuition | |||
| Other career-enhancing activities | |||
| Payments to students, colleagues, or volunteers |
Note
For brevity, some categories are collapsed into a single row in this table. Full survey available in Supplementary Material 1.
Table 2.
| Time span | Question | Data reported |
|---|---|---|
| One-time | Did you move >100 km to accept position? | Yes/No |
| Past 12 months | How many conferences did you travel to… | Within 100 km of home institution |
| Greater than 100 km of home institution | ||
| Indeterminate | Have you ever skipped a conference, workshop, or other career-enhancing activity due to expectation of paying out-of-pocket? | Yes/No |
| How many days of unpaid work did you do between your last paid position and current position? | Number of days (only activities associated with career path) | |
| When reimbursement paperwork is filed, how many days does it typically take to get the money? | Number of days between submitting paperwork and receiving pay |
Note
Full survey available in Supplementary Material 1.
Survey dissemination
This was designed as an exploratory survey using convenience sampling where our intent was to receive as many responses as possible (Singh 2007). Consequently, our dissemination strategy was to share it as widely as we were able within scientific networks and allow respondents to self-select. Our survey was active from 15 March to 1 July 2015, and we disseminated it during that period. We distributed the survey in three ways. First, we personally emailed the survey out to our professional networks and posted it on our personal Facebook and Twitter accounts, amplifying it using the “#SciSpends” hashtag. Second, we posted it to 55 science or science-related list-servs (i.e., email lists; Supplementary Material 2). Third, we communicated with science writers and journalists who posted links to the survey on their personal blogs and, in one case, who published a story on the survey soliciting responses in Science News (Wilkinson 2015). Due to the exploratory strategy, the response rate is unknowable.
Data verification and reduction to final sample
We received a total of 1370 responses (Fig. S1, raw data enclosed in Supplementary Material 3). Our original intent was to survey scientists from all disciplines, and who were employed across multiple sectors. However, our responses were dominated by people who identified as being in the research discipline of biology (n = 926). The remaining 444 respondents identified as being from several other disciplines including social science, physics, chemistry, and so on. Given that we had comparatively little data spread across many fields and a large volume of data for biologists, we focused our analysis on biologists only.
Our survey design allowed users to self-identify from a wide range of career stages that included categories for which one may not expect to get reimbursed for doing science (e.g., adjuncts, self-funded researchers, retired researchers). Owing to the small number of respondents in these categories and the fundamental differences associated with those positions that made meaningful comparisons difficult, we further constrained our data set to people who self-identified as falling on the professional hierarchy commonly used to describe academic or academic-adjacent positions: undergraduate, masters, PhD, postdoc, early-career researcher, mid-career researcher, or senior career researcher. Our final sample comprised n = 857 respondents, primarily from the United States, Canada, and the United Kingdom (Fig. S2). Of these, 491 self-reported as female, 364 as male, and two as other.
Analysis
We conducted all data management and exploration, generated summary statistics, and created data visualizations using R Statistical Software (R Core Team 2019) and the Tidyverse packages (Wickham et al. 2019). We calculated the proportion of income lost to expenses for each respondent by summing the one-time and 12-month unreimbursed expenses and dividing by that respondents’ reported income. For respondents who provided free-form comments, we manually assessed whether the emotional sentiment of the comment towards the issue of SciSpends was negative, positive, mixed, or unable to be determined.
Ethics approval
Our survey was approved by Memorial University of Newfoundland’s Interdisciplinary Committee on Ethics in Human Research, #20151947-MI. All responses were anonymous. We excluded free-form answers from the data set shared with this manuscript in case any details could be considered personally identifying.
Results
The median one-time expenditure reported by respondents was $2700 (inter-quartile range, IQR = $4218), and the median 12-month total was $1680 (IQR = $3047, Figs. 1A and 1B). Men reported median one-time and 12-month totals of $2462 and $1465 (IQR = $4339 and $2679), while women reported $2800 and $1850, respectively (IQR = $3995 and $3330). For the two respondents reporting a gender of Other, median one-time and 12-month totals were $2950 and $2044 (IQR = $2650 and $2036). Of our 857 respondents, all but four reported annual income, which varied by career stage but had an overall median of $31 110 (IQR = $38 398, Fig. 1C). The median proportion of income lost to unreimbursed expenditures was highest in undergraduates and declined up to the postdoc stage before remaining relatively constant with increased seniority (Fig. 1D). We note that 45 respondents reported receiving no income at all in the previous 12 months, and a further 64 reported less income than unreimbursed expenses (i.e., they spent more than they earned). Early career researchers were overrepresented in not receiving income or in reporting less income than nonreimbursed expense, although it rose again with senior career researchers (Table 3). Of the 64 respondents who spent more than they earned, the median proportion was 3.23 (i.e., they spent 3.23 times their annual earnings).
Fig. 1.
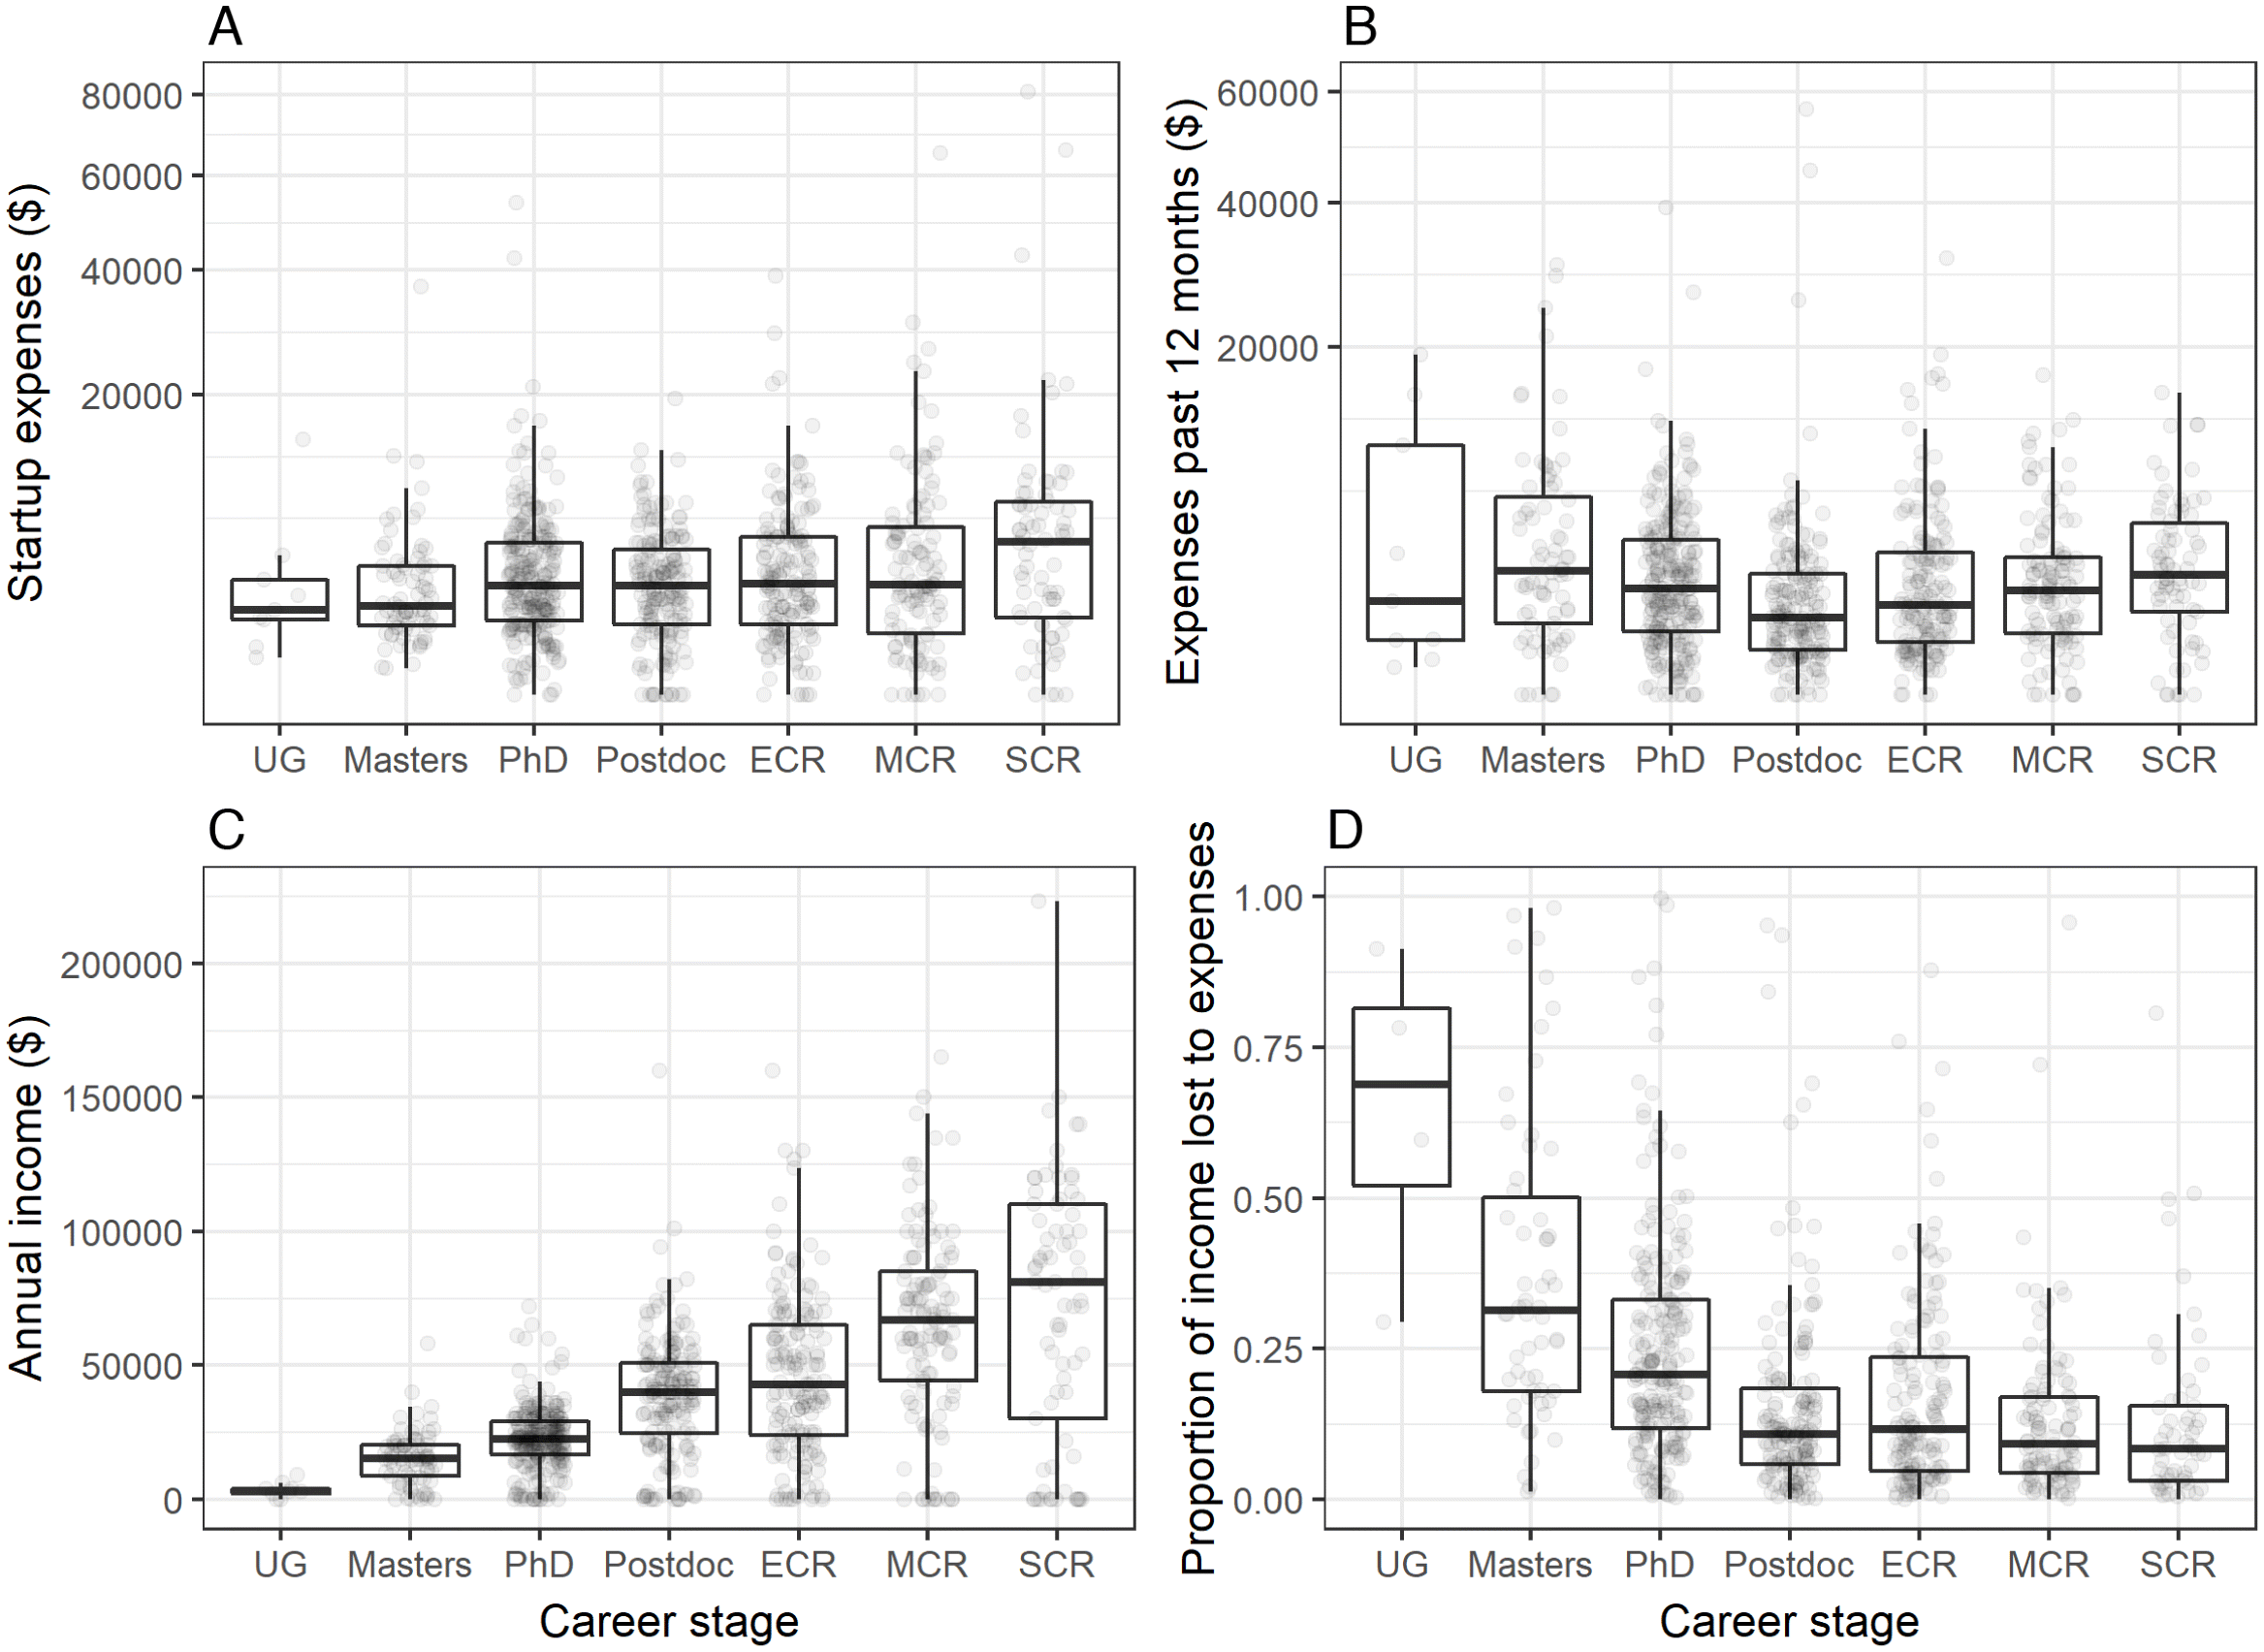
Table 3.
| Career stage | Zero income | Expense/income >1 | n | Percent spending more than they earn |
|---|---|---|---|---|
| Undergraduate | 2 | 3 | 9 | 56 |
| Masters | 3 | 15 | 76 | 24 |
| PhD | 9 | 21 | 244 | 12 |
| Postdoc | 7 | 9 | 176 | 9 |
| Early-career researcher | 7 | 5 | 160 | 8 |
| Mid-career researcher | 7 | 4 | 118 | 9 |
| Senior career researcher | 10 | 7 | 74 | 23 |
| Total | 45 | 64 | 857 | 13 |
Note
n refers to the total number of respondents at that career stage.
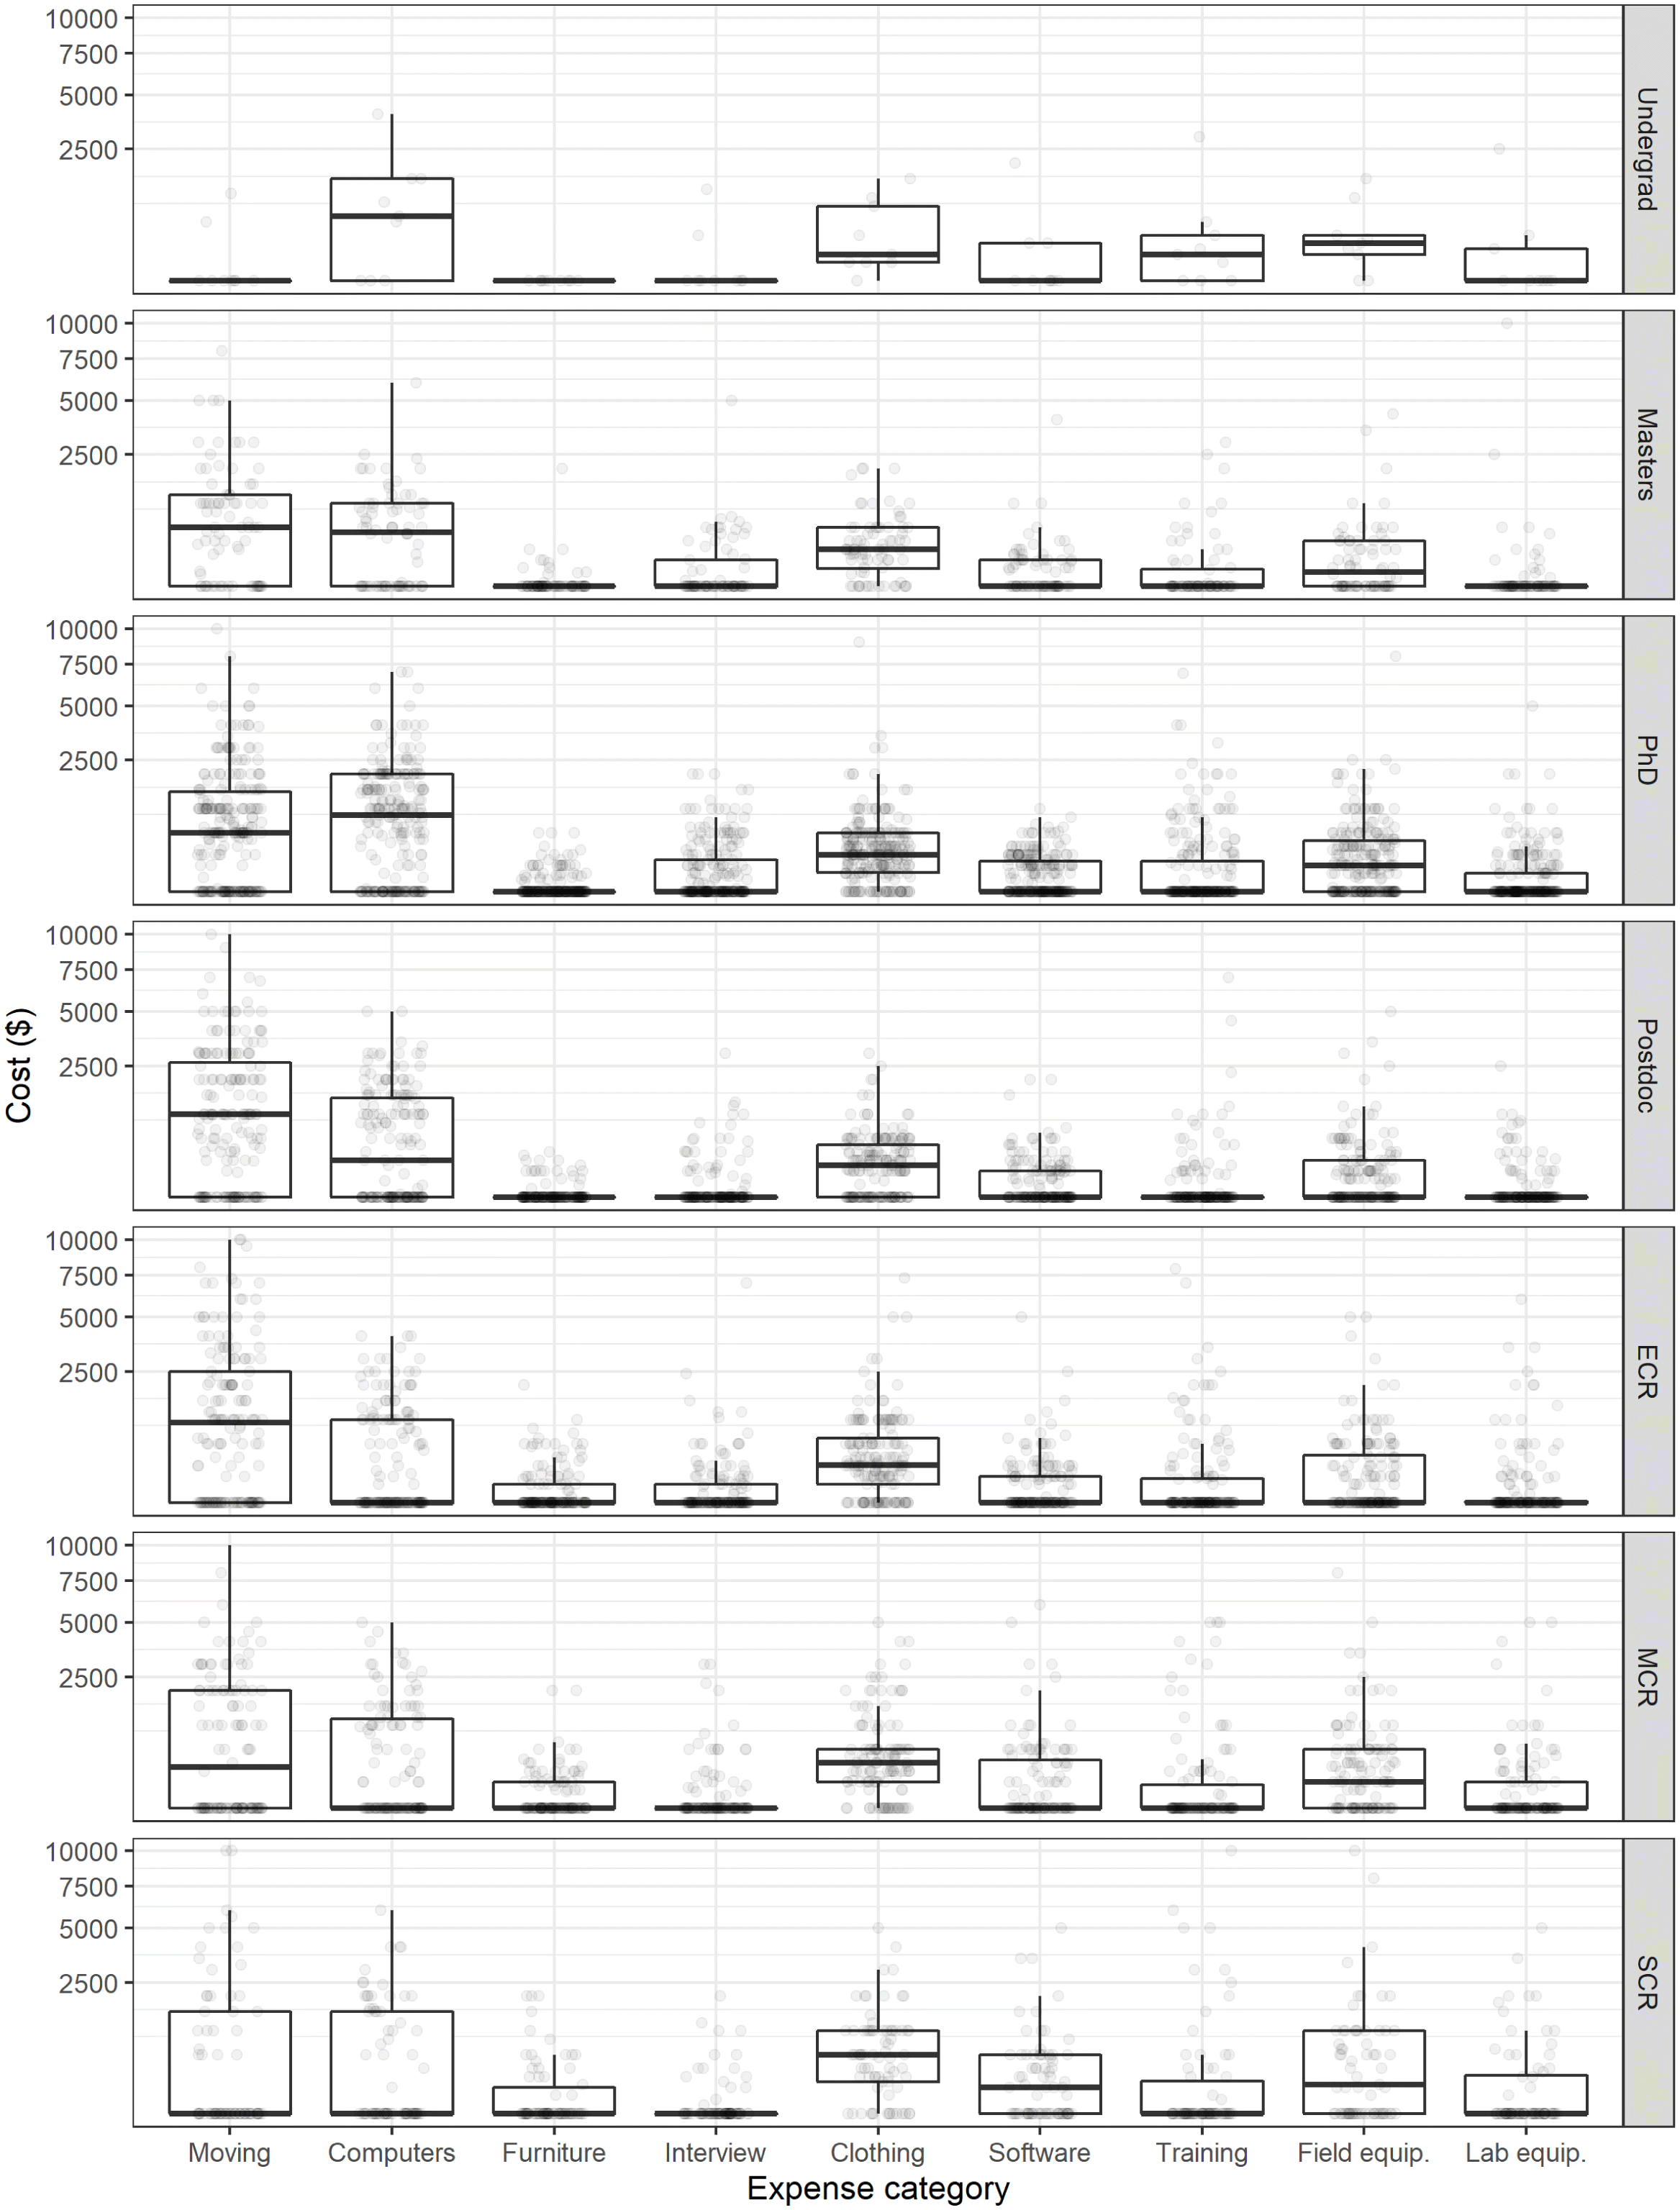
The magnitude of one-time expenses varied substantially among respondents, but in all cases was defined by skewed distributions, where a minority of respondents reported very large expenses across each cost category (Fig. 2). Across all respondents, the largest median one-time expenses were moving expenses ($500), computers ($400), and clothing ($200), with IQRs of $2000, $1500, and $450, respectively. There was no consistent shift in one-time expense types or magnitude across career stages.
Fig. 2.
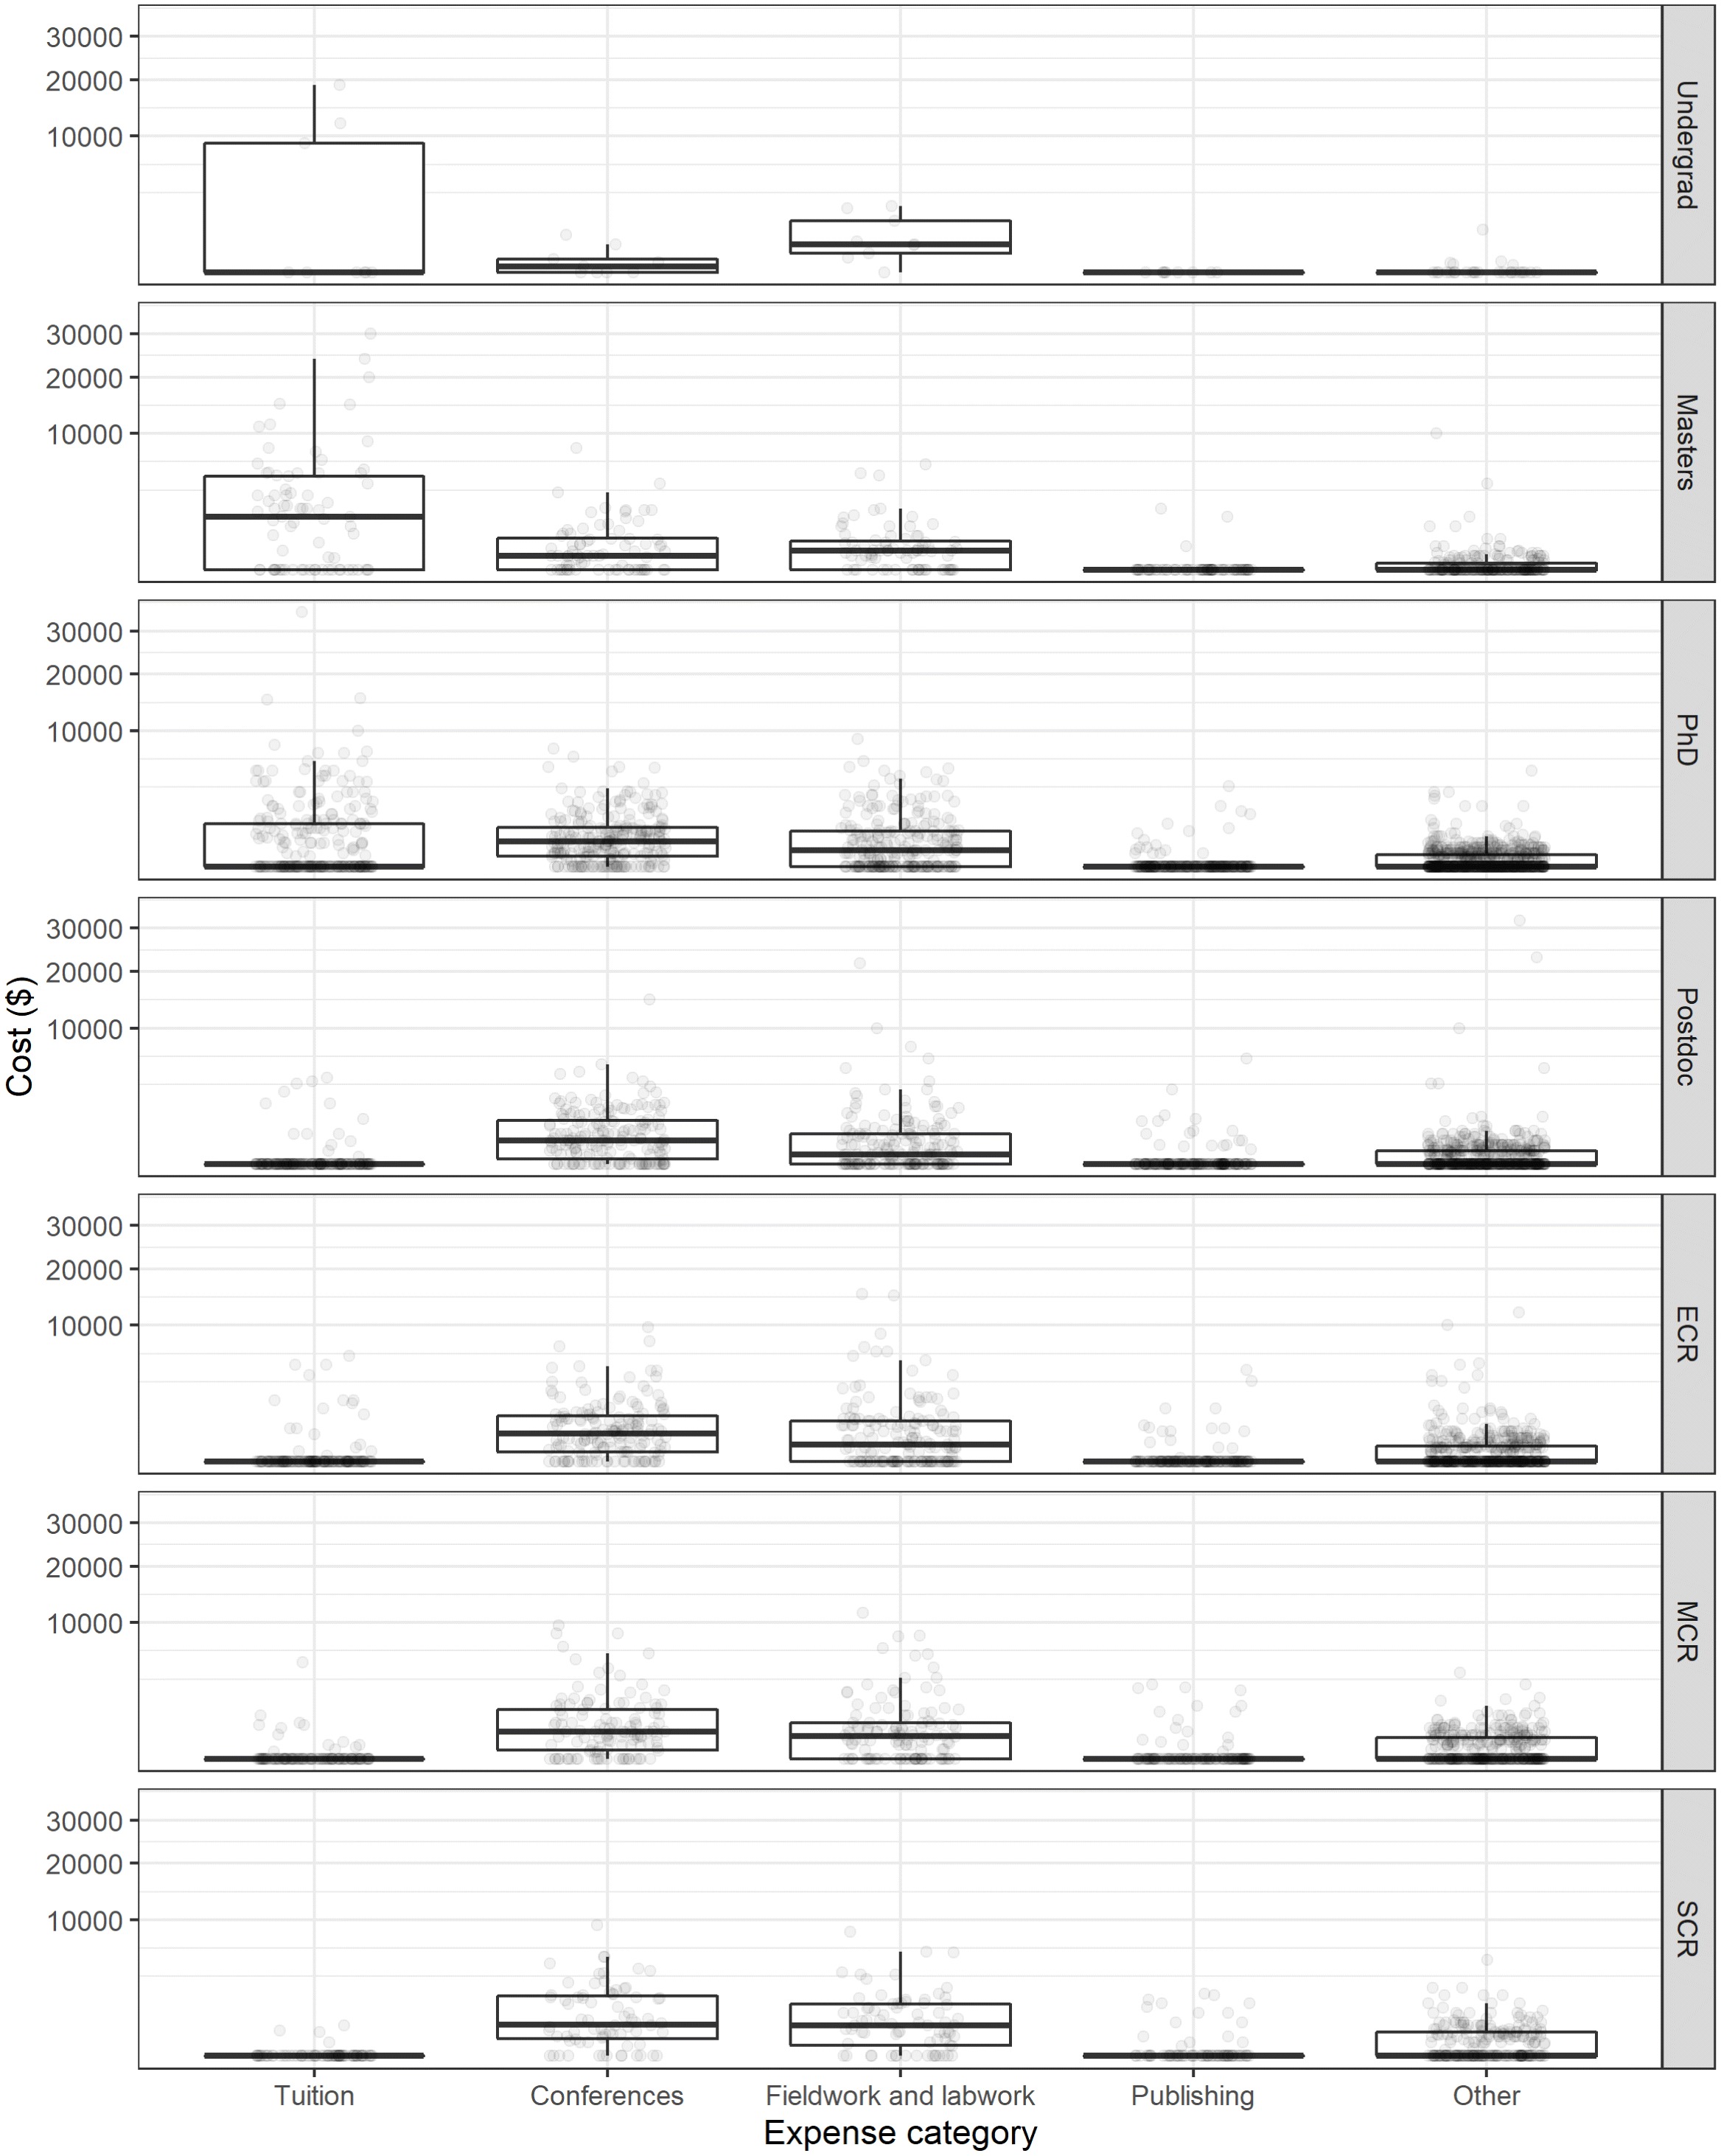
Expenses in the past 12 months were similarly highly variable and characterized by most respondents reporting low values, but a minority reporting very high expenses (Fig. 3). Across respondents, the largest median expenses over the past 12 months were costs associated with conferences ($330) and fieldwork or lab work ($200). IQRs were $1020 and $708, respectively. Unlike with the one-time expenses, some patterns across career stages were visible in past 12-month expenses. Specifically, students (undergraduate, masters, and PhD) reported spending substantial amounts on tuition that did not apply to other career stages. In addition, a general “other” category of expense grew with career stage.
Fig. 3.
The expense categories that comprised expenditure on conferences and field and lab work are shown in Figs. 4A and 4B, respectively. Again, these categories were characterized by most respondents having little or no expenses, but a large minority bearing substantial costs. For conferences, all categories had a median expense of zero except for food at conferences, which had a median of $80. Excluding zero values shifted median expenses substantially across most cost categories for both one-time and past 12-month expenses (Figs. 5A and 5B, respectively, and Table 4).
Fig. 4.
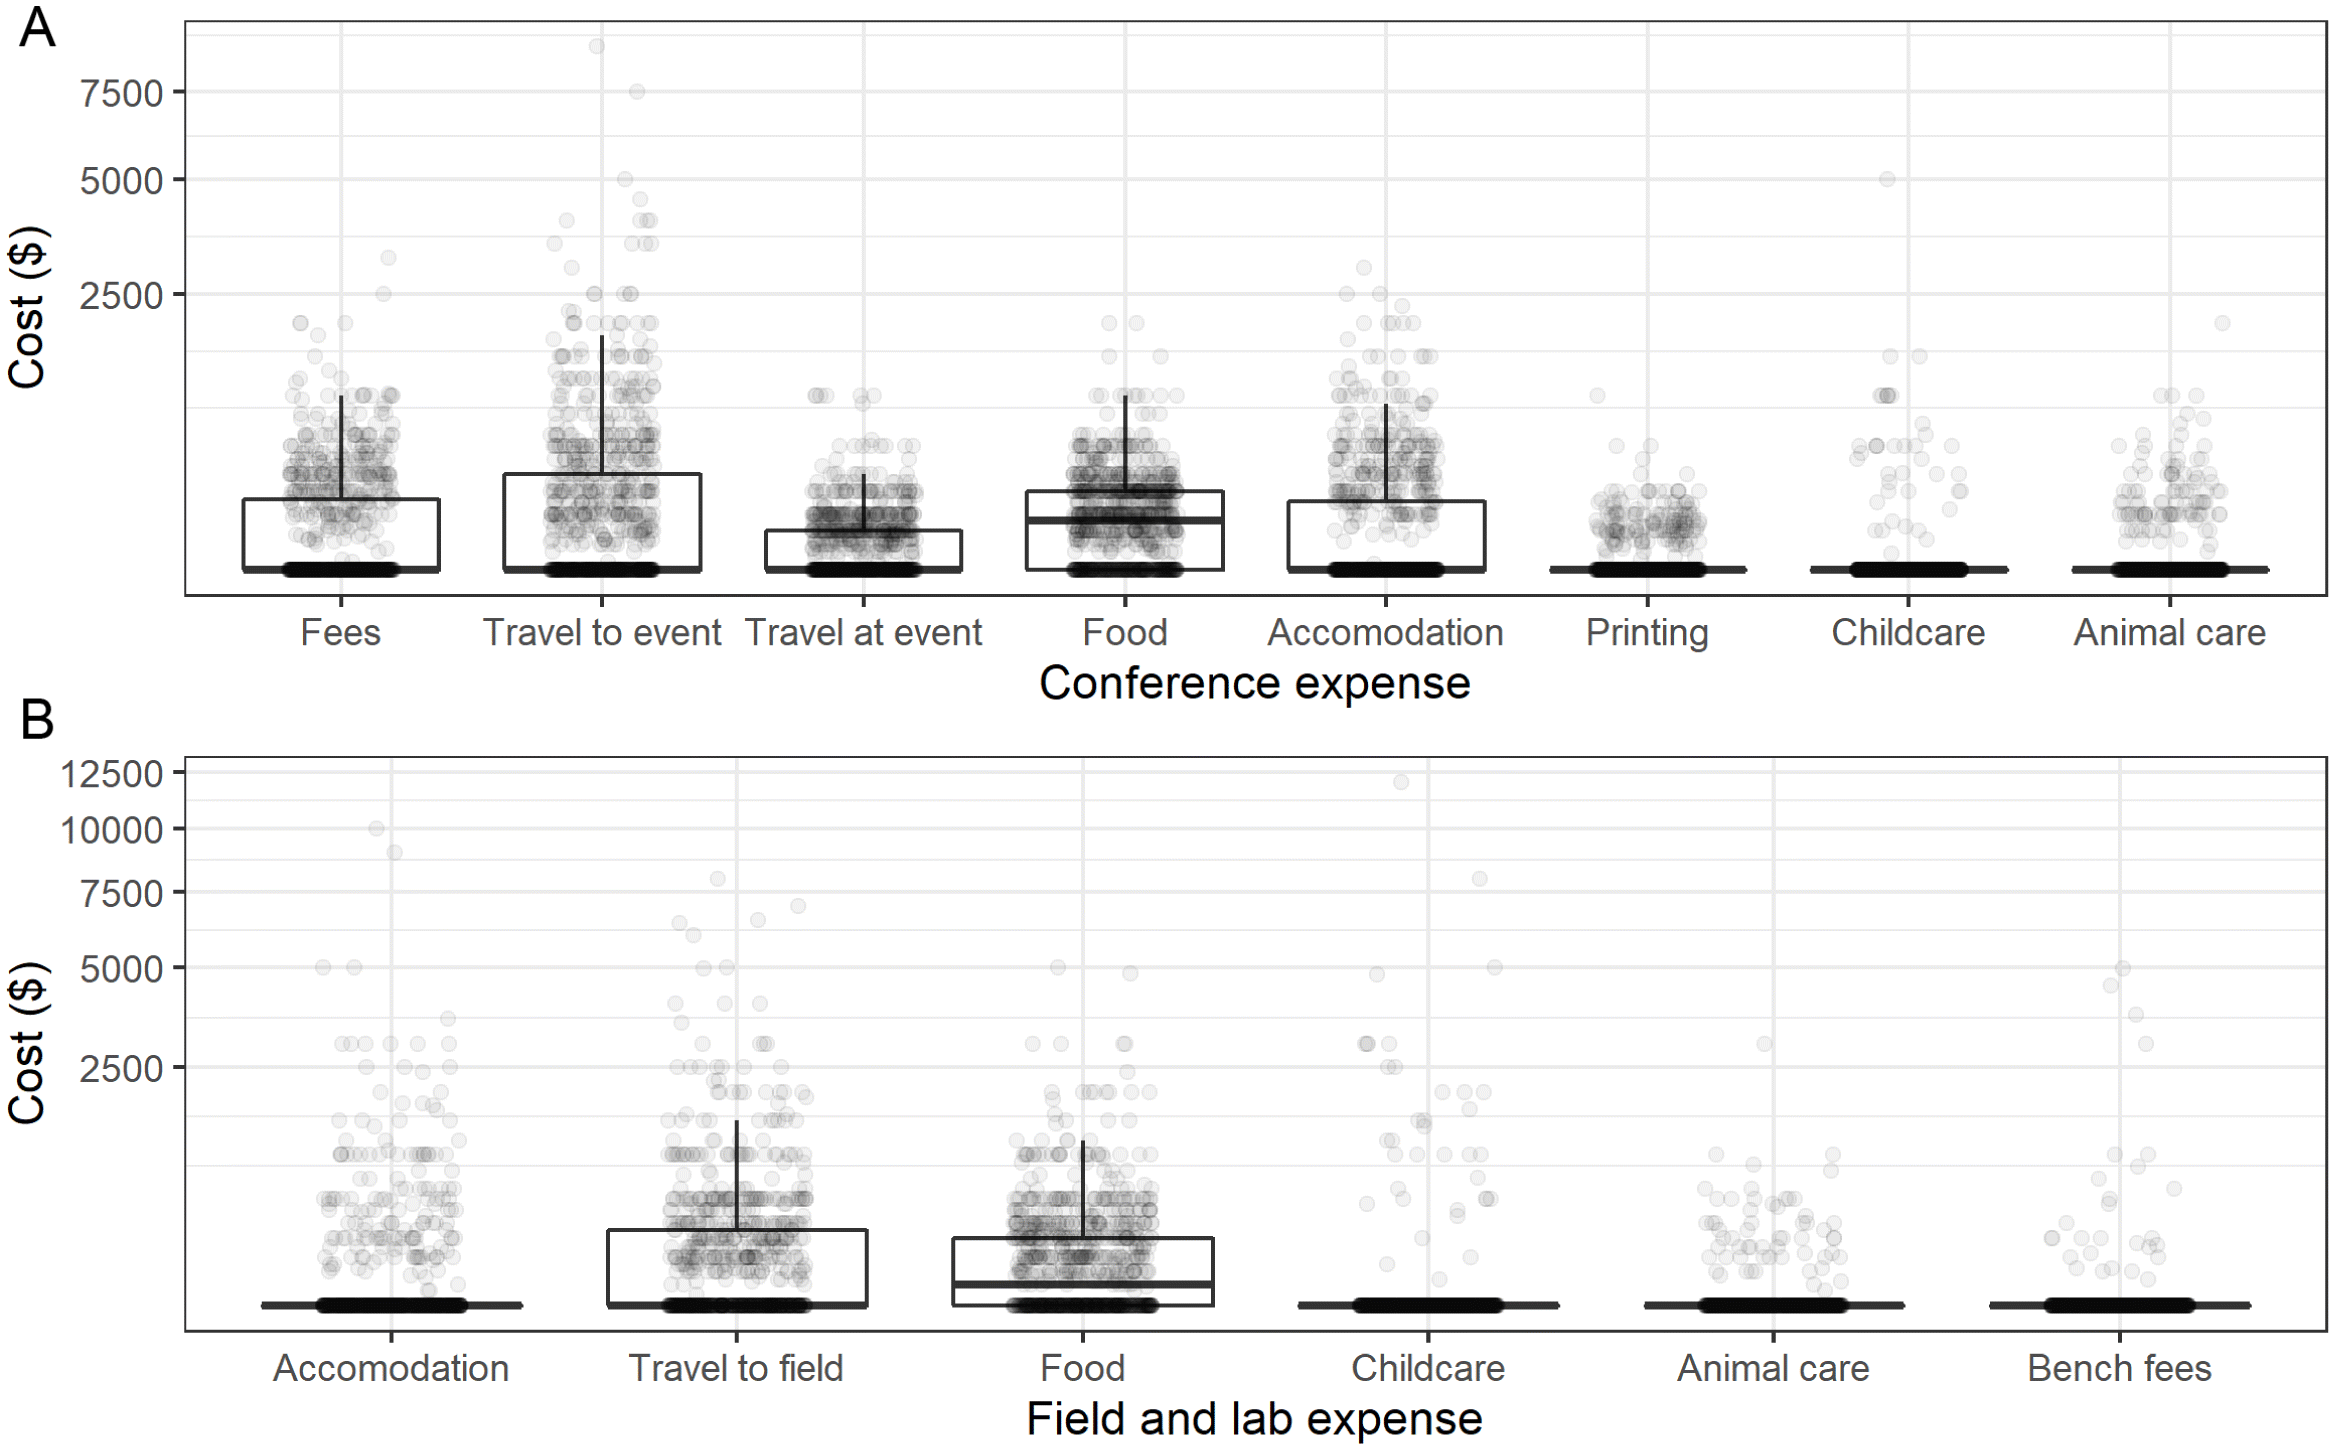
Fig. 5.
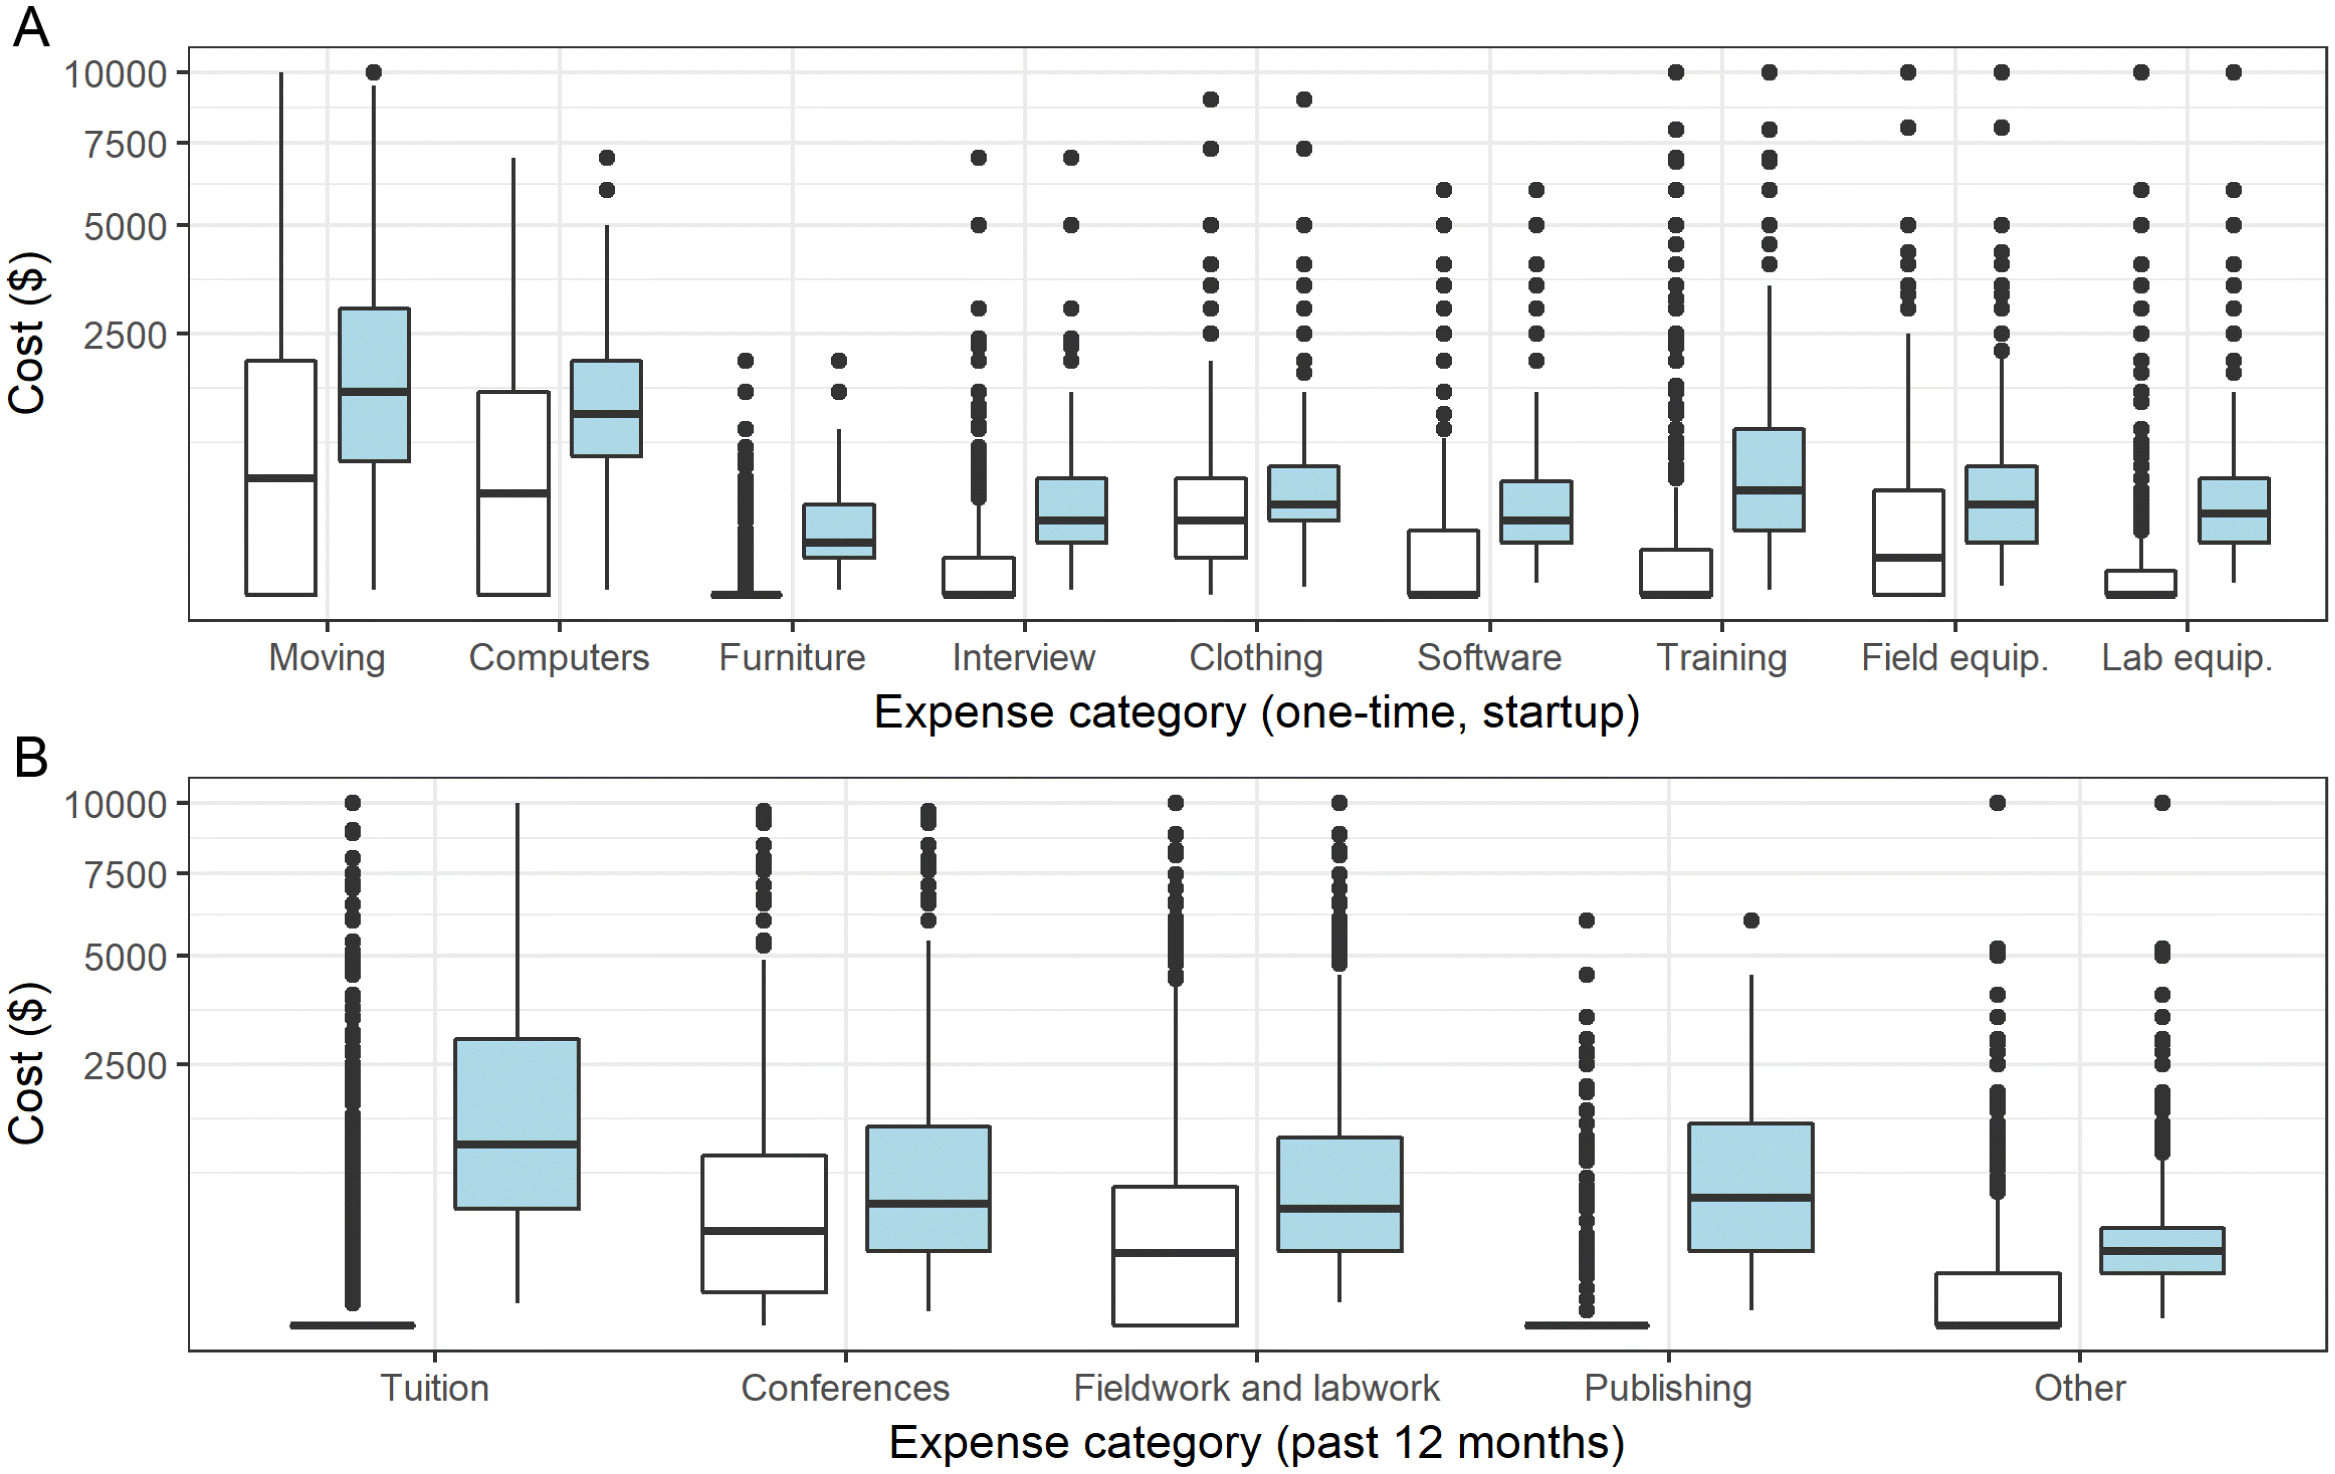
Table 4.
| All data | Excluding zeroes | ||||
|---|---|---|---|---|---|
| Category | Description | Median | IQR | Median | IQR |
| One-time | Moving | 500 | 2000 | 1500 | 2331 |
| Computers | 400 | 1500 | 1200 | 1300 | |
| Furniture | 0 | 0 | 100 | 250 | |
| Interview | 0 | 50 | 200 | 400 | |
| Clothing | 200 | 450 | 300 | 400 | |
| Software | 0 | 150 | 200 | 375 | |
| Training | 0 | 75 | 400 | 850 | |
| Field equipment | 50 | 400 | 300 | 600 | |
| Lab equipment | 0 | 30 | 250 | 400 | |
| Overall one-time | 0 | 350 | 500 | 830 | |
| Past 12 months | Tuition | 0 | 17 | 1500 | 3417 |
| Conferences | 330 | 1020 | 541 | 1250 | |
| Fieldwork/lab work | 200 | 708 | 500 | 1135 | |
| Publishing | 0 | 0 | 600 | 1300 | |
| Other | 0 | 100 | 200 | 250 | |
| Overall past 12 months | 0 | 880 | 330 | 250 | |
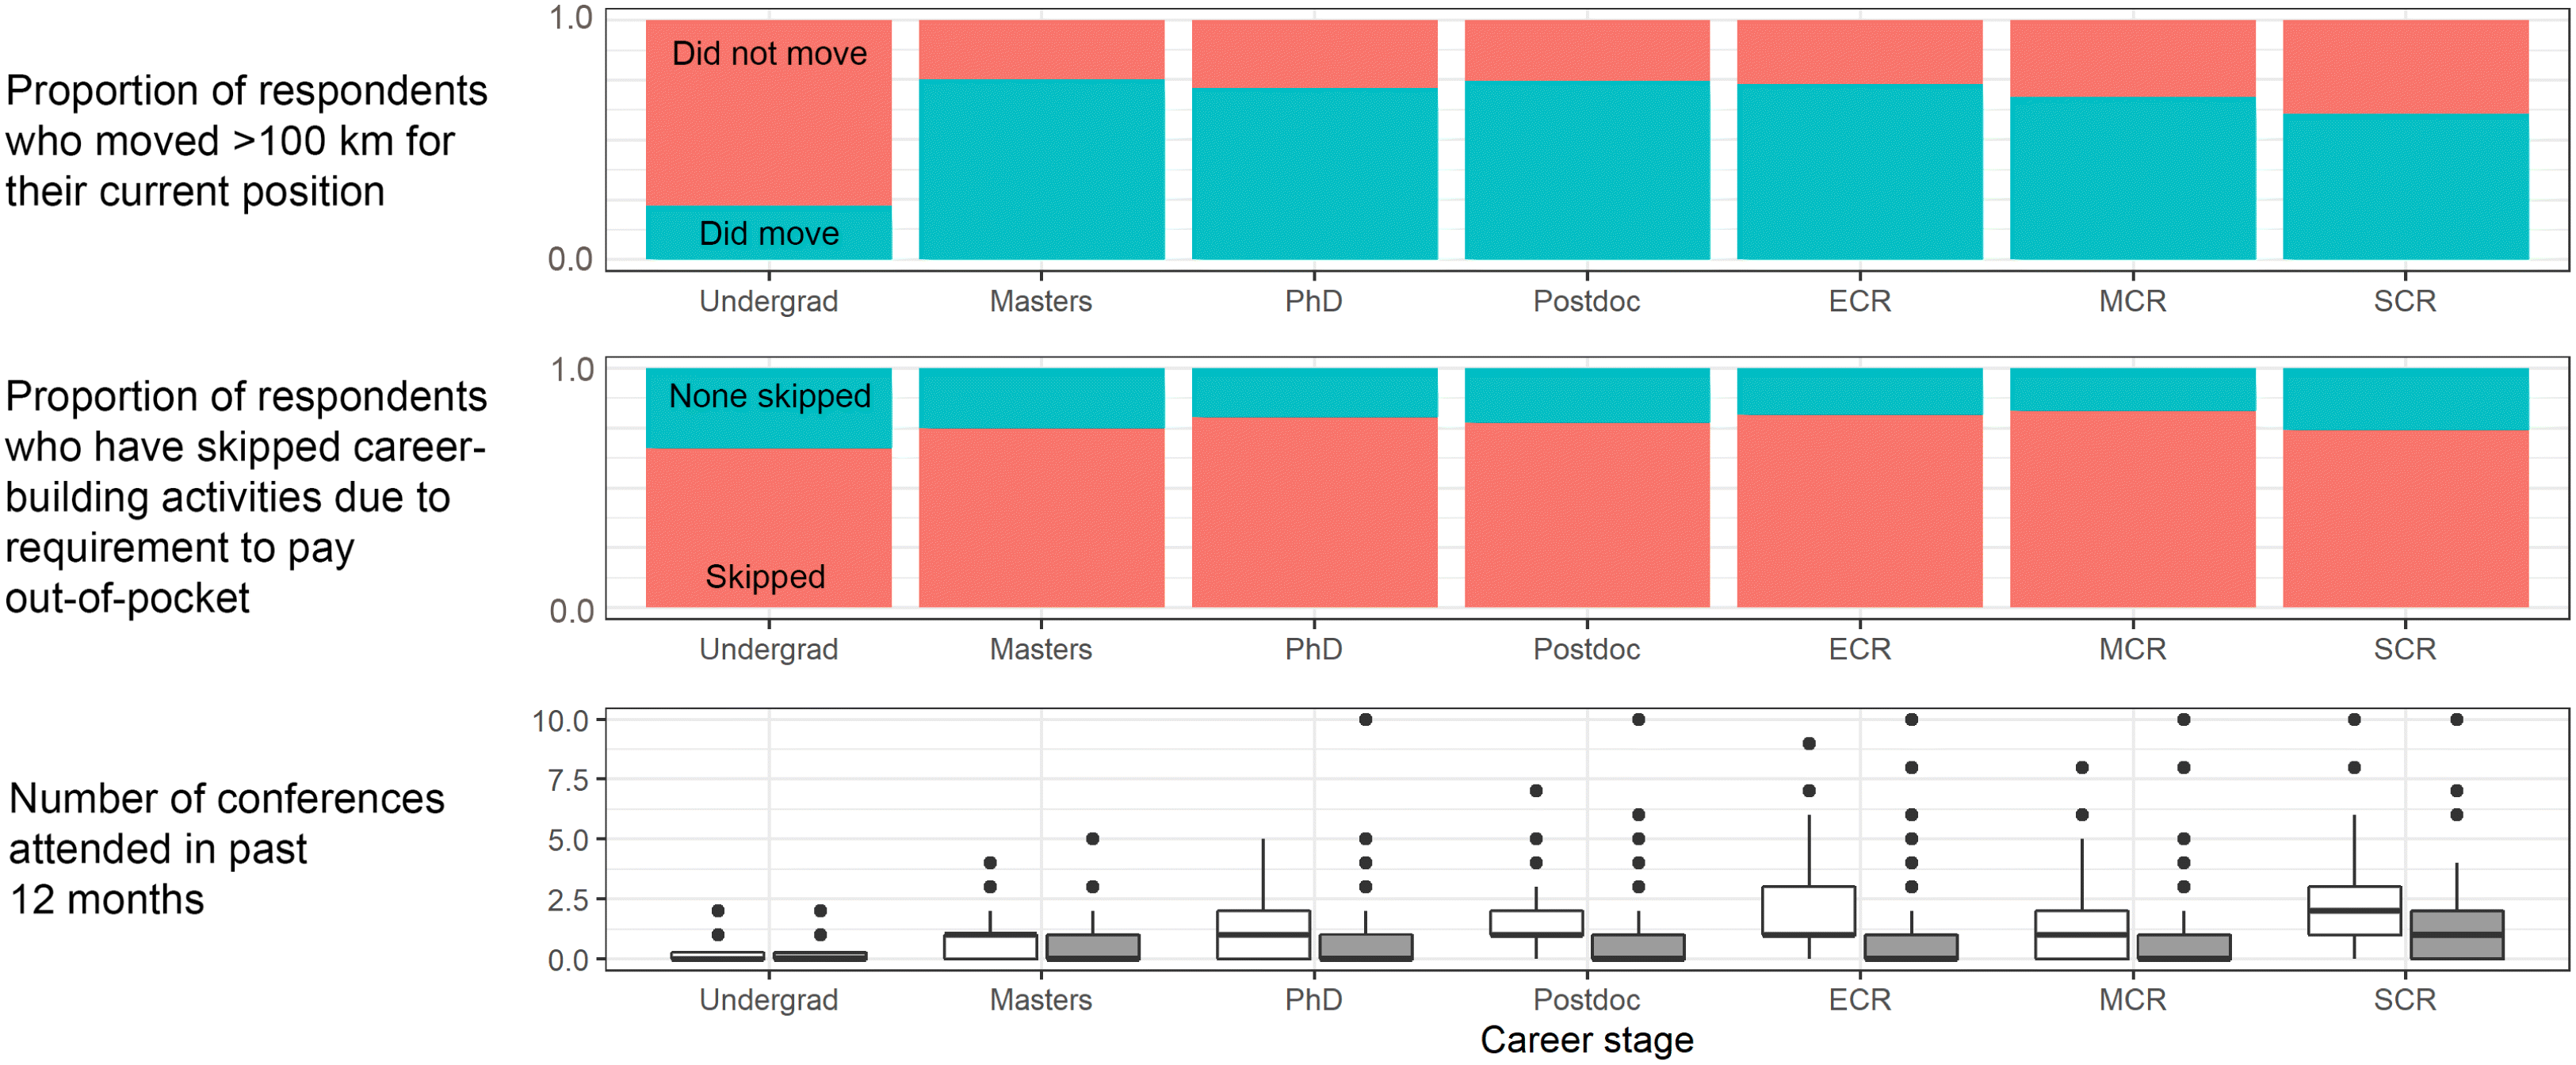
We found that the majority of respondents moved more than 100 km to accept their positions for all career stages except undergraduate (Fig. 6A). We also found that the majority of respondents across all career stages reported skipping a career-building activity due to the requirement to incur out-of-pocket cost (Fig. 6B). The median number of local conferences attended in the past 12 months (i.e., conferences <100 km away from work, where this cutoff was selected by the authors arbitrarily to capture conferences that likely did not require air travel or overnight accommodation) was one across all career stages except undergraduate (zero) and senior career researchers (two). The median number of conferences for which travel of >100 km was required was zero for all career stages except senior career researchers (who attended a median of one such conference, Fig. 6C).
Fig. 6.
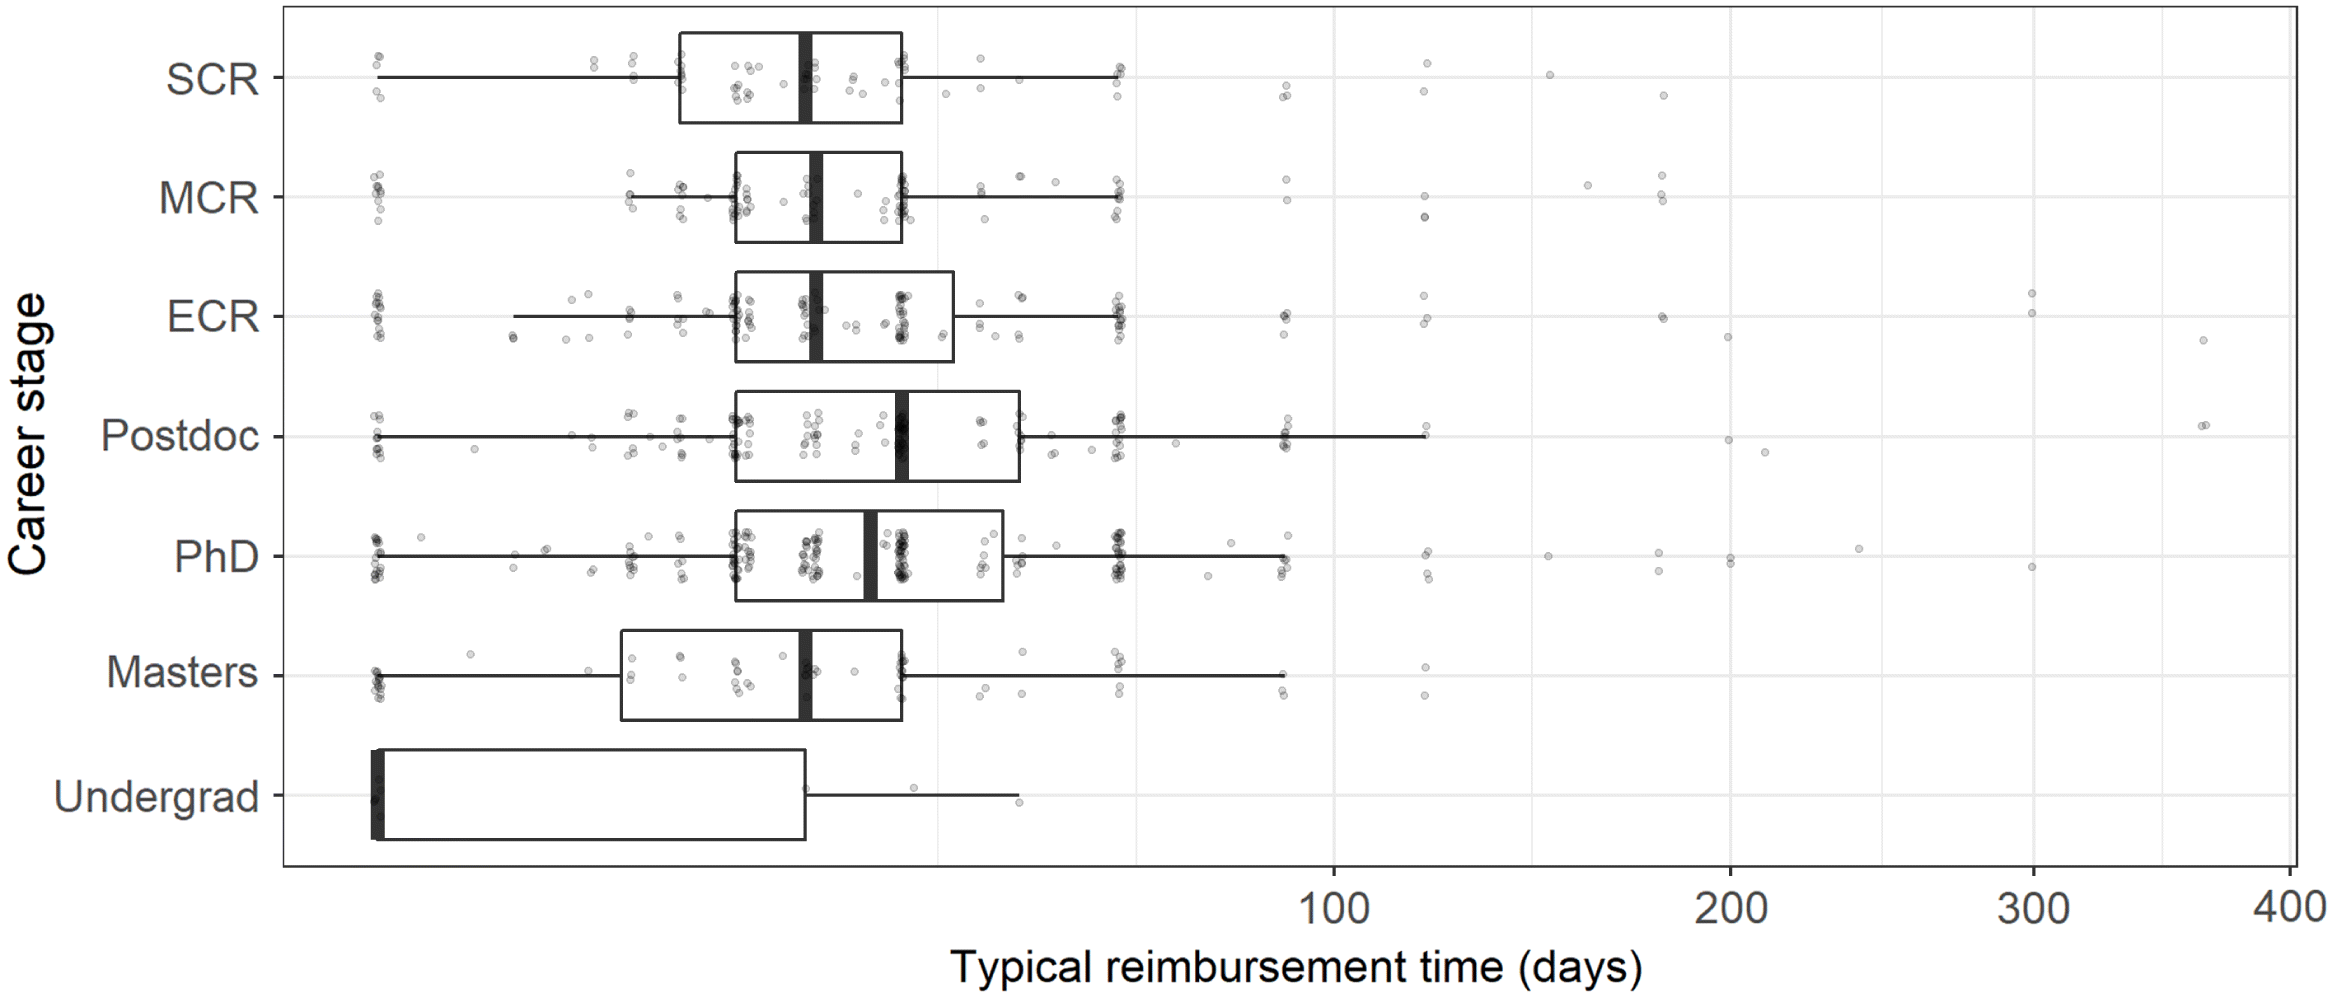
The median reimbursement time across all respondents was 21 d (IQR = 26 d). It varied by career stage, with PhD students and postdocs reporting the longest wait times (Fig. 7). The distribution of response times was skewed, with a minority of respondents reporting very long delays to reimbursement (max reported value = 365 d).
Fig. 7.
A total of 333 respondents provided free-form comments; 82% were negative (i.e., the respondent made a comment that indicated they were dissatisfied with the practice of unreimbursed expenses in science). Only 6% were positive, with a further 6% giving mixed views. The remainder were neither positive nor negative. Here, we present examples of nonidentifying responses we coded as negative, positive, mixed, and neither positive nor negative. Additional negative examples are included in the discussion:
Positive: “I think this is quite common … you should be happy enough to be a researcher so that you should not complain about money.”Negative: “Waiting for reimbursements can be quite frustrating and more than once has put me in a tight financial position.”Mixed: “My personal spending has been relatively low so far … but it looks like it is about to increase dramatically over the next year unless we get a grant.”Neither positive nor negative: “I’ve also seen my advisors pay out of pocket frequently to purchase smaller items.”
Discussion
We preface this discussion by reiterating caveats that apply to all exploratory surveys using nonprobability samples. We cannot assess the response rate, because we did not have a fixed population from which to sample. This means we may have experienced a self-selection bias, wherein people who had negative experiences with scientific expenditures may have been more likely to respond to the survey to express their discontent (Heckman 1990). Perhaps there exists a large pool of scientists who are either fully receiving reimbursements for all their expenses or who are incurring no costs at all to do research. Our survey may have been less likely to capture respondents in these categories. Further, the demographics of our respondents were not representative of the discipline of biology, and because of a low number of responses from disciplines other than biology, we were unable to conduct a satisfactory analysis of SciSpends in these other fields. We suspect the high rate of biologists responding to the survey was a product of skew in our own professional networks that helped disseminate the survey combined with differences in engagement with online media when the survey was conducted. It is also possible biologists incur more unreimbursed expenses than other disciplines. Only a formalized survey could produce evidence to support or refute this hypothesis. Additionally, we did not collect data on race, ethnicity, or cultural background, which are related to all the issues of equity mentioned so far in the present study (Gilmartin et al. 2006). We had very few undergraduates, and an over-representation of PhD students relative to other career stages, and our respondents were primarily from the United States, Canada, and the United Kingdom.
Nevertheless, there are findings from this sizeable data set that are noteworthy—and in some cases, alarming.
Firstly, the practice of biological scientists incurring nonreimbursed expenses appears to be widespread but with a great deal of variation across respondents in both the magnitude of expenses and the categories people were spending money on. No single expense type appears to dominate unreimbursed expenditures. Rather, respondents reported spending relatively small amounts across many cost categories, with women reporting slightly more expenses than men. Reducing or eliminating unreimbursed expenses will therefore require policies that systematically address out-of-pocket costs that are spread across the entire scientific enterprise—not solely targeting highly visible expenses like conference fees or tuition. The less visible costs, such as office furniture, computers, and software must be addressed too. Further, it is essential that scientists get costs related to safety equipment and training reimbursed in all cases.
Second, as a proportion of income, unreimbursed expenses have a disproportionate impact on early-career researchers. Notably, 13% of respondents reported SciSpends that totaled more than their annual income (Table 3). Our preference is that no career stage incurs extensive unreimbursed expenses, but it is certainly unfair that students have to pay a larger proportion of their salaries on expenses than later career stages—especially given their lower income (Fig. 1C, Table 3). This finding becomes even more concerning in light of the time it takes for scientists at all stages to receive reimbursements (Fig. 7). It is entirely conceivable that a student who paid out-of-pocket to attend a conference would incur interest on a credit card while waiting the median 21 d to receive their reimbursement. More likely, students without financial means would simply not attend at all (which, evidently, is a common choice; Fig. 6). This can entrench inequity because those without financial means are also more likely to be from less socioeconomically advantaged groups or communities—and therefore have less financial support from social networks (Valantine and Collins 2015).
Third, while data summarization requires focusing on measures of central tendency like medians, in all categories of expense we found a long tail where a minority of respondents incurred extreme unreimbursed expenses. For many respondents, the value in any given category was zero because they either did not spend money in that category or what they did spend was reimbursed. But for a minority, unreimbursed expenses that were sometimes substantial were incurred.
This variation bears two implications. First, that there is substantial inconsistency in policy across the scientific enterprise, which translates into the fact that two scientists doing the same type of work may experience completely different expectations for what they will have to pay for and what will be reimbursed. Some of these expenses appear completely inappropriate. For example, 28 respondents reported having to pay unreimbursed “bench fees” to conduct laboratory work—with one person reporting spending $5000 in the past year to do their research. For people doing lab-based research, lab access is not optional, making this cost a clear unfair barrier to participation in science.
Second, the prevalence of long tails of extreme unreimbursed expenses implies that any solutions cannot focus solely on moving the mean or median—they have to consider corner cases that led to some of the more extraordinary cases presented in our data set. It cannot be overstated how devastating it could be to a students’ ability to complete their programs when faced with a $5000 food bill related to fieldwork or an expectation to pay $7000 to travel to their field sites (examples presented in Fig. 4). As another example, we found that most people did not pay out of pocket to support students, employees, or volunteers. Yet, 183 respondents did incur such an expense, including four graduate students who spent more than $1000 supporting other students. Costs like these can cause lasting financial consequences to the people who incurred such expenses.
In the optional free-form response section of our survey, respondents voiced opinions about unreimbursed expenses. Many responses repeated similar themes: respondents personally knew many people who paid out-of-pocket to do research, the costs were significant, reimbursement delays were a serious problem, and students in particular are affected by this. Many noted that bureaucratic issues such as complex paperwork or poor grant administration infrastructure made it impossible to get reimbursed even if money was available. And many respondents also noted that they felt obligated to incur these costs to progress in their career. Even with not all respondents providing qualitative responses, the comments and sentiments of those who did were so overwhelmingly negative that it is unlikely overall sentiment would be positive or even neutral. The following quotes from several different respondents are examples of the negative sentiments:
“For those of us early in our careers, the lack of funding and support and the financial burdens we’ve endured to reach this point in our career have taken a toll on us and sadly our sacrifices and efforts are not paying off to get us to a good career…. It’s not what I worked hard for and it’s not what I had planned for.”“It has gotten to the point where [SciSpends are] just expected from the student. My adviser asked me once… ‘well can’t you just ask your parents for the money?’ ”“It really sucks. For fieldwork our clothing, boots, tents, backpacks etc. alone add up to thousands of dollars and are rarely provided or reimbursed. Yet my own personal use and wear and tear on this gear would be a tiny fraction of what gets used for work. Sometimes our field equipment is substandard or broken and I’ve been pressured to use my own personal equipment instead (laptop, GPS, etc.)”“I very recently left my PhD program because I could not afford to spend any income on research or survive on my pathetic stipend.”“I was invited to speak in a symposium at [a meeting] that starts today. This would have been very good for my career. I had to cancel because I could not afford the cost of flights for myself and my daughter plus the hotel costs ($300/night). I would be reimbursed the hotel and my flight but not until after the conference. It discriminates against people that do not come from privileged background to expect them to pay up front for scientific expenses.”“I waited 6 months at the beginning of two of my research projects having to pay everything from my pocket. I was refunded only after 6 months. If I had no money I would have lost an entire season […] and that would have led to a 1-year delay in my work.”“I was often many thousands out of pocket. One conference cost more than my monthly wage and took 3 months to get back. This required the use of credit cards to live—10 years later I’m still paying it off!”“While post-docing if I hadn’t spent my own money on fieldwork travel conference travel etc. I would never have generated the publications that eventually got me a tenured position.”
We acknowledge that disciplines other than science incur “pay to work” expenses. Employees of many large corporations are required to pay for their own uniforms. Professionals in many fields pay out of pocket to maintain certifications. School teachers often buy supplies for children in their classes. But just because other fields do this, does not imply we must import these unjust policies to science. A race to the bottom only encourages exploitation and unsafe practices and creates economic barriers to participation in science.
Conclusions
We make two recommendations for immediate action.
First, a formal survey needs to be conducted to determine whether the findings of this exploratory survey are representative of the general population—both for biologists and for all scientists. We believe funding agencies or professional organizations with defined memberships would be best-positioned to design and execute a survey of this nature. This will enable researchers to record survey response rates, ensure demographic representation, and thus have a stronger basis on which to assess the magnitude, extent, and drivers of this issue (Singh 2007). This survey should further explore issues of gender, race, sexuality, and other intersectional factors that our survey did not address.
However, our survey demonstrates that whether unreimbursed expenses are commonplace or not, this problem has affected a large number of scientists and is probably continuing to do so. We propose that the precautionary principle should be invoked—until evidence shows there is no problem, we must act as if the problem exists. Yet, what action is appropriate may be unclear because while some expenses should clearly always be reimbursed (personal protective equipment, for example), others may be context-dependent (e.g., conference attendance), and for others still there may be legitimate debate about whether it is reasonable for scientists to expect a reimbursement.
Therefore, our second recommendation is that the scientific community establish a code of best practices that articulates what expense types should always, sometimes, and generally not be reimbursed. We recommend, as a starting point, the principle that anything core to professional practice should always be reimbursed. This includes reimbursing scientists (including students and postdocs) for personal protective equipment, safety training, lab equipment, and other products or services that are essential to safe and productive science. But without clarity on norms, it is easy for supervisors to pass costs on to the individual. Scientists who can afford to pay will do so. Those who cannot, will cut corners and use substandard or unsafe equipment, or may simply be excluded from the discipline altogether.
When the scientific community has generated these guidelines, funding agencies should make sure grants provide the resources necessary to provide these critical reimbursements. Further, when assessing budget proposals they should scrutinize to ensure researchers have budgeted resources for themselves and their trainees in critical cost categories.
Acknowledgements
We thank all the scientists who responded to this survey and who entrusted us with their data on this sensitive issue. We thank everyone who shared this survey on social media, on list-servs, and amongst their professional network so as to reach the widest audience possible. We thank Allie Wilkinson for featuring this survey in Science Magazine, thus expanding our pool of respondents (Wilkinson 2015). We thank Sheila Colla, Adam Ford, and Philip Loring for reviewing this manuscript and providing helpful comments. We thank two anonymous reviewers for providing detailed peer reviews of this manuscript. The lead author wrote this paper in St. John’s, Newfoundland and Labrador, and we respectfully acknowledge the island of Newfoundland as the ancestral homelands of the Mi’kmaq and Beothuk. We would also like to recognize the Inuit of Nunatsiavut and NunatuKavut and the Innu of Nitassinan, and their ancestors, as the original people of Labrador. We strive for respectful relationships with all the peoples of this province as we search for collective healing and true reconciliation and honour this beautiful land together.
References
Bilimoria D, and Stewart AJ. 2009. “Don’t ask, don’t tell”: the academic climate for lesbian, gay, bisexual, and transgender faculty in science and engineering. NWSA Journal, 21: 85–103.
Fournier AMV, and Bond AL. 2015. Volunteer field technicians are bad for wildlife ecology. Wildlife Society Bulletin, 39: 819–821.
Freund C. 2017. The hidden costs of fieldwork are making science less diverse. Massive Science [online]: Available from massivesci.com/articles/science-fieldwork-funding-system-reform/.
Gilmartin SK, Li E, and Aschbacher P. 2006. The relationship between interest in physical science/engineering, science class experiences, and family contexts: variations by gender and race/ethnicity among secondary students. Journal of Women and Minorities in Science and Engineering, 12: 179–207.
Hall A. 2015. PhD requires technology—is this something I will have to fund? Academia Stack Exchange [online]: Available from academia.stackexchange.com/questions/43496/phd-requires-technology-is-this-something-i-will-have-to-fund.
Harper SR. 2012. Race without racism: how higher education researchers minimize racist institutional norms. The Review of Higher Education, 36: 9–29.
Heckman JJ. 1990. Selection bias and self-selection. In Econometrics. The New Palgrave. Edited by J Eatwell, M Milgate, and P Newman. Palgrave Macmillan UK, London, UK. pp. 201–224.
Hofstra B, Kulkarni VV, Galvez SM-N, He B, Jurafsky D, and McFarland DA. 2020. The diversity–innovation paradox in science. Proceedings of the National Academy of Sciences of the United States of America, 117: 9284–9291.
Hong J. 2018. The high cost of opportunity: paying for academic conferences. Diverse Issues in Higher Education [online]: Available from diverseeducation.com/article/108234/.
Langin K. 2019. Hefty university fees are sending some grad students to food banks. Science.
Mählck P. 2001. Mapping gender differences in scientific careers in social and bibliometric space. Science, Technology, & Human Values, 26: 167–190.
Malloy J. 2020. Stop making graduate students pay up front for conferences. Nature.
Marleau JN, and Girling KD. 2017. Keeping science’s seat at the decision-making table: mechanisms to motivate policy-makers to keep using scientific information in the age of disinformation. FACETS, 2: 1045–1064.
Murgia A, and Poggio B (Editors). 2019. Gender and precarious research careers: a comparative analysis. Routledge Research in Gender and Society. Routledge, Abingdon, Oxon, UK; New York, New York.
R Core Team. 2019. R: a language and environment for statistical computing. R Foundation for Statistical Computing, Vienna, Austria.
Reed M. 2017. The cost of not traveling. Inside Higher Ed [online]: Available from insidehighered.com/blogs/confessions-community-college-dean/cost-not-traveling.
Serio T. 2016. Speak up about subtle sexism in science. Nature, 532: 415.
Sheth MJ. 2019. Grappling with racism as foundational practice of science teaching. Science Education, 103: 37–60.
Singh K. 2007. Quantitative social research methods. SAGE Publications India Pvt. Ltd., New Delhi, India.
Tao Y. 2018. Earnings of academic scientists and engineers: intersectionality of gender and race/ethnicity effects. American Behavioral Scientist, 62: 625–644.
Tao Y, and McNeely CL. 2019. Gender and race intersectional effects in the U.S. engineering workforce: who stays? Who leaves? International Journal of Gender, Science and Technology, 11: 181–202.
Valantine HA, and Collins FS. 2015. National Institutes of Health addresses the science of diversity. Proceedings of the National Academy of Sciences of the United States of America, 112: 12240–12242.
Wennerås C, and Wold A. 1997. Nepotism and sexism in peer-review. Nature, 387: 341–343.
West JD, Jacquet J, King MM, Correll SJ, and Bergstrom CT. 2013. The role of gender in scholarly authorship. PLoS ONE, 8: e66212.
Wickham H, Averick M, Bryan J, Chang W, McGowan L, François R, et al. 2019. Welcome to the tidyverse. Journal of Open Source Software, 4: 1686.
Wilkinson A. 2015. Survey asks: how much personal cash do you spend on your science? Science.
Yoder JB, and Mattheis A. 2016. Queer in STEM: workplace experiences reported in a national survey of LGBTQA individuals in science, technology, engineering, and mathematics careers. Journal of Homosexuality, 63: 1–27.
Supplementary material
Supplementary Material 1 (PDF / 305 KB)
- Download
- 305.95 KB
Supplementary Material 2 (DOCX / 13.4 KB)
- Download
- 13.42 KB
Supplementary Material 3 (ZIP / 147 KB)
- Download
- 147.55 KB
Supplementary Material 4 (DOCX / 364 KB)
- Download
- 364.30 KB
Supplementary Material 5 (DOCX / 313 KB)
- Download
- 313.55 KB
Information & Authors
Information
Published In
FACETS
Volume 5 • Number 1 • January 2020
Pages: 989 - 1005
Editor: Marie-Claire Shanahan
History
Received: 16 April 2020
Accepted: 18 September 2020
Version of record online: 10 December 2020
Copyright
© 2020 Favaro and Hind-Ozan. This work is licensed under a Creative Commons Attribution 4.0 International License (CC BY 4.0), which permits unrestricted use, distribution, and reproduction in any medium, provided the original author(s) and source are credited.
Data Availability Statement
All relevant data are within the paper and in the Supplementary Material.
Key Words
Sections
Subjects
Plain Language Summary
How much does it cost to be a biologist? For some: an awful lot.
Authors
Author Contributions
All conceived and designed the study.
All performed the experiments/collected the data.
BF analyzed and interpreted the data.
All contributed resources.
All drafted or revised the manuscript.
Competing Interests
Brett Favaro is an Editorial Board member.
Funding Information
We received no specific funding to conduct this research.
Metrics & Citations
Metrics
Other Metrics
Citations
Cite As
Brett Favaro and Edward Hind-Ozan. 2020. SciSpends: an exploratory survey investigating nonreimbursed expenses in biological sciences. FACETS.
5(1): 989-1005. https://doi.org/10.1139/facets-2020-0026
Export Citations
If you have the appropriate software installed, you can download article citation data to the citation manager of your choice. Simply select your manager software from the list below and click Download.
Cited by
1. Being ECR in marine science: Results of a survey among early-career marine scientists and conservationists
2. Improving the Accessibility of Federal Graduate Research Awards in Canada
3. Unpaid Work in Marine Science: A Snapshot of the Early-Career Job Market