Having it all: hybridizing conventional and community science monitoring for enhanced data quality and cost savings
Abstract
Large-scale monitoring is used to track population trends for many ecologically and economically important wildlife species. Often, population monitoring involves professional staff travelling to collect data (i.e., conventional monitoring) or in efforts to reduce monitoring costs, by engaging volunteers (i.e., community science). Although many studies have discussed the advantages and disadvantages of conventional vs. community science monitoring, few have made direct, quantitative comparisons between these two approaches. We compared data quality and financial costs between contemporaneous and overlapping conventional and community science programs for monitoring a major forest pest, the spruce budworm (Choristoneura fumiferanae Clem.). Although community science trapping sites were clumped around urban areas, abundance estimates from the programs were strongly spatially correlated. However, annual program expenditures were nearly four times lower in the community science versus the conventional program. We modelled a hypothetical hybrid model of the two programs, which provided full spatial coverage and potentially the same data, but at half the cost of the conventional program and with the added opportunity for public engagement. Our study provides a unique quantitative analysis of merits and costs of conventional versus community science monitoring. Our study offers insights on how to assess wildlife monitoring programs where multiple approaches exist.
Introduction
Large-scale population monitoring informs decision-making underpinning the management of many ecologically and economically important organisms (McDonald et al. 2007; Tobin et al. 2011; Counihan et al. 2018; Briem et al. 2018). Most population monitoring—what we refer to as conventional monitoring—is overseen exclusively by paid professional staff from governmental or nonprofit agencies that are trained in best practices for identifying and monitoring target species. Although conventional monitoring is designed to provide consistent data collection protocols, its execution can be expensive and logistically complex. This is especially true for populations that span large geographic areas, such as for many insect pests in forestry or agriculture (Osborne et al. 2002). These challenges can place significant constraints on the range, frequency, and sustainability of conventional monitoring efforts.
In recent decades there have been efforts to use community science (also known as citizen science) to enhance population monitoring through recruiting volunteers as data collectors in their own communities while scientists continue to design the monitoring program’s research questions and methodology. (Dickinson et al. 2012). Although community science has been used for centuries, its increased popularity as a data collection method is attributed to technological enhancements, emphasis on public engagement, increasing the general public’s knowledge, and the need for transparency on contentious scientific issues and studies (Cooper 2016). Community science has several advantages over conventional monitoring. For example, recruiting volunteers to monitor target populations largely removes the need for staff travel to visit monitoring sites, thus reducing expenses associated with wages and travel. Community science also offers ancillary benefits for public engagement, potentially enhancing public knowledge and awareness of critical or contentious scientific issues (Dickinson et al. 2010; Conrad and Hilchey 2011; Pocock et al. 2018; Johns et al. 2019). On the other hand, volunteer-collected data may be of lower quality than that collected by professional staff, especially when specialized skills are required (e.g., species identification, Crall et al. 2011). Moreover, volunteer-collected data may be more concentrated in urban rather than rural areas, potentially creating an inaccurate picture of regional population trends (Goldstein et al. 2014). Although numerous studies and reviews discuss the benefits and shortcomings of community science (e.g., Conrad and Hilchey 2011; Dickinson et al. 2012; Cooper 2016) and conventional monitoring (e.g., Witmer 2005; Marsh and Trenham 2007), few studies have compared contemporaneous and overlapping monitoring programs to quantify the trade-offs between these approaches (but see Goldstein et al. 2014).
Here, we discuss a case study comparing contemporaneous conventional and community science programs for monitoring spruce budworm (Choristoneura fumiferanae Clemens, Lepidoptera: Tortricid), a major defoliating insect pest of balsam fir (Abies balsamea) and spruce (Picea spp.). In New Brunswick, Canada, where our study focused, ongoing management operations for spruce budworm (Johns et al. 2019; MacLean et al. 2019) derive data from two large-scale moth monitoring programs involving baited pheromone traps, one conventional and one community science (Fig. 1). Since 1995, a conventional monitoring program run by the provincial government has deployed pheromone traps to approximately 100 sites over New Brunswick’s 7.3 million ha (approx. 85% of which is forest). In late spring, professional staff drive to predetermined sites throughout the province where they set up three pheromone traps per site. In late summer, which is around the end of the flight period, staff return to the sites to collect traps. This approach provides a single estimate of total moth abundance per trapping site each year. The community science program, known as Budworm Tracker (healthyforestpartnership.ca/budworm-tracker/), has been running contemporaneously in the same area since 2015 (Carleton et al. 2020). Budworm Tracker mails free spruce budworm monitoring kits to 118 volunteers to set up on their properties (e.g., back yard, woodlot, or cottage) in New Brunswick (Fig. 1). These kits include detailed instructions for trap setup and monitoring, a pheromone trap, a pheromone lure, moth collection tools, storage bags, and data sheets. One of the advantages of Budworm Tracker is that volunteers check their traps and collect captured moths 1–3 times per week and at the end of the summer return their collections to the program manager in a prepaid shipping envelope. Having multiple moth counts over the season provides useful data for biological questions around regional moth dispersal phenology and population genetics (Larroque et al. 2019). If volunteers opt to remain in the program, they keep their traps and receive a smaller refill kit with a new pheromone lure and collection supplies the following year, at a reduced cost for the program (Carleton et al. 2020).
Fig. 1.
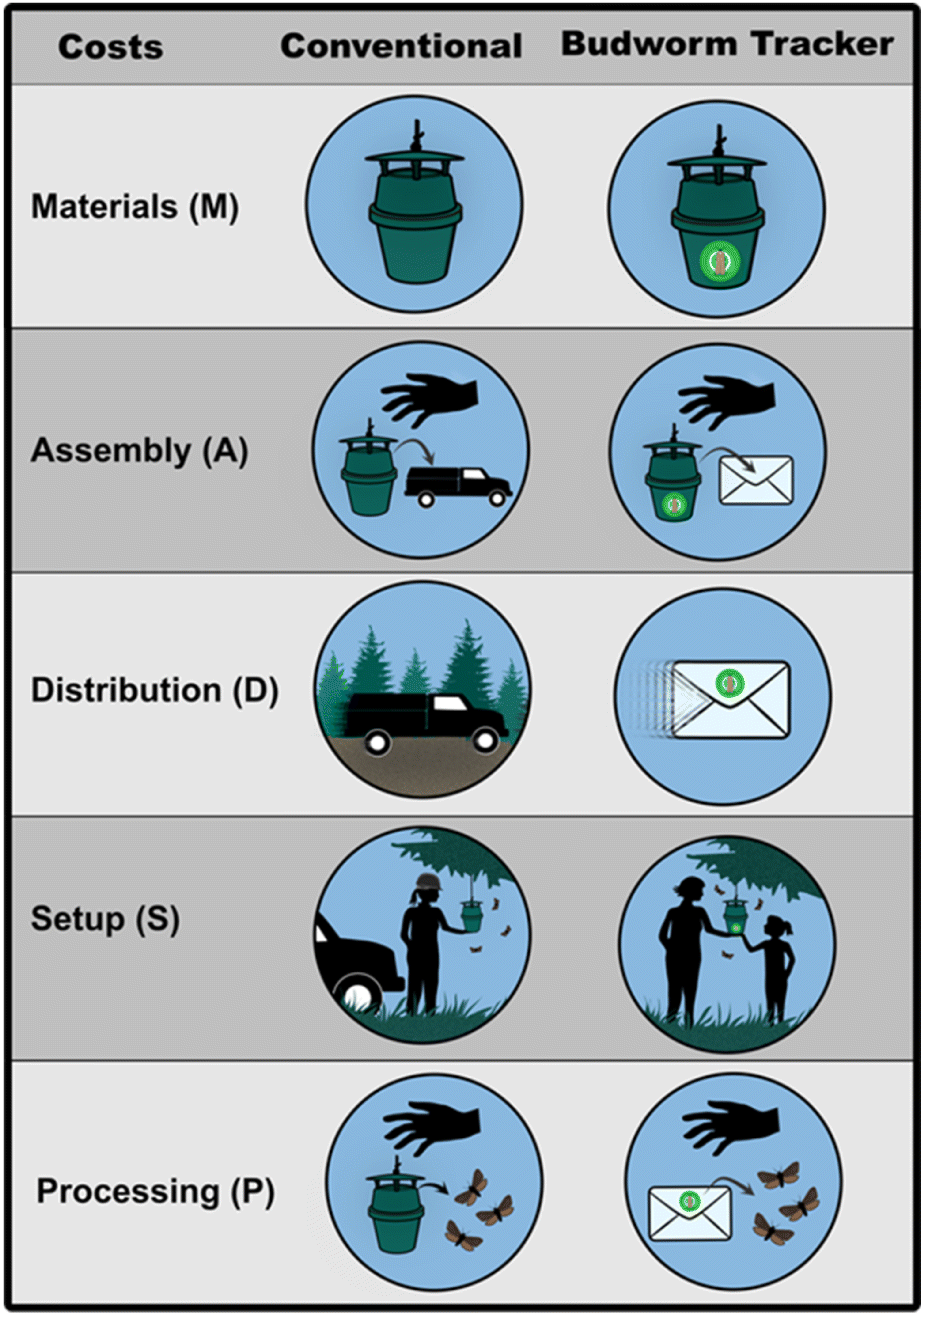
The co-occurrence of a conventional and community science program for monitoring spruce budworm provided us with a unique opportunity to quantitatively compare three key features of these two approaches. First, we compared the geospatial distribution of sites to better understand differences in regional trapping coverage between the two programs. Second, we compared the annual trap catch abundance trends from each program to assess potential spatial biases associated with the tendency of Budworm Tracker volunteers to participate near urban areas versus the conventional monitoring program’s more uniform trapping array. Third, we compared the financial costs of each program in terms of materials, assembly, distribution (delivery, retrieval and staffing costs), and processing of the trap catches (Fig. 1). In our calculations we took into account different potential trap-checking frequencies (e.g., from once per year to multiple times per week). Finally, we used insights from these analyses to develop and evaluate a potential hybrid monitoring program involving a mix of conventional and Budworm Tracker monitoring sites. In doing so we hoped to emphasize how these disparate approaches to monitoring need not be framed as mutually exclusive but rather could be complementary components in a more comprehensive monitoring program. While our study is specific to spruce budworm monitoring, it provides insights that could be used to improve monitoring programs for many other plant and animal populations.
Materials and methods
Data sources
We used data on trap locations, annual trap catch abundance, and program costs from the managers of each program. Data for the conventional approach were provided by the Province of New Brunswick’s Department of Energy and Resource Development (E. Knopf, personal communication 2019), whereas data for Budworm Tracker were maintained as part of the program’s funding requirement (Carleton et al. 2020). Since program costs were consistent across years, for simplicity we only used a subset of two years (2016 and 2017) for our study.
Geospatial distribution
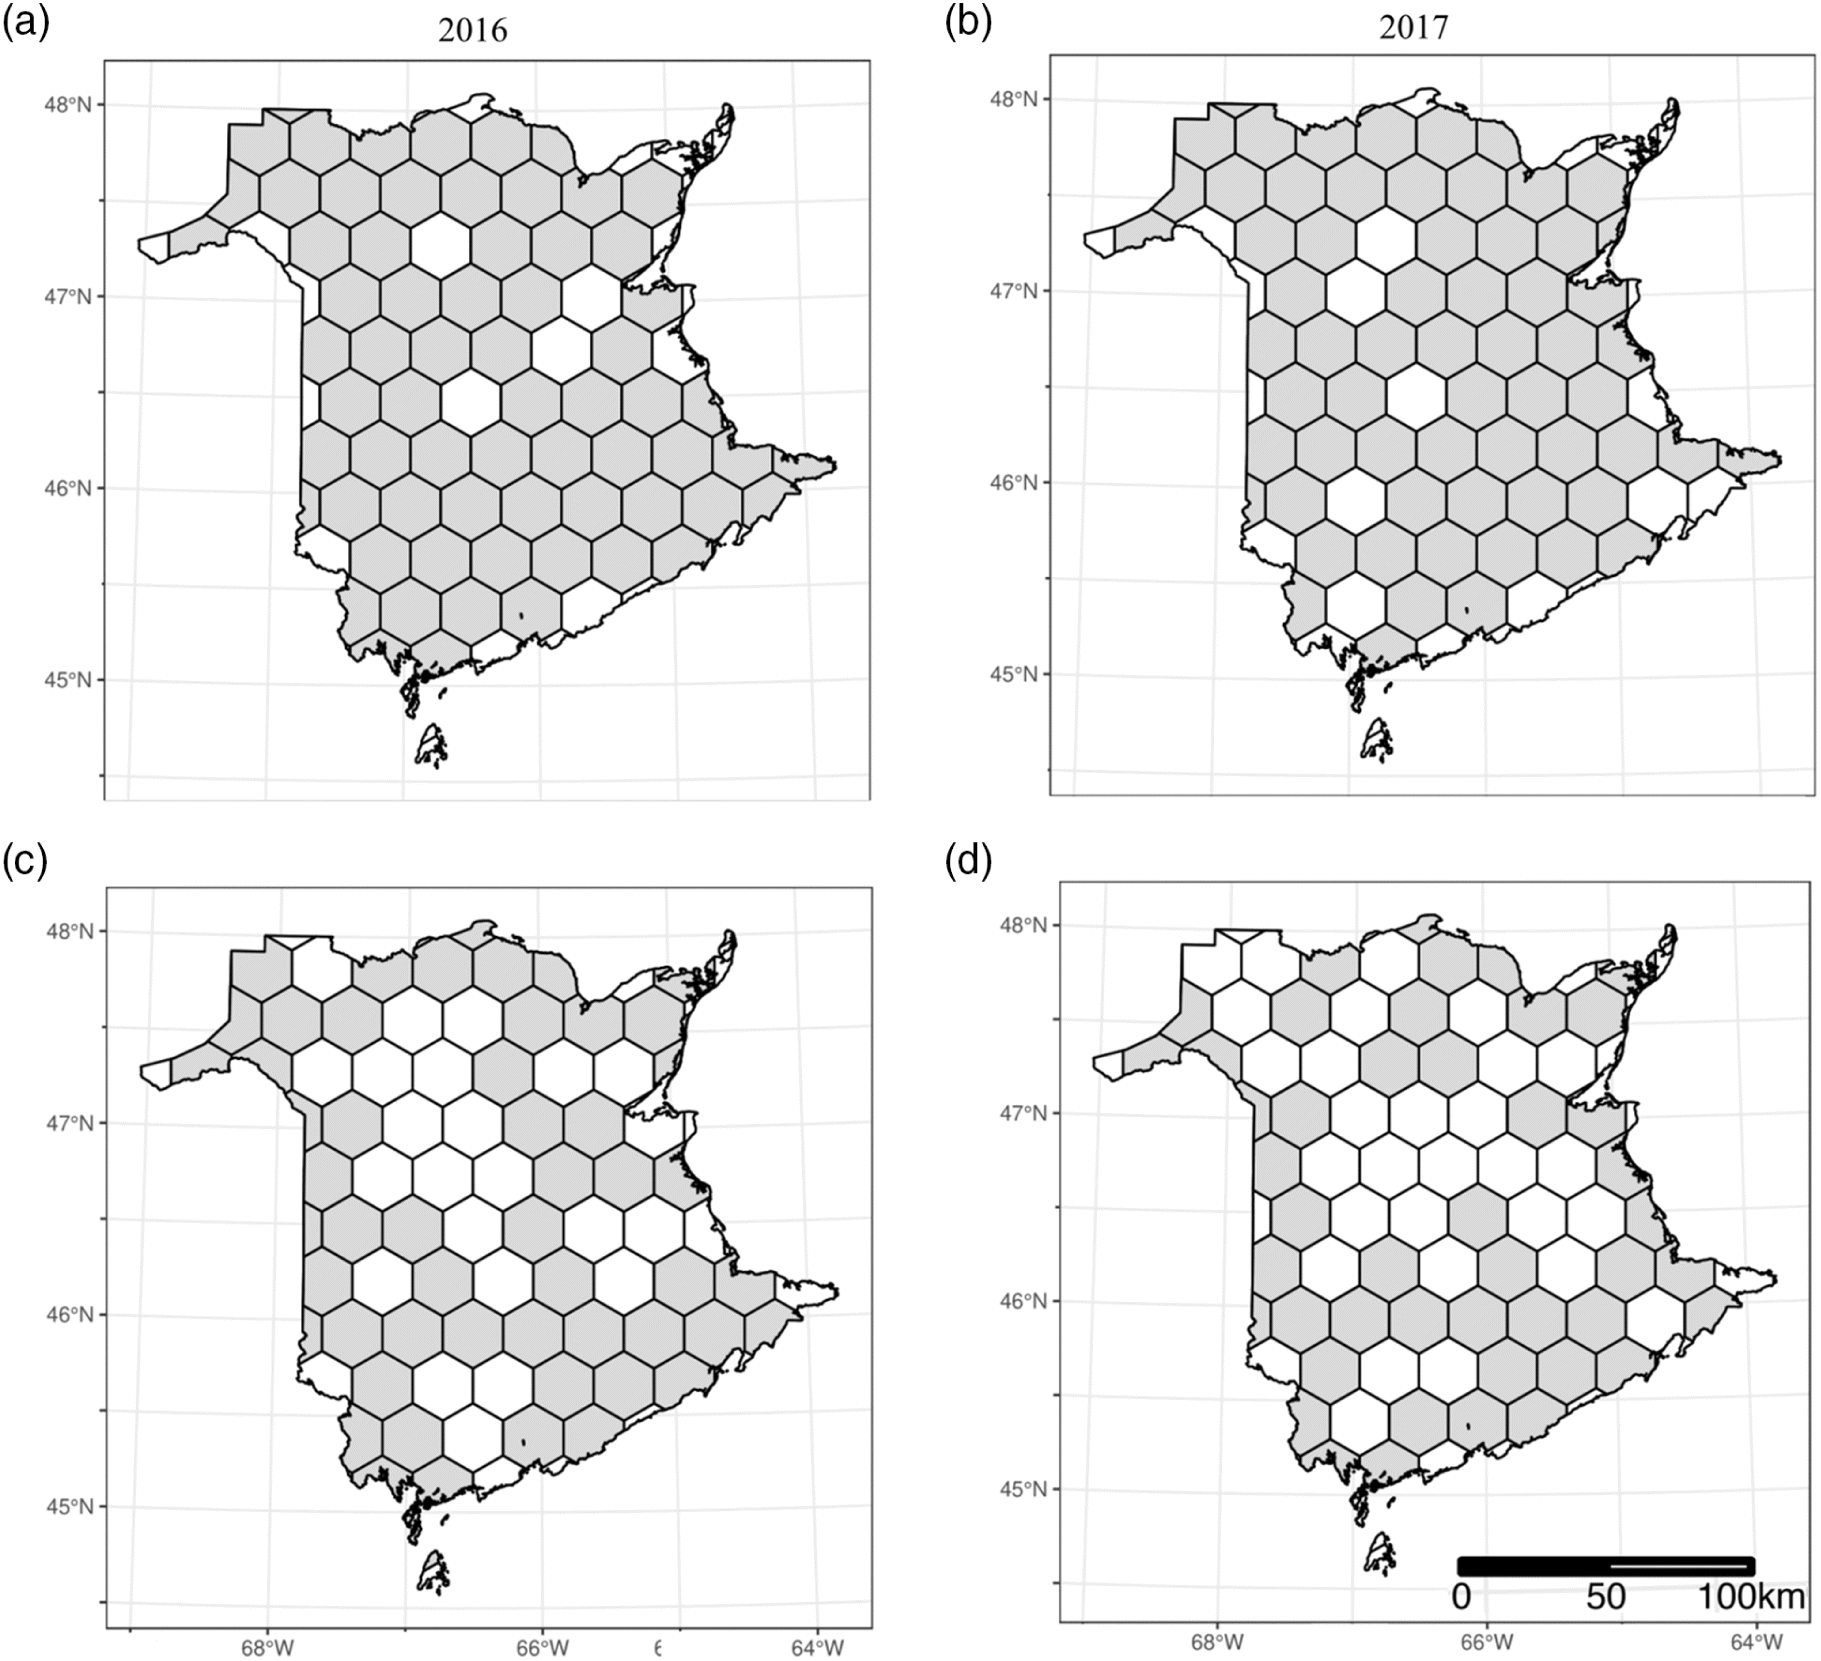
To assess the 2016 and 2017 geospatial distribution of monitoring sites between the two programs we partitioned the study area into a uniform hexagonal lattice using the “sf” R package (Pebesma 2018) in R version 3.6.3 (R Development Core Team 2016). We used a hexagonal lattice because it is symmetrical to its nearest neighboring cells, reduces edge effect, and demonstrates site connectivity (Birch et al. 2007). Although the partitioning of cell sizes within a lattice can be based on numerous criteria depending on the research design, for the purpose of this study our hexagonal cell size is based on the maximum distance between conventional monitoring sites. By partitioning our study area into uniform hexagonal cells, each cell will have equal center-to-center distances to its neighbouring cells (Goldblat et al. 2018). This partitioning will highlight the spatial configuration and geospatial distribution of monitoring sites of each program. For the conventional program, with three traps 40 m apart at each site, we used the coordinates of the first trap set up to represent that site location.
Trap catch abundance
We assessed whether trap catches were correlated, across sites but within years, between the conventional and Budworm Tracker programs. We calculated the correlation using Pearson’s r, calculated using the “rcorr” function in the Hmisc R package (Harrell and Dupont 2015) in R version 3.6.3 (R Development Core Team 2016). For the conventional program where three traps were set up per site, we used the trap catch average. In the event that a trap was lost, we used the average of the remaining two traps.
Financial costs
To compare the costs of the two programs, we itemized and calculated all annual expenses based on 2016 and 2017 Canadian market prices including shipping expenses and the average hourly wage of an entry level forestry technician working for the provincial government (Table 1). Expenses featured in Table 1 were used to calculate total costs (C) for each monitoring program using the formula:where variables reflect costs per site associated with materials (M), assembly (A), processing (P), distribution (D), set up (S), number of trapping sites (n) and number of visits to those sites (v). Materials and processing are very similar for the two programs but assembly is different. Assembly for the conventional program simply consists of retrieving 100 pheromone traps, lures, and kill strips from storage then loading them into a field truck, which is short task that would only take a staff member approximately 1 min per site or 1 hour and 40 minutes to assemble all 100. However, assembly for the Budworm Tracker Program is more complex and includes constructing a box, printing off all instructions and data sheets, labeling and placing all materials needed to monitor in the box, and sealing the box to be picked up by the courier. Assembling the traps for a Budworm Tracker site would take a staff member approximately 3 minutes per site. Distribution costs were calculated using the “Your Places” feature in Google Maps’ to create a layer where we designed distribution routes throughout the province using the most logical and efficient routes that provided uniform distribution of sites. This application was used to design optimized routes because it calculates drive time based on different speed limits for paved and forestry road and tallies up total kilometers driven based on the number of sites set up. This application allowed us to theoretically maximize the number of sites set up on each route based on the road conditions (e.g., a high-speed paved road versus slow-speed forestry road), time spent driving, and distance between sites. Although this application doesn’t guarantee optimized routes and maximum numbers of sites that could be set up, it uses a realistic procedure for planning trap distribution and estimates the same amount of time and kilometers required to set up 100 monitoring sites as the conventional program managers. To assess monitoring scenarios where more than one trap check per season was desired, D and S would be multiplied by v to reflect the costs of multiple site visits. Note that this only applies to the conventional program (v ≥ 1) since in Budworm Tracker the volunteers conduct all trap checks at no additional expense to the program (i.e., v = 1).
Table 1.
| Cost per site ($CAD) | |||
|---|---|---|---|
| Costs | Itemized costs | Conventional | Budworm Tracker |
| Materials (M) | Pheromone lure | 9.99 | 3.33 |
| Kill strip | 8.31 | 2.77 | |
| Trap | 59.22 | 19.74 | |
| Stickers | — | 2.37 | |
| Shipping box and envelope | — | 1.30 | |
| Sample and freezer bags | — | 0.12 | |
| Pencil | — | 0.08 | |
| Vinyl gloves | — | 0.07 | |
| Total | 77.52 | 29.78 | |
| Assembly (A) | Wagesa for organizing materials | 0.30 | 3.00 |
| Total | 0.30 | 3.00 | |
| Distribution (D) | Shipping mail service | — | 22.76 |
| Fixed vehicle charges | 0.90 | — | |
| Vehicle usage charge | 18.93 | — | |
| Total fuel | 20.28 | — | |
| Total | 40.11 | 22.76 | |
| Setup (S) | Meal allowance | 15.37 | — |
| Accommodations | 20.80 | — | |
| Wagesa for site visits | 93.60 | — | |
| Total | 129.77 | 0.00 | |
| Processing (P) | Site processing costb | 3.60 | 6.00 |
| Total | 3.60 | 6.00 | |
Note
For simplicity, where there were small discrepancies in the costs between the two programs (e.g., due to the use of different distributors) we used the average cost between programs.
a
The average hourly wage ($18/h) of an entry forestry technician based on the Government of New Brunswick’s technical pay bands.
b
Consists of identifying, counting, and storing the trap catches and traps at the end of each trapping season (i.e., one check for the conventional and multiple for Budworm Tracker).
Although we used the standard (n) of 100 trapping sites set up in New Brunswick in our main calculations, we also wanted to examine how total costs might change if more or fewer sites were set up. For Budworm Tracker this calculation was straightforward as adding sites leads to a simple linear increase in all costs. In contrast, we predicted that the relationship for the conventional program is likely to be nonlinear owing to diminishing marginal costs of distribution and set up (D + S) with an increasing number of sites. More specifically, in the current conventional program, the 100 trapping sites are spread across the province. Thus, adding traps to the network would essentially entail filling spaces between current sites. Adding new sites is not likely to significantly increase D and S since the new sites would be set up nearby or on the way to other sites. We tested this scenario by using the same methods used to calculate the costs of distribution and set up for 100 sites using Google Maps to create distribution routes for 25, 50, 75, 100, and 150 sites and then incorporating these new values into our model. We fit these costs versus number of sites to the nonlinear function y = a – (a – b)(−cx) using the “nls” R package (Baty et al. 2015) in R version 3.6.3 (R Development Core Team 2016).
Hybrid scenarios
We developed a hybrid scenario for 100 trapping sites where the ratio of conventional to Budworm Tracker sites was 40:60. This ratio was based on the conclusions from our Geospatial Distribution results (described below) where Budworm Tracker was used to cover the majority of sites (60%) with conventional sites being used to fill in the gaps of the remaining sites (40%) where no volunteers could be found. In essence, this hybrid scenario was designed to provide relatively even trapping coverage across the province while obtaining some phenological data and maximizing the use of the less expensive Budworm Tracker approach. We calculated the costs of this hybrid scenario, using our formula for each program based on the number of sites allocated to each, and then added these values together.
Results
Geospatial distribution
Our analyses show the maximum distance between conventional sites is 35 km. Our trapping area was partitioned into 35-km hex-cells with a radius of 17.5 km (106 000 ha). On average between 2016 and 2017, the 118 community science monitoring sites covered 58% of the monitoring area, the majority of which (> 65%) are within town and city limits. The 100 sites of the conventional monitoring program cover on average 84% of the monitoring area, including both urban areas and isolated or noninhabited rural areas. The two programs combined provide 92% coverage of the entire monitoring area (Fig. 2). Only 4% of the hex-cells contained no conventional or community science sites (i.e., were inaccessible or traps were lost due to mischievous wildlife or inclement weather).
Fig. 2.
Trap catch abundance
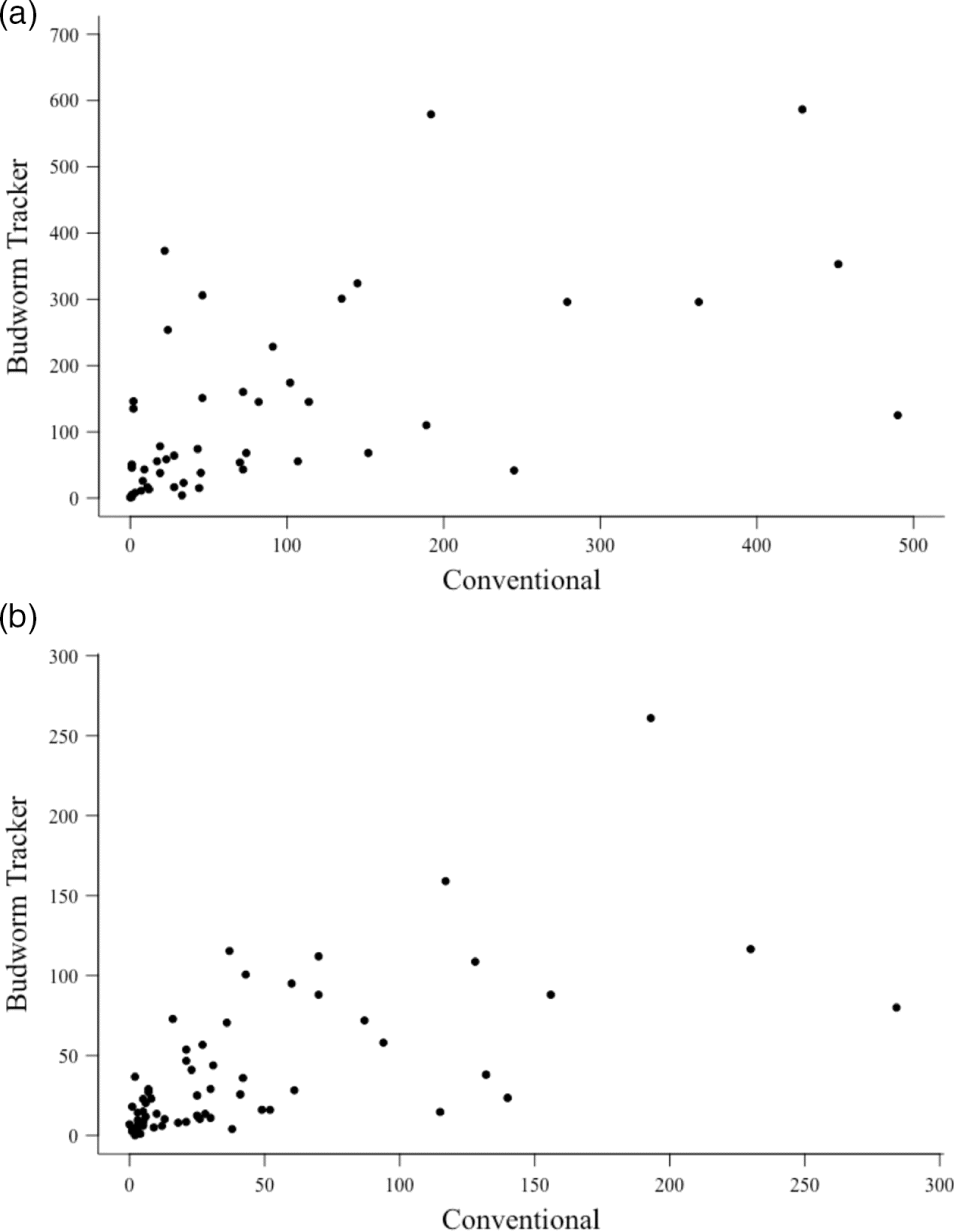
The conventional monitoring program’s annual trap catch abundances were significantly (P < 0.05) and positively correlated with those from Budworm Tracker in 2016 (r = 0.65) and 2017 (r = 0.58) (Fig. 3).
Fig. 3.
Financial costs
For a single season estimate of annual moth abundance, costs per trapping site were approximately 4 times higher in conventional monitoring ($CAD 251.30) compared with Budworm Tracker ($CAD 61.56), due primarily to the relatively high cost of distributing and setting up traps by professional staff (Table 1).
Increasing the frequency of site visits for additional trap checks added no extra cost to Budworm Tracker; however, additional site visits for the conventional program increased costs by 33% (∼$CAD 85) per visit. This disparity increased dramatically with every hypothetical increase in check frequency for the conventional program. For example, increasing trap check frequency to two times per week in the conventional program over the typical 9-week trapping period amplified total costs by more than six times per site compared with Budworm Tracker (Table 2).
Table 2.
| Cost per site ($CAD) | ||
|---|---|---|
| Trap check frequency | Conventional | Budworm Tracker |
| One collection | 251.3 | 61.54 |
| Once per week | 764.46 | 61.54 |
| Twice per week | 1528.92 | 61.54 |
| Thrice per week | 2293.38 | 61.54 |
The distribution costs of Budworm Tracker increased linearly with increasing site abundance (Fig. 4). In contrast, the distribution cost of conventional monitoring increased nonlinearly with site abundance, with a tendency to reach a plateau beyond ∼100 sites (Fig. 4). Distribution costs are a major component (60%–77%) of total costs for conventional monitoring.
Fig. 4.

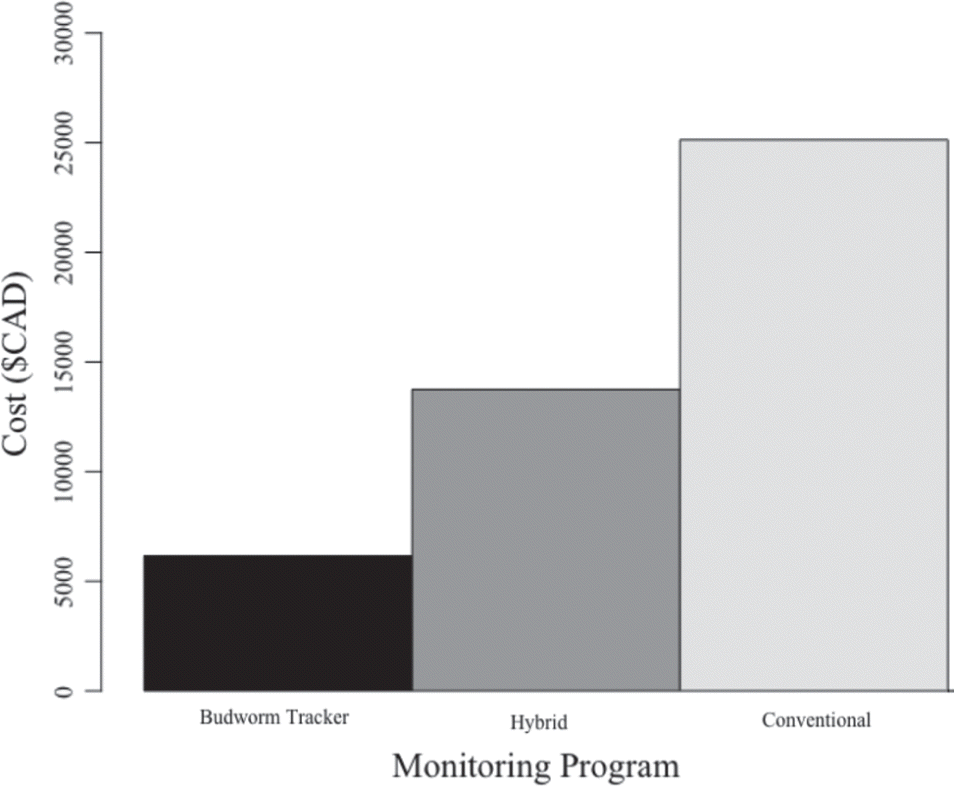
Hybrid scenarios
A hybrid program that provides full regional coverage with 60% Budworm Tracker and 40% conventional trapping sites was ∼45% less expensive than the conventional approach, but ∼55% more expensive than Budworm Tracker (Fig. 5).
Fig. 5.
Discussion
Ongoing spruce budworm monitoring efforts offered a unique opportunity to make direct quantitative comparisons between contemporaneous conventional and community science programs and to illustrate the key benefits and challenges inherent to each approach. The programs yielded similar moth abundance estimates per trap, but Budworm Tracker offered ∼40% less coverage than the conventional program, owing in part to the typically clumped distribution of Budworm Tracker volunteers near urban areas. In all monitoring scenarios Budworm Tracker was substantially less expensive to deploy than the conventional monitoring program. Even in the simplest scenario where traps were only checked at the end of the season—which is typical for most pheromone trap monitoring efforts for spruce budworm—the cost of Budworm Tracker was ∼75% lower than the conventional program. Our study is one of the first to quantitatively demonstrate some of the key financial and data quality tradeoffs between these two monitoring approaches, demonstrating many of the core costs and benefits that have been attributed to community science in the past (e.g., Dickinson et al. 2012). These two monitoring approaches need not be mutually exclusive and future efforts to develop hybridized programs could be an effective way of garnering the benefits of each program while also offsetting their respective shortcomings.
The debate of the efficacy, effort, and expenses of community science programs has been long ongoing (Chase and Levine 2015; West and Pateman 2016; Bela et al. 2016). We found two past studies calculating the costs of running community science programs, including Project FeederWatch (Dickinson et al. 2010) and the Marine Conservation Society (Nelms et al. 2017). However, these studies did not specifically assess the trade-offs for their community science program compared with conventional programs. In the study that was most comparable to our own, Goldstein et al. (2014) considered community sighting reports versus conventional hair-trap monitoring for invasive gray squirrels in Ireland. In contrast to our results, Goldstein et al. (2014) found that the community approach was actually more expensive, but that it repaid that investment through greatly increased power to detect the study species at low density. However, in their study the conventional method used relatively few trapping sites (i.e., four over 4.2 km2 compared with the 15 116 km2 of the community science method). Most likely, a larger hair-trapping program covering a similar area to the community science program would be more expensive than the community science approach. The authors concluded that community science was adequate in detecting their target species, but monitoring sites were clumped near urban areas thus potentially limiting detection capacity in outlying rural areas (Goldstein et al. 2014). Budworm Tracker volunteers also tended to live around cities and towns, resulting in clumping of sites, although due to the large number of volunteers recruited this had little impact on overall estimates of abundance compared with conventional monitoring sites. Such biases can be a challenge in community science in general (Geldman et al. 2016), reducing the uniformity of sampling coverage over large geographical areas. To offset this overrepresentation in urban areas, some efforts have been made recently in Budworm Tracker to increase engagement with groups that work in these less-inhabited areas, such as forestry companies, hunting and fishing outfitters, and provincial and national parks (Carleton et al. 2020).
An interesting insight from our analyses was the observation that cost per additional trap beyond a certain point in the conventional program tended to moderate because distribution costs declined as site density increased along existing distribution routes. This differs from Budworm Tracker, which increased in costs linearly with increasing sites, albeit at a much slower rate than the conventional program. These differences in costing relationships essentially reflected the differing modes of distributing traps in each program. In the conventional program, once monitoring sites have been expanded to cover the full extent of the monitoring area (i.e., 100 trapping sites), the cost per trap of adding trapping sites along that trapping network tended to plateau. The beginning of the plateau reflects the point at which no noteworthy distribution costs (e.g., vehicle expenses and kilometers) are added in the process of adding traps, all of which will be placed in the spaces between the main trapping network. Only staffing costs (e.g., wages, meal allowance, and accommodation) are likely to continue to increase owing to the added handling time for trap set up. It is worth noting that although increasing sites beyond the typical 100 sites may not incur dramatically higher costs, from a practical standpoint there is a saturation point of both quantity of sites and resources available in terms of staffing, vehicles, and time. A conventional program manager might prefer to have more trapping sites but may not be willing to add that investment given other priorities (such as having other pests to monitor). Increasing trap check frequency may also be deemed impractical unless there is some management context for having more fine-scale phenological data on moth activity (i.e., for determining the timing of control treatments or other monitoring efforts).
Costs for a conventional program increased steeply with each additional day of trap checking during the flight period (i.e., $CAD 85 per check, per site). Although for spruce budworm these repeated trap-check data are not essential for most management monitoring operations (Johns et al. 2019), they are often useful for ecological studies on moth flight phenology and regional dispersal (Carleton et al. 2020). If more frequent trap checks are desired, community science may be a more feasible approach to acquire these data.
Although conventional monitoring programs will likely remain a priority for government and nonprofit agencies because they are mandated policy deliverables, community science may be a logical complement to decrease monitoring efforts and expenses. As a side benefit, they are also likely to increase public engagement and knowledgeability (Dickinson et al. 2012; Lewandowski and Oberhauser 2015). Our study suggests that a hybrid model combining community science with conventional monitoring could be an effective avenue for achieving the benefits of both monitoring approaches. A hybrid program would reduce the costs of a conventional monitoring program while still providing a fairly uniform trap distribution by expanding coverage to include rural areas and isolated forests. A hybrid program could “check all the boxes” in terms of cost savings, public outreach, uniform trap distribution, and both annual abundances and phenological data for managers. Our calculations for our hybrid scenario suggest that incorporating community science could reduce annual costs by as much as 50% even if only a single annual estimate is desired. The addition of community science comes at a modest cost, even if conventional monitoring is preferred, and could be useful to augment trapping throughout the region, while also increasing public awareness of the target species. Our study provides a potential framework for comparing potential monitoring approaches in other systems as well as a basis for considering how multiple approaches might be integrated into a more hybridized approach.
Although our study focuses on spruce budworm, insights and evaluation methods used here are highly relevant to other monitoring programs and systems. The basic categories used in our formula for calculating financial costs (Fig. 1) are more or less standard parts of most monitoring programs. As such, our formula and general approach to evaluating the relative costs of these approaches could be adapted for developing and debating how to approach monitoring challenges for other wildlife, especially where conventional and community science approaches are available. In general, the lack of examples of these sorts of analyses in the scientific literature suggests that more work could be done to evaluate the merits and shortcomings of different monitoring approaches to determine or how to potentially blend them to yield a higher quality of data at a lower cost.
Conclusion
Despite the groundswell of community science programs in recent decades, there are still many gaps in our understanding of its efficacy and cost-effectiveness relative to other approaches. Such analyses are essential for future efforts to build more efficient and effective monitoring programs. Our study suggests that some level of hybridization might provide a valuable approach to capitalizing on the benefits of both community science and conventional monitoring programs while offsetting each of their inherent disadvantages. In particular, our study provides some scenarios for how one might balance these trade-offs to better achieve desired monitoring outcomes. Efficient and effective monitoring approaches will become all the more important in the future as costs and the need for public engagement around science issues continue to rise.
Acknowledgements
First and foremost, we thank our many Budworm Trackers who are too numerous to list by name—they are the backbone of this program and we are grateful for their continued participation and enthusiasm. We would also thank the dedicated groups that are instrumental in maintaining this program on a year-to-year basis and the program’s provincial and state leaders. We would like to thank Eric Knopf, Justin Chase, Doug Winters, and Drew Carleton for their assistance in obtaining the conventional monitoring program costs. We thank Ian DeMerchant for assistance in ArcGIS on an earlier version of this paper’s methods. We also thank Dr. Sara Edwards in her assistance with managing the Budworm Tracker program’s data and the R code for this paper. Financial support was provided by Natural Resources Canada.
References
Baty F, Ritz C, Charles C, Brutsche M, Flandrois JP, and Delignette-Muller ML. 2015. A toolbox for nonlinear regression in R: the package nlstools. Journal of Statistical Software, 66(5): 1–21.
Bela G, Peltola T, Young JC, Balázs B, Arpin I, Pataki G, et al. 2016. Learning and the transformative potential of citizen science. Conservation Biology, 30(5): 990–999.
Birch CPD, Oom SP, and Beecham JA. 2007. Rectangular and hexagonal gids used for observation, experiment and simulation in ecology. Ecological Modeling, 206: 347–359.
Briem F, Dominic AR, Golla B, Hoffmann C, Englert C, Herz A, and Vogt H. 2018. Explorative data analysis of Drosophila suzukii trap catches from a seven-year monitoring program in Southwest Germany. Insects, 9(4): 125.
Carleton RD, Owens E, Blaquière H, Bourassa S, Bowden JJ, Candau J-N, et al. 2020. Tracking insect outbreaks: A case study of community-assisted moth monitoring using sex pheromone traps. FACETS, 5: 557–558.
Conrad CC and Hilchey KG. 2011. A review of citizen science and community-based environmental monitoring: Issues and opportunities. Environmental Monitoring and Assessment, 176: 273–291.
Cooper C. 2016. Citizen science: How ordinary people are changing the face of discovery. The Overlook Press, New York, New York.
Counihan TD, Waite IR, Casper AF, Ward DL, Sauer JS, and Irwin ER. 2018. Can data from disparate long-term fish monitoring programs be used to increase our understanding of regional and continental trends in large river assemblages? PLoS ONE, 13(1): e0191472.
Chase SK and Levine A. 2015. A framework for evaluation and designing citizen science programs for natural resources monitoring. Conservation Biology. 30(3): 456–466.
Crall AW, Newman GJ, Stohlgren JS, Holfelder KA, Graham J, and Waller DM. 2011. Assessing citizen science data quality: An invasive species case study. Conservation Letters, 4: 433–442.
Dickinson JL, Zuckerberg B, and Bonter DN. 2010. Community science as an ecological research tool. Annual Review of Ecology and Systematics, 41: 149–172.
Dickinson JL, Bonney R, Louv R, and Fitzpatrick JW. 2012. Citizen science: Public participation in environmental research. Cornell university Press, Comstock publishing Associates. New York, New York.
Geldman J, Heilmann-Clausen J, Holm TE, Levinsky I, Markussen B, Olsend K, et al. 2016. What determines Geospatial bias in citizen science? Exploring four recording schemes with different proficiency requirements. Diversity and Distributions, 22: 1139–1149.
Goldblat R, Stuhlmacher MF, Tellmam B, Clinton N, Hanson G, Georgescu M, et al. 2018. Using Landsat and nighttime lights for supervised pixel-based image classification or urban land cover. Remote Sensing of Environment, 205: 253–275.
Goldstein EA, Latwon C, Sheehy E, and Butler F. 2014. Locating species range frontiers: a cost and efficiency comparison of citizen science and hair-tube survey methods for use in tracking an invasive squirrel. Wildlife Research, 41: 64–75.
Harrell FE and Dupont C. 2015. Hmisc: Harrell Miscellaneous. R package version 4.4-1. [online]: Available from cran.r-project.org/web/packages/Hmisc/index.html.
Johns RC, Bowden JJ, Carleton RD, Cooke BC, Edwards S, Emilson EJS, et al. 2019. A conceptual framework for the spruce budworm early intervention strategy: Can outbreaks be stopped? Forests, 10(10): 910.
Larroque J, Legault S, Johns RC, Lumley L, Cusson M, Renaut S. et al. 2019. Temporal variation in Geospatial genetic structure during population outbreaks: Distinguishing among different potential drivers of Geospatial synchrony. Evolutionary Applications, 12(10): 1931–1945.
Lewandowski EJ and Oberhauser KS. 2015. Butterfly citizen scientists in the United states increase in their engagement in conservation. Biological Conservation, 201: 106–112.
MacLean DA, Amirault P, Amos-Binks L, Calreton D, Hennigar C, Johns RC, and Régnière J. 2019. Positive results of an early intervention strategy to suppress a spruce budworm outbreak after five years of trials. Forests, 10(5): 448.
Marsh DM and Trenham PC. 2007. Current trends in plant and animal population monitoring. Conservation Biology, 22(3): 647–655.
McDonald LL, Bilby R, Bisson PA, Coutant CC, Epifanio JM, Goodman D, et al. 2007. Research, monitoring, and evaluation of fish and wildlife restoration projects in the columbia river basin: Lessons learned and suggestions for large-scale monitoring programs. Fisheries, 32: 582–590.
Nelms SE, Coombes C, Foster LC, Galloway BJ, Lindeque PK, and Witt MJ. 2017. Marine anthropogenic litter on British beaches: A 10-year nationwide assessment using citizen science data. Science of the Total Environment, 579: 1399–1409.
Osborne JL, Loxdale HD, and Woiwod IP. 2002. Monitoring insect dispersal: methods and approaches. In Dispersal Ecology. Edited by JM Bullock, R Kenward, and R Hails. Cambridge University Press. pp. 24–49.
Pebesma E. 2018. Simple features for R: Standardized support for spatial vector data. R Journal, 10: 439–446.
Pocock MJO, Roy HE, August T, Kuria A, Barasa F, Bett J, et al. 2018. Developing the global potential of citizen science: Asessing opportunities that benefit people, society and the environment in East Africa. Journal of Applied Ecology, 56: 247–281.
R Core Team. 2016. R: A Language and Environment for Statistical Computing. Vienna, Austria. [online]: Available from R-project.org/.
Tobin PC, Zhang A, Onufrieva K, and Leonard DS. 2011. Field evaluation of effect of temperature on release of disparlure from a pheromone-baited trapping system used to monitor gypsy moth (Lepidoptera: Lymantriidae). Forest Entomology, 104: 1265–1271.
West S and Pateman R. 2016. Recruiting and retaining participants in citizen science: What can be learned from the volunteering literature? Citizen Science: Theory and Practice, 1(2): 15.
Witmer GW. 2005. Wildlife population monitoring: Some practical considerations. Wildlife Research, 32: 259–263.
Information & Authors
Information
Published In

FACETS
Volume 6 • Number 1 • January 2021
Pages: 2028 - 2041
Editor: Victoria Metcalf
History
Received: 12 February 2021
Accepted: 30 August 2021
Version of record online: 9 December 2021
Copyright
© 2021 Authors and Her Majesty the Queen in Right of Canada, as represented by the Minister of Natural Resources. This work is licensed under a Creative Commons Attribution 4.0 International License (CC BY 4.0), which permits unrestricted use, distribution, and reproduction in any medium, provided the original author(s) and source are credited.
Data Availability Statement
All relevant data are within the paper.
Key Words
Sections
Subjects
Authors
Author Contributions
All conceived and designed the study.
EO performed the experiments/collected the data.
All analyzed and interpreted the data.
All contributed resources.
All drafted or revised the manuscript.
Competing Interests
S. Heard is on the editorial board of FACETS.
Metrics & Citations
Metrics
Other Metrics
Citations
Cite As
Emily Owens, Stephen B. Heard, and Rob C. Johns. 2021. Having it all: hybridizing conventional and community science monitoring for enhanced data quality and cost savings. FACETS.
6(): 2028-2041. https://doi.org/10.1139/facets-2021-0013
Export Citations
If you have the appropriate software installed, you can download article citation data to the citation manager of your choice. Simply select your manager software from the list below and click Download.
Cited by
1. Citizen Science Helps Uncover the Secrets to a Bat-Friendly Swimming Pool in an Urban Environment