Open access

Freshwater fisheries monitoring in northern ecosystems using Indigenous ecological knowledge, genomics, and life history: Insights for community decision-making

Publication: FACETS
8 September 2022

Abstract

Natural resources in northern regions are often data-limited because they are difficult and expensive to access. Indigenous ecological knowledge (IEK) can provide information similar to, different from, or complementary to Western scientific data (WSD). We evaluated the general hypothesis that congruence in outcomes of IEK and WSD for population monitoring parameters is determined by temporal and spatial scale of the knowledge type. Parameters included population structure, degree of philopatry, morphological variation (and conservation status for one species), and genomics was a key Western scientific method. We evaluated this hypothesis in three subsistence and recreational fisheries (walleye, lake trout, and northern pike) in Mistassini Lake, Quebec, Canada. Concordance of outcomes was varied. IEK provided richer information on the biology, distribution, and morphological variation observable with the eyes. However, IEK cannot “see” into the genome, and WSD identified population structure and history more precisely than IEK. Both knowledge types could “see” change in populations, and the nature of what was seen both converged and was complementary. Determining when IEK and WSD are complementary or reach common conclusions may allow Indigenous communities to use both together, or one knowledge type over another when either is more desired, appropriate, or time- or cost-efficient to adopt.

Introduction

Indigenous knowledge (Box 1) is increasingly paired with Western science for biodiversity research, monitoring, and management (Alexander et al. 2019; Alexander et al. 2021; Henri et al. 2021). In addition, when resources for conservation are limited, methods for monitoring wild populations need to be efficient. Western scientific methods are effective for assessing metrics related to conservation, such as population structure and diversity, range use, and conservation status (Ferson and Burgman 2006), but they can also be expensive and time-consuming (Moller et al. 2004; Pulsifer et al. 2014). Further, Western scientific methods are commonly used for environmental conservation by colonial governments, academia, and industry because they are considered to be accurate and objective, and they are being employed increasingly in partnership with scientists by Indigenous governments for environmental monitoring and management (Housty et al. 2014; Okanagan Nation Alliance 2021; Lamb et al. 2022). However, many subjective decisions are made for scientific parameter estimates that are important for population management, including for species and population designation (Polfus et al. 2016) and appropriate baselines for conservation (Pauly 1995; Dayton et al. 1998; Huntington et al. 2004). A tremendous depth of knowledge about how to live in harmony with the land exits with the Indigenous Peoples of this land, since they have been doing so since time immemorial (Steeves 2021). Nevertheless, Indigenous communities and researchers alike are still asking how to bring Indigenous knowledge and Western science together (Buxton et al. 2021).
Multiple historic and contemporary models reflect how Indigenous knowledge and Western science can co-exist, including Etuaptmumk or Two-Eyed Seeing (Bartlett et al. 2012), plural co-existence (Muller 2012), and Braiding (Kimmerer 2013), among others (Levac et al. 2018; Reid et al. 2021). The details of these models differ, but what is critical to all is that each knowledge system is respected and remains distinct, while complementing the other when and if it is beneficial. One example that reflects these models is the Multiple Evidence Base approach; this approach requires engagement between researchers and Indigenous communities at each stage of the work, with five major stages of engagement (mobilize, translate, negotiate, synthesize, and apply) (Tengö et al. 2014; Tengö et al. 2017; Bongarts and IPBES 2019). Our study fits within these frameworks and steps, and we draw particular attention to the negotiate stage. This stage “means to interact among different knowledge systems to develop mutually respectful and useful representations of knowledge… It involves joint assessments of convergence, divergence and conflicts across knowledge contributions….” (Tengö et al. 2017, p. 20).
Complementary Indigenous ecological knowledge (IEK, Box 1) and Western scientific data (WSD, Box 1) are likely to expand our understanding and generate new hypotheses, while congruence in results between knowledge types (Box 1) may reinforce the strength of those findings (Gagnon and Berteaux 2009). Within the context of wild population monitoring guided by Indigenous Peoples and communities, in situations where knowledge types provide congruent information, perhaps one knowledge type could be used over others depending on which is more desired, practical, or economical to collect. When different knowledge types provide complementary information, one or both could be chosen depending on the information needed. Importantly, discussion of comparing and contrasting IEK and WSD for management decisions herein is intended to help provide Indigenous communities with the tools and information that can best benefit them, not for an outside agency to decide, for example, that IEK is unimportant for decision-making, or that WSD should be more heavily weighted in an assessment.
Box 1: Terminology
Complementary(arity): refers to when information gleaned from IEK or WSD provides more or different results than the other (e.g., a greater range of sizes of a fish, or a greater number of breeding sites).
Congruent(ce): refers to when information gleaned from IEK and WSD reflect the same story (e.g., fish size is declining, or there are 6 different morphotypes evident).
Disagree(ment): refers to when results from IEK and WSD are opposing (e.g., one knowledge type identified consistent locations, while the other did not identify sites that were consistently used for breeding).
Indigenous knowledge: refers to “a cumulative body of knowledge, practice and belief, evolving by adaptive processes and handed down through generations by cultural transmission, about the relationship of living beings (including humans) with one another and with their environment” (Berkes, 2012 p.8). Indigenous knowledge is the living of the knowledge (McGregor, 2006), and in the context of this work we are working with the ecological component of Indigenous knowledge. Thus, we used Indigenous ecological knowledge (IEK) throughout.
Western scientific data (WSD): refers to the data obtained from Western scientific tools, such as calipers and scales for measuring fish, SI units, genetics and genomics, and statistical tools. We apply the term Western sciences, as it is described by Aikenhead and Ogawa (Aikenhead and Ogawa, 2007):”…a powerful way of knowing about nature, and this includes knowledge appropriated over the ages from many other cultures (e.g., Islam, India, and China). Such knowledge was modified sufficiently to fit Eurocentric worldviews, metaphysics, epistemologies, and value systems.”
The congruence or complementarity of results for IEK and WSD often depends on their temporal or spatial scale (Gagnon and Berteaux 2009). It has been predicted (Johnson 1992; Riedlinger and Berkes 2001) and observed (Aswani and Hamilton 2004; Moller et al. 2004; Fraser et al. 2006; Gagnon and Berteaux 2009; Marin et al. 2017) that, in general, IEK covers long time scales but small or specific geographic areas, whereas WSD estimates parameters over shorter time periods but wider geographic areas. However, the scales of each knowledge type are often defined by the specific questions and methods being used, rather than reflecting inherent differences in each knowledge type (Johnson 1992), and IEK can capture greater geographic scales (Ferguson et al. 1998; Gagnon and Berteaux 2009).
Results obtained using both knowledge types can also be congruent or complementary due to limited taxonomic assessment, animal behaviour specific to a given location (Doswald et al. 2007), human disturbance (Polfus et al. 2014), or data availability. Indeed, most studies using IEK and WSD together address only a single species in a given environment (Alexander et al. 2019), making it difficult to assess how the biology of each species might influence results. Evaluating results from IEK and WSD for common parameters on multiple species in a single ecosystem would mitigate the effects of many variables that otherwise could confound results. It may also help develop a more broadly generalizable framework for management using each knowledge type.

Past research

Studies combining IEK and WSD (life history, morphology, and population genetics) have been conducted on some of the single species fisheries in Mistassini Lake, the largest natural lake in Quebec, Canada (Fraser et al. 2006; Marin et al. 2017; Bowles et al. 2020; Bowles et al. 2021). While these works have informed local management for specific species, an assessment of congruency and complementarity in IEK and WSD across species has not been undertaken, nor what biological or abiotic factors might govern discrepancies in congruency/complementarity of WSD and IEK for a given parameter between species. Before such a multi-species assessment could be conducted, new or refined data were required for less-studied species (lake trout) or unstudied species (northern pike) to facilitate comparative assessments of IEK, population genomic structure (Sunde et al. 2020), and life history composition across species.

Hypothesis

Drawing from Gagnon and Berteaux’s (2009) findings, we researched three different fish species to evaluate the general hypothesis that the congruence of results obtained by IEK and WSD for population monitoring parameters is determined by the temporal and spatial scale of the knowledge type. Where the spatial and (or) temporal scales were the same, the hypothesis predicted that results would converge; conversely, when scales were different, the hypothesis predicted results would be complementary (i.e., reveal more or different information). To test our general hypothesis, a combination of previously and newly collected IEK surveys, tissue samples, and life-history data were used. Parameters included population structure, degree of philopatry, morphological variation, and conservation status, and fish species were walleye (Sander vitreus), lake trout (Salvelinus namaycush), and northern pike (Esox lucius). See Supplementary Material for the rationale behind each parameter choice. The intent of this study was not only to test scenarios where spatial and temporal scales of information across knowledge systems matched, but also where they differed, allowing us to uncover the relationships between the strength of consensus on population monitoring parameters. Having multiple species in a single lake ecosystem allowed us to compare and contrast whether conclusions reached for one species were consistent across species, to enable inferences on when each IEK and WSD could be used for monitoring in concert or independently in other systems.

Methods

This study builds on a long-term collaboration spanning twenty years (2000–2020) between the senior author’s research lab and the Cree Nation of Mistissini. DF, KM, and EB all spent an average of multiple weeks to two months a year in the community and on the land as studies were being completed collaboratively, while also attending various ceremonies, feasts, traditional gatherings, and returning to the community to discuss study outcomes. For examples, see duration of sampling in each previous study (Bowles et al. 2020; Fraser et al. 2013; Fraser et al. 2006; Marin et al. 2017). A research partnership based on mutual respect and trust has been established over these years. In addition, while this study was initiated by the senior author’s lab, the community of Mistissini welcomed the study, especially the combination of IEK and genomics (WSD) together. Study design and methods were discussed with the community, and they provided feedback at each stage of the work.

Study area

Much of northern Canada is difficult and expensive to access; however, Indigenous Peoples have lived in and been stewards of the north since time immemorial and as such have very detailed knowledge of the local flora, fauna, and environment (Berkes 2012; McGregor 2004). The Cree of Eeyou Istchee (∼20 000 people) live in 11 communities and surrounding traplines spanning 450 000 km2 of northern Quebec (GCC 2011, 2019). The Cree have long depended on harvesting fish for subsistence and well-being, and hunting and fishing remains a major focus of their lifestyle (Berkes 2018). Mistassini Lake, in the southern part of the territory, is Quebec’s largest lake (161 km long, 2335 km2, 183 m maximum deep) (Fig. 1), and is largely pristine (Fraser et al. 2006; Marin et al. 2017). Major recreational and subsistence fisheries in the lake include walleye, lake trout, northern pike, and brook trout (Salvelinus fontinalis). Non-Indigenous fishers are only permitted to fish below the 51st parallel (Fig. 1), unless accompanied by an Indigenous guide. Non-Indigenous sportfishing catch data below the 51st parallel is documented by the Nibiischii Corporation through the Baie Penicouane access point. The community of Mistissini (Cree for “Big Rock”) is on the southeastern tip of the lake. All four species are harvested for subsistence, with substantial walleye harvest every year and less reliance on pike, simply by preference. Subsistence harvest data is not formally recorded, but the relative amount of catch per species that we describe here has been shared by many community members. Concerns over walleye populations close to the community were raised by community members in 2013 (Bowles et al. 2021; Bowles et al. 2020).
Fig. 1.
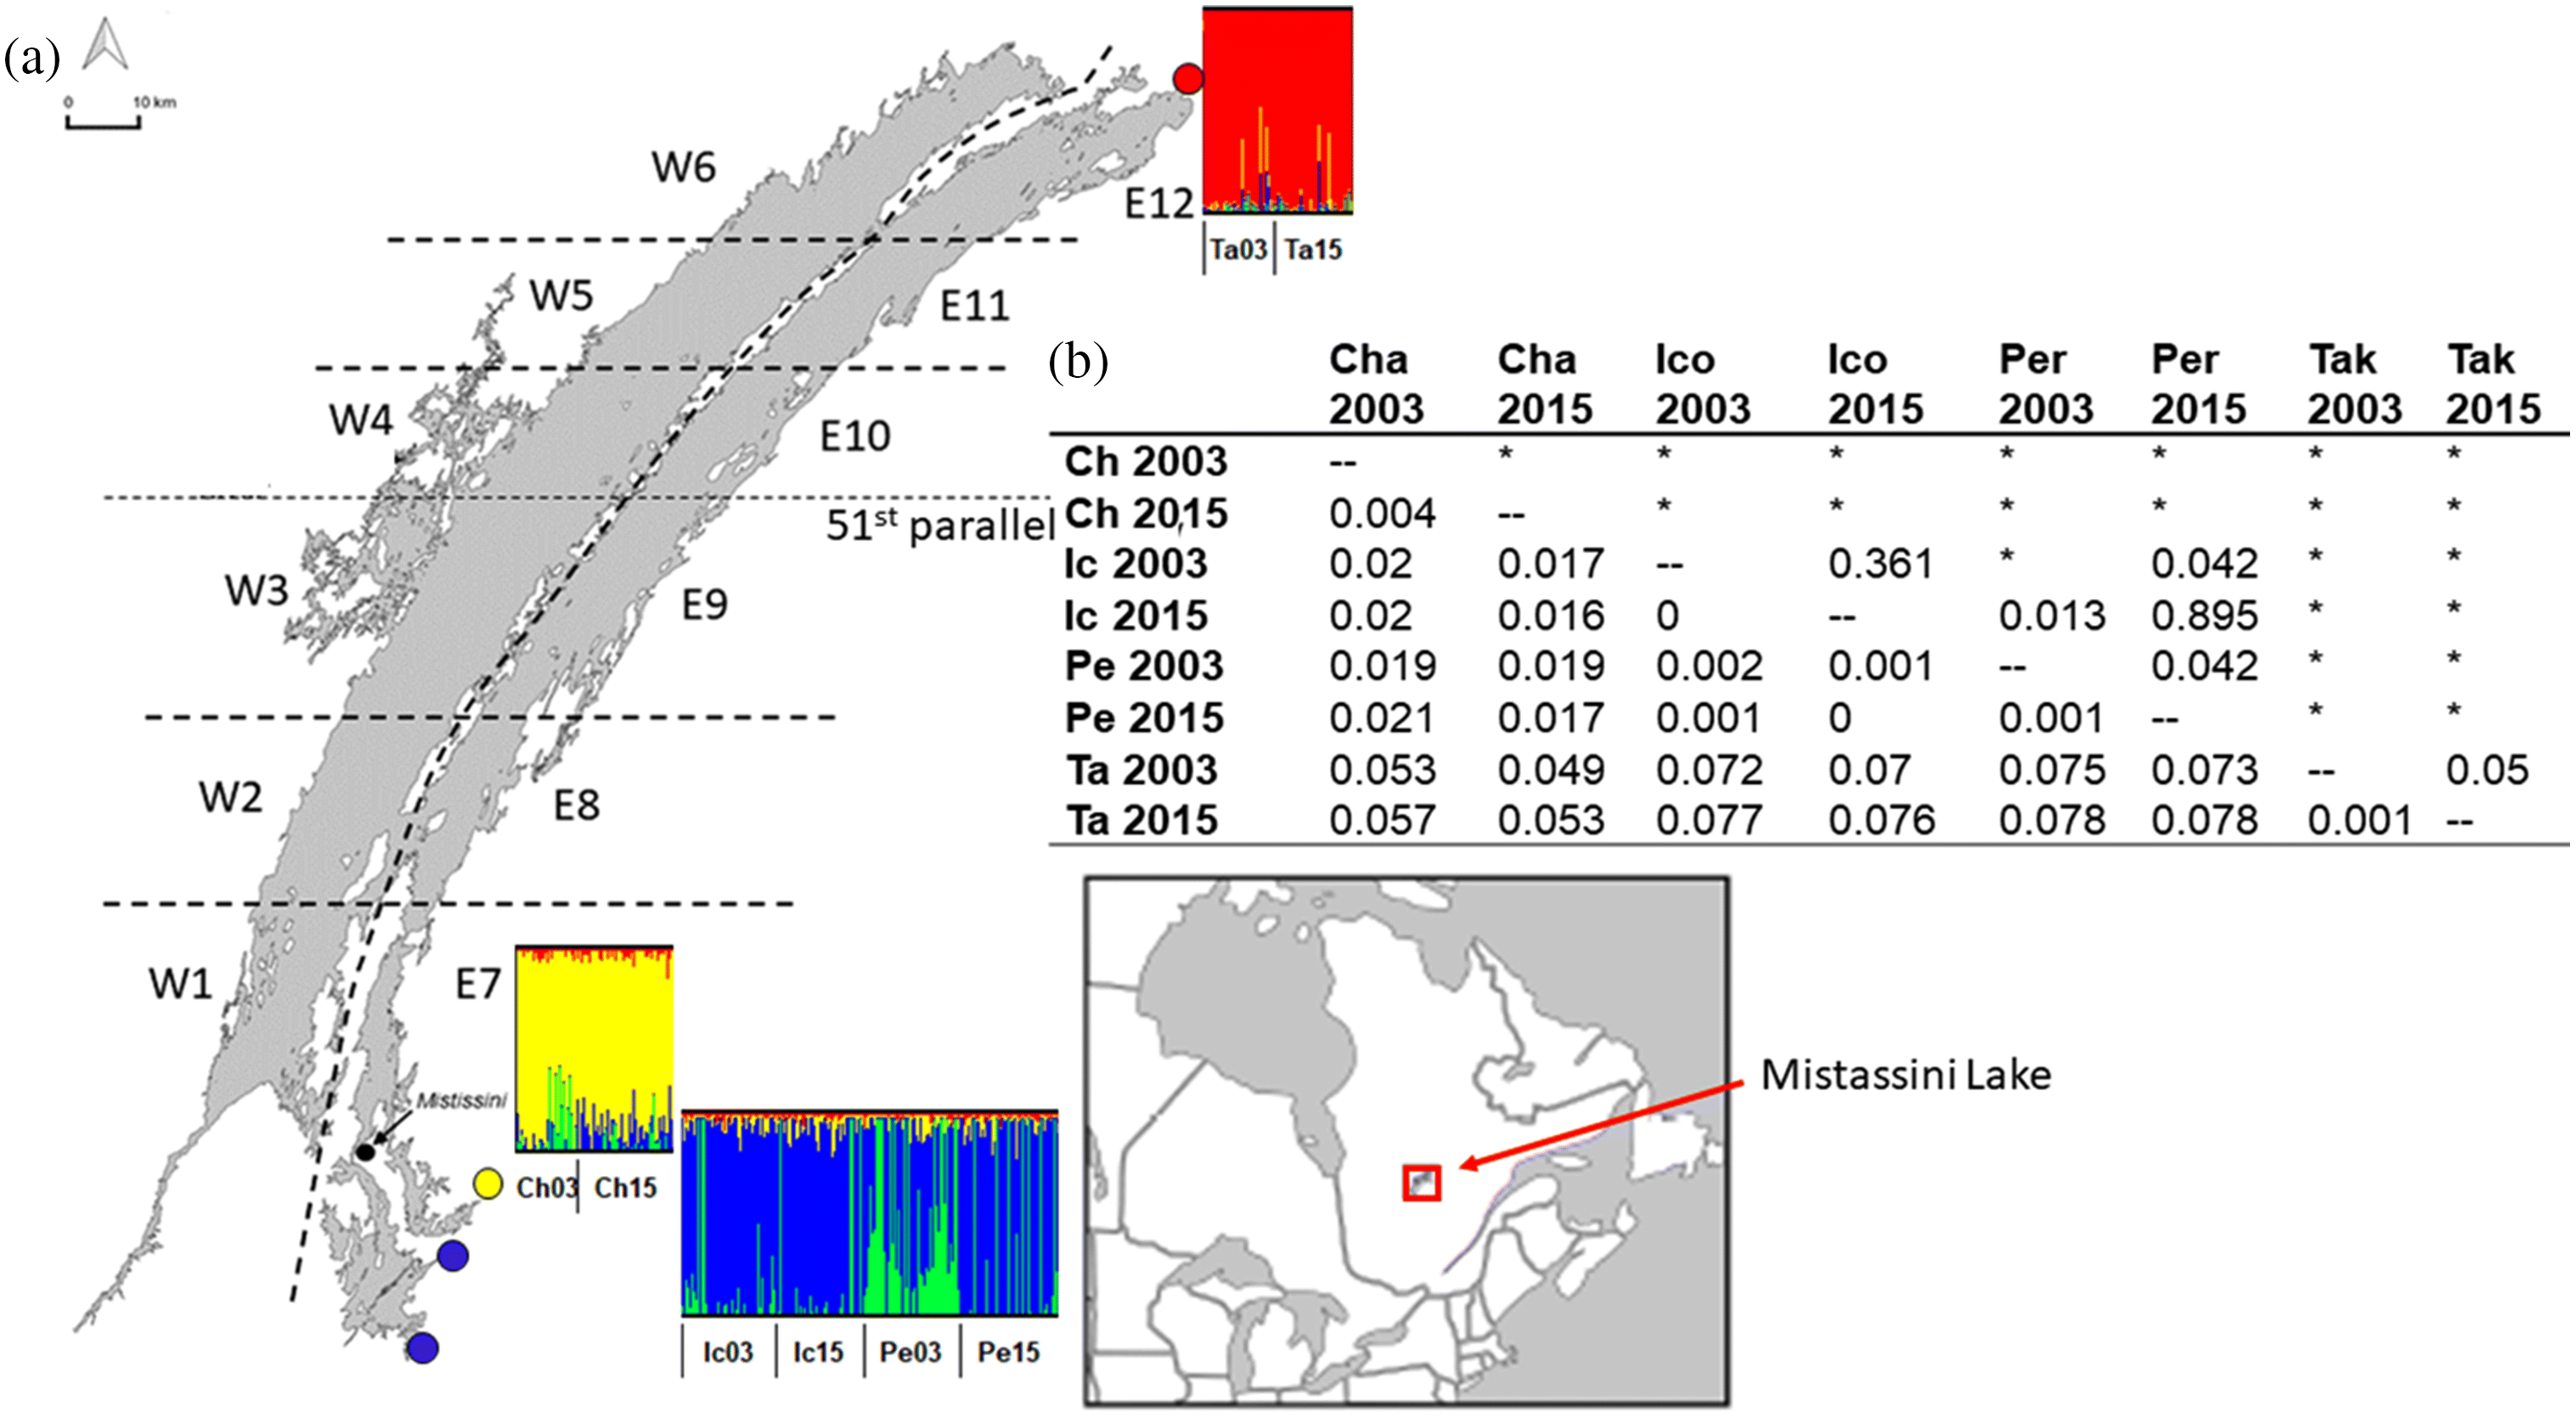
Fig. 1. (a) Indigenous knowledge of spawning rivers and genomic population structure of walleye at all four sampled rivers for 2003 (03) and 2015 (15). Ch = Chalifour River, Ic = Icon River, Pe = Perch River, Ta = Takwa River. Coloured circles on the map (yellow, blue, and red) indicate some of the walleye populations relayed by all knowledge holders, but see Results section for details. (b) FST differentiation within and between rivers for each year sampled. FST estimates are below the diagonal, and p values are above the diagonal, with * indicating p ≤ 0.001. The community of Mistissini is shown on the southeastern tip of the lake, and the inset map shows the relative location of Mistassini Lake within Canada. Data and the base map image presented here are from Bowles et al. (2020) and Marin et al. (2016), respectively.

IEK and WSD complementarity

In Table 1, temporal and spatial scales have been identified for each IEK and WSD method. For example, the temporal scale of responses to IEK questions that address population structure for walleye is “single snapshot, contemporary perspective”, because we were not asking knowledge holders to report on this parameter over a long period of time, while the spatial scale for these responses was lake-wide because the knowledge holders were reporting on their knowledge of the whole lake. For WSD for population structure, the temporal scale was “single snapshot, cumulative since colonization”, because genomics, the tool used for population structure, “sees” evolutionary time in the DNA sequence, while the spatial scale was “four key spawning rivers” because fish were sampled at only those spawning rivers. For population structure in walleye then, because the scales did not match exactly, the hypothesis predicted IEK and WSD to reflect complementary information (i.e., one knowledge system would provide more or different information). If both temporal and spatial scale were the same for IEK and WSD for a given parameter (e.g., population structure), the hypothesis predicted that the result would be congruent (e.g., identification of the same regions of the lake for spawning, or a lack of site fidelity).
Table 1.
Table 1. Population monitoring parameters assessed using Indigenous ecological knowledge (IEK) and Western scientific data (WSD).
 Method to address the parameter and temporal and spatial scale for that parameter  
FishIEK questionSpatial scaleTemporal scaleStudyWSDDatasetSpatial scaleTemporal scaleaStudyInitial prediction
Parameter—Population structure/ degree of philopatry/gene flow      
WDo walleye look the same throughout the lake? Where do walleye spawn? When do walleye spawn?Lake-wideSingle snapshot, contemporary perspective (2018)1ADMIXTURE, global ancestry, at spawningb


Pairwise FST, gene flow between populations, (Genodive)
GBS, 8457 SNPs


GBS, 8658 SNPs
Four key spawning rivers


Four key spawning rivers
Single snapshot, cumulative since colonization (2003, 2015)

Single snapshot, cumulative since colonization (2003, 2015)
2


2
COM
LTMorphology—variety of morphs described Do you know where and when lake trout spawn? If yes, can you describe/show their location? If yes, do all lake trout that you described earlier spawn in the same location?Lake-wideSingle snapshot, contemporary perspective (2013)3ADMIXTURE, global ancestry, feeding seasonb


Pairwise FST, gene flow between populations, (Genodive)
GBS, 5830 SNPs


GBS, 5830 SNPs
Lake-wide, feeding habitat


Lake-wide, feeding habitat
Single snapshot, cumulative since colonization (2013)


Single snapshot, cumulative since colonization (2013)
1


1
COM
NPDo pike look the same throughout the lake? Where do pike spawn? When do pike spawn?Lake-wideSingle snapshot, contemporary perspective (2018)1ADMIXTURE, global ancestry, outside of spawning periodb


Gene flow between genetic clusters, pairwise FST (Genodive)
GBS, 245 SNPs


GBS, 245 SNPs
Lake-wide, feeding habitat


Lake-wide, feeding habitat
Single snapshot, represents cumulative since colonization (2018)

Single snapshot, represents cumulative since colonization (2018)
1


1
COM
Parameter—Body size or morphotypes
WDo walleye look the same throughout the lake? How big, on average, are the walleye that you capture now?Lake-wide, some specific regions givenSingle snapshot, contemporary perspective (2018)1Lsmeans of total length for each population (lsmeans, R)Total length (± 1 mm), and mass (± 50 g)Four key spawning riversSingle snapshot (2002/2003, 2015)2COM
LTMorphology—variety of morphs discussed for population structureLake-wideSingle snapshot, contemporary perspective (2013)3MorphologyRelative warp scores for head and body shapeLake-wide, feeding habitatSingle snapshot (2013)4CON
NPDo pike look the same throughout the lake? How big, on average, are the pike that you capture now?Lake-wideSingle snapshot, contemporary perspective (2018)1Total length and mass for each populationTotal length ± 1 mmLake-wide, feeding habitatSingle snapshot (2018)1CON
Parameter—Conservation status
WHas the number of fish changed? Has the size of the fish changed? Do you have any concerns about the overall health of the fish throughout the lake? Factors that could contribute to change?Lake-wide5–25 years (2018)c2Change in total length, mass, length at age over time, Ne, (LDNe); Ho (stacks)Total length (± 1 mm), mass (± 50g); GBS, 8658 SNPsFour key spawning riversFor length/mass, time-series; size-at age, single time-span, 2002–2017; for Ne, single snapshot over 1–2.5 generations (2003–2015)2COM
LTHave the number of lake trout decreased, increased, or remained the same over the years you have been fishing? Have you noticed any changes to lake trout on the lake since you’ve been fishing? If yes, do you know what might be causing these changes? Do you have any overall concerns about the health of lake trout in Mistassini Lake? What factors might contribute to short-term changes to the number of lake trout there are?Lake-wide20–40 years (2013)c1, 3Ne (LDNe)GBS, 5830 SNPsLake-wide, feeding habitatSingle snapshot over one generation (2013)1NAd
NPHas the number of fish changed? Has the size of the fish changed? Do you have any concerns about the overall health of the fish throughout the lake? Factors that could contribute to change?Lake-wide5–25 years (2018)c1Ne (LDNe)GBS, 245 SNPsLake-wideSingle snapshot over one generation (2018)1NAd

Note: Source studies: 1. This study. 2. Bowles et al. (2020). 3. Marin et al. (2017). 4. Marin et al. (2016). LT, lake trout; GBS, genotyping-by-sequencing; SNP, single nucleotide polymorphism; COM, complementarity of results between IEK and WSD; W, walleye; NP, northern pike; CON, congruence of results between IEK and WSD; Ne, effective population size; LDNe, software used; Ho, observed heterozygosity.

a
Year(s) given in brackets for temporal scale are when the samples were collected.
b
ADMIXTURE (global ancestry) assesses the proportion of an individuals’ genome that comes from one population.
c
Temporal scale here refers to the timeline of the observation. the year the questions were asked or the WSD were taken is in brackets.
d
Because single snapshot genomics provide only a single point estimate and therefore cannot be used to assess trends in population conservation status (i.e., trends in abundance and population size over time) in the same way as knowledge holders with 20+ years of fishing experience and generations of knowledge, we are reporting conservation for these species as complementary pieces of information and have not tried to assess congruence or complementarity.
To assess whether the predictions for congruence or complementarity were met, for each species we compared the IEK information reported by most knowledge holders for that parameter and our WSD result. If the majority view of knowledge holders was the same outcome as the WSD result (e.g., same population structure identified), we scored the outcomes as congruent.
We note that most knowledge holders had far more than 20 years of fishing experience. Variation in the number of years of experience that knowledge holders had could influence their responses; while differences in experience cannot be controlled for, it is in part because of the variation that we relied on consensus view from many knowledge holders. We also retain and discuss nuance in IEK reports, as this may be important. Note also that we do not make the comparison for conservation status for lake trout and northern pike, but simply report these as complementary information. See Table 1 footnotes for details.

Indigenous ecological knowledge

We collated IEK during semi-directed interviews and conversations during collaborative fieldwork on Mistassini Lake and surrounding tributaries. The conversations took place over prolonged periods of time (weeks to months) for each walleye (17 knowledge holders in February and July of 2018), lake trout (15 knowledge holders in June–July 2013), and northern pike (17 knowledge holders in February and July 2018). The community selected knowledge holders (interviewees), including suggestions by the Band Council, interpreters, and other participants, as well as the Hunters and Trappers Association for lake trout (also known as peer referencing and snowball sampling (Biernacki and Waldorf 1981; Davis and Wagner 2003)). Participants were selected based on being land users, their level of experience, field of work they were in, and that they were recognized as key knowledge holders. Within this approach, the community either suggested or approved knowledge holders. Author EB conducted walleye and northern pike interviews, and KM conducted lake trout interviews (Marin et al. 2017). Expert knowledge holders within the community were identified for interviews, but two additional people had been identified for 2018 interviews and one for 2013 who they were not interviewed due to personal or community circumstances. All knowledge holders we interviewed were men, as men have been primarily responsible for fishing, and had >20 years experience fishing. Some participants were Elders, but we did not ask the community to identify all Elders, nor did we ask permission of the Elders to identify them as such, so we have not provided numbers or specific reference to information from Elders throughout the manuscript. We held all interviews in the community of Mistissini at the Band Council building, the Cree Trappers Association office, in the family center, in individuals’ private homes, or during collaborative fieldwork on Mistassini Lake. We obtained oral informed consent prior to every interview, and human ethics approvals from Concordia University Office of Research–Research Ethics and Compliance Unit (Ethics certificate number 30008247 for walleye and northern pike, and 30003281 for lake trout). Local approval for all studies was granted through an internal process with the Cree Nation of Mistissini.
We validated IEK informally via multiple interactions with the same local knowledge holders as had been interviewed during collaborative fieldwork and post-study presentations. Within the context of this study, “validation” means that we discussed or presented the information that we recorded to check accuracy, including with follow-up questions/clarifications or visualizations. We did so as needed. In addition, we note that it would not have been possible for the authors and knowledge holders to have different ideas about which fish species was which, as the species within the lake are clearly distinguishable, and through years of fieldwork and peer-referencing for interviews there could be no mistake; additionally, photographs were used as reference for lake trout interviews.
Because some of the respondents asked that they not be recorded, interviewers took field notes to document responses. Notes were then entered into Microsoft Word or Excel for long-term storage and management. We coded information by iteratively reviewing the interviews and identifying themes; because the questions were straightforward and generally fact-based, outcomes were clear and could be grouped accordingly. In many instances, the answers were quantitative in nature (e.g., relative sizes, number of years for a trend). We wrote down all responses, including where there was disagreement amongst knowledge holders, and we present these findings in this work (see Results) and during presentations to the community. Uncovering the relationship between the strength of consensus on population monitoring parameters and the outcome of the Western scientific work was a central objective of this work; within this context, discrepancies in perspectives of knowledge holders was expected and was part of the narrative in this work.
For IEK shared in 2018, methods were as follows. Semi-directed interviews included a series of general questions to which respondents could respond freely, with follow-up questions on responses given (Supplementary Material). Study co-authors reviewed and revised questions. This same general approach was taken for interviews conducted in 2013, though with a different community co-author. Interviews lasted between 30 and 60 min and were conducted with a local Cree interpreter (a community member and not a trained professional). However, prior to the interviews, we reviewed the questionnaire with the interpreter to ensure that they understood the questions. We asked questions in English, and they were translated directly into Cree for the knowledge holders if needed/wanted. Knowledge holders were free to answer in Cree or English, and the response was translated directly back to English. Note that the research questions were not back-translated directly to English, which may mean that there was some variation in how questions were asked that we were not aware of. We expect that this was not an issue for this work because the questions were largely fact based. Roughly 75% of the responses were completely in Cree, and in all but two interviews there were aspects of questions that required clarification in Cree. If knowledge holders gave answers to a given question that were more pertinent as answers to different questions, we applied their answers to the question that they best fit. As per Gagnon and Berteaux (2009), we discarded responses if a respondent explicitly stated a lack of knowledge on a subject to ensure accuracy of this information (Huntington 2011) (though we retained this information in the Supplementary Tables and note that this was uncommon). A community member affiliated with the project was also present for 2013 interviews to translate information as needed. We provided modest compensation to interviewees for their time in 2018, but not in 2013.

Western scientific data

Fish sampling and sample selection

In all cases, fish were caught by a combination of the authors on this manuscript (EB, KM, DJF), local Cree fishing guides, field assistants, and sport fishers. Fish were captured either using a combination of boat and shore (walleye and lake trout) or only boat (northern pike), via angling (with artificial lures and live bait) and via gillnetting (lake trout only). After capture, fish were immediately placed in freshwater baths with aerators. From each fish, total length (± 1mm), wet mass (± 50g), and a fin clip tissue sample for genetics were collected. Otoliths and opercula were also collected for some walleye (Bowles et al. 2020; Dupont et al. 2007) and lake trout (Marin et al. 2016), and cleithrum samples for northern pike (this study). Pictures were taken of a subset of lake trout for morphometrics analysis and a visual assessment of colour variation (Marin et al. 2016). Fish were then immediately returned to the water near the location of capture unless they had died in gillnets (lake trout) or were euthanized and harvested for otoliths and (or) cleithrum samples. All dead fish were given to the community for subsistence. Walleye were sampled within spawning rivers in May to early June in 2002, 2003, and 2015–2017. Lake trout were sampled throughout the lake in June and July of 2013. See Bowles et al. (2020) and Dupont et al. (2007) for the total number of walleye sampled at each location and used for each body size and genomic analysis, and Marin et al. (2016) for details of lake trout sampling. For genomic analyses, we selected a random subset of lake trout samples (n = 219) from the original sample collections in 2013 that represented both the spatial distribution (e.g., depth and spatial position) and the diversity of morphological forms. A total of 241 northern pike tissue samples and 216 body size estimates were collected after spawning was complete, in early July 2018, with samples distributed roughly equally throughout the entire lake. We then chose 216 samples that represented an equal distribution of samples from each region of the lake to sequence. Lake sectors where each species was sampled are shown in their respective population genetic figures (1, 4, and 7); however, exact sampling locations are not shown because this information is sensitive and protected. Sampling effort and expertise were relatively consistent across species, but cannot be precisely quantified, as this is a synthesis of past and new work. Fish sampling protocols were all approved by Concordia University Office of Research – Research Ethics and Compliance Unit and the Ministère des Forêts, de la Faune et des Parcs (MFFP) through their scientific research permit processes for each individual study (walleye 215 2015 MFFP SEG # 2015-05-07-116-10-G-P; walleye 2016 2016-03-18-104-10-S-P, 30004756, and 30001328; walleye and pike 2017 and 2018 2017-05-02-107-10-SP and 30008151; and lake trout 2013-04-03-10-S-P and 30003281).

Sequencing, bioinformatics and statistics

Details of genotyping-by-sequencing (GBS) and bioinformatics analyses for walleye can be found in Bowles et al. (2020); DNA extractions and GBS for 219 unique samples plus negative and positive controls for each lake trout and northern pike were conducted as in Bowles et al. (2020). The number of raw reads, coverage, and SNPs at each stage of bioinformatic filtering can be found in the Supplementary Materials for lake trout and northern pike.
Raw fastq to SNP processing for lake trout and northern pike were conducted using cutadapt (Martin 2011), and Stacks v2d and e, respectively (Catchen et al. 2013), using the reference-aligned option and BWA for alignment (Li 2013). Guidelines for processing followed Rochette and Catchen (2017). Default parameters were used for alignment. As per Rochette and Catchen (2017), sequencing coverage was evaluated at each stage. Please see Supplementary Materials for details of the raw data to single nucleotide polymorphism (SNP) processing and the process of population assignment using ADMIXTURE with cross validation (CV) (Alexander et al. 2009) and Adegenet with k-means (Jombart 2008). Genetic distance (or the amount of gene flow, FST) and effective population size (the number of individuals in an idealized population that would have the same amount of genetic drift as the observed population, a measure related to the number of individuals in a population, Ne) for lake trout and northern pike were estimated using the same methods as in Bowles et al. (2020). Associations between genetic cluster and morph in lake trout, as well as the redundancy analysis (RDA), were conducted following Marin et al. (2016).

Results

Walleye

Population structure contrast

Overall, IEK and WSD were both congruent and complementary regarding population structure for walleye, with WSD providing finer resolution at the genetic scale (Table 2).
Table 2.
Table 2. Summary of the predictions and results for each population monitoring parameter and species assessed using Indigenous ecological knowledge and Western scientific methods.
ParameterSpeciesInitial predictionResult
Population structure/degree of philopatry/gene flowwalleyeComplementaryCongruent and complementary
 Lake troutComplementaryComplementary
 PikeComplementaryDisagree
Body size or morphologyWalleyeComplementaryCongruent and complementary
 Lake troutCongruentCongruent and complementary
 PikeCongruentCongruent and complementary
ConservationWalleyeComplementaryCongruent for size, disagree for number of fish
 Lake troutPresented as complementary information
 PikePresented as complementary information
Population structure IEK
Clear and consistently defined spawning regions and timing were revealed, as well as distinct morphotypes, between three regions of the lake (south, north, and Rupert River, Fig. 1), although not at the per-river scale (Table S1.1). Seven of 12 knowledge holders who had lake-wide knowledge of walleye reported lighter coloured fish in the south and brighter/gold/blue fish in the north and Rupert River. One of 12 knowledge holders reported these same differences in colour but was unsure where the morphs were located geographically. Three other knowledge holders reported that walleye were the same throughout the lake. While there were slight variations in the numbers of rivers known as spawning grounds, all but two knowledge holders identified the major rivers, i.e., Chalifour, Icon, Perch, Takwa, Wabissinane, and the Rupert (we did not evaluate the Wabissinane or the Rupert with WSD, but we report this here for completeness). Two respondents simply reported “in rivers”. Spawning time was also universally understood as springtime after ice-off, which was around mid-May in the south and early June in the north.
Population structure WSD
Three populations were supported by k-means (Bayesian Information Criterion using Adegenet) and CV (using Admixture), structured geographically by river (Icon and Perch Rivers grouped as one river, with Chalifour and Takwa Rivers grouping independently, and 2003 and 2015 samples grouped together per river) (Fig. 1a). However, results were very similar between three and four populations, and FST results supported the four-population scenario (Fig. 1b). In the four-population scheme, Perch 2003 was grouped as a separate population from the 2015 group, thus indicating divergence between 2003 and 2015 within this one river. As the three-populations scheme was supported by two of three tests and FST was low between Icon and Perch in 2003, Icon and Perch River samples were grouped together for each 2003 and 2015 for all subsequent genomic analyses so that years could be compared. FST revealed high to moderate gene flow between populations, with the least gene flow from north to south. While it has been shown that a small number of individuals move between spawning grounds, these results, together with assignment tests completed by Dupont et al. (2007), demonstrate that natal philopatry is strong amongst the three genetic populations (Chalifour, Icon–Perch, and Takwa Rivers).

Morphology contrast and IEK outcomes

Spatial, lake-wide body sizes reported by IEK were 300–740 mm, a wider range than WSD. We did not specify for knowledge holders to provide sizes by weight, and thus did not obtain many weight estimates by IEK.
Morphology WSD
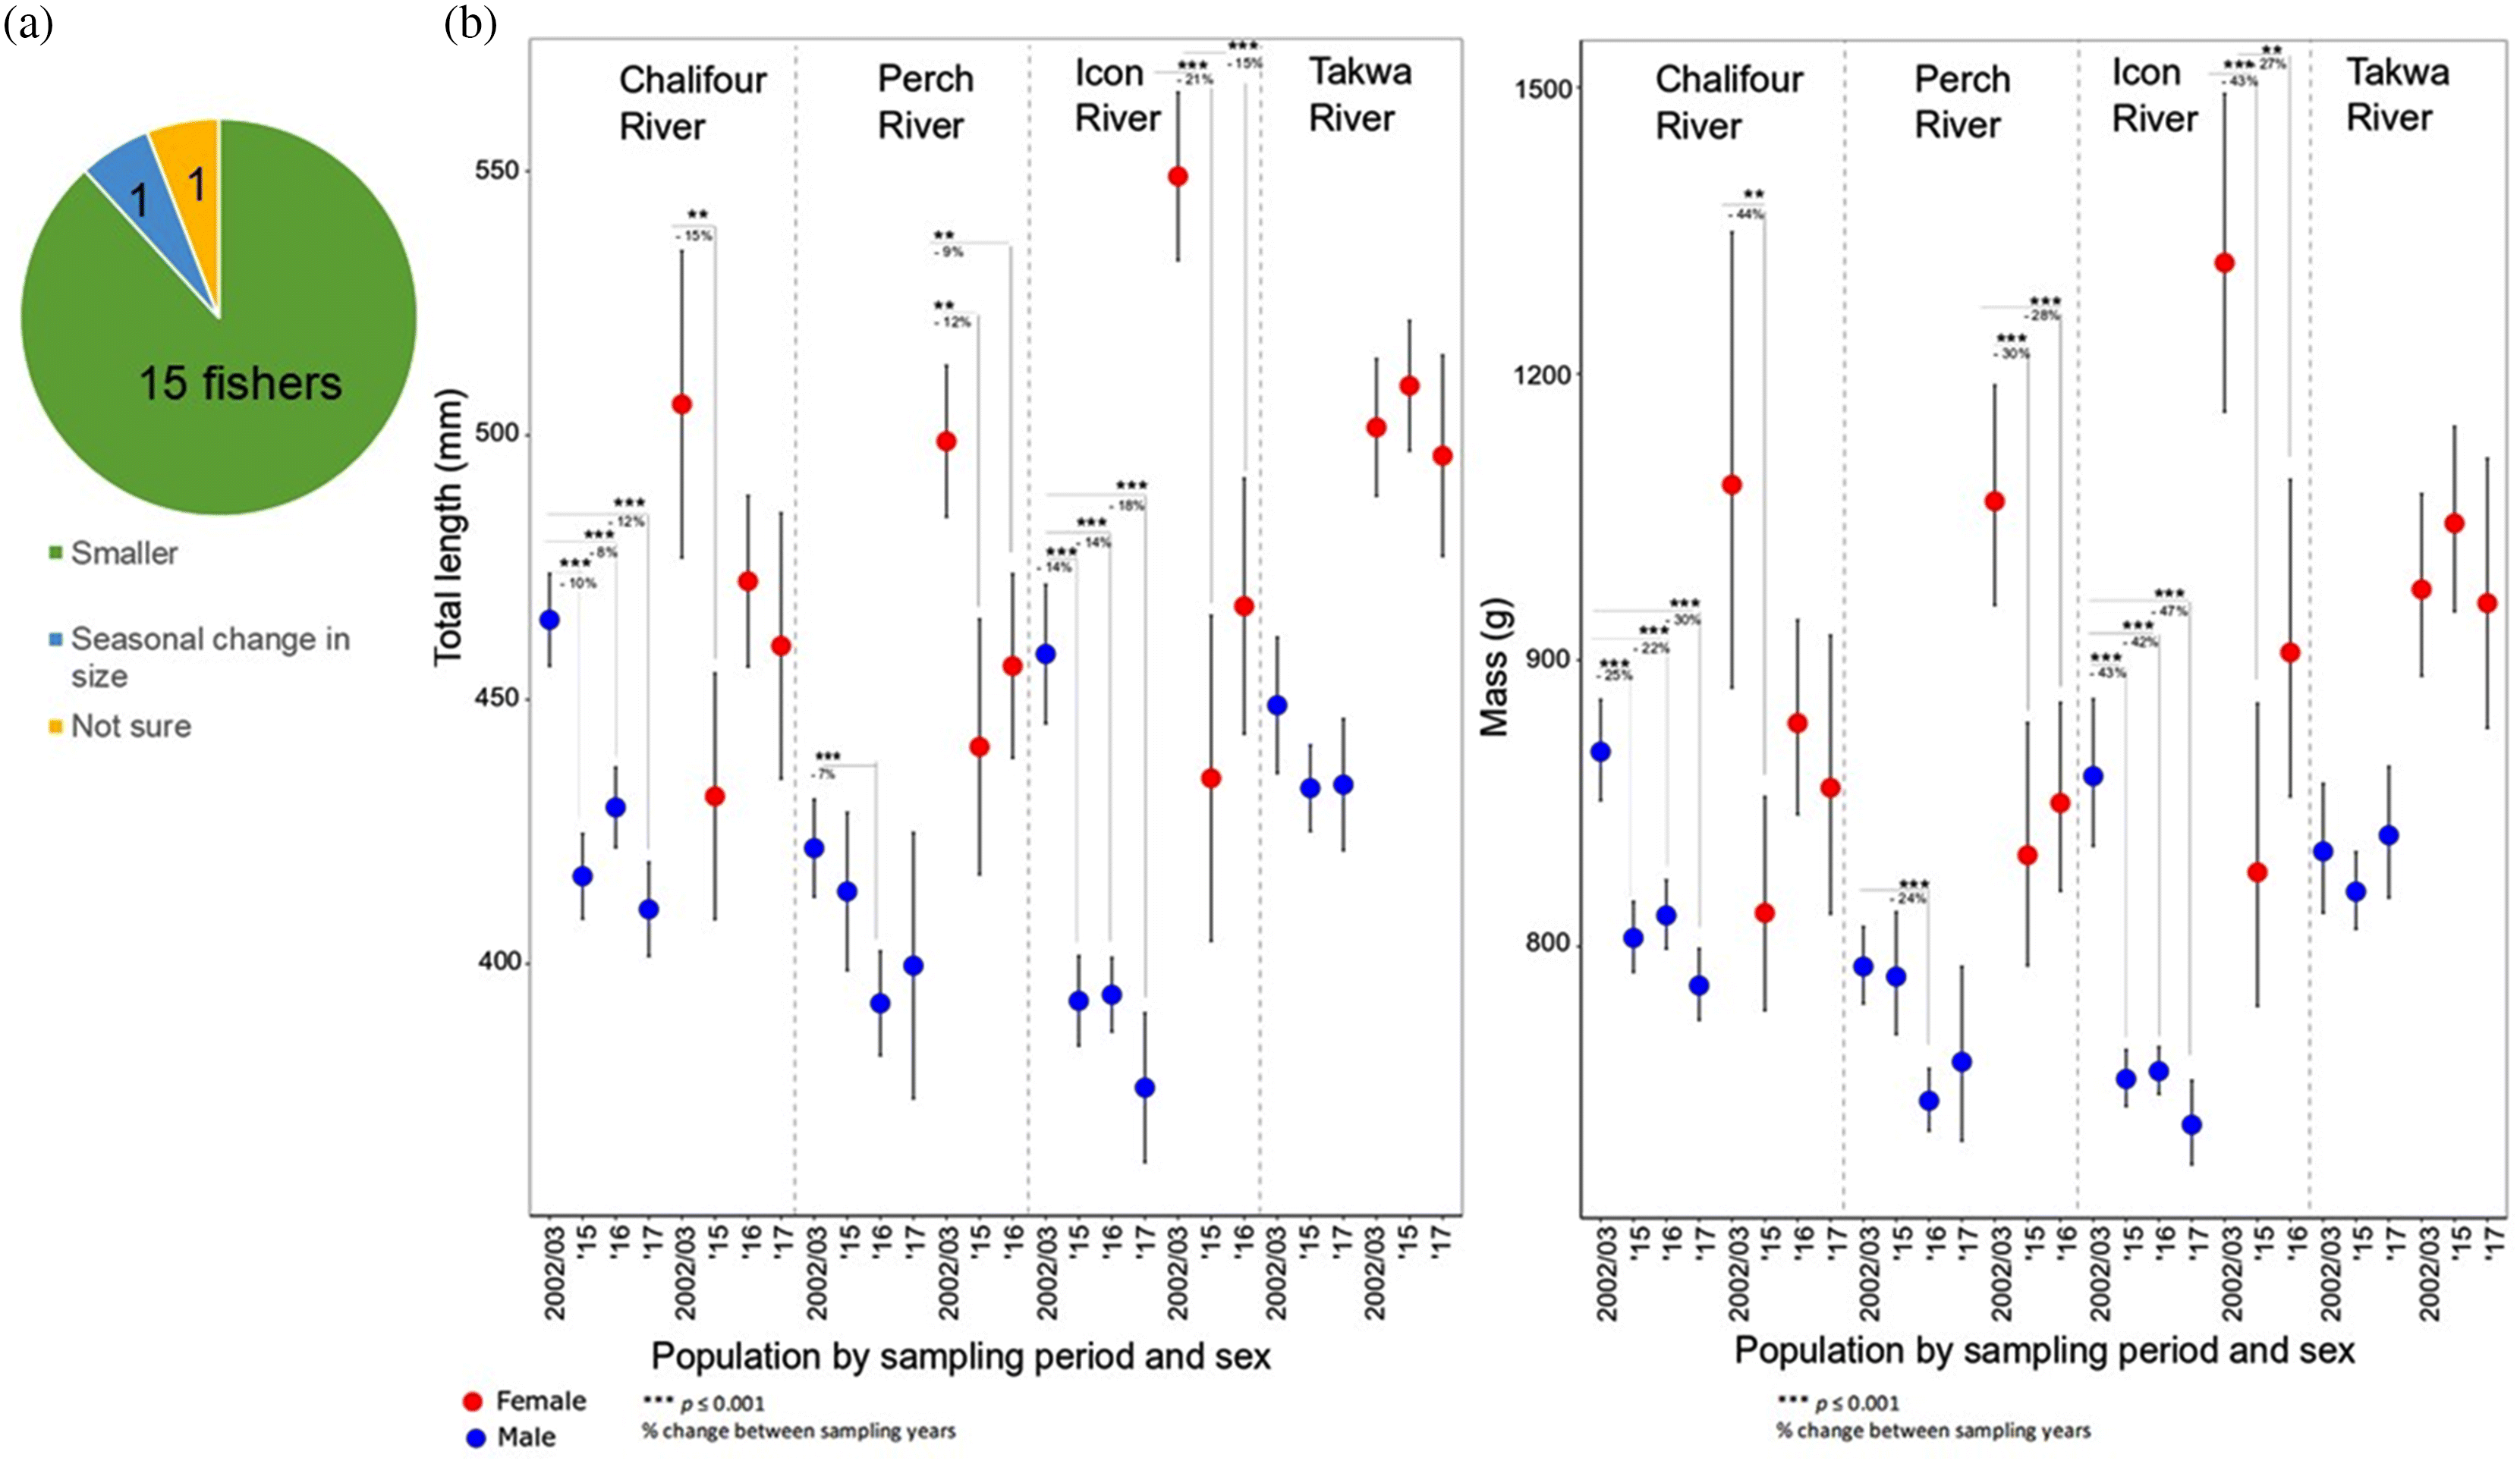
Temporally, current (2015, 2016, and 2017) lsmeans of walleye body sizes from sampled rivers varied between 431.7 mm and 509.4 mm for females and 376.6 and 433.9 mm for males. However, body size differed between rivers (Fig. 2). Lsmeans of walleye mass varied between 635.2 and 1043.4 g for females and 413.4 and 716.6 g for males in 2015, 2016, and 2017 (Fig. 2).
Fig. 2.
Fig. 2. (a) Indigenous knowledge shared regarding the reduction in size of fish in the lake (but see Results section and Supplementary Table S1.2 for details). (b) Least squares means (±95% CI) of total length and mass for male and female walleye between 2002–2003, 2015, 2016, and 2017 in the four rivers surveyed. There was also a significant change between 2016 and 2017 (p = 0.0092 for total length and p = 0.003 for mass) for male fish in Chalifour River, but this was not shown for clarity.

Conservation contrast

Indigenous ecological knowledge and WSD were congruent for changes in body size in Mistassini Lake rivers, but there was disagreement regarding changes in the number of walleye present in sampled rivers (Figs. 2 and 3, Table 2, and Table S1.2).
Fig. 3.
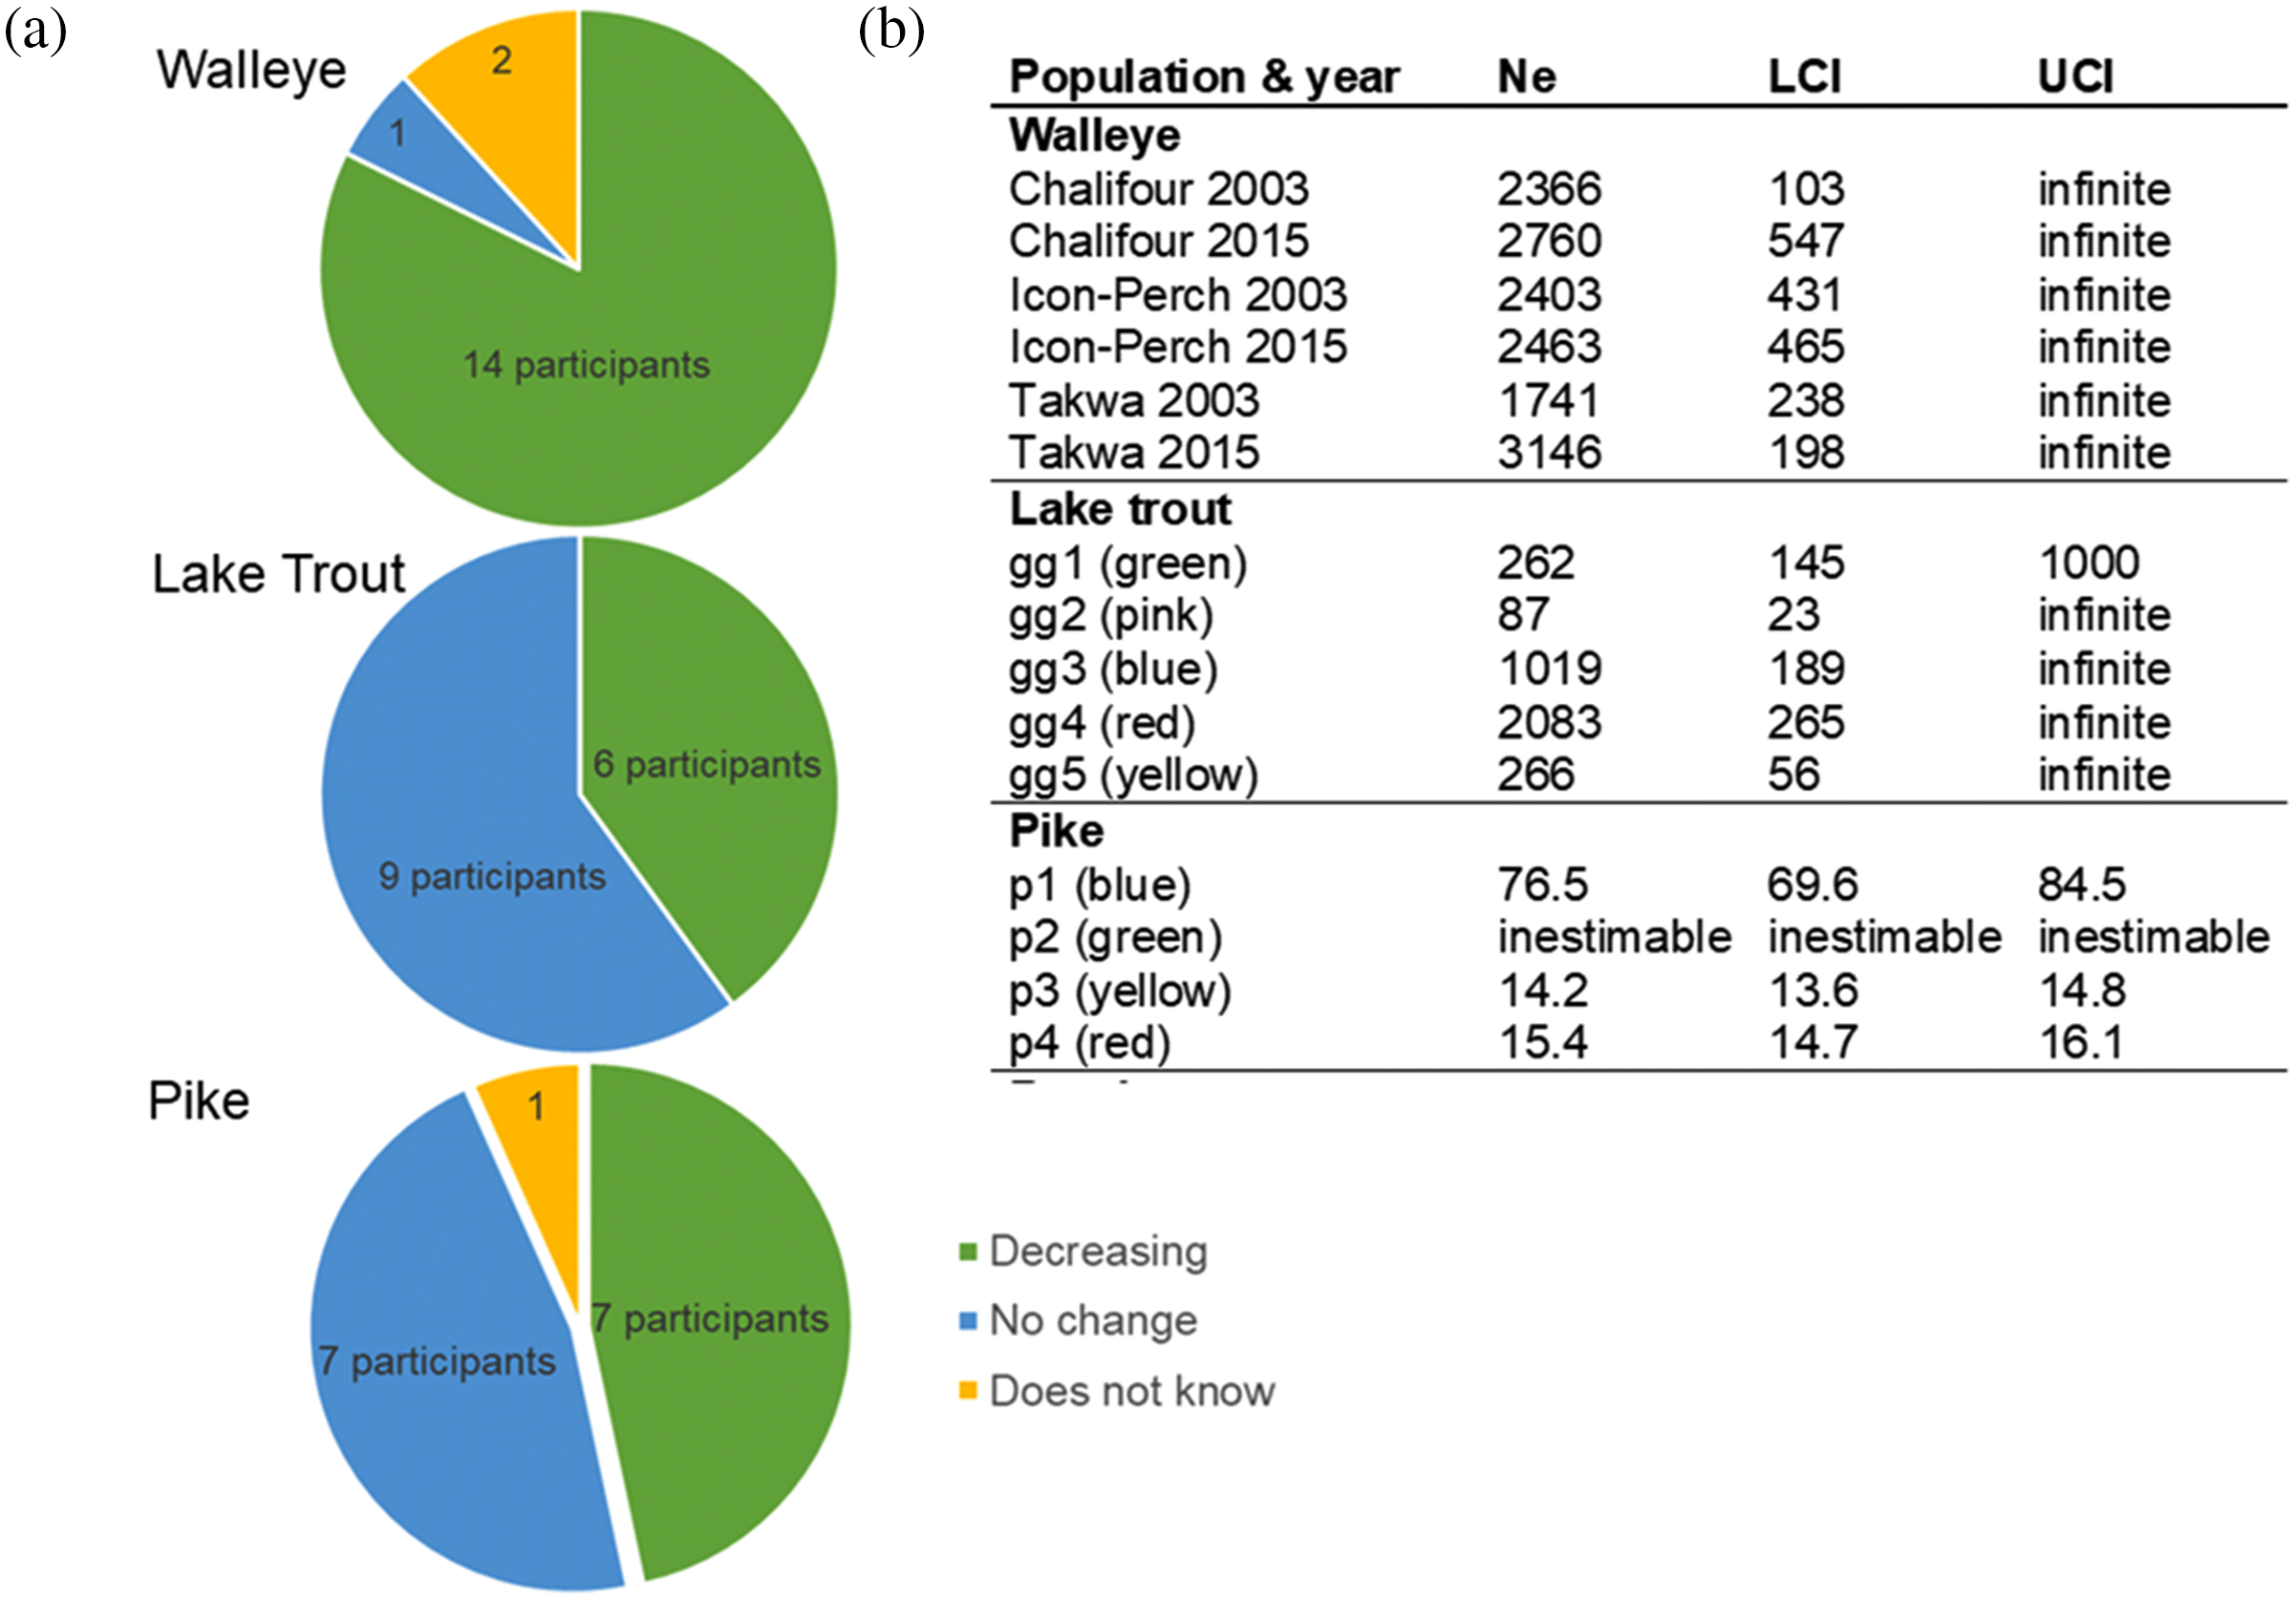
Fig. 3. (a) Trends for changes in numbers of each walleye, lake trout, and pike in Mistassini Lake within the last 60 years shared by knowledge holders. See the Conservation subsection within the Results section and Supplementary Material for further details. (b) Effective population size (Ne) and jackknifed lower and upper confidence intervals (LCI, UCI) over one generation for each Mistassini Lake walleye, lake trout, and pike population and year sampled. Each “gg” and “p” are arbitrary abbreviations for “genetic group” and “population”, respectively. Walleye populations are clearly defined per river, and are therefore designated accordingly.
Conservation IEK
There was near-unanimous agreement that there were fewer walleye, and that they are smaller now in Mistassini Lake than between 5 and 25 years ago (primarily 15 years or less) (Table S1.2). Unfortunately, we did not specify a location in our question about where they were getting smaller and thus only saw change regionally within the lake reflected with IEK when the respondents reported this without prompt.
Conservation WSD
While Ne was large within all populations in both 2003 and 2015, ranging from 1741 to 3146 (Fig. 3), body size decreased between these timepoints in the south (total length by 7%–21% and mass by 22%–47%), but did not decrease in the north (Fig. 2) (Bowles et al. 2020). Although the Ne of populations in both historical and contemporary years was large (Fig. 3), caution must be used in comparing these estimates (given the generation time for walleye of several years) to the number of fish annually in the rivers, which would be a much lower number. Ne will not change as much as the total number of fish (Shrimpton and Heath 2003) and can require at least several generations before change is seen (Nunziata and Weisrock 2018), while only up to 2.5 generations passed between sampling timepoints.

Lake trout

Population structure contrast

Overall, IEK and WSD were complementary for lake trout population structure in Mistassini Lake (Table 2).
Population structure IEK
Knowledge holders reported spawning habitats consistently in shallow water, along the western shoreline (6/15 knowledge holders, but knowledge holders could indicate multiple responses), or in shallow areas but not exclusively the western shoreline (1/15 knowledge holders); in addition, two knowledge holders reported that different morphs spawn at different depths. Spawning was reported as between late August and the third week of September, but details were kept to a minimum (e.g., exactly where the different morphs spawn). In addition, knowledge holders consistently described that lake trout use different spatial habitat at different times of year, with clear distinctions in geography and depth (Table S1.3).
Population structure WSD
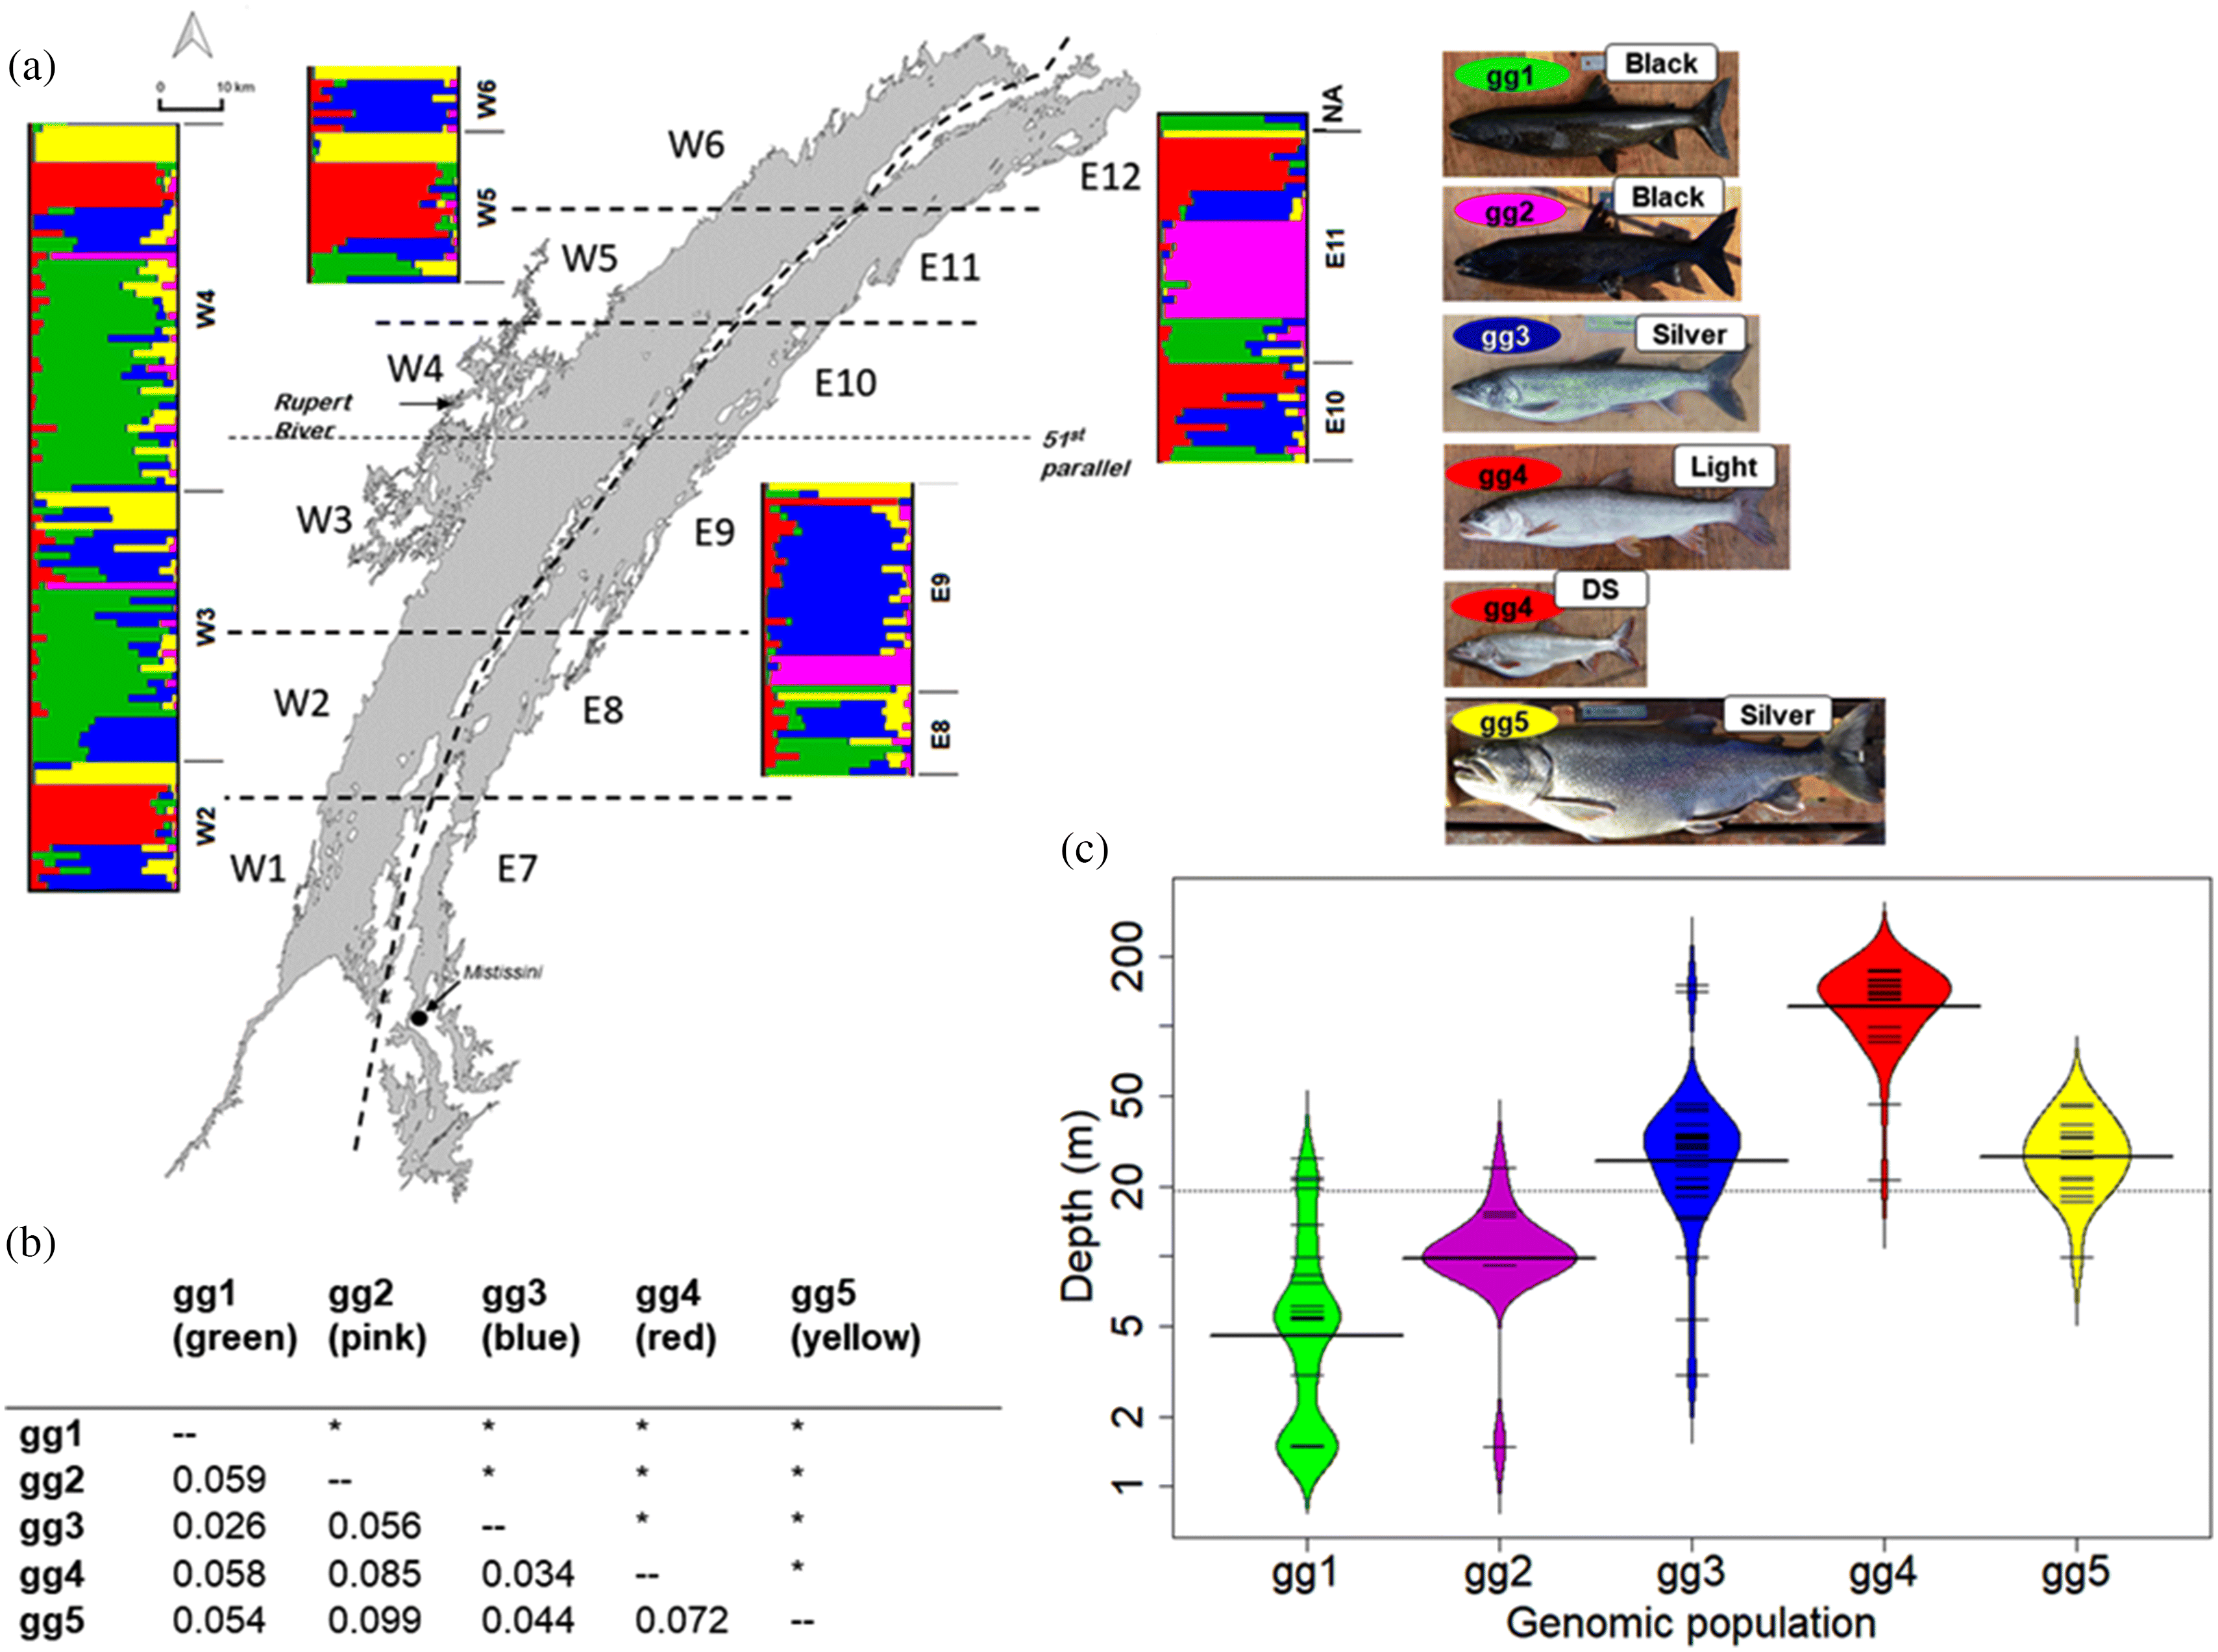
A minimum of five genetically distinct populations of lake trout were found by CV and k-means (See Supplementary Material for details). Populations were geographically structured to some degree, and gene flow (FST used as proxy) varied from high to moderate (0.026–0.099) between genetic populations (shown as gg1–gg5, Fig. 4a and 4b; gg is an arbitrary acronym for genetic group). There was a Rupert River cluster, gg1 (green), sampled in W3 and W4, an E11 cluster, gg2 (pink) found in E11, and gg3 (blue) mostly found in E9. Populations gg4 (red) and gg5 (yellow) were found in most sectors and had moderate differentiation between each other. Overall, gg2 and gg5 were the most distinct. While considerable genetic exchange does occur amongst some of these clusters, cumulatively these results demonstrate clearly distinct population units and moderate natal philopatry in lake trout.
Fig. 4.
Fig. 4. (a) Genomic population structure of lake trout, showing k = 5 populations with colours representing individuals’ assigned genetic populations but with individuals shown in the lake sector where they were sampled, which was during feeding season. (b) FST differentiation within and between populations. FST estimates are below the diagonal, and p values are above the diagonal, with * indicating p ≤ 0.001. “gg” is an arbitrary abbreviation for genetic group. (c) Bean plot showing depth at which each sample was caught according to their genomic population and the density at that depth. The long line at ∼20 m indicates the median. See text in the population structure IEK subsection of the Results section for details shared by knowledge holders regarding breeding patterns of lake trout. The map image (excluding data) used in this figure is from Marin et al. (2016).
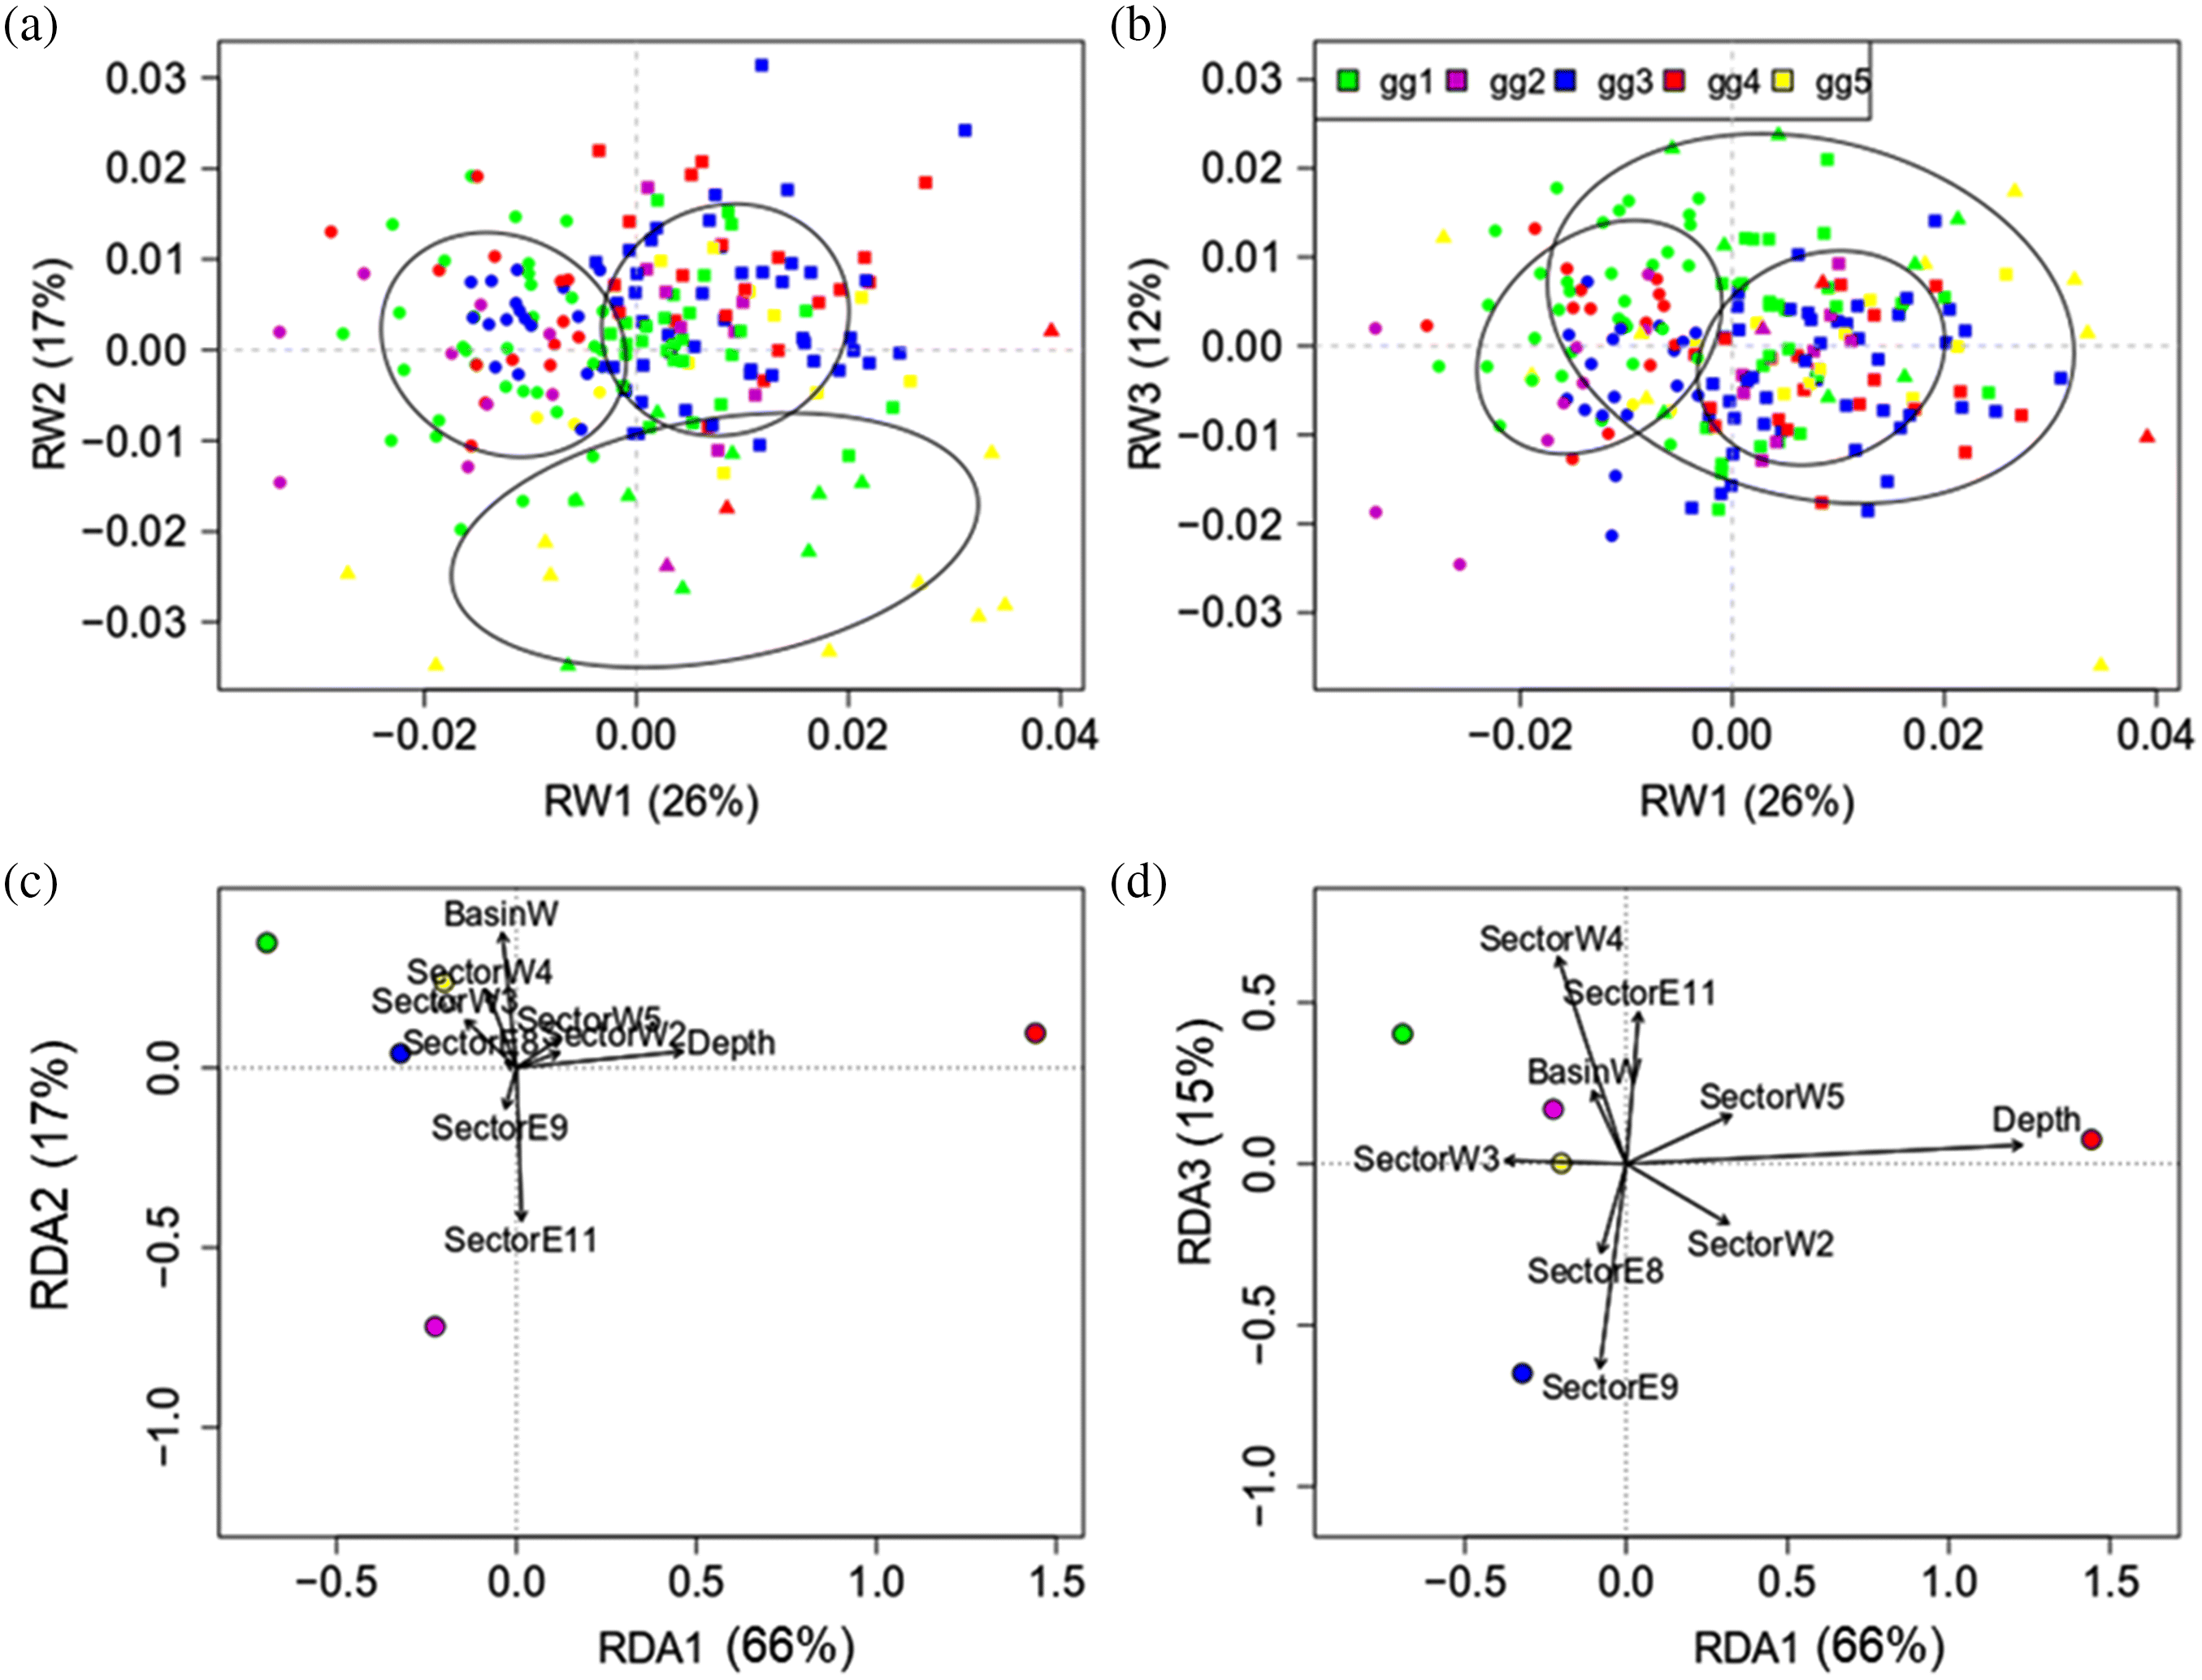
By WSD, depth rather than morphology or location of capture was the most significant variable explaining population structure (Figs. 4 and 5). A contingency test between genomic cluster and morphology found a significant (p < 0.001), but weak relationship (Cramer’s V = 0.33) (Fig. 5a and 5b), similar to Marin et al. (2016) using microsatellites. The selected RDA included depth, basin, and sector (R2 = 0.38). The global permutation results between ecological variables and canonical test was also highly significant (p = 0.001), with the first three RDA axes explaining the relationship (RDA1 66%, RDA2 17%, and RDA3 15%); the first RDA axis, explaining 66% of variation, was attributable to depth, and RDA 2 and 3 were driven by geographic sector, in particular E9 and 11 for RDA2 and W4 for RDA3 (Rupert River) (Fig. 4 for sectors and Fig. 5c and 5d for RDA outcomes). It is not clear if the majority of lake trout spawn in shallow areas along the western shoreline because we sampled during feeding rather than breeding season; on the other hand, IEK provided broad locations of capture and a variety of depths during the breeding season, as we found using WSD—a striking congruence. However, because IEK did not describe the extent of correspondence with depth and colour/morphology that WSD uncovered, we scored population structure as complementary (Table 2).
Fig. 5.
Fig. 5. (a) Association between genomic cluster and the first three relative warps (RWs) for lake trout body morphology. Shapes represent the morphological clusters, and colour is the genomic population. (b) Results of the redundancy analysis (RDA) for variables explaining the genomic population clustering (depth, basin, and sector) representing 98% of the variation. Coloured circles are the genetic population (or group, “gg”), and arrows show the nature of the association.

Morphology contrast

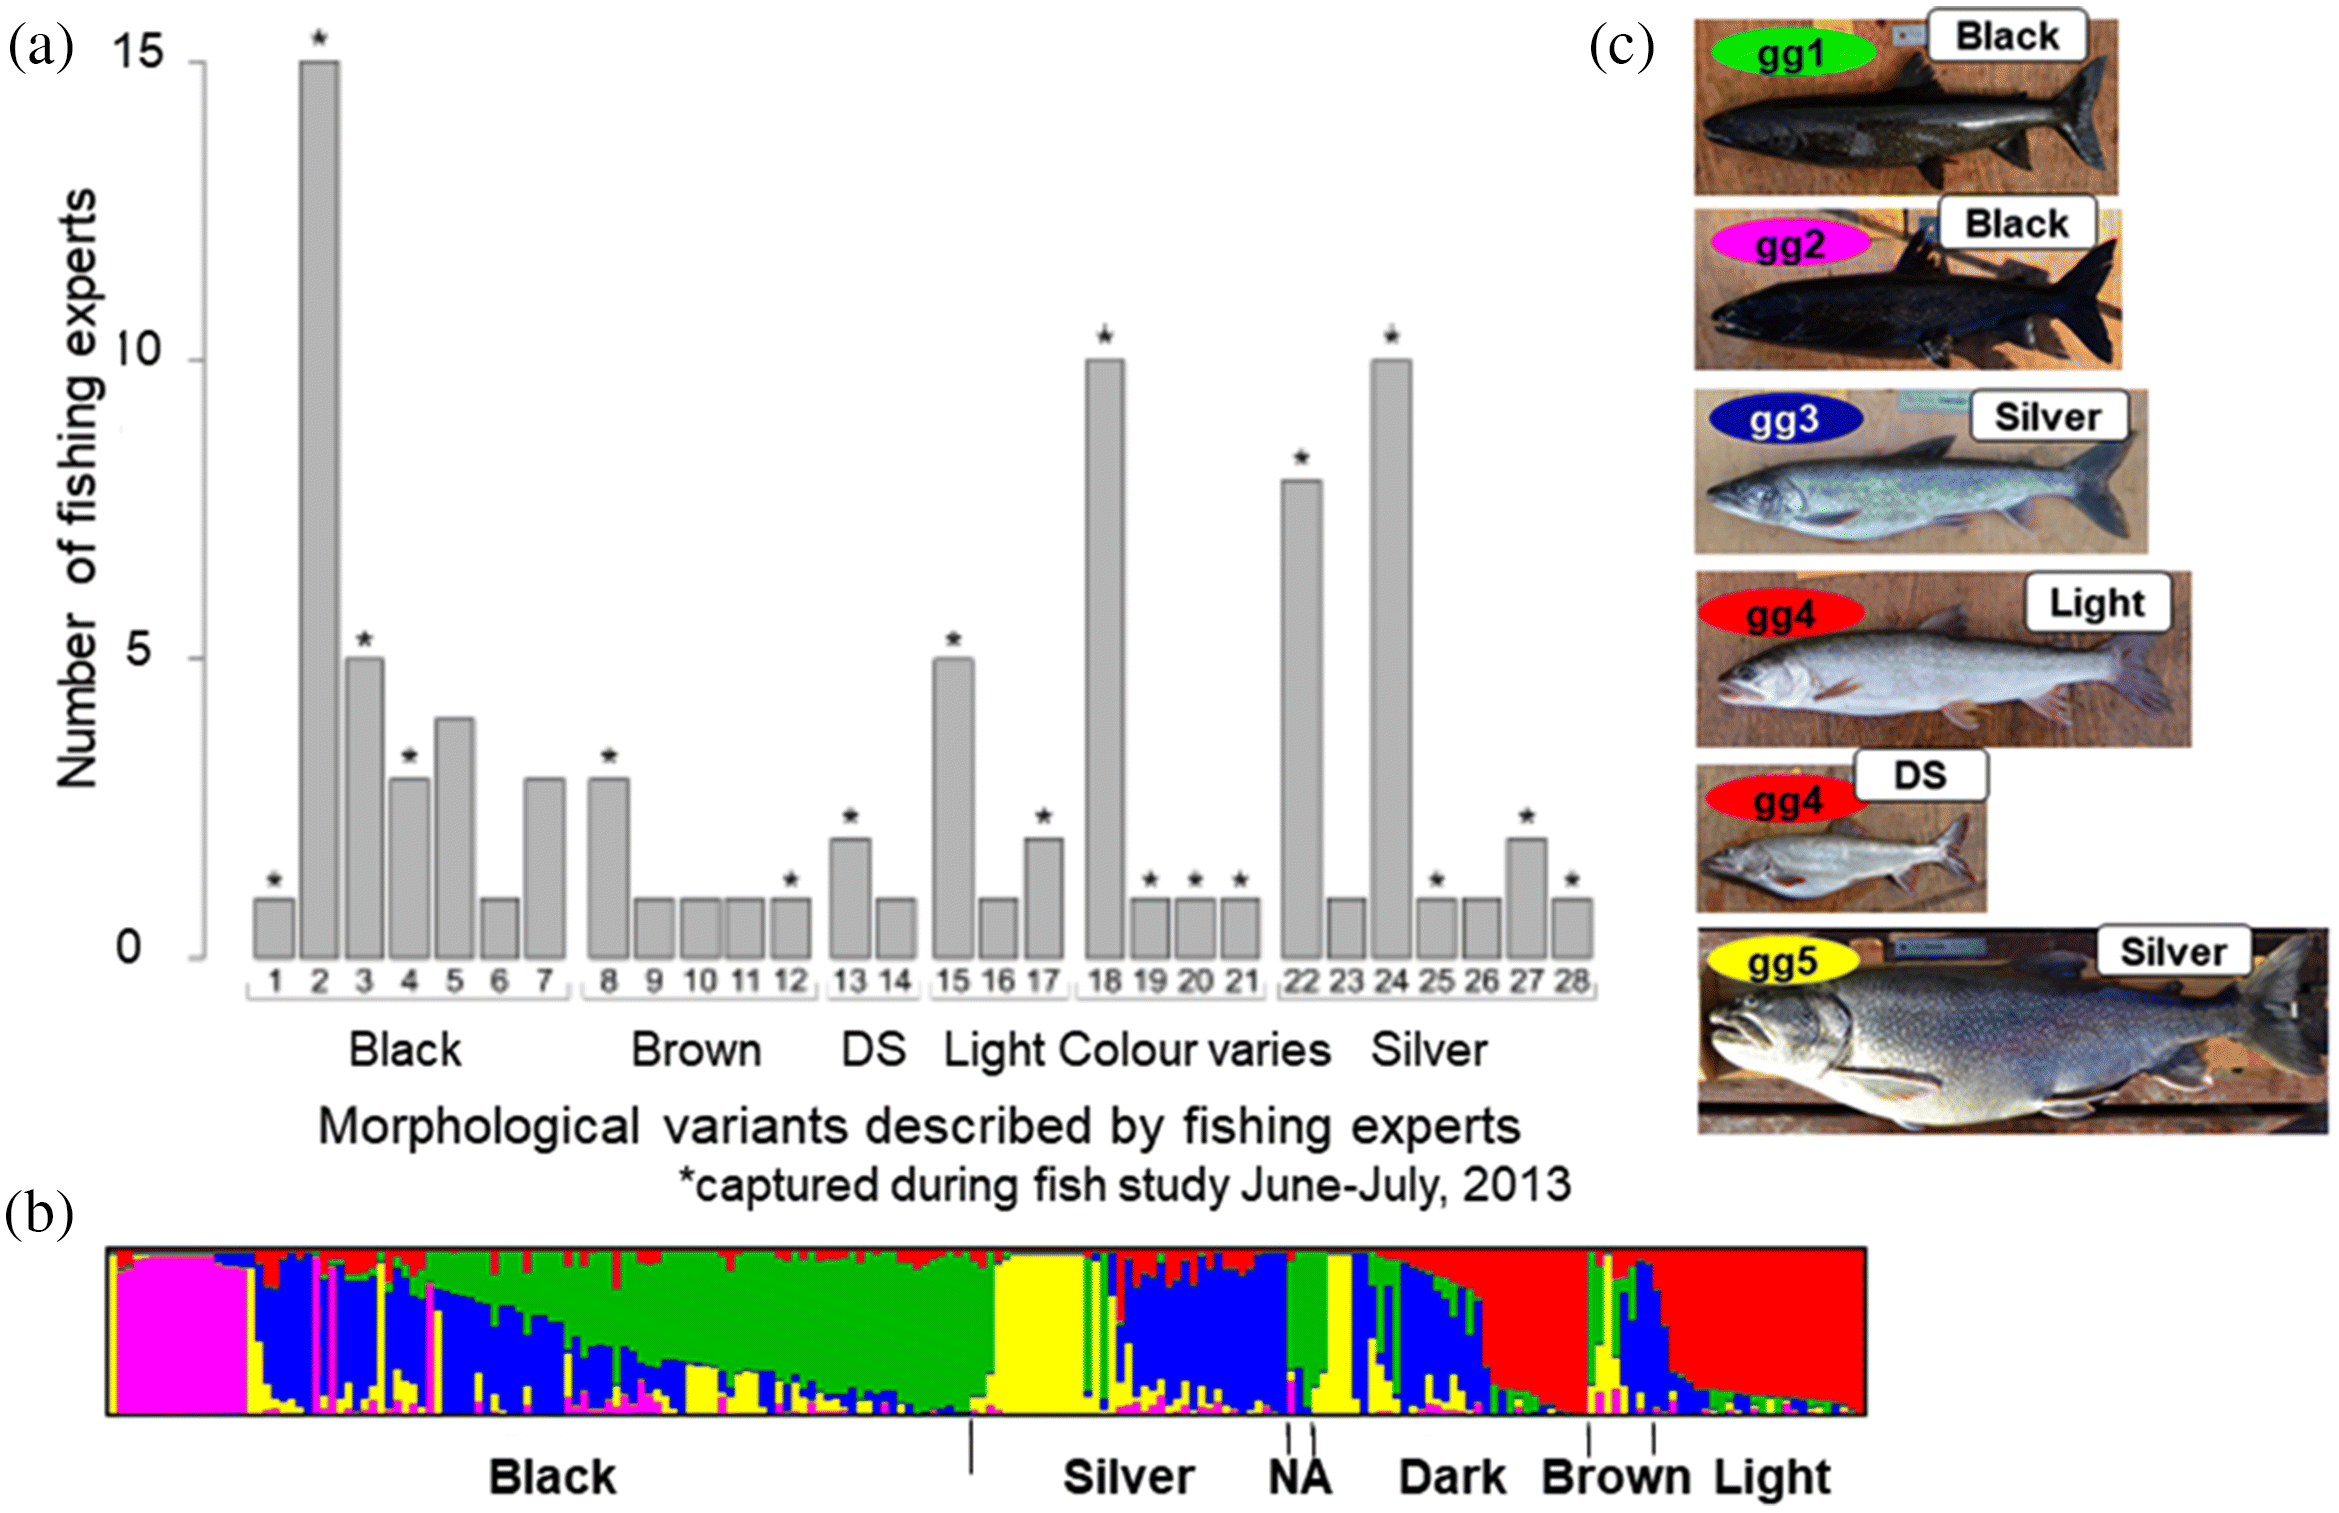
Indigenous ecological knowledge described a greater number of morphs than WS morphometrics or colour, and more than the number of genomic clusters found in this study, while the variations described consistently (> 5 informants) were close in number to those identified by WSD (Figs. 46, Table S1.3). Thus, we have categorized this outcome as congruent and complementary (Table 2).
Fig. 6.
Fig. 6. (a) From Marin et al. (2017) with permission from the author. Number of fishing experts who identified the discernible lake trout morphological variants described by Indigenous ecological knowledge, grouped by colour (DS = dark silver). (b) From this study. The ancestry of each individual grouped according to lake trout colour morph, as determined with Western scientific data. Ancestry colours shown here correspond to Figure 4a (k = 5 populations). (c) This study. Pictures of fish from all genetic clusters with colour assignments. Note that the brown variant is not shown here. Photos were taken for Marin et al. (2017), but individuals have been assigned to populations according to genomic data from this study.
Morphology IEK and WSD
Several knowledge holders described morphs in association with depth (Marin et al. 2017). Twenty-eight morphs were described in total by knowledge holders, while by WSD there were three variants for body shape, five for head shape, and five distinct colours. However, many of the morphs described by knowledge holders could be grouped into colour morphs found (Fig. 6). In addition, here we find that some colour morphs group into genetic populations identified (Fig. 6b). Genetic population gg2 were only black in colour and gg1 were mostly black, while gg4 were dark and light. Genetic population gg3 had individuals from every colour morph.

Conservation and population monitoring information

The Ne of lake trout populations differed considerably (Fig. 3), as did reports of concerns about lake trout populations (Table S1.4); however, we did not compare these metrics and instead are reporting them simply as complementary pieces of information because reports from knowledge holders refer to long-term knowledge of these populations, whereas our estimates by WSD are from a single time-point (Table 2).
Conservation IEK
Nine of 15 knowledge holders expressed that lake trout populations were stable, while 6/15 reported that they were decreasing, and reported various possible causes such as overfishing, the number of boats on the lake, or warming water.
Conservation WSD
Ne ranged from <300 in three populations to >1000 in the other two populations. Population gg2 was the most distinct and was also the smallest by Ne, but gg1 had substantial gene flow and was similar in Ne to gg5, which had moderate levels of gene flow.

Northern pike

Population structure contrast

There was disagreement between IEK and WSD for population structure in northern pike (Table 2).
Population structure IEK
Indigenous ecological knowledge reported that spawning occurred throughout the lake in shallow areas and not in any specific locations. Seven of 11 knowledge holders said that fish looked the same throughout the lake. Four of 11 described variation in colour; of these 4, two described a geographic pattern to differentiation (Table S1.6).
Population structure WSD
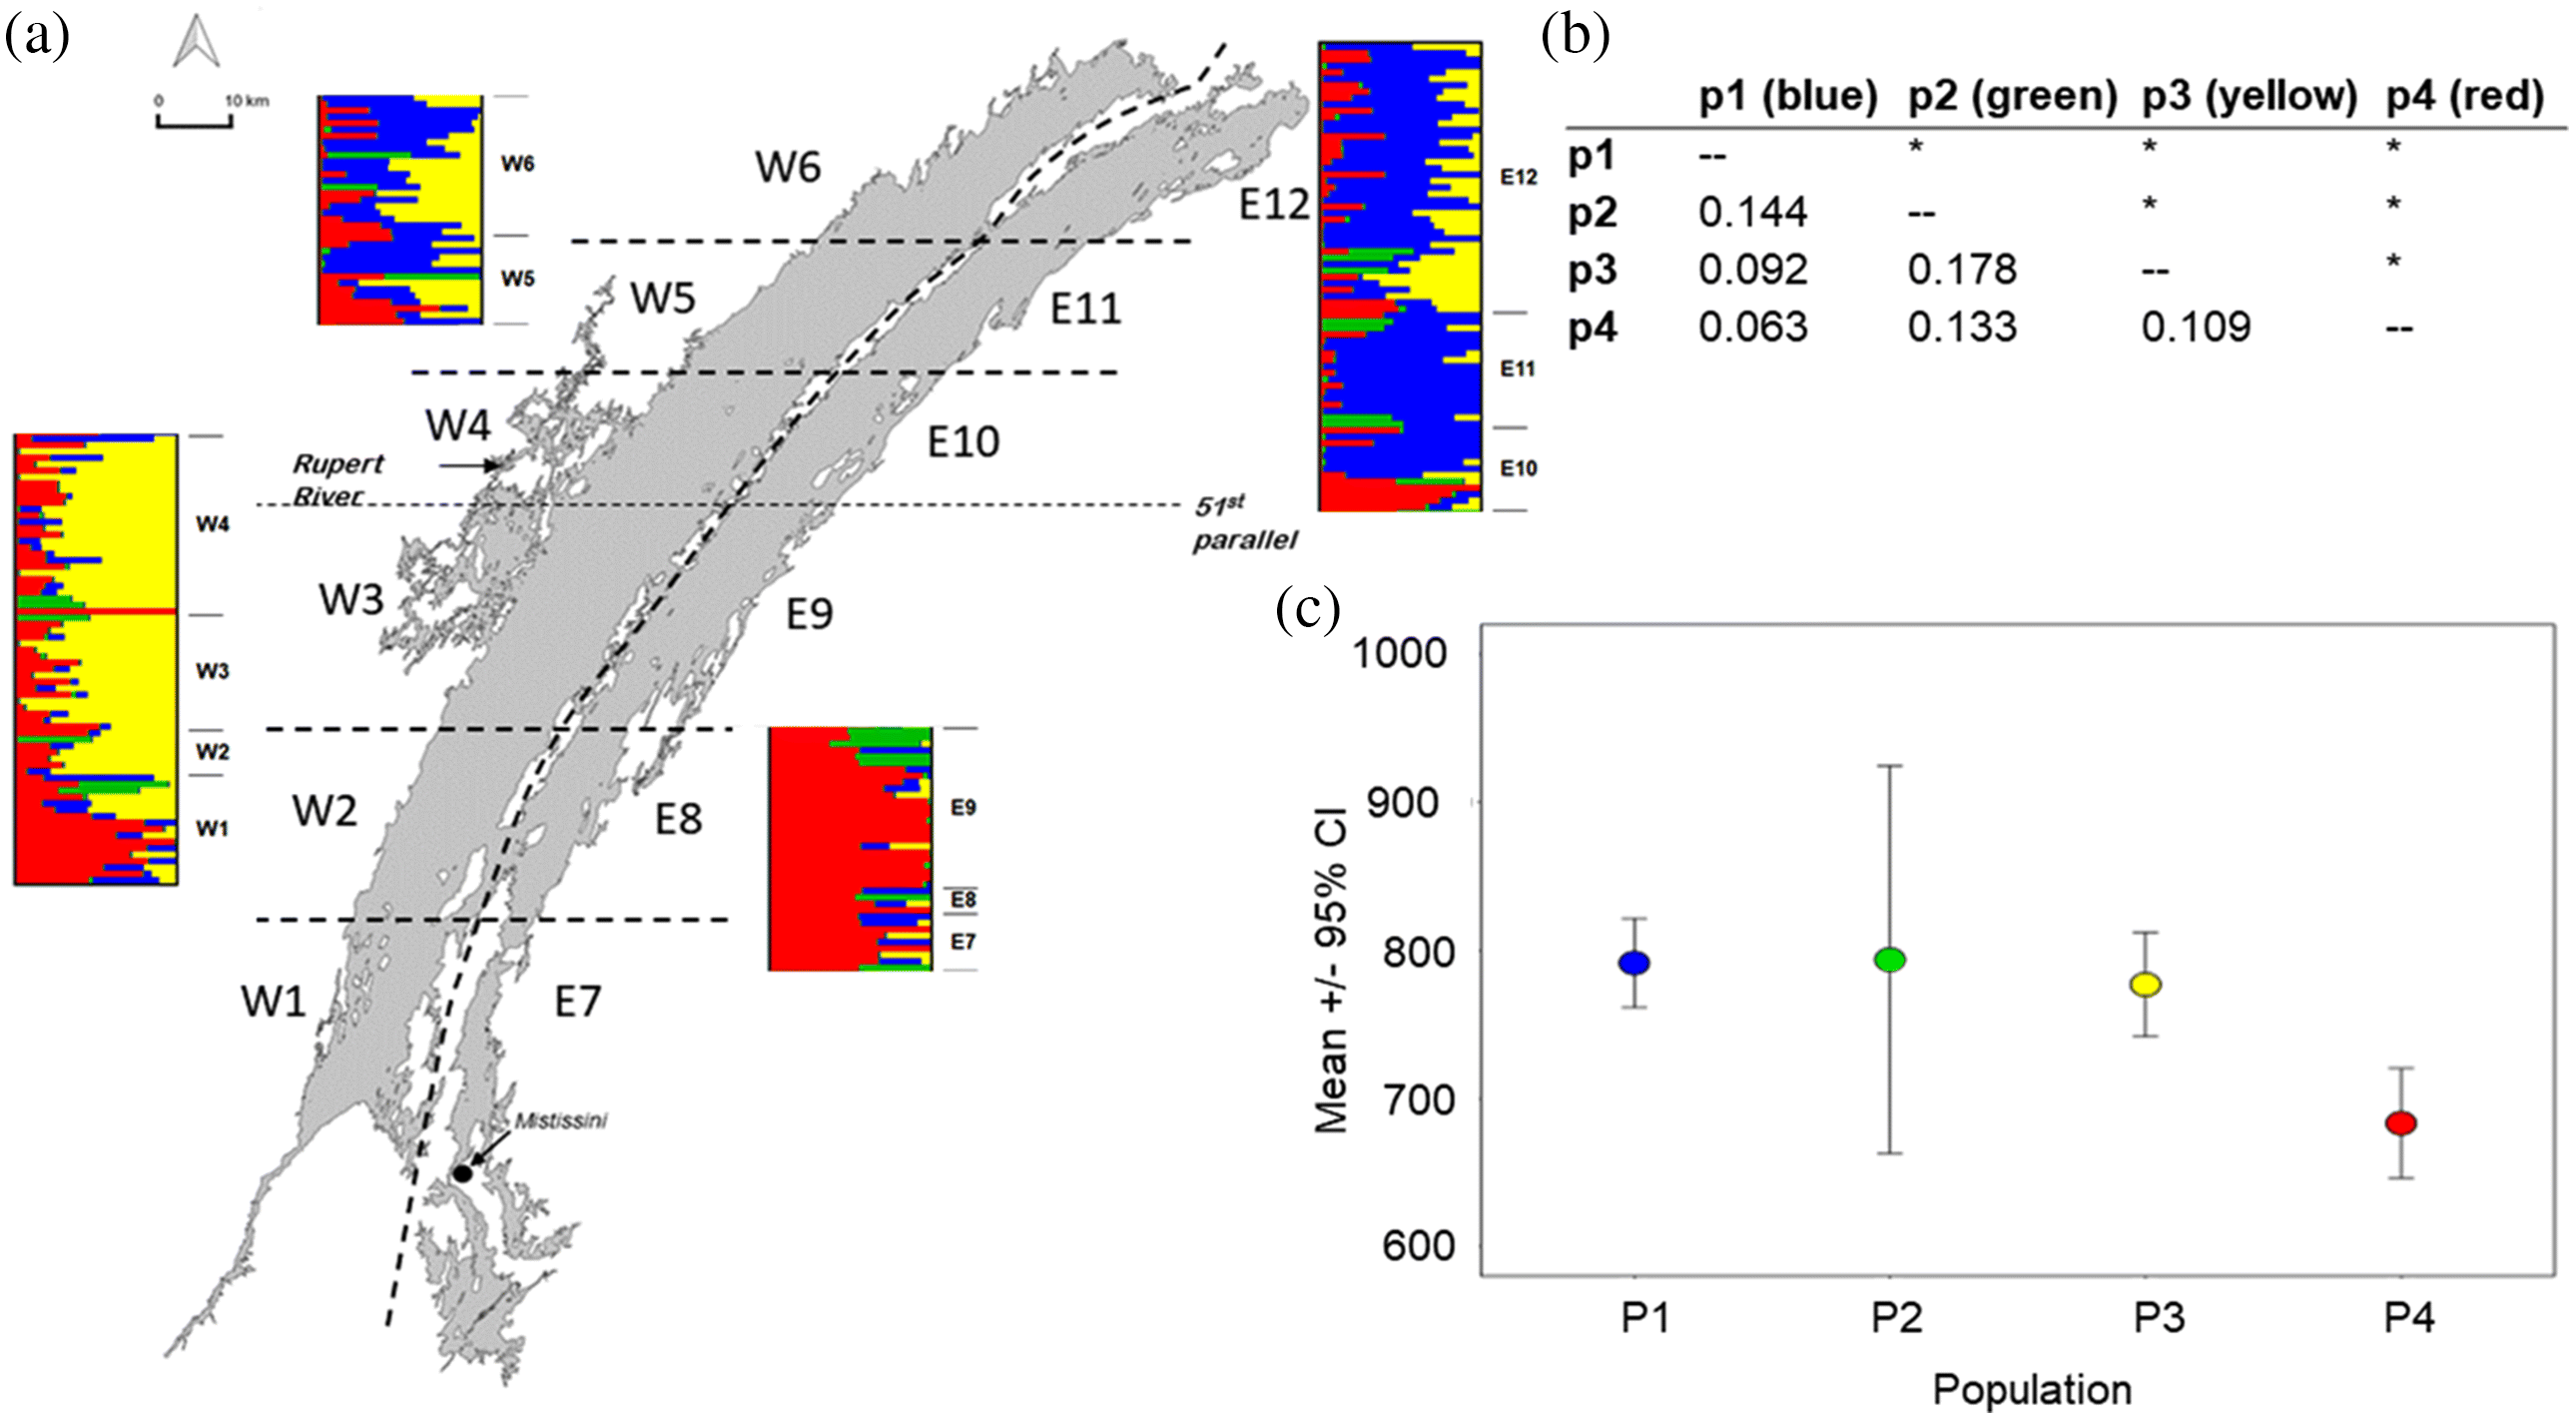
Four population units (p1–p4) were found by CV and k-means (See Supplementary Material for details), three of which were geographically based. These three main groups, p4 (red) in the southeast, p3 (yellow) at Rupert River, and a northern group in both the east and west basins (p1, blue) (Fig. 7a). P2 (green) occurred in all geographic regions. Gene flow (FST as proxy) estimates were moderate to low in all cases, ranging from 0.063 to 0.178. Interestingly, p2 was the smallest population (only 11 of the total samples sequenced) and the only population that did not have any evident geographic basis; it also had the lowest gene flow with other populations (i.e., was most discrete). While there was genetic exchange between all four genetic clusters, cumulatively the results demonstrated strong natal philopatry in northern pike, which has been documented elsewhere (Larsson et al. 2015; Skov and Nilsson 2018), although the geographic regions where fish breed were quite large for each group (i.e., not confined to main spawning rivers).
Fig. 7.
Fig. 7. (a) Genomic population structure of northern pike showing k = 4 populations and colours representing individuals’ assigned genetic populations, but with individuals shown in the lake sector where they were sampled, which was during feeding season. (b) FST differentiation within and between populations. FST estimates are below the diagonal, and p values are above the diagonal, with * indicating p ≤ 0.001. “p” is an arbitrary abbreviation for ‘population’. (c) Total length (mm) of each northern pike population (raw values) ± 95% confidence intervals. No population structure was identified by Indigenous knowledge. The map image (excluding data) used in this figure is from Marin et al. (2016).
Of note, by discriminant analysis of principal components (DAPC) >90% of the variation between populations was explained by a single PC axis, which separated individuals from the “green” population, which was not geographically based (Figure S1.4a and S1.4c). It is possible that these fish come from a distinct drainage and have unique breeding grounds. This distinction was also seen in the FST results (Fig. 7b).

Morphology contrast, as well as IEK outcomes and WSD results

The range of body sizes by WSD (438–1160 mm) was slightly smaller than the range given by IEK, which was 300–1830 mm (Table S1.6); thus, we scored morphology as congruent and complementary. Note that body size confidence intervals overlapped for the northern and western groups (red and yellow), as well as green (though the number of individuals sampled in this population was small), but pike from close to the community were smaller (Fig. 7c).

Conservation and population monitoring information

We did not compare IEK and WSD (Ne) in northern pike; instead we report them as complementary pieces of information because IEK is reported over 60 years, whereas WSD was only sampled once. However, we note that inferences can be made about body size based on the variation shown between populations within the lake (Fig. 7).
Conservation IEK
Half of the knowledge holders who provided a trend in numbers, 7/14 reported no change in the number, and 9/16 reported no change in size of northern pike over the years of their experience. Conversely, for both metrics, respectively, 7/14 and 7/16 respondents did report a decline (Table S1.7).
Conservation WSD
Ne was small for all populations (Fig. 3). The Ne of p2 was inestimable, likely because of insufficient sample size for the calculation. Also note that we found smaller fish close to the community (Fig. 7a); this could indicate the need to ask specific questions to knowledge holders about the size of pike found in different parts of the lake and to monitor p4, the population that is below the 51st parallel where the recreational fishery primarily takes place closer to the community.

Discussion

Using three, socio-culturally important freshwater fishes from Quebec’s largest natural lake, we tested the hypothesis that the concordance of IEK and WSD results for three population monitoring parameters (population structure/degree of philopatry, morphological variation, and conservation status) was determined by the temporal and spatial scale of the knowledge type. Two aspects set our work apart from previous IK–WS studies. First, we combined IEK with genomics, an effective WS tool for demarcating population structuring. Second, we studied multiple species within a single ecosystem to assess the congruence (overlap), complementarity, or disagreement between IEK and WSD, how/if monitoring approaches can be scaled according to IEK and WSD, and factors that might modulate this scaling. We found a mixed correspondence between IEK and WSD. The predictions matched results in 1/7 cases, indicated both congruence and complementarity where one or the other was predicted in 4/7 cases, and in 2/7 cases where complementarity was predicted, results either disagreed or suggested a combination of congruence and disagreement (Table 2). Where temporal or spatial scale did not clearly explain results, the degree of concordance was influenced by the species’ life history, demand for the resource by the community, and (or) protection of information. Below, we summarize findings from each population parameter examined, and then elaborate on more general recommendations for weaving IEK and WSD.

Population structure—degree of philopatry

In Mistassini Lake, all three species were characterized as having several distinct populations by WSD, with population divergence according to WSD being most prominent between the western versus northern or southern regions of the lake. These geographic parallels in extent of population structure across the species, at least based on WSD, suggested that populations are from different glacial lineages (i.e., secondary contact), which is fairly unique amongst north-temperate freshwater fishes (but see Bernatchez and Dodson 1990; Wilson and Hebert 1998; Taylor and McPhail 2000; Fraser and Bernatchez 2005a, 2005b).
Population structure was generally congruent between IEK and WSD for walleye but was complementary for lake trout and disagreed for pike (Table 2). Regarding lake trout, knowledge holders described breeding over large geographic areas, but primarily over one shoreline, and shallow (Table S1.3). Conversely, WSD indicated distinct population clusters associated with different depths, some of which seemed to be primarily grouped where they were sampled (i.e., gg1, gg2 and gg3, Figs. 3 and 4). We note, however, that two knowledge holders described different morphs spawning at different depths, which aligned with WSD. Perhaps lake trout populations do primarily breed in shallow areas around the western shoreline, especially with individuals from the clusters associated with specific depths during feeding (i.e., the population structure that we defined); because we did not sample at breeding time, it is not possible to know. Alternatively, some knowledge holders’ knowledge may be more local to their trapline, so they may not have come across other spawning beds. We believe this is unlikely, however, as many knowledge holders identified various locations and depths for lake trout during the feeding season (Table S1.3). Lastly, knowledge holders were reluctant to provide spawning information for the species (Marin et al. 2017), possibly because it is of cultural importance and peoples’ desire to protect their knowledge (Gagnon and Berteaux 2009). Given the low number of responses for this parameter, and the two knowledge holders responses that aligned with WSD, if a greater number of knowledge holders could have been interviewed within the community, perhaps alignment of the IEK and WSD outcomes would be more congruent for lake trout. Overall, this is a great example of when using WSD may be important for conservation practice if population structure information is desired by communities, but contrasting knowledge systems here is also informative.
Regarding the disparity in northern pike population structure described between IEK and WSD, IEK uncovered no population structuring (Table S1.6), whereas WSD found strong structure (Fig. 7). Northern pike are consumed less for subsistence than the other fishes. Therefore, knowledge holders may pay less attention to the nuances of their populations. Conversely, northern pike are not known for major phenotypic distinctions in body shape, spot pattern, and colouration as in Salvelinus species. Additionally, northern pike generally have very low levels of population structure (Miller and Senanan 2003; Rondeau et al. 2014), though population structure is variable in different habitats, and several studies have detailed substantial degrees of homing (Skov and Nilsson 2018).
Lastly, the temporal scale covered by IEK and WSD was different for population structure. Whilst both knowledge types estimated a “snapshot” in time (Table 1), WSD estimated ancestry since colonization while IEK covered breeding locations in contemporary time. Thus, for example, evolution of different lineages in allopatry and subsequent secondary contact inferred by WSD may not be seen by IEK. In addition, genomics allowed us to visualize the degree of gene exchange (movement) of individuals. We did not specifically ask IEK questions about hybridization or exchange between groups, but this level of detail may not be possible where phenotypic divergence is low (e.g., northern pike), or the spatial scale of observations is restricted. The detail facilitated by genomic information should perhaps be considered as another scale axis. In sum, we have discussed several factors that may have mediated concordance between knowledge types for population structure; it may be that population structure was documented by IEK largely when there were clearly defined spawning rivers, and that this parameter, if desired by communities, may be best assessed using WSD.
To our knowledge, no studies other than Polfus et al. (2016) on caribou, Gros-Balthazard et al. (2020) on date palm agrobiodiversity, Henson et al. (2021) on gizzly bear language group concordance, and the earlier IEK:genetic studies on Mistassini lake fishes (Fraser et al. 2006; Marin et al. 2017; Bowles et al. 2020) have combined IEK and population genetics. Moreover, few studies have investigated genomic population structure across multiple species within large lake systems, for comparison to our work (i.e., using thousands of SNPs). Regarding the concordance of morphs identified by IEK and population genetic outcomes, Fraser et al. (2006), Polfus et al. (2016), and Gros-Balthazard et al. (2020) found good congruence between knowledge systems, similar to our finding in walleye. As we found herein with genomics, more morphs were identified by IEK than genetics in lake trout in Marin et al. (2017).

Morphological variation

Morphological variation was congruent between IEK and WSD, though information was more detailed and broader in scope using IEK (Table 2), similar to past works (Riedlinger and Berkes 2001; Drew 2005; Polfus et al. 2016). When multiple morphological forms were present in a species, it was evident both using WSD and IEK, shown here in lake trout. However, IEK provided more detailed morphs in lake trout than WSD (Figs. 3 and 4), even at the same spatial and temporal scale. Indigenous ecological knowledge and WSD were largely in agreement for much of the range in body size variation for both walleye and northern pike (the two species for which this parameter was taken using both methods), but IEK recognized a greater range. For walleye, this may be because knowledge holders were reporting body size for the entire lake, whereas we only examined spawning fish at four rivers. It is well-recognized that fish from the Rupert region can be very large, for example, and the Rupert was not part of our 2015–2017 study. That is, the spatial scale of IEK appeared to be larger than WSD in walleye, as observed in other studies (Ferguson et al. 1998; Gagnon and Berteaux 2009; Polfus et al. 2014), but is contrary to most studies (see Gagnon and Berteaux (2009) for a list of spatial and temporal scale covered by WSD and IEK). Alternatively, the gear that was used to sample walleye and northern pike could have been size selective, and our sampling was limited temporally; thus, in all instances, IEK may be more accurate. Overall, the suitability of each could be determined by managers desiring comprehensive or reductionist information.

Conservation status

We compared trends in population abundance and fish size using IEK and WSD for walleye, because we had equivalent information to do so. Where temporal and spatial scale matched between knowledge types for conservation parameters for walleye, results were congruent (i.e., body size); where temporal scale did not match (e.g., IEK trends in fish numbers vs. Ne), they were complementary, as Gilchrist et al. (2005) and Aswani and Hamilton (2004) both observed. We note that WSD measures of abundance such as estimates of census population size (Nc) might have provided better congruence with IEK in this system and be more suited for monitoring population size in sensitive situations. However, estimating Nc could be problematic in situations of conservation concern or when populations are small in environments such as Mistassini Lake, because target species mortality and bycatch mortality can be large using gill nets.
Complementarity of results also arose when results from different knowledge types could not be compared because there was no feasible way to estimate a given parameter with both knowledge types. For example, estimates of size-at-age, estimated here using WSD in walleye, might be impossible to detect using IEK because analytical tools other than human senses are needed to visualize it. WSD may be a better tool for uncovering some but not all mechanisms of population change (e.g., Donovan and Puri 2004). All cases of complementarity are informative and illustrate the importance of both knowledge types individually or in tandem (Aswani and Hamilton 2004).
While we could not contrast IEK and WSD for conservation status in lake trout and northern pike, useful information emerged from the complementary information we present. We assessed congruence and complementarity based on majority consensus; and, while consensus was very clear for walleye on conservation status, responses were not as clear for lake trout and very mixed for northern pike. This may be a sign that negative changes are nascent and that further monitoring is needed, including a poll of more individuals if possible. The difference in body size among pike populations is striking (Fig. 7), with the population in the most-fished part of the lake being smallest. While this finding could be due to differences in nutrient availability in that region of the lake, Mistassini Lake is a well-mixed oligotrophic lake, and these trends are similar to those in walleye, which may be due in part to harvest pressure (Bowles et al. 2021; Bowles et al. 2020). Additionally, Ne among lake trout and northern pike populations varies considerably, suggesting that below-species population-level management could be useful (Allendorf et al. 1987; Moritz 1994). We were only able to estimate Ne for a single timepoint because previous studies had not been done on either species to provide another timepoint for estimation. Given the generation-time of each species, meaningful estimation of changes in Ne would take at least a decade for northern pike and multiple decades for lake trout. Ne captures the number of breeders over one generation (∼12 years for lake trout and two to five years for northern pike (Frost and Kipling 1967)), whereas IEK spanned several decades (Table 1).
Similar to what we have found in our comparisons, past works have found IEK of caribou populations and conservation status to be spatially and temporally more complete than other equivalent written records (Ferguson et al. 1998), but the different knowledge types show similar trends. Furthermore, our results here highlight the need for baseline biodiversity studies to be conducted, such as were done in walleye, so that estimates can be compared throughout the years and with IEK. Indeed, in Mistassini Lake, as in other systems, IEK acted as a warning system for population changes that would otherwise likely go unseen (Aswani and Hamilton 2004; Gilchrist et al. 2005).

Recommendations: Weaving IEK and WSD for freshwater fisheries monitoring

Our synthesis of IEK and WSD for freshwater fisheries monitoring highlighted two contexts in which IEK can contribute uniquely to any wildlife monitoring program. Firstly, to establish an understanding of breeding patterns and morphological diversity. For every species studied here, knowledge holders provided us with extensive information about habitat preferences, seasonality, breeding patterns, and much more; without such information, the WSD would have been much less complete. Mistassini Lake is very large and deep, and habitat is complex. The intergenerational knowledge shared informed when, where, and how we sampled, the effort that we put in, and how to gage success. This is consistent with other research and monitoring programs that have woven IEK and WSD (Aswani and Hamilton 2004; Gilchrist et al. 2005; Huntington et al. 2004; Polfus et al. 2014; Polfus et al. 2016). Secondly, collating IEK before commencing WSD will allow managers to detect rapid changes more quickly in populations (Aswani and Hamilton 2004; Moller et al. 2004). As we mention above, other WSD to estimate population size, such as Nc estimates, might be more sensitive than Ne, and be more congruent with IEK. However, Nc estimation is impractical in many northern environments. We saw here that relative abundance and other conservation measures were observed by knowledge holders consistently in all species, and that this information was generally congruent with WSD or provided critical, complementary temporal information. Thus, for northern environments at least, IEK is likely more responsive than WSD for monitoring conservation status and, if desired by Indigenous communities, could be used to determine if WSD is needed. The frequency of IEK data collection could be decided by Indigenous communities based on, for example, a consensus among local land users and researchers on how sensitive a species is to environmental change or human pressures such as harvesting, the generation time of a species, etcetera.
In addition, this synthesis finds that WSD in northern regions has particular strengths in two ways. Firstly, to determine the population structure or ancestry of individuals to help with the clear designation of management units within an ecosystem (Cadrin et al. 2019; Waples and Gaggiotti 2006). Because we assessed this parameter using three species, we were able to ascertain that population structure can be determined using IEK for some species, but not others, that this seems to be modulated by several factors, and that the level of resolution possible using WSD is not attainable with IEK. In addition, incorporating genomics into our approach allowed us to assess population structure at a level of resolution not formerly possible in this system (see Supplementary Material for details). Secondly, consistent with past works, WSD often enables understanding precise mechanisms that could be causing change within populations (Bart 2006, Huntington et al. 2004), though see Donovan and Puri (2004). An understanding of these mechanisms that could be causing population-scale change (e.g., that are of conservation concern) can inform which management actions are most appropriate. For example, regarding the causes of change within Mistassini walleye populations, using WSD we showed that fish in the southern rivers are smaller for their age now than they were in the early 2000s, that this may be associated with increased harvest (i.e., size-at-age has changed), and that there is evidence of genomic change. This change occurred very rapidly, within 1–2.5 generations (Bowles et al. 2021; Bowles et al. 2020). Understanding these mechanisms indicated the severity of the situation and presented a series of management scenarios. Concerns raised by IEK were congruent with the overall findings of the WSD, showing that IEK could be collated more frequently than WSD to keep closer track of population status. Similar to walleye, Fraser et al. (2013) were also able to detect reductions in size-at-age in Mistassini brook trout with IEK, and found early signs of genomic change within one river. Therefore, based on these observations, we suggest that our conclusions may be scalable to other fisheries for the WSD used in this study.
We acknowledge that our predictive method is heuristic. We did not make specific predictions for each spatial and temporal scale, but instead made a blanket prediction that only included both scales. Thus, we assessed a multi-variate problem with a simple yes/no conclusion. A next step would be to develop appropriate statistical tools to assess the question with more nuance. We have tried to provide nuance with a narrative assessment for each prediction.
We wove IEK and WSD to provide insights on options for fisheries management in remote freshwater ecosystems; we assessed how results for multiple species within a single lake may be scalable to other ecosystems to help facilitate this. When IEK and WSD are congruent, Indigenous communities may decide to choose IEK over WSD. A challenge and also opportunity of our comparisons, particularly for conservation parameters, was the epistemological differences between knowledge types (McGregor et al. 2018). Complementarity of IEK and WSD should not be ignored and is a strength of combining knowledge types in research (Gagnon and Berteaux 2009; Huntington et al. 2004; Riedlinger and Berkes 2001). There is simply no way for scientists to be present on the land as extensively as land users; thus, as we have seen here, IEK will always provide much richer information on the biology, distribution and habits of what is observable with the eyes. Alternatively, IEK cannot “see” into evolutionary time or into the genome, and thus WSD is likely to “see” population structure and history more precisely than IEK. Both knowledge systems can “see” change in populations, and the nature of what can be seen can both overlap or be complementary. Together, they provide a much richer understanding of all parameters assessed. However, we stress the points we made above with the strengths of each knowledge system, and Indigenous communities will know what tools are best to apply depending on their needs and resources. In this work we have also tried to push the field forward conceptually by assessing a way to generalize practices for weaving multiple knowledge systems. This study is only a start in that direction, however. We tested our hypothesis in only a single ecosystem. It would be beneficial to scale this study to many other lakes in different regions of Canada to assess scalability of our conclusions. Beyond that, work is needed to characterize the plethora of ways that knowledge systems have been woven to further assess if and when it is appropriate to generalize practices of weaving in research, monitoring, and management in Canada and elsewhere.

Positionality

EB, H-BJ, KM, and DJF identify as non-Indigenous and strive to be allies of Indigenous Peoples, and PM is a member of the Cree Nation of Mistissini. EB, H-BJ, KM, and DJF are all biologists who primarily work with quantitative data; however, DJF has been working with Indigenous partners and IEK since the year 2000, KM since 2013, and EB since 2016. PM was born and raised in Mistissini, is trained in environmental studies, and has been working in the Environment office with the Cree Nation of Mistissini for the past six years. While all team members held/hold their own assumptions and beliefs, these differing perspectives were respected, and all team members remain/remained opened minded. EB and DJF conceived the study and consulted PM and other members of the Cree Nation of Mistissini and Niskamoon Corporation (a majority Cree organization) on project design and implementation. PM facilitated the project within the community. Knowledge holders guided sampling locations and approach. EB primarily analyzed the data, with the support of H-BJ and KM, and oversight of DJF. Results were presented to the Cree Nation of Mistissini in the form of a power point presentation and subsequent question/answer/discussion (independently to Chief and Council, at community meetings, at the local school), with opportunity for comment and to shape the conclusions. There was overarching support for the outcomes, with considerable discussion about causes of decline of walleye populations and fish population abundance in the south in general. Those perspectives are represented in Bowles et al. (2020, 2021) for walleye, and in the Supplementary Tables herein. Reports containing results, and drafts of this manuscript were also sent to the community for review, and we received approval for the paper as is. In our collaboration and this work, we have created a place for both IEK and WSD to be considered equally.

Acknowledgements

We thank the interpreters, countless Cree guides, and >20 knowledge holders who shared IEK with us; we do not list these collaborators names because we did not ask for consent to do so, and explicitly stated that knowledge holders would remain anonymous in the interview preamble. We also thank Z. Eisenhauer, the Nibiischii Corporation, M. Gravel and recreational fishers for assistance with pike sampling, and M. Dunn who facilitated our work with Niskamoon Corporation. Thank you to A. Prevost and T. Bernos for assistance with molecular work, and Fraser lab members E. Lawrence, J.-M. Matte, Z. Eisenhauer, M. Yates, G. Nessel, and R. Koumrouyan for invaluable discussions throughout this project. This study was made possible by a Mitacs Elevate postdoctoral fellowship to EB, funding from Niskamoon Corporation to EB and DJF, an NSERC Discovery Grant to DJF and a Concordia University Research Chair to DJF.

Competing interest statement

The authors declare there are no competing interests.

References

Aikenhead GS, and Ogawa M. 2007. Indigenous knowledge and science revisited. Cultural Studies of Science Education, 2: 539–620.
Alexander DH, Novembre J, and Lange K. 2009. Fast model-based estimation of ancestry in unrelated individuals. Genome Research, 19: 1655–1664.
Alexander SM, Provencher JF, Henri DA, Nanayakkara L, Taylor JJ, Berberi A, et al. 2021. Bridging indigenous and western sciences in freshwater research, monitoring, and management in Canada. Ecological Solutions and Evidence, 2: e12085.
Alexander SM, Provencher JF, Henri DA, Taylor JJ, Lloren JI, Nanayakkara L, et al. 2019. Bridging indigenous and science-based knowledge in coastal and marine research, monitoring, and management in Canada. Environmental Evidence, 8: 1–24.
Allendorf FW, Ryman N, and Utter FM. 1987. Genetics and fishery management. Population genetics and fishery management, 1–19.
Aswani S, and Hamilton RJ. 2004. Integrating indigenous ecological knowledge and customary sea tenure with marine and social science for conservation of bumphead parrotfish (Bolbometopon muricatum) in the Roviana Lagoon, Solomon Islands. Environmental Conservation, 31: 69–83.
Bart D. 2006. Integrating local ecological knowledge and manipulative experiments to find the causes of environmental change. Frontiers in Ecology and the Environment, 4: 541–546.
Bartlett C, Marshall M, and Marshall A. 2012. Two-eyed seeing and other lessons learned within a co-learning journey of bringing together indigenous and mainstream knowledges and ways of knowing. Journal of Environmental Studies and Sciences, 2: 331–340.
Berkes F. 2012. Sacred ecology. Routledge, New York and London.
Berkes F. 2018. Sacred ecology, Routledge, New York, USA.
Bernatchez L, and Dodson JJ. 1990. Allopatric origin of sympatric populations of lake whitefish (Coregonus clupeaformis) as revealed by mitochondrial-DNA restriction analysis. Evolution, 44: 1263–1271.
Biernacki P, and Waldorf D 1981. Snowball sampling: Problems and techniques of chain referral sampling. Sociological Methods and Research, 10: 141–163.
Bongarts J, and Ipbes. 2019. Summary for policymakers of the global assessment report on biodiversity and ecosystem services of the intergovernmental science-policy platform on biodiversity and ecosystem services. Population and Development Review, 45: 680–681.
Bowles E, Marin K, Macleod P, and Fraser DJ. 2021. A three-pronged approach that leans on Indigenous knowledge for northern fish monitoring and conservation. Evolutionary Applications, 14: 653–657.
Bowles E, Marin K, Mogensen S, Macleod P, and Fraser DJ. 2020. Size reductions and genomic changes within two generations in wild walleye populations: Associated with harvest? Evolutionary Applications, 13: 1128–1144.
Buxton RT, Bennett JR, Reid AJ, Shulman C, Cooke SJ, Francis CM, et al. 2021. Key information needs to move from knowledge to action for biodiversity conservation in Canada. Biological Conservation, 256: 108983.
Cadrin SX, Goethel DR, Morse MR, Fay G, and Kerr LA. 2019. “So, where do you come from?” The impact of assumed spatial population structure on estimates of recruitment. Fisheries Research, 217: 156–168.
Catchen J, Hohenlohe PA, Bassham S, Amores A, and Cresko WA. 2013. Stacks: An analysis tool set for population genomics. Molecular Ecology, 22: 3124–3140.
Davis A, and Wagner JR. 2003. Who knows? On the importance of identifying “experts” when researching local ecological knowledge. Human Ecology, 31: 463–489.
Dayton PK, Tegner MJ, Edwards PB, and Riser KL. 1998. Sliding baselines, ghosts, and reduced expectations in kelp forest communities. Ecological Applications, 8: 309–322.
Donovan DG, and Puri RK. 2004. Learning from traditional knowledge of non-timber forest products: Penan benalui and the autecology of aquilaria in Indonesian Borneo. Ecology and Society, 9(3): 295–302.
Doswald N, Zimmermann F, and Breitenmoser U. 2007. Testing expert groups for a habitat suitability model for the lynx lynx lynx in the swiss alps. Wildlife Biology, 13: 430–446.
Drew JA. 2005. Use of traditional ecological knowledge in marine conservation. Conservation Biology, 19: 1286–1293.
Dupont PP, Bourret V, and Bernatchez L. 2007. Interplay between ecological, behavioural and historical factors in shaping the genetic structure of sympatric walleye populations (Sander vitreus). Molecular Ecology, 16: 937–951.
Ferguson MA, Williamson RG, and Messier F. 1998. Inuit knowledge of long-term changes in a population of arctic tundra caribou. Arctic, 51: 201–219.
Ferson S, and Burgman M. 2006. Quantitative methods for conservation biology. Springer Science and Business Media.
Fraser D, and Bernatchez L. 2005a. Allopatric origins of sympatric brook charr populations: Colonization history and admixture. Molecular Ecology, 14: 1497–1509.
Fraser DJ, and Bernatchez L. 2005b. Adaptive migratory divergence among sympatric brook charr populations. Evolution, 59: 611–624.
Fraser DJ, Calvert AM, Bernatchez L, and Coon A. 2013. Multidisciplinary population monitoring when demographic data are sparse: A case study of remote trout populations. Ecology and Evolution, 3: 4954–4969.
Fraser DJ, Coon T, Prince MR, Dion R, and Bernatchez L. 2006. Integrating traditional and evolutionary knowledge in biodiversity conservation: A population level case study. Ecology and Society, 11: 4.
Frost WE, and Kipling C. 1967. A study of reproduction, early life, weight-length relationship and growth of pike, Esox Lucius L., in Windermere. The Journal of Animal Ecology, 36: 651–693.
Gagnon C, and Berteaux D. 2009. Integrating traditional ecological knowledge and ecological science: A question of scale. Ecology and Society, 14(2): 19.
Gcc GCOTC. 2011. Cree vision of plan nord. [online]: Available from caid.ca/CreVisPlaNor2011.pdf.
Gcc GCOTC. 2019. About the Grand Council of the Crees (Eeyou Istchee). [online]: Available from cngov.ca/governance-structure/grand-council-of-the-crees/.
Gilchrist G, Mallory M, and Merkel F. 2005. Can local ecological knowledge contribute to wildlife management? Case studies of migratory birds. Ecology and Society, 10(1): 12.
Gros-Balthazard M, Battesti V, Ivorra S, Paradis L, Aberlenc F, Zango O, et al. 2020. On the necessity of combining ethnobotany and genetics to assess agrobiodiversity and its evolution in crops: A case study on date palms (Phoenix Dactylifera l.) in Siwa Oasis, Egypt. Evolutionary Applications, 13: 1818–1840.
Henri DA, Provencher JF, Bowles E, Taylor JJ, Steel J, Chelick C, et al. 2021. Weaving Indigenous knowledge systems and Western sciences in terrestrial research, monitoring and management in Canada: A protocol for a systematic map. Ecological Solutions and Evidence, 2: e12057.
Henson L, Balkenhol N, Gustas R, Adams M, Walkus J, Housty W, et al. 2021. Convergent geographic patterns between grizzly bear population genetic structure and indigenous language groups in coastal British Columbia, Canada. Ecology and Society, 26(3): 7.
Housty WG, Noson A, Scoville GW, Boulanger J, Jeo RM, Darimont CT, et al. 2014. Grizzly bear monitoring by the Heiltsuk people as a crucible for First Nation conservation practice. Ecology and Society, 19(2): 70.
Huntington H, Callaghan T, Fox S, and Krupnik I. 2004. Matching traditional and scientific observations to detect environmental change: A discussion on arctic terrestrial ecosystems. Ambio, 33: 18–23.
Huntington HP. 2011. Arctic science: The local perspective. Nature, 478: 182–183.
Johnson M. 1992. Lore: Capturing traditional environmental knowledge. Dene cultural Institute and International Development Research Centre, Ottawa, Canada
Jombart T. 2008. Adegenet: A r package for the multivariate analysis of genetic markers. Bioinformatics, 24: 1403–1405.
Kimmerer RW. 2013. Braiding sweetgrass: Indigenous wisdom, scientific knowledge and the teachings of plants. Milkweed Editions.
Lamb CT, Willson R, Richter C, Owens-Beek N, Napoleon J, Muir B, et al. 2022. Indigenous-led conservation: Pathways to recovery for the nearly extirpated Klinse-za mountain caribou. Ecological Applications, 32(5): e2581.
Larsson P, Tibblin P, Koch-Schmidt P, Engstedt O, Nilsson J, Nordahl O, and Forsman A. 2015. Ecology, evolution, and management strategies of northern pike populations in the Baltic Sea. Ambio, 44: 451–461.
Levac L, Mcmurtry L, Stienstra D, Baikie G, Hanson C, and Mucina D. 2018. Learning across indigenous and western knowledge systems and intersectionality: Reconciling social science research approaches. In Unpublished SSHRC Knowledge Synthesis Report). Editor by SSAHR Council. University of Guelph, Government of Canada.
Li H. 2013. Aligning sequence reads, clone sequences and assembly contigs with bwa-mem. arXiv preprint arXiv, 1303: 3997.
Marin K, Coon A, Carson R, Debes PV, and Fraser DJ. 2016. Striking phenotypic variation yet low genetic differentiation in sympatric lake trout (Salvelinus Namaycush). PLoS ONE, 11: e0162325.
Marin K, Coon A, and Fraser DJ. 2017. Traditional ecological knowledge reveals the extent of sympatric lake trout diversity and habitat preferences. Ecology and Society, 22: 20.
Martin M. 2011. Cutadapt removes adapter sequences from high throughput sequencing reads. Embnet. Journal, 17: 10–12.
Mcgregor D. 2004. Coming full circle: Indigenous knowledge, environment, and our future. American Indian Quarterly, 28: 385–410.
Mcgregor D. 2006. Traditional ecological knowledge. Ideas: The Arts and Science Review, 3: 1–6.
Mcgregor D, Restoule J.-P, and Johnston R. 2018. Indigenous research: Theories, practices, and relationships, Canadian Scholars’ Press.
Miller LM, and Senanan W. 2003. A review of northern pike population genetics research and its implications for management. North American Journal of Fisheries Management, 23: 297–306.
Moller H, Berkes F, Lyver POB, and Kislalioglu M. 2004. Combining science and traditional ecological knowledge: Monitoring populations for co-management. Ecology and Society, 9.
Moritz C. 1994. Defining ‘evolutionarily significant units’ for conservation. Trends in Ecology and Evolution, 9: 373–375.
Muller S. 2012. ‘Two ways’: Bringing Indigenous and non-Indigenous knowledges together. Country, Native Title and Ecology, 59–79.
Nunziata S. O, and Weisrock D. W 2018. Estimation of contemporary effective population size and population declines using RAD sequence data. Heredity, 120: 196.
Okanagan Nation Alliance 2021. Ks?kəɬqayxʷntim iʔ siwɬkʷ: We will protect the water. Okanagan Nation Alliance, Westbank, BC.
Pauly D. 1995. Anecdotes and the shifting baseline syndrome of fisheries. Trends in Ecology and Evolution, 10: 430.
Polfus J, Manseau M, Simmons D, Neyelle M, Bayha W, Andrew F, et al. 2016. Łegha´gots’ enete? (learning together): The importance of Indigenous perspectives in the identification of biological variation. Ecology and Society, 21(2): 18.
Polfus JL, Heinemeyer K, and Hebblewhite M. 2014. Comparing traditional ecological knowledge and western science woodland caribou habitat models. The Journal of Wildlife Management, 78: 112–121.
Pulsifer PL, Huntington HP, and Pecl GT. 2014. Introduction: Local and traditional knowledge and data management in the arctic. Polar Geography, 37: 1–4.
Reid AJ, Eckert LE, Lane JF, Young N, Hinch SG, Darimont CT, et al. 2021. “Two-eyed seeing”: An Indigenous framework to transform fisheries research and management. Fish and Fisheries, 22: 243–261.
Riedlinger D, and Berkes F. 2001. Contributions of traditional knowledge to understanding climate change in the Canadian arctic. Polar Record, 37: 315–328.
Rochette NC, and Catchen JM. 2017. Deriving genotypes from rad-seq short-read data using stacks. Nature Protocols, 12: 2640–2659.
Rondeau EB, Minkley DR, Leong JS, Messmer AM, Jantzen JR, Von Schalburg KR, et al. 2014. The genome and linkage map of the northern pike (Esox Lucius): Conserved synteny revealed between the salmonid sister group and the neoteleostei. PLoS ONE, 9: e102089.
Shrimpton JM, and Heath DD. 2003. Census vs. effective population size in chinook salmon: Large-and small-scale environmental perturbation effects. Molecular Ecology, 12: 2571–2583.
Skov C, and Nilsson PA. 2018. Biology and ecology of pike, CRC Press.
Steeves PF. 2021. The Indigenous paleolithic of the western hemisphere, U of Nebraska Press.
Sunde J, Yıldırım Y, Tibblin P, and Forsman A. 2020. Comparing the performance of microsatellites and radseq in population genetic studies: Analysis of data for pike (Esox Lucius) and a synthesis of previous studies. Frontiers in Genetics, 11: 218.
Taylor EB, and Mcphail JD. 2000. Historical contingency and ecological determinism interact to prime speciation in sticklebacks, gasterosteus. Proceedings of the Royal Society B: Biological Sciences, 267: 2375.
Tengö M, Brondizio ES, Elmqvist T, Malmer P, and Spierenburg M. 2014. Connecting diverse knowledge systems for enhanced ecosystem governance: The multiple evidence base approach. Ambio, 43: 579–591.
Tengö M, Hill R, Malmer P, Raymond CM, Spierenburg M, Danielsen F, et al. 2017. Weaving knowledge systems in ipbes, cbd and beyond—lessons learned for sustainability. Current Opinion in Environmental Sustainability, 26: 17–25.
Waples RS, and Gaggiotti O. 2006. What is a population? An empirical evaluation of some genetic methods for identifying the number of gene pools and their degree of connectivity. Molecular Ecology, 15: 1419–1439.
Wilson CC, and Hebert PD. 1998. Phylogeography and postglacial dispersal of lake trout (Salvelinus Namaycush) in North America. Canadian Journal of Fisheries and Aquatic Sciences, 55: 1010–1024.

Supplementary material

Supplementary Material 1

Information & Authors

Information

Published In

cover image FACETS
FACETS
Volume 7Number 1January 2022
Pages: 1214 - 1243
Editor: Nicole L. Klenk

History

Received: 1 May 2021
Accepted: 13 June 2022
Version of record online: 8 September 2022

Data Availability Statement

Genomic data are available on Dryad. Walleye data have previously been published and can be accessed at doi.org/10.5061/dryad.5tb2rbp1z. Lake trout and Pike data generated for this work are available upon reasonable request to the corresponding author.

Key Words

  1. Indigenous knowledge
  2. Western science
  3. fisheries
  4. population monitoring
  5. genomics
  6. life history
  7. practices for weaving knowledge systems

Sections

Subjects

Plain Language Summary

Monitoring fishes with Indigenous ecological knowledge and Western scientific data

Authors

Affiliations

Ella Bowles [email protected]
Concordia University, 7141 Sherbrooke St. West, Montreal, QC H4B 1R6, Canada
Current affiliation: Canadian Wildlife Service, 351 Boulevard St. Joseph, Gatineau, QC J8Y 3Z5, Canada
Hyung-Bae Jeon
Concordia University, 7141 Sherbrooke St. West, Montreal, QC H4B 1R6, Canada
Kia Marin
Concordia University, 7141 Sherbrooke St. West, Montreal, QC H4B 1R6, Canada
Pamela MacLeod
Cree Nation of Mistissini, 187 Main Street, Mistissini, QC G0W 1C0, Canada
Dylan J. Fraser
Concordia University, 7141 Sherbrooke St. West, Montreal, QC H4B 1R6, Canada

Author Contributions

EB and DJF conceived and designed the study.
EB, KM, and PM performed the experiments/collected the data.
EB, H-BJ, KM, and DJF analyzed and interpreted the data.
EB, PM, and DJF contributed resources.
All drafted or revised the manuscript.

Metrics & Citations

Metrics

Other Metrics

Citations

Cite As

Export Citations

If you have the appropriate software installed, you can download article citation data to the citation manager of your choice. Simply select your manager software from the list below and click Download.

There are no citations for this item

View Options

View options

PDF

View PDF

Get Access

Media

Media

Other

Tables

Share Options

Share

Share the article link

Share on social media