Recent and projected climate change–induced expansion of Atlantic halibut in the Northwest Atlantic
Abstract
With the influence of climate change on marine systems expanding, climate adaptation will be fundamental for the future of fisheries management. An exponential increase in Atlantic halibut Hippoglossus hippoglossus landings over the past decade has coincided with warming ocean temperatures. Here, we explore how historical changes in abundance have been linked to changing thermal habitat conditions and project trends with a warming climate under different emissions scenarios. From 1990 to 2018, available thermal habitat increased by 11.6 ± 7.35% and growing degree days have increased by 13.5 ± 7.86 °C·days across the region. With warming, the probability of occurrence is projected to increase up to 20.5% in Canada by 2085 under RCP 8.5 for Atlantic halibut. Our results suggest that shifting patterns of halibut distribution and abundance are linked to thermal conditions and that continued warming will likely continue to enhance habitat conditions, leading to increased abundance in the Canadian range. Collectively, these results illustrate the influence of shifting environmental conditions on population dynamics and emphasize the importance of adaptive management practices in a dynamic future climate.
Introduction
Global ocean temperatures have been rising for decades, including in the Northwest Atlantic, where temperature increases have been observed throughout the water column (Kavanaugh et al. 2017; Rheuban et al. 2017). The biological response to these changing conditions on marine populations can be profound, altering physiology, phenology, species interactions, and the availability of suitable habitat (Doney et al. 2012; Miller et al. 2018; Maxwell et al. 2019), which may, in turn, influence the abundance, distribution, and overall success of marine species (Shackell et al. 2014; Stortini et al. 2015; Kavanaugh et al. 2017). Particularly, warming temperatures can lead to geographical shifts in suitable habitat and corresponding shifts in marine taxa distributions (Shackell et al. 2014; Hale et al. 2017; Kavanaugh et al. 2017; Rheuban et al. 2017; Pinsky et al. 2018; Greenan et al. 2019; Timbs et al. 2019). Changes in climate can induce habitat loss, decrease fecundity, and increase mortality, resulting in an overall decline in population abundance (e.g., Maxwell et al. 2019). Generally, these changes have been associated with overfishing (Pauly et al. 2002). The influence of climate change and overfishing on abundance and stock structure has been well studied for species experiencing abundance declines (Ciannelli et al. 2013; Reuchlin-Hugenholtz et al. 2015, 2016), whereas the stock structure of species experiencing abundance increases, including species recently recovered from known historically low abundances, has been much less examined.
In the Northwest Atlantic, Atlantic halibut Hippoglossus hippoglossus (Linnaeus, 1758) has experienced a monotonic increase in biomass and regional landings since the early 2000s in Canadian waters (Fig. 1; Shackell et al. 2022). Atlantic halibut is the largest groundfish in the Atlantic Ocean, can grow to more than 2.5 m long with weights exceeding 300 kg, and can reach ages up to 50 years (Cargnelli et al. 1999; Armsworthy et al. 2014). Atlantic halibut occupy a broad geographic range in the Northwest Atlantic, from the coast of Virginia in the south to the waters off Disko Bay, Greenland, in the north. It occupies a temperature range from −1.5 to 15 °C and depths from 20 to 1640 m (Cargnelli et al. 1999; Armsworthy et al. 2014; Murphy et al. 2017). Though Atlantic halibut occupies a wide geographic range, its distribution is not uniform (Shackell et al. 2022). Juvenile Atlantic halibut, in particular, forms persistent aggregations (Boudreau et al. 2017). The extent of juvenile Atlantic halibut habitat has been shown to be proportional to adult landings within Northwest Atlantic Fishery Organization (NAFO) management divisions (French et al. 2018).
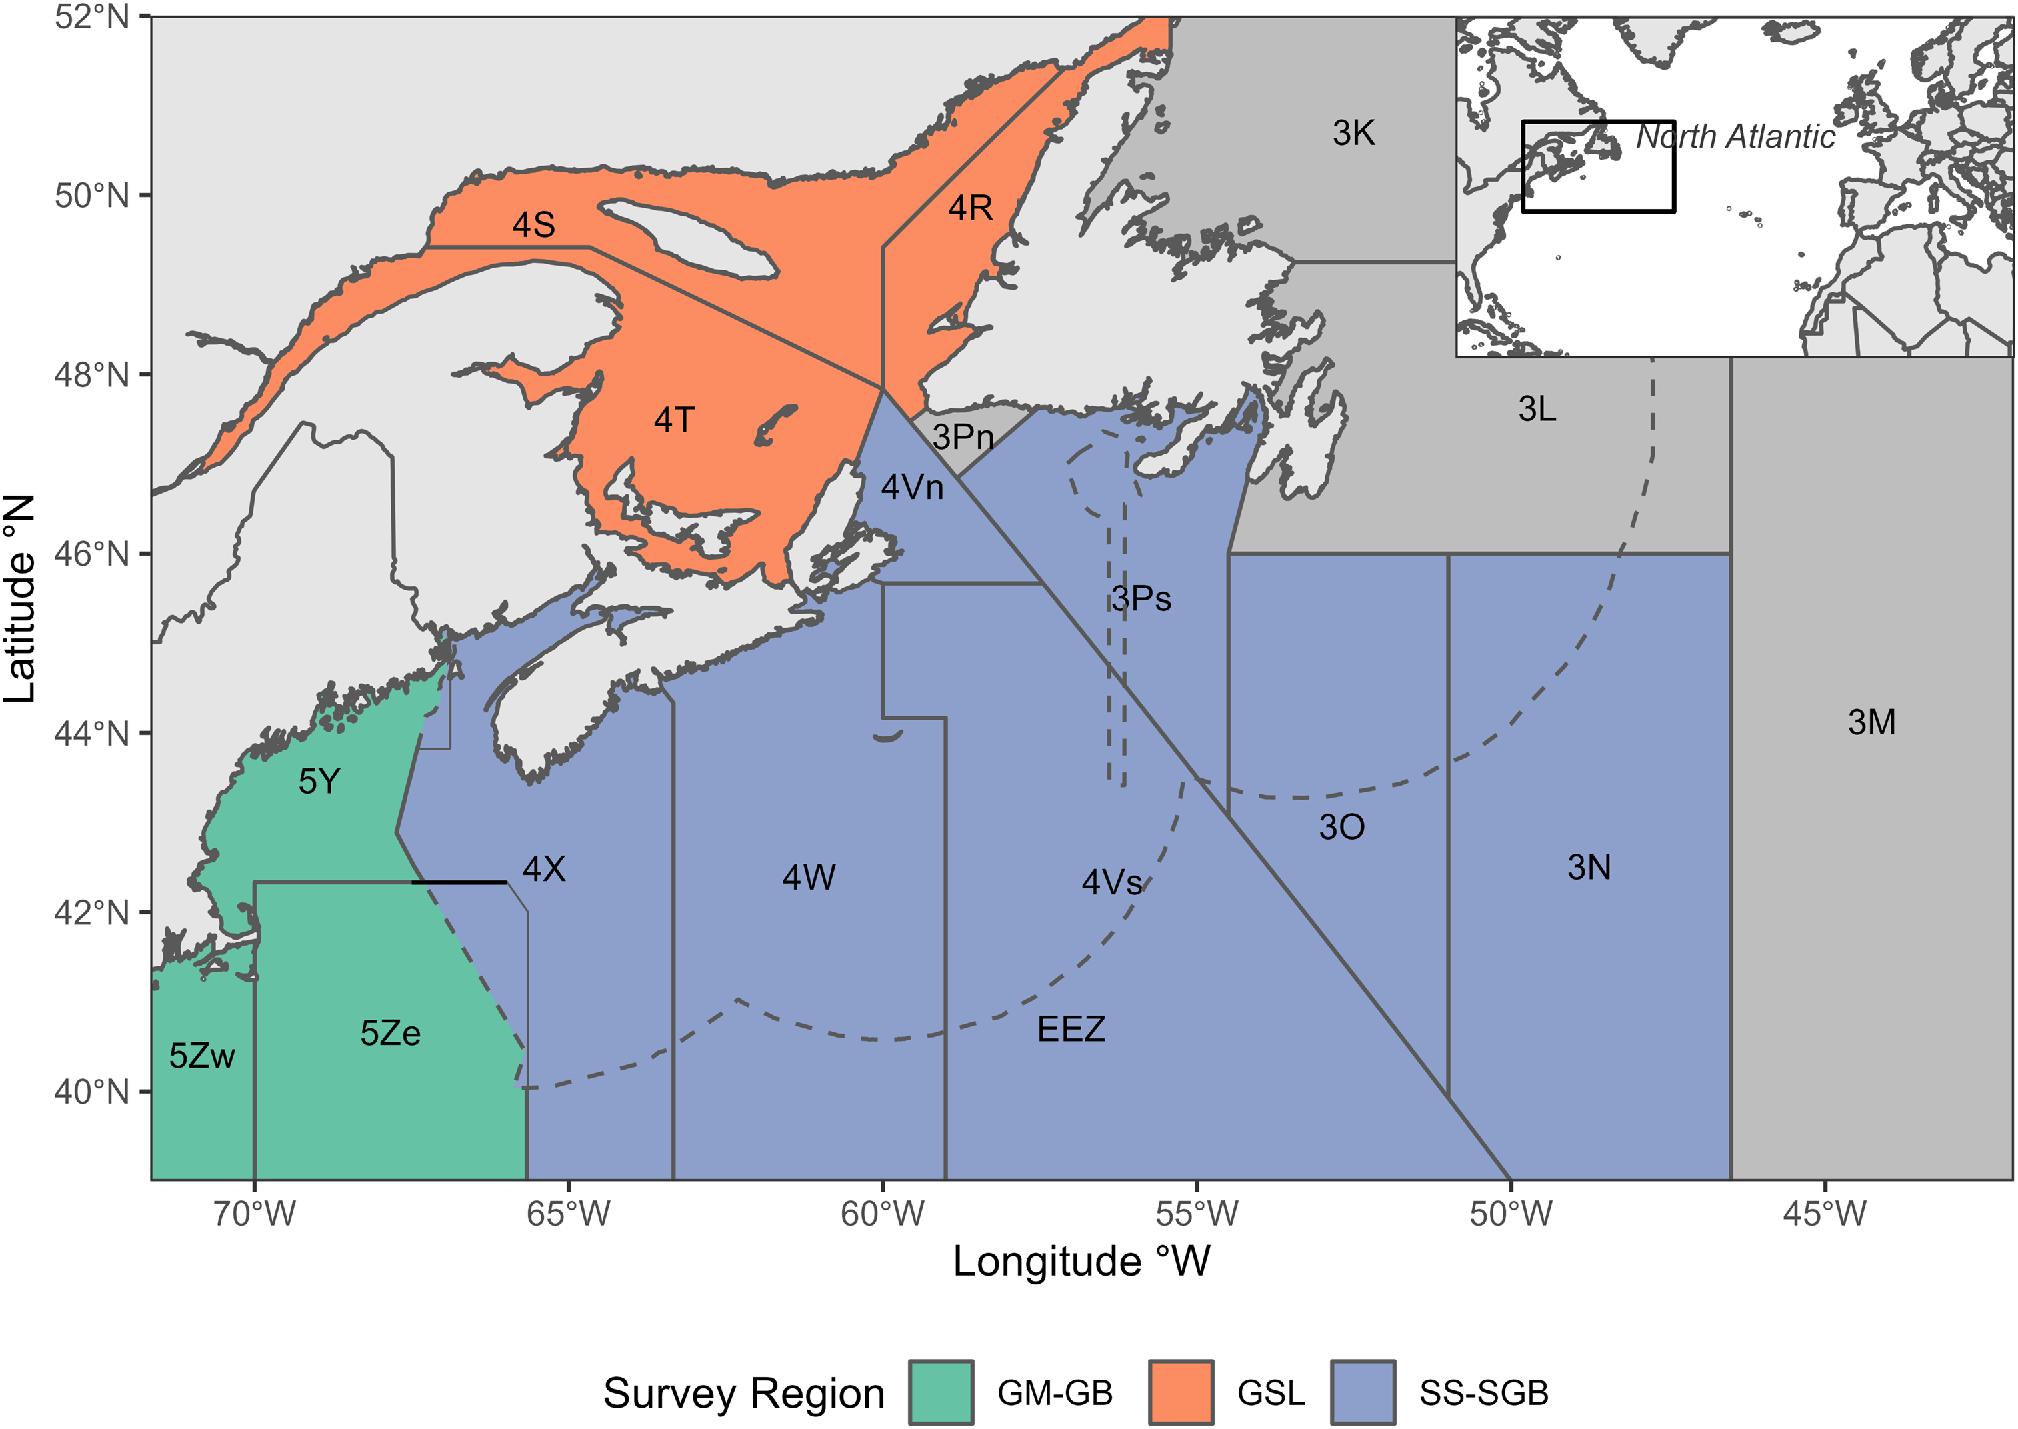
Prior to the 1830s, Atlantic halibut was routinely discarded by fishers as a nuisance catch because its thick flesh made salt preservation unreliable (Grasso 2008). As the demand for fresh fish grew in the 1840s, the Atlantic halibut fishery expanded in U.S. waters, leading to a collapse by 1880 (Moore 1999; Kanwit 2007; Grasso 2008). Atlantic halibut was not as heavily fished in Canadian waters, although there were declines prior to the establishment of the Exclusive Economic Zone in 1977, after which Atlantic halibut began to recover. In 1988, Canada implemented regulations on the Canadian Atlantic halibut fishery (den Heyer et al. 2013; DFO 2015a). Despite the establishment of regulatory measures, Atlantic halibut and many other groundfish species experienced a period of decline in the early 1990s, leading to stock collapses and fishing moratoria in some areas (Bundy et al. 2019; Shackell et al. 2021). At present, most groundfish species have yet to fully recover (Pedersen et al. 2017; Shackell et al. 2021). However, Atlantic halibut is an exception, and has recovered to levels greater than those prior to its most recent collapse. This increased abundance is reflected in increased landings in recent years (Cox et al. 2016; Trzcinski and Bowen 2016; DFO 2018). Currently, Atlantic halibut is one of the most commercially valuable groundfish species in the Northwest Atlantic (DFO 2019). Atlantic halibut is assessed and managed as three stocks in the U.S. and Canada. These stocks include two in Canada, the Gulf of St. Lawrence corresponding to NAFO Divisions 4R, 4S, and 4T (DFO 2015b) and the Scotian Shelf-Southern Grand Banks corresponding to NAFO Divisions 3N, 3O, 3Ps, 4V, 4W, 4X, and 5Zw (DFO 2015a), and one in the U.S., the Gulf of Maine-Georges Bank stock corresponding to NAFO Divisions 5Y and 5Ze (Fig. 1).
Fig. 1.

The current economic importance of Atlantic halibut has led to increased research efforts, especially with respect to halibut spatial ecology. Through a combination of genomic studies, migration patterns observed from electronic and conventional tagging, and geographic variation of life history traits, the emerging population structure shows two subtly genetically distinct populations (Kess et al. 2021), within which there are subpopulations comprised of multiple migratory contingents (Shackell et al. 2022). It is unknown how climate change will influence the ecology or biology of Atlantic halibut or how either will influence stock dynamics in the study region. Temperature is a key variable constraining the available habitat of juvenile Atlantic halibut (French et al. 2018) and has also been linked to variation in growth and maturity schedules across the Northwest Atlantic (Shackell et al. 2019). The clear links between temperature and the physiology and ecology of Atlantic halibut motivate an exploration of the relationship between recent demographic changes in halibut and warming in the Northwest Atlantic (Brickman et al. 2021). The characterization of the historical spatial-temporal relationship between temperature, habitat conditions, and abundance will provide a foundation to predict how Atlantic halibut stocks will respond to continued warming, providing critical information to fisheries’ managers to anticipate how the managed stocks of Atlantic halibut could respond to continued warming in the Northwest Atlantic.
Species distribution models (SDMs) are widely used, powerful, and practical for understanding species-specific niches, predicting abundances, and/or mapping distributions (Robinson et al. 2017). The correlative SDM approach models environmental variables that correlate with abundance or presence/absence data. Generalized additive models (GAMs) are increasingly used to model species distributions because they can capture nuanced, nonlinear relationships between environmental covariates (e.g., temperature, depth, and space) and the presence of a target taxon (Murase et al. 2009; Grüss et al. 2018). GAMs are often used to identify optimal environmental conditions and/or to predict the probability of the presence or abundance of a taxon based on a set of observed conditions (e.g., Wood 2006). GAMs are particularly well suited to model novel environmental conditions associated with climate change (Chaudhary et al. 2021; Champion et al. 2022).
Here we explore the influence of climate change on the distribution of Atlantic halibut in the Northwest Atlantic. We first looked retrospectively, evaluating whether recent changes in Atlantic halibut distribution in the Northwest Atlantic were related to contemporaneous spatial-temporal trends in thermal habitat availability and growing degree days (GDDs). GDD is a measure of thermal time, or the cumulative temperature over a given period (Neuheimer and MacKenzie 2014). We then build on these functional relationships and predict, using a correlative SDM approach, the distribution of Atlantic halibut in the Northwest Atlantic based on a regionally downscaled oceanographic model and climate forecasts modelled under two emission scenarios: representative concentration pathway (RCP) 4.5 (reduced emissions) and RCP 8.5 (high emissions).
Methods
Study area
The domain for this study encompasses most of the area occupied by Atlantic halibut in the Northwest Atlantic. This area ranges, from north to south, from Labrador to Maryland, and from the inner Gulf of St. Lawrence to the edge of the Flemish cap (total area range covers about 38–52° N, and about 40–70° W) encompassing three spatial management units in Canadian (Gulf of St. Lawrence and the Scotian Shelf-Southern Grand Banks) and U.S. waters (Gulf of Maine–Georges Bank) and the corresponding NAFO Divisions (Fig. 2).
Fig. 2.
Survey data
In Canada, the Fisheries and Oceans Canada (DFO) Research Vessel (RV) trawl surveys have been conducted annually since the 1970s (Ricard and Shackell 2013). Random stratified surveys are conducted within spatially distinct regions, with vessel timing and gear type varying depending on management needs. For Atlantic halibut, these surveys provide information on abundance and recruitment, which are used for stock assessment (DFO 2015b; Cox et al. 2016; Trzcinski and Bowen 2016). Data from regional surveys in the Scotian Shelf, Newfoundland and Southern Grand Banks, the Northern Gulf of St. Lawrence, and the Southern Gulf of St. Lawrence were used to model the distribution of Atlantic halibut. Atlantic halibut captured during these trawl surveys were predominantly smaller individuals (30–80 cm).
Trawl surveys conducted in U.S. waters by the National Oceanic and Atmospheric Administration (NOAA) and National Marine Fisheries Service (NMFS) provide a similar index to the Canadian surveys of abundance and recruitment (Sigourney et al. 2006; Col and Legault 2009). The gear type for both the fall and spring surveys changed over the time series. Various conversions have been used to correct abundance indices for groundfish due to gear changes; however, conversion factors are not available for Atlantic halibut. Most Atlantic halibut caught in the U.S. research bottom trawl surveys from 1977 to 2000 were <80 cm based on length–frequency distributions (Sigourney et al. 2006). Atlantic halibut under 80 cm in Canadian and U.S. waters are assumed to be juveniles based on known length at maturity relationships (Sigourney et al. 2006; Shackell et al. 2019). Combined data from DFO and NOAA surveys spanned from 1965 to 2019 and included variables such as latitude, longitude, temperature, depth, region, year, abundance, biomass, and weight (Table 1).
All groundfish trawl survey data were curated, and variables were modified to form a constant naming convention between surveys. A binomial presence/absence approach was adopted for SDMs to make the data more comparable, given the catchability differences inherent among surveys with different vessels, gear types, and seasons. Models were assumed to represent juvenile Atlantic halibut because most fish in both the Canadian and U.S. surveys were <80 cm long.
High-resolution ocean model
Monthly high-resolution (1/12°) bottom temperature and depth predictions were obtained by the BIO North Atlantic Model (BNAM) for the study domain from 1990 to 2018 (Wang et al. 2018). Outputs from this regionally downscaled model have previously been applied to examine relationships between the environment and physiological and/or ecological processes (Beazley et al. 2018; Stanley et al. 2018; Lowen et al. 2019; Shackell et al. 2019).
Thermal habitat and growing degree days
To characterize changes in the thermal habitat suitability of Atlantic halibut in the study range, we opted for thermal averages and GDDs. This decision was based on the availability of high-quality temperature data and the recognized impact of temperature on the duration and intensity of the growing season. Thermal averages and GDD have widespread use, physiological relevance, data availability, and comparability across studies, making them suitable indicators for this purpose. Other indicators, such as minimum and maximum temperatures or thermal variability, are not as commonly used and may have limited utility for Atlantic halibut due to its broad thermal tolerance.
For thermal averages, a niche-threshold approach was applied, whereby changes in the available habitat were documented through time based on thermal and depth ranges. Here, the thermal habitat range of Atlantic halibut was derived using conservative percentiles of 0.10 and 0.90 for bottom temperatures in halibut occurrence data. The depth range was calculated using a slightly more relaxed set of percentiles of 0.5 and 0.95, as depth remains constant over time and to account for the steeper slope and greater depths found off the coast of Newfoundland. Using these niche-based thresholds, ratios describing the extent of depth-constrained thermal habitat relative to the total area within each NAFO Division (expressed as a percentage) were evaluated using annual averages, longitudinally from 1990 to 2018. A linear model (LM) was applied to evaluate temporal trends, assuming a Gaussian error distribution, where % thermal habitat was modelled as a function of the interaction between year and NAFO Division. The mean slope and confidence intervals were extracted from the LM per NAFO Division.
GDDs are the number of days (per year) multiplied by a daily temperature above a threshold (°C·day). The concept of GDD was derived in agriculture to reflect that growth rates depend on temperature and the period above a critical threshold temperature (Neuheimer and Taggart 2007; Neuheimer et al. 2008; Neuheimer and Grønkjær 2012) and can be used as an index of growing season length. For this analysis, the lower bound of the thermal range (2.46–9.25 °C) was used as the threshold, and depth (36–415 m) limits were applied as described above. Projections available from BNAM were aggregated monthly. The number of days in each month was multiplied by the average bottom temperature at each grid cell for months with a temperature above the thermal threshold; otherwise, values were set to zero. This returned the monthly GDD for each grid cell, which was then averaged over NAFO Divisions by month. To correct for the size of each NAFO Division, the product of the monthly average GDD and the fraction of grid cells above the threshold of 2.46 °C over the total number of grid cells in the corresponding NAFO Division was used to calculate the scaled monthly GDD:where sGDD represents the scaled monthly GDD for a respective division (d) and month (m) and CellsGDD represents the number of cells that are above the threshold of 2.46 °C. The scaled monthly GDD were then summed for each year to obtain the GDD for each region by year. Temporal trends of GDD were evaluated using a LM, assuming a Gaussian error distribution, for each NAFO Division over a 28-year period from 1990 to 2018. The mean slope and confidence intervals were extracted from the LM per NAFO Division for comparison.
LMs were used to estimate the rate of change of percentage thermal habitat and GDD for each NAFO Division. The response variable, thermal habitat, was estimated using year as a covariate and NAFO Division as a factorial grouping variable. Modelling began with a full model, and if the interaction term was significant, differences in the covariate (year) among NAFO Divisions were tested. LMs provided the difference between NAFO Divisions relative to division 3M, which was chosen as a point of reference because its rate of change was closest to zero in all models. The same procedure was followed to extract the slope coefficients and p-values for GDD. Net directional change was assessed as NAFO Divisions, which had confidence intervals excluding zero.
Species distribution modelling
We chose species distribution modelling to represent the realized niche of Atlantic halibut, in terms of temperature, depth, and space combined. This approach is likely more restrictive than a potential niche approach. Binomial GAMs were used to associate spatial information and environmental covariates with the presence of Atlantic halibut. GAMs included two continuous environmental covariates, bottom depth (m) and bottom temperature (°C), chosen as the primary environmental determinates of habitat suitability for Atlantic halibut (French et al. 2018); two categorical variables, season to account for differences in bottom temperatures for surveys undertaken at different times of the year, and region to account for other differences such as catchability among regions associated with variation in bottom type, vessel, and gear type; and two geographical covariates, longitude and latitude to account for spatial autocorrelation that would not otherwise be resolved by the regional covariates. Environmental covariates were used from the DFO RV survey trawl data or NOAA NMFS surveys, where any survey set (trawl) with observed Atlantic halibut abundance was categorized as a presence and any set without any observed abundance as an absence. The SDM model approach was structured based on the conventions outlined in Zurell et al. (2020) and Pedersen et al. (2019), including model selection, model diagnostics, and assumptions for SDMs. Models were fit using the mgcv package (Wood 2011) in R (R Core Team 2021), following model statements in mgcv such as:where p is the probability of occurrence when given binomial response data, g is the link function (logit link) between p and each additive predictor, s is a thin-plate regression spline fitted to a given predictor, and te is a tensor product smooth fitted to the interaction between longitude and latitude that accounts for the spherical distance of longitude units because they scale differently depending on latitude, meaning that isotropy is not an appropriate assumption for this smooth (Wood 2006). The “by” argument specifies the group-specific smoother for the covariate.
The number of bases (k) for each smooth function was reviewed for each covariate, and their default values were retained with k = 25 for latitude and longitude, 10 for temperature and 10 for depth as any less would result in clear underfitting. In mgcv, the argument method = “REML” (restricted maximum likelihood) was used to penalize the model for being too wiggly, which helps to reduce the likelihood of overfitting (Wood 2017).
GAM evaluation and validation
The presence of concurvity in the SDM was investigated using functions within the mgcv package. Additionally, receiver operator characteristic (ROC) curve cross-validation methods were applied, using several data formulations to evaluate model performance. First, k-fold cross-validation was done using 10 randomly separated data “folds” of the full dataset, where 10% of the data was held for validation. Second, a cross-validation using a “past and present” method was done, where the model was trained based on data from a historical period (1970–1999) and tested against data from a more contemporary period (2000–2018). Finally, hindcast monthly BNAM temperature and depth were extracted for each observation and used in place of the original temperature and depth readings to fit the model, and the trained model was then tested against the original data. Area under the curve (AUC) values of 0.5 indicated a model is incapable of predicting any better than random chance, while an AUC of 1 indicated a perfect ability to predict presence or absence. AUC values less than 0.7 were considered to have poor discrimination, whereas values from 0.7 to 0.9 indicate reasonably accurate discrimination, and values above 0.9 indicate exceptionally good discrimination (Swets 1988).
Model selection was conducted based on evaluating which model had the optimal (best) balance between the greatest explanatory predictive power and the fewest necessary covariates. The full model was compared against reduced models using AUC values, AIC, and deviance explained. In fitting GAMs, the most important consideration is to ensure that the model is not overfitted to the data; otherwise, it may be unreliable for predictions. To avoid this issue, the number of basis functions for each smooth was assessed for fit through comparison to prior knowledge about Atlantic halibut distribution, with the assumption that enough basis functions should be allowed to represent the true relationship but not too few so that the relationship is restricted (Wood 2006).
Species distribution projections
The final SDM was used to predict the probability of occurrence in the present climate conditions (1990–2015) and for future climate condition projections from the BNAM model. Future projections were evaluated for two periods, “near future” (2046–2065) and “far future” (2066–2085) and two emissions scenarios, RCP 4.5 and RCP 8.5, representing reduced and high-emission scenarios, respectively. The percentage change in probability of occurrence was calculated from the current and future projections for each scenario. The percentage change in probability of occurrence was then mapped to show the change in probability of occurrence spatially and temporally for each future period and RCP scenario. The percentage change in probability of occurrence was then compared against the initial probability of occurrence under the present climate scenario to visualize the predicted change of Atlantic halibut distributions across NAFO Divisions. The average percentage change in probability of occurrence was calculated for various areas for comparison (NAFO Divisions, management regions, north, south, and the full domain).
All analyses were conducted using R (R Core Team 2021). General data manipulation was accomplished using dplyr (Wickham et al. 2019), plotting using ggplot2 (Wickham 2016), and spatial analyses using R libraries, sf (Pebesma 2018), and raster (Hijmans 2019).
Results
Thermal habitat
The annual percentage change in available thermal habitat of Atlantic halibut, from 1990 to 2018 and between NAFO Divisions, ranged from −0.21%/year to 0.51%/year (Fig. 3a). In most NAFO Divisions (4W, 4Vs, 4Vn, 4R, 3Ps, 3Pn, 3O, and 3N), the percentage of available thermal habitat increased over time with an average percentage change of 0.14 ± 0.09%/year (Fig. 3a). The western shore of Newfoundland showed the largest increase in available thermal habitat, with NAFO Division 3Pn increasing 0.51%/year and division 4R increasing 0.50%/year. The net directional change in available thermal habitat was undetectable in NAFO Divisions 4T, 4S, and 3L; however, the relatively high variation of available thermal habitat may reflect high habitat heterogeneity within these divisions. Within NAFO Divisions with no net directional change, available thermal habitat in division 4S has increased since 1990 and decreased in divisions 4T and 3L. There was no change in available thermal habitat in the most southerly divisions (5Zwe, 5Ze, 5Y, 4X, 4W, and 3M), and a decline in division 3K. Thermal habitat increased by over 40% in NAFO Division 3N (Fig. 4a). Most NAFO Divisions exhibited positive percentage changes in thermal habitat, except divisions 3K, 3L, and 4T, which exhibited negative percentage changes (Fig. 4a). Additionally, the southernmost regions, NAFO Divisions 4X, 5Y, 5Ze, and 5Zw, were predicted to experience little to no change in the percentage of thermal habitat (Fig. 4a).
Fig. 3.
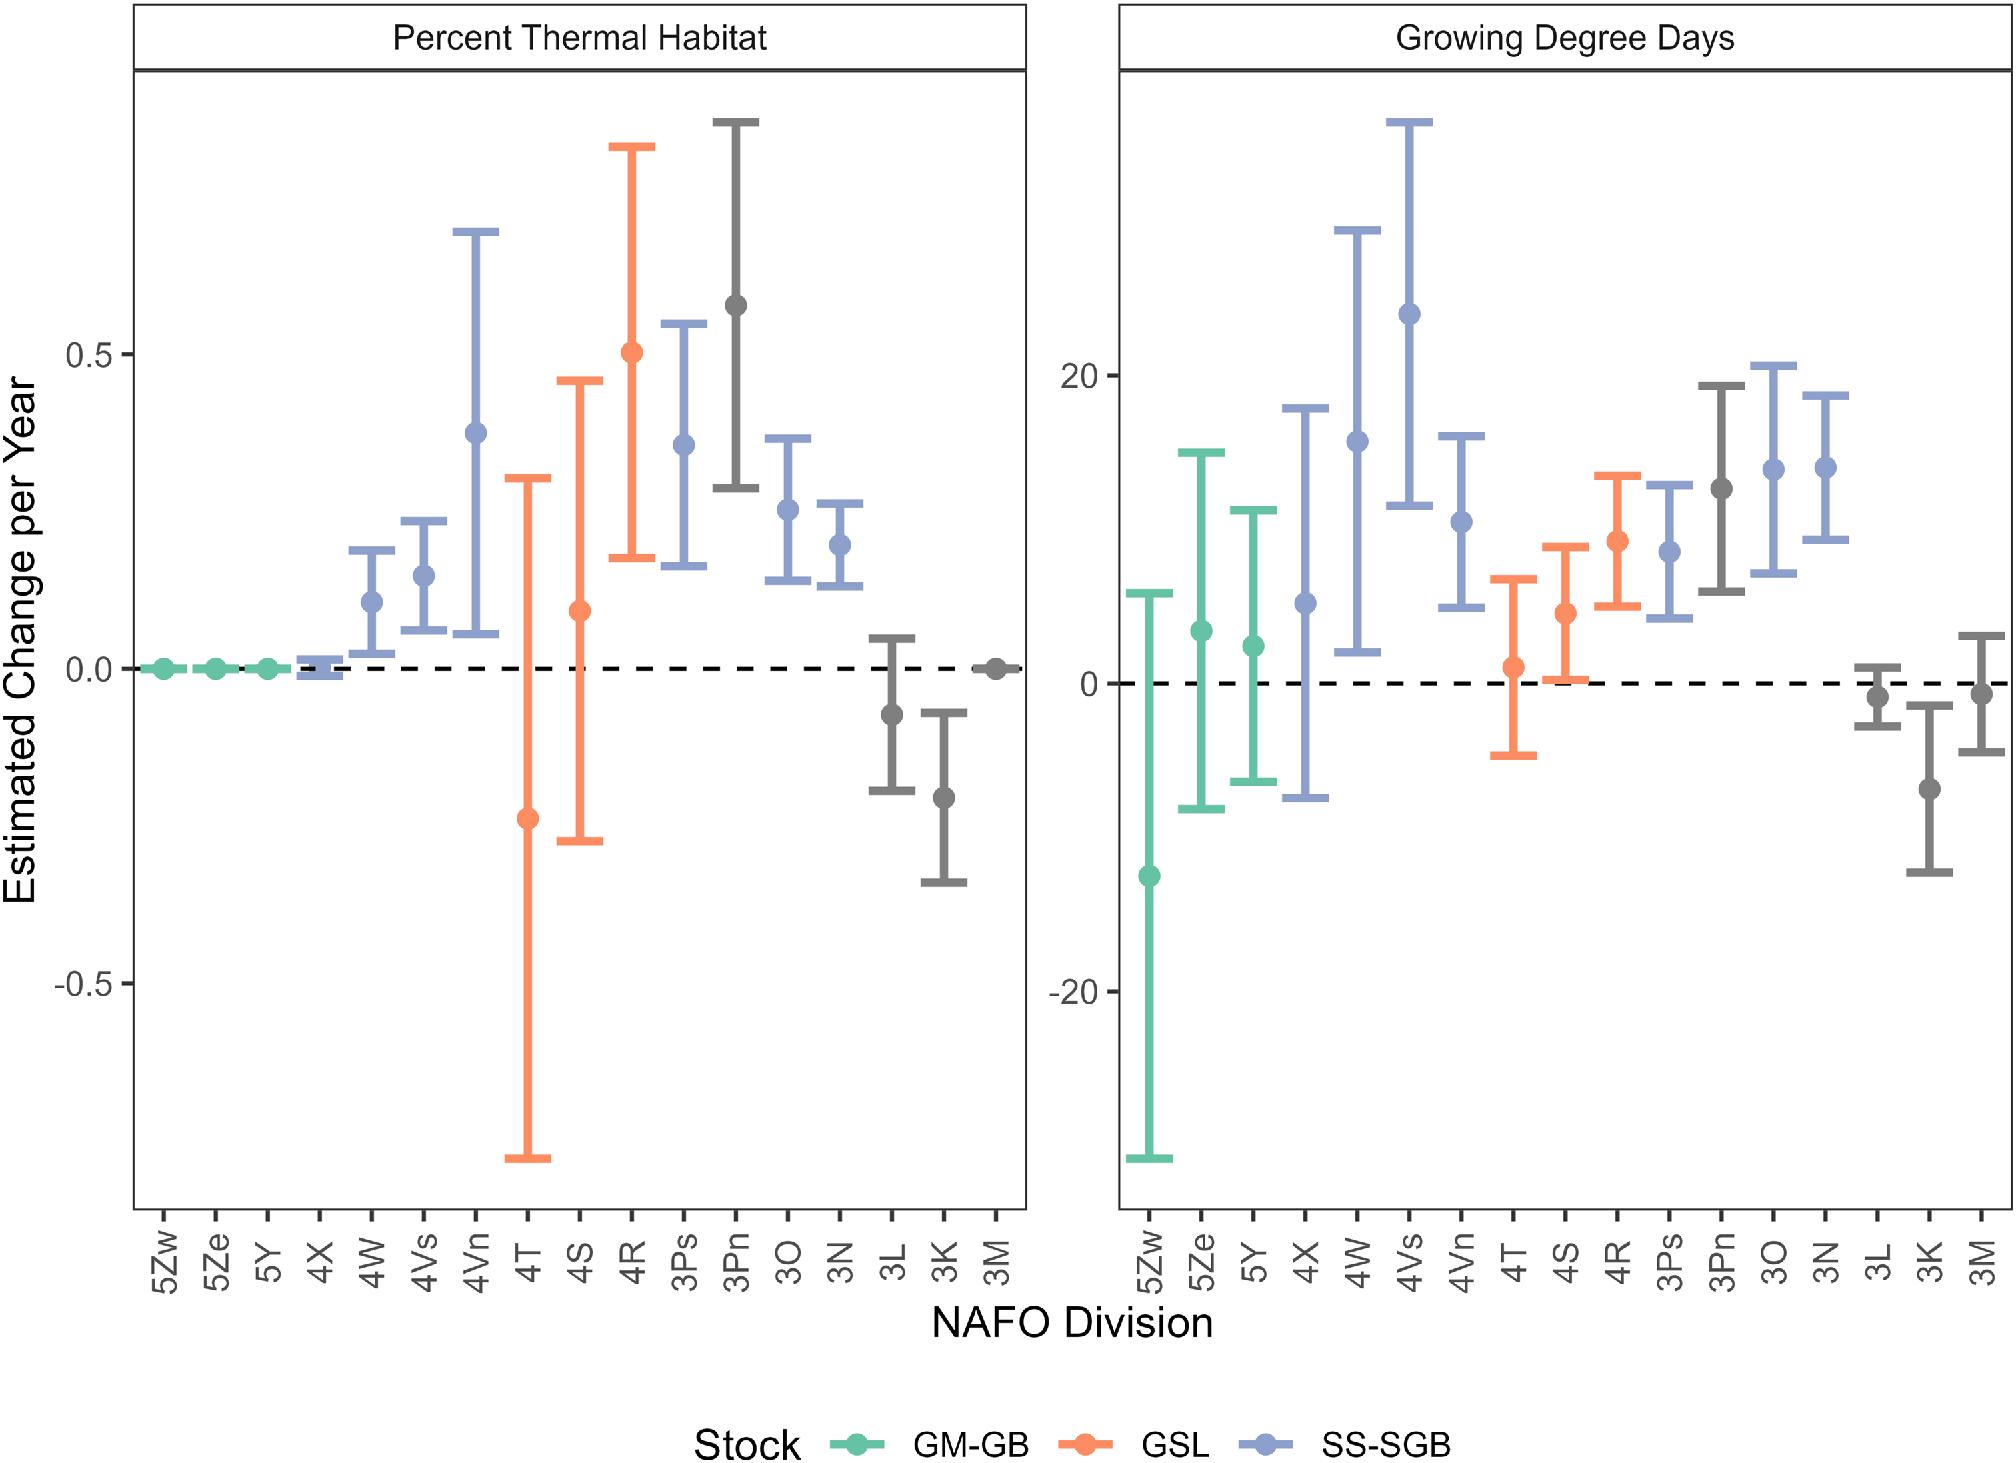
Fig. 4.

Growing degree days
The annual rate of change in GDD among NAFO Divisions ranged from −12.5 to 24.0 °C·days between geographic regions from 1990 to 2018, averaging 6.1 ± 3.8 °C·days. In most NAFO Divisions (4W, 4Vs, 4Vn, 4S, 4R, 3Ps, 3Pn, 3O, and 3N), the net directional rate of change for GDD was positive from 1990 to 2018 (Fig. 3b). The largest increases were observed in NAFO Division 4Vs increasing by 24.0 °C·days and division 4W increasing by 15.7 °C·days. The net directional annual rate of change in GDD was undetectable in the most southerly NAFO divisions (5Zw, 5Ze, 5Y, and 4X), and northerly divisions (3L, 3M, and 4T). As with available thermal habitat, the variation of GDD may reflect relatively high habitat heterogeneity within these divisions. For NAFO Divisions with no net directional change, the average annual rate of change in GDD declined in divisions 5Zw, 3L, and 3M, and increased in divisions 5Ze, 5Y, 4X, and 4T. Only NAFO Division 3K showed a decline in the net directional annual rate of change in GDD. When considered jointly, there was an increase in available thermal habitat and GDD in NAFO Divisions 4W, 4Vs, 4Vn, 4S, 4R, 3Ps, 3Pn, 3O, and 3N, representing a sizable portion of the domain (Fig. 3).
Similar to observations of changes in thermal habitat, the GDD estimated for the northern most region of NAFO Divisions 3L and 3M had overall negligible changes and a slight decrease in the average GDD over time because these areas have not warmed as much as most bottom temperatures were below the 2.46 °C threshold. The greatest increase from 2004 to 2018 in both average available thermal habitat and average GDD occured where their corresponding average values from 1990 to 2003 were relatively lower (Fig. 4b). GDD increased by over 38% in NAFO Divisions 3N, 3O, and 4Vs. Most other areas exhibited positive percentage changes in GDD, except NAFO Division 5Zw in the south and divisions 3K and 3L in the north. NAFO Division 3K experienced a negative rate of change in both thermal habitat and GDD.
Species distribution modelling
Based on GAM model results, the thermal range for Atlantic halibut was between 2.46 °C and 9.25 °C, consistent with prior estimates (Shackell et al. 2016, 2019; French et al. 2018). Atlantic halibut were predicted to be predominantly present at depths <250 m. Longitude and latitude were most important in predicting the occurrence of Atlantic halibut, followed by temperature, depth, and region, respectively. In all three methods of model cross-validation, the AUC value was greater than 0.8, indicating the model had reasonably accurate discrimination (Swets 1988)). The ROC k-fold cross-validation had an average AUC value of 0.85 averaged across all tests. The past–present cross-validation approach yielded an AUC value of 0.83, and the hindcast covariate extraction cross-validation yielded an AUC value of 0.84, surpassing the minimum recommended AUC value of 0.7 for binomial classifiers (Swets 1988). Irrespective of the cross-validation method applied, model fits were good, and the predicted values were considerably better than random. Overall, the deviance explained was 22.3%. There was some concurvity present in the model; however, this is nearly unavoidable with the inclusion of spatial smooths in the model along with other covariates that exist smoothly in space; regardless, results may be reliable even with the presence of concurvity (Wood 2006). Concurvity was not an issue between temperature and depth smoothers, but there was a weak correlation between temperature and depth, not strong enough, though, to exclude either from models.
Current spatial distribution and projected change
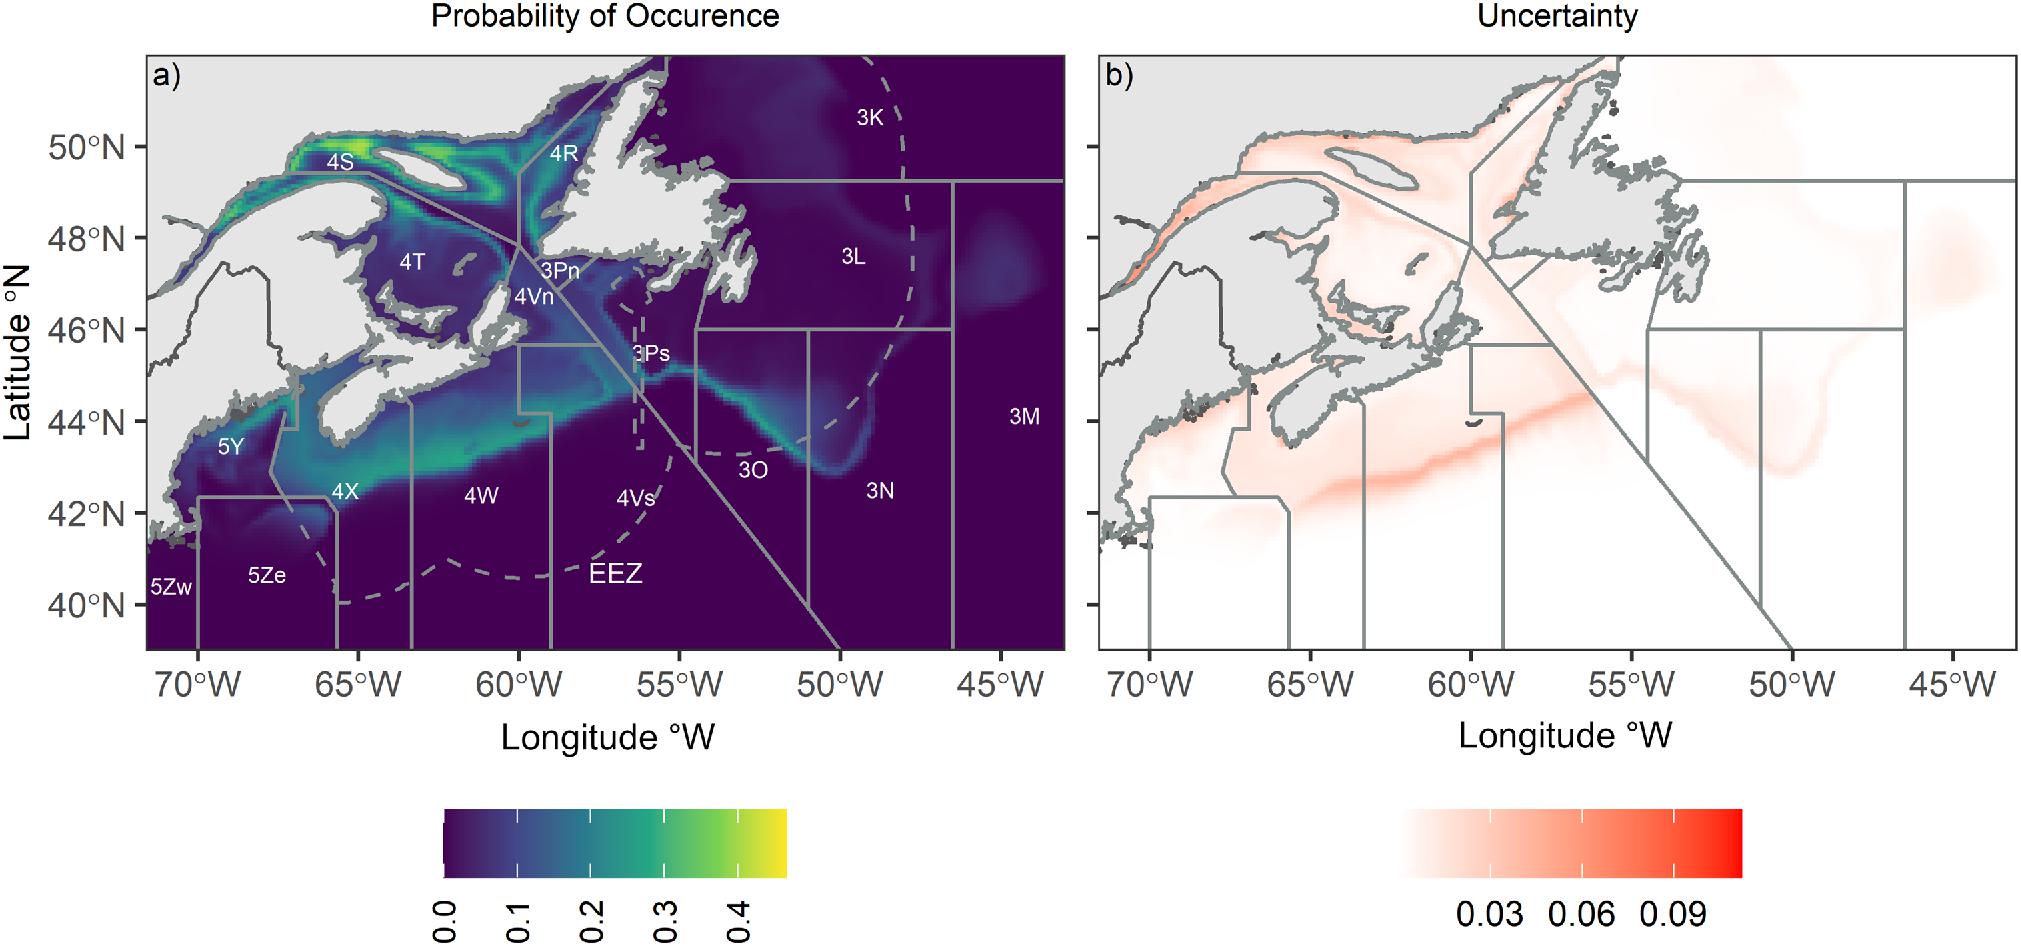
Based on 86,173 observations over 54 years outlining Atlantic halibut distribution, an SDM was developed to predict the probability of Atlantic halibut occurrence across its range. Leveraging projections of contemporary and future environmental conditions, spatial-temporal trends in habitat suitability were further characterized. The BNAM bottom temperature from 1990 to 2015 was used to predict Atlantic halibut probability of occurrence. The SDM predicted the current probability of Atlantic halibut occurrence was highest over the Scotian Shelf (NAFO Divisions 4X and 4W) and in the northern Gulf of St. Lawrence (NAFO Divisions 4S and 4R; Fig. 5). The highest probability of occurrence reached 0.47 in the northern Gulf of St. Lawrence (NAFO Division 4S). Given the SDM predictions were similar to the current understanding of Atlantic halibut distribution (French et al. 2018), they were used with future temperature projections from BNAM for the near- and far-future periods, and with RCP scenarios RCP 4.5 and RCP 8.5, resulting in four future climate scenarios.
Fig. 5.
The projected warming scenarios predicted an overall increase in probability of occurrence for the near- and far-future projection periods and for both climate scenarios (Fig. 6). The SDM predicted an increase in the probability of occurrence in both northern Nova Scotia and the Gulf of St. Lawrence, whereas the areas in the southern part of the study region (the western Scotian Shelf and the U.S. waters) were predicted to remain the same. When examined by NAFO Division, probabilities of occurrence in the southern Gulf of St. Lawrence and Southern Grand Banks (NAFO Divisions 4T, 3N, and 3L) were predicted to increase most by up to 38.9%. All NAFO Divisions except for 5Y, 5Ze, 5Zw, and 3Pn were predicted to increase in future scenarios (Figs. 6 and 7).
Fig. 6.
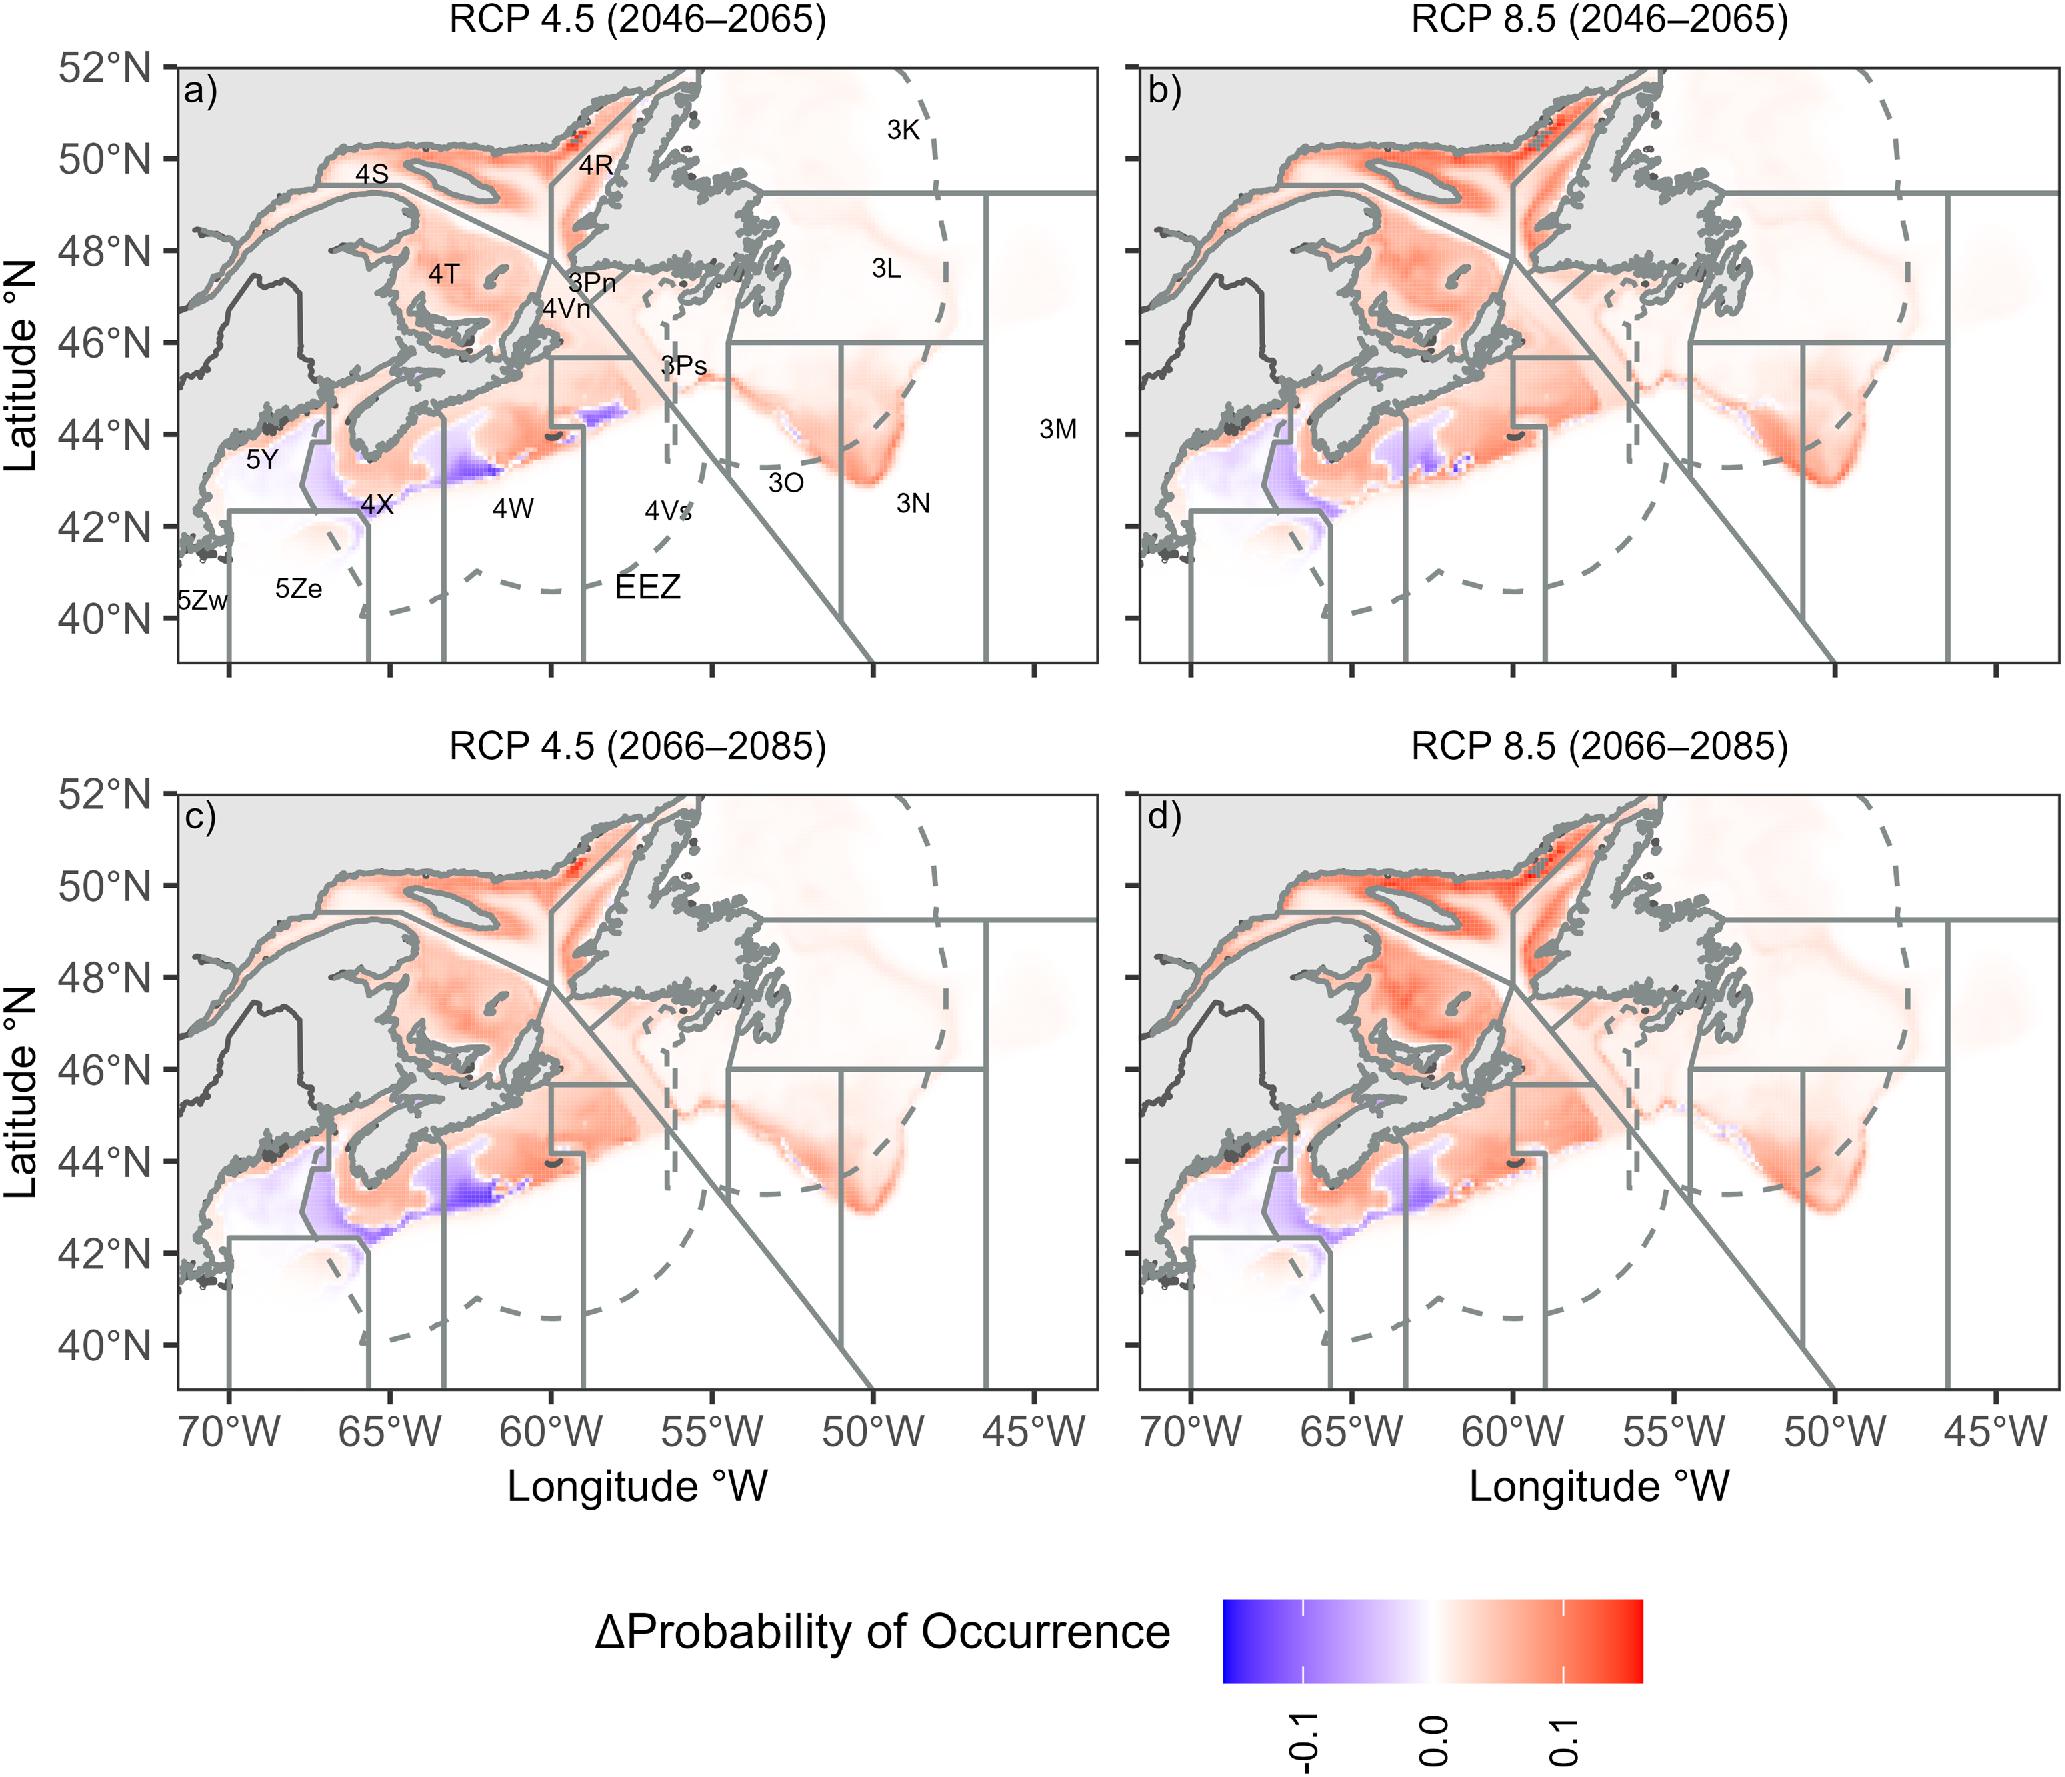
Fig. 7.

The percentage change in probability of occurrence varied between future scenarios, with larger percentage changes associated with RCP 8.5 (Fig. 7). RCP 4.5 predicted an increase in the probability of occurrence of 11.1% in the near future and 12.3% in the far future, whereas RCP 8.5 predicted a near future increase of 14.6% and a far future increase of 17.5%, both higher than RCP 4.5. The overall average percentage change in probability was 12.9% in the near future and 14.9% in the far future. The average percentage change in probability of occurrence across all future scenarios for each management region was 2.4% for the Gulf of Maine and Georges Bank, 21.7% for the Gulf of St. Lawrence, 13.9% for the Scotian Shelf and Southern Grand Banks, and 16.7% for other areas including NAFO Divisions 3K, 3L, 3M, and 3Pn. The percentage increase in probability of occurrence in the high emission scenario was greatest in NAFO Divisions 3L (38.9%), 3N (34.1%), and 4T (33.0%), whereas the percentage change in the high emission scenario was lowest in the southern regions, specifically divisions 5Ze (−1.2%), 5Y (0.4%), and 4X (3.5%) (Table S1).
Table 1.
| Survey region | Total sets | Percent | Minimum depth (m) | Maximum depth (m) | Sampling months | Start year | End year |
|---|---|---|---|---|---|---|---|
| Newfoundland (NF) | 43408 | 3.30 | 32 | 1504 | 5, 6, 10–12 | 1971 | 2019 |
| Northern GSL (NG) | 5524 | 13.11 | 38 | 525 | 8 | 1990 | 2019 |
| Southern GSL (SG) | 6582 | 6.27 | 13 | 386 | 9 | 1971 | 2015 |
| Scotian Shelf (SS) | 16521 | 14.43 | 11 | 434 | 3, 7 | 1970 | 2020 |
| United States (USA) | 22492 | 1.98 | 5 | 542 | 2–4, 9–11 | 1965 | 2017 |
Discussion
Historically, since the 1850s, Atlantic halibut has been overfished in the U.S. (Grasso 2008) and has yet to fully recover there (Shackell et al. 2016, 2021). In Canada, since 1950, Atlantic halibut have undergone a cycle between periods of high and low abundance (Grasso 2008; Trzcinski and Bowen 2016; DFO 2018). Since 2011, biomass in Canada has remained above the long-term mean (DFO 2015a, 2018; Cox et al. 2016; Trzcinski and Bowen 2016), and Atlantic halibut has become one of the most commercially valuable groundfish species in the Atlantic region (DFO 2019). As a result, with the increasing bottom temperatures in the northwest Atlantic, it is paramount to monitor and predict how changes in temperature will lead to changes in the distribution and recruitment of this important commercial species.
The amount of available thermal habitat and the number of GDD have increased since 1990 throughout much of the northwest Atlantic range of Atlantic halibut. There was minimal or no change in available thermal habitat in southern regions, including division 4X, where Atlantic halibut biomass and landings have consistently been the highest compared with other NAFO Divisions since 1970 (French et al. 2018; Shackell et al. 2022). The consistent pattern in available thermal habitat is likely due to the contemporary temperatures of these regions falling within the projected thermal window from 2.46 to 9.25 °C yet warming has not pushed temperatures above the projected upper limit. A negative rate of change of thermal habitat was observed in the most northeasterly areas of the model domain, roughly encompassing the Newfoundland shelves, reflecting the influence of the cold Labrador current on the region's thermal dynamics in an already relatively cold region compared to the rest of the domain (Brickman et al. 2018). Relatively few Atlantic halibut were found in this area (Boudreau et al. 2017; French et al. 2018). The overall observed increase in the amount of available thermal habitat corresponds to increasing bottom temperature patterns in the northwest Atlantic (Kavanaugh et al. 2017; Rheuban et al. 2017; Brickman et al. 2018). Our analysis approach builds on previous models of thermal habitat change (e.g., Shackell et al. 2022) by incorporating GDD and an improved approach to defining thermal habitat.
An increase in the amount of thermal habitat due to warming temperatures was also observed in other species such as summer flounder Paralichthys dentatus, striped bass Morone saxatilis, black sea bass Centropristis striata, and Barents Sea cod Gadus morhua (Eriksen et al. 2017; Henderson et al. 2017; Kleisner et al. 2017; McBride et al. 2018). Our results emphasize the relationship between warming bottom temperatures and recent expansions of Atlantic halibut. The general increase in biomass and abundance could be associated with the overall increase in both available thermal habitat and GDD from 2004 to 2018. The increased availability of thermal habitat may have allowed a greater dispersion of Atlantic halibut, which in turn could have reduced local intraspecific competition at a time of reduced interspecific competition due to a reduced biomass of many other groundfish species (Shackell and Frank 2007; Shackell et al. 2010). Greater abundances and dispersion may also be partially caused by changes in fishing mortality due to the establishment of a minimum legal size throughout much of the range (Trzcinski and Bowen 2016; Shackell et al. 2022). The increase in GDD likely also led to a longer growing season and correspondingly increased survival during the early life stages.
Overall, recent temperature increases have promoted longer growing seasons and the expansion of suitable habitat, which likely have contributed to increasing trends in Atlantic halibut abundances similar to those observed for other species in recent years (Henderson et al. 2017; Friedland et al. 2020). Increased landings may, in part, be due to this increased availability of suitable habitat, given that the magnitude of landings in each NAFO Division is proportional to the size of juvenile Atlantic halibut nursery areas (French et al. 2018), which supports the nursery-size hypothesis that states the larger the area of juvenile Atlantic halibut habitat, the higher the adult production (Iles and Sinclair 1982; Rijnsdorp et al. 1992; Gibson 1994; Beverton 1995). The expansion of available juvenile habitat is directly linked to increased temperature, leading to quicker adult recruitment and correspondingly increased adult biomass that ultimately results in increased fishery landings (sensu the nursery-size hypothesis).
The GDD index showed a significant positive rate of change in the majority of NAFO Divisions indicating a longer growing season for Atlantic halibut. These positive rates of change may accelerate both larval and juvenile growth and/or reduce mortality during these early life stages, thereby providing increased recruitment (Lein et al. 1997; Galloway et al. 1999). Across the domain, contemporary evidence shows Atlantic halibut in warmer regions grows faster and matures earlier than in cooler regions (Shackell et al. 2019). Increased growth leads to a shorter time to maturation, thereby increasing recruitment rates and overall reproductive rates. Potentially increased abundances promote the expansion of Atlantic halibut into suitable habitats in the northwest Atlantic. Similar increases in biomass have been observed in several marine groundfish due to an increased growing season and increased reproductive rates in the Gulf of Maine (Henderson et al. 2017). However, once temperatures exceed physiological limits, declining fitness is expected.
Based on congruent trends in abundance, GDD, and thermal habitat over time, the warming environment is likely a strong determinant of stock status for Atlantic halibut and possibly underpinned the 2004–2018 abundance increase. The probability of Atlantic halibut occurrence is predicted to increase in the northern regions and remain relatively unchanged in the southern regions in all future climate scenarios. In particular, the highest increase in the probability of occurrence was predicted in the Gulf of St. Lawrence, consistent with the concept that less currently occupied northern areas are warming and consequently increasing suitable habitat with ongoing climate change (Jones and Cheung 2015; Friedland et al. 2020). The Gulf of St. Lawrence has experienced oxygen depletion alongside climate change and currently holds a large persistent hypoxic zone, which would greatly affect stenothermal species such as Greenland halibut Reinhardtius hippoglossoides (Stortini et al. 2015). However, Atlantic halibut, being eurythermal and better able to avoid the hypoxic zone, may be relatively less affected than Greenland halibut. The southern areas of the Gulf of Maine are predicted to remain relatively unchanged or decrease slightly in probability of occurrence in future climate scenarios. Future decreases are most probable in southern regions and are to be expected if bottom temperatures rise above the preferred thermal niche for Atlantic halibut, as decreases have been predicted for other fish and invertebrate species (Stanley et al. 2018). This analysis focuses on juvenile Atlantic halibut due to ontogenetic coverage by synoptic surveys, but changes in thermal regime likely also affect other life history stages. For example, decreases in probability of occurrence could be caused by water column temperatures exceeding thresholds that result in increased deformities (6 °C) and mortality (12 °C) in Atlantic halibut larvae (Lein et al. 1997), thus reducing survival and consequently juvenile recruitment.
Predicted changes in the probability of occurrence indicate abundance and biomass increases in future climate scenarios, even under an emission reduction scenario (RCP 4.5). The average probability of occurrence in the near future under RCP 8.5 was higher than in the far future under RCP 4.5. Therefore, a greater increase in Atlantic halibut occurrence, and, consequently, abundance in a shorter period in a high-emissions scenario (RCP 8.5), is anticipated. Following the model predictions, an increase in Atlantic halibut abundance in Canadian waters (with the exception of NAFO Division 4X in RCP 4.5 in the near future) and an unchanged abundance in U.S. waters from 2021 to 2085, regardless of emission mitigation efforts, are expected. The resultant spatial patterns accord well with other models of Atlantic halibut occurrence (Boudreau et al. 2017; French et al. 2018; Shackell et al. 2022). However, these predictions are habitat-specific and do not consider broader ecological responses to climate change. Prey availability and predator abundance play important roles in survival and recruitment; thus, the spatial distribution of Atlantic halibut based on a broader ecological scope is warranted.
Increasing bottom temperatures have correspondingly increased the amount of suitable thermal habitat and GDD for Atlantic halibut between its near collapse and its current population state. This increase coincides with a period of increased recruitment and abundance, suggesting that increases in Atlantic halibut landings since the 2000s are very likely linked to environmental change in the study domain. Our model of the relationship between bottom temperature and the occurrence of Atlantic halibut provides important insight into the potential influence of climate change on halibut stocks and demonstrates that even under an emission reduction scenario (RCP 4.5), the trend of increasing habitat, abundance, and changing distribution for Atlantic halibut will likely continue. Our results contribute to growing calls for climate change to be incorporated into adaptive management decisions for fisheries in the Northwest Atlantic.
Acknowledgements
We would like to thank David Brickman who provided BNAM output, a valuable component of the manuscript. We would also like to thank Lingbo Li for her comments on an earlier version of the manuscript.
References
Armsworthy S.L., Trzcinski M.K., Campana S.E. 2014. Movements, environmental associations, and presumed spawning locations of Atlantic halibut (Hippoglossus hippoglossus) in the northwest Atlantic determined using archival satellite pop-up tags. Marine Biology, 161(3): 645–656.
Beazley L., Wang Z., Kenchington E., Yashayaev I., Rapp H.T., Xavier J.R., et al. 2018. Predicted distribution of the glass sponge Vazella pourtalesi on the Scotian Shelf and its persistence in the face of climatic variability. PLoS One, 13(10): e0205505.
Beverton R.J.H. 1995. Spatial limitation of population size: the concentration hypothesis. Netherlands Journal of Sea Research, 34(1): 1–6.
Boudreau S.A., Shackell N.L., Carson S., Heyer C.E. 2017. Connectivity, persistence, and loss of high abundance areas of a recovering marine fish population in the Northwest Atlantic Ocean. Ecology & Evolution, 7(22): 9739–9749.
Brickman D., Alexander M.A., Pershing A., Scott J.D., Wang Z. 2021. Projections of physical conditions in the Gulf of Maine in 2050. Elementa: Science of the Anthropocene, 9(1): 00055.
Brickman D., Hebert D., Wang Z. 2018. Mechanism for the recent ocean warming events on the Scotian Shelf of eastern Canada. Continental Shelf Research, 156: 11.
Bundy A., Gomez C., Cook A.M. 2019. Scrupulous proxies: defining and applying a rigorous framework for the selection and evaluation of a suite of ecological indicators. Ecological Indicators, 104: 737–754.
Cargnelli L.M., Griesbach S.J., Morse W.W. 1999. Essential fish habitat source document: Atlantic halibut, hippoglossus hippoglossus, life history and habitat characteristics. NOAA Technical Memorandum NMFS-NE, 125(September): 17.
Champion C., Hobday A.J., Zhang X., Coleman M.A. 2022. Climate change alters the temporal persistence of coastal-pelagic fishes off eastern Australia. ICES Journal of Marine Science, 79: 1083.
Chaudhary C., Richardson A.J., Schoeman D.S., Costello M.J. 2021. Global warming is causing a more pronounced dip in marine species richness around the equator. Proceedings of the National Academy of Sciences of the United States of America, 118(15): e2015094118.
Ciannelli L., Fisher J., Skern-Mauritzen M., Hunsicker M., Hidalgo M., Frank K., Bailey K. 2013. Theory, consequences and evidence of eroding population spatial structure in harvested marine fishes: a review. Marine Ecology Progress Series, 480: 227–243.
Col L.A., Legault C.M. 2009. The 2008 assessment of Atlantic halibut in the Gulf of Maine Georges Bank region. National Marine Fisheries Service.
Cox S., Benson A., den Heyer C.E. 2016. Framework for the assessment of Atlantic halibut stocks on Scotian Shelf and Southern Grand Banks. Canadian Science Advisory Secretariat Science Advisory Report. pp. 1–11.
den Heyer C.E., Schwarz C.J., Trzcinski M.K. 2013. Fishing and natural mortality rates of Atlantic halibut estimated from multiyear tagging and life history. Transactions of the American Fisheries Society, 142(3): 690–702.
DFO. 2015a. 2014 Assessment of Atlantic halibut on the Scotian Shelf and Southern Grand Banks. Canadian Science Advisory Secretariat Science Advisory Report, 2015/012(March). pp. 1–11.
DFO. 2015b. Stock assessment of Atlantic halibut of the Gulf of St. Lawrence (NAFO Divisions 4RST) for 2013 and 2014. p. 15.
DFO. 2018. Stock status update of Atlantic halibut (Hippoglossus hippoglossus) on the Scotian Shelf and Southern Grand Banks in NAFO Divisions 3NOPs4VWX5Zc. p. 9.
DFO. 2019. Seafisheries landed value by region, 2019. Available from https://www.dfo-mpo.gc.ca/stats/commercial/land-debarq/sea-maritimes/s2019pv-eng.htm.
Doney S.C., Ruckelshaus M., Emmett Duffy J., Barry J.P., Chan F., English C.A., et al. 2012. Climate change impacts on marine ecosystems. Annual Review of Marine Science, 4(1): 11–37.
Eriksen E., Skjoldal H.R., Gjøsæter H., Primicerio R. 2017. Spatial and temporal changes in the Barents Sea pelagic compartment during the recent warming. Progress in Oceanography, 151: 206–226.
French K.J., Shackell N.L., den Heyer C.E. 2018. Strong relationship between commercial catch of adult Atlantic halibut (Hippoglossus hippoglossus) and availability of suitable habitat for juveniles in the Northwest Atlantic Ocean. Fishery Bulletin, 116(2): 111–125.
Friedland K.D., Langan J.A., Large S.I., Selden R.L., Link J.S., Watson R.A., Collie J.S. 2020. Changes in higher trophic level productivity, diversity and niche space in a rapidly warming continental shelf ecosystem. Science of the Total Environment, 704: 135270.
Galloway T.F., Kjørsvik E., Kryvi H. 1999. Muscle growth in yolk-sac larvae of the Atlantic halibut as influenced by temperature in the egg and yolk-sac stage. Journal of Fish Biology, 55(sA): 26–43.
Gibson R.N. 1994. Impact of habitat quality and quantity on the recruitment of juvenile flatfishes. Netherlands Journal of Sea Research, 32(2): 191–206.
Grasso G.M. 2008. What appeared limitless plenty: the rise and fall of the nineteenth-century Atlantic halibut fishery. Environmental History, 13(1): 66–91.
Greenan B.J.W., Shackell N.L., Ferguson K., Greyson P., Cogswell A., Brickman D., et al. 2019. Climate change vulnerability of American lobster fishing communities in Atlantic Canada. Frontiers in Marine Science, 6.
Grüss A., Chagaris D.D., Babcock E.A., Tarnecki J.H. 2018. Assisting ecosystem-based fisheries management efforts using a comprehensive survey database, a large environmental database, and generalized additive models. Marine and Coastal Fisheries, 10(1): 40–70.
Hale S.S., Buffum H.W., Kiddon J.A., Hughes M.M. 2017. Subtidal Benthic invertebrates shifting northward along the US Atlantic coast. Estuaries and Coasts, 40(6): 1744–1756.
Henderson M.E., Mills K.E., Thomas A.C., Pershing A.J., Nye J.A. 2017. Effects of spring onset and summer duration on fish species distribution and biomass along the Northeast United States continental shelf. Reviews in Fish Biology and Fisheries, 27(2): 411–424.
Hijmans R.J. 2019. raster: geographic data analysis and modeling (R package version 3.0-7). Available from https://CRAN.R-project.org/package=raster.
Iles T.D., Sinclair M. 1982. Atlantic herring: stock discreteness and abundance. Science, 215(4533): 627–633.
Jones M.C., Cheung W.W.L. 2015. Multi-model ensemble projections of climate change effects on global marine biodiversity. ICES Journal of Marine Science, 72(3): 741–752.
Kanwit J.K. 2007. Tagging results from the 2000–2004 federal experimental fishery for Atlantic halibut (Hippoglossus hippoglossus) in the eastern Gulf of Maine. J. Northw. Atl. Fish. Sci., 38(2005): 37–42.
Kavanaugh M.T., Rheuban J.E., Luis K.M.A., Doney S.C. 2017. Thirty-three years of ocean benthic warming along the U.S. Northeast continental shelf and slope: patterns, drivers, and ecological consequences. JGR Oceans, 122(12): 9399–9414.
Kess T., Einfeldt A.L., Wringe B., Lehnert S.J., Layton K.K.S., McBride M.C., et al. 2021. A putative structural variant and environmental variation associated with genomic divergence across the Northwest Atlantic in Atlantic Halibut. ICES Journal of Marine Science, 78(7): 2371–2384.
Kleisner K.M., Fogarty M.J., McGee S., Hare J.A., Moret S., Perretti C.T., Saba V.S. 2017. Marine species distribution shifts on the U.S. Northeast Continental Shelf under continued ocean warming. Progress in Oceanography, 153: 24–36.
Lein I., Holmefjord I., Rye M. 1997. Effects of temperature on yolk sac larvae of Atlantic halibut (Hippoglossus hippoglossus L.). Aquaculture, 157(1–2): 123–135.
Lowen J.B., Hart D.R., Stanley R.R.E., Lehnert S.J., Bradbury I.R., DiBacco C. 2019. Assessing effects of genetic, environmental, and biotic gradients in species distribution modelling. ICES Journal of Marine Science, 76(6): 1762–1775.
Maxwell S.L., Butt N., Maron M., McAlpine C.A., Chapman S., Ullmann A., et al. 2019. Conservation implications of ecological responses to extreme weather and climate events. Diversity and Distributions, 25(4): 613–625.
McBride R.S., Tweedie M.K., Oliveira K. 2018. Reproduction, first-year growth, and expansion of spawning and nursery grounds of black sea bass (Centropristis striata) into a warming Gulf of Maine. Fisheries Bulletin, 116(3–4): 323–336.
Miller D.D., Ota Y., Sumaila U.R., Cisneros-Montemayor A.M., Cheung W.W.L. 2018. Adaptation strategies to climate change in marine systems. Global Change Biology, 24(1): e1–e14.
Moore J.A. 1999. Deep-sea Finfish Fisheries: lessons from history. Fisheries, 24(7): 16–21.
Murase H., Nagashima H., Yonezaki S., Matsukura R., Kitakado T. 2009. Application of a generalized additive model (GAM) to reveal relationships between environmental factors and distributions of pelagic fish and krill: a case study in Sendai Bay, Japan. ICES Journal of Marine Science, 66(6): 1417–1424.
Murphy H.M., Fisher J.A.D., Bris A.L., Desgagnés M., Castonguay M., Loher T., Robert D. 2017. Characterization of depth distributions, temperature associations, and seasonal migrations of Atlantic halibut in the Gulf of St. Lawrence using pop-up satellite archival tags. Marine and Coastal Fisheries, 9(1): 341.
Neuheimer A.B., Taggart C.T. 2007. The growing degree-day and fish size-at-age: the overlooked metric. Canadian Journal of Fisheries and Aquatic Sciences, 64(2): 375–385.
Neuheimer A.B., Taggart C., Frank K. 2008. Size-at-age in haddock (Melanogrammus aeglefinus): application of the growing degree-day (GDD) metric.
Neuheimer A.B., Grønkjær P. 2012. Climate effects on size-at-age: growth in warming waters compensates for earlier maturity in an exploited marine fish. Global Change Biology, 18(6): 1812–1822.
Neuheimer A.B., MacKenzie B.R. 2014. Explaining life history variation in a changing climate across a species’ range. Ecology, 95(12): 3364–3375.
Pauly D., Christensen V., Guénette S., Pitcher T.J., Sumaila U.R., Walters C.J., et al. 2002. Towards sustainability in world fisheries. Nature, 418(6898): 689–695.
Pebesma E. 2018. Simple features for R: standardized support for spatial vector data.
Pedersen E.J., Thompson P.L., Ball R.A., Fortin M.-J., Gouhier T.C., Link H., et al. 2017. Signatures of the collapse and incipient recovery of an overexploited marine ecosystem. Royal Society Open Science, 4(7): 170215.
Pedersen E.J., Miller D.L., Simpson G.L., Ross N. 2019. Hierarchical generalized additive models in ecology: an introduction with mgcv. PeerJ, 7: e6876.
Pinsky M.L., Reygondeau G., Caddell R., Palacios-Abrantes J., Spijkers J., Cheung W.W.L. 2018. Preparing ocean governance for species on the move. Science, 360(6394): 1189–1191.
R Core Team. 2021. R: a language and environment for statistical computing. R Foundation for Statistical Computing, Vienna, Austria. Available from https://www.R-project.org/.
Reuchlin-Hugenholtz E., Shackell N.L., Hutchings J.A. 2015. The potential for spatial distribution indices to signal thresholds in marine sish biomass. PLoS One, 10(3): e0120500.
Reuchlin-Hugenholtz E., Shackell N.L., Hutchings J.A., & V. Bartolino 2016. Spatial reference points for groundfish. ICES Journal of Marine Science, 73(10): 2468–2478.
Rheuban J.E., Kavanaugh M.T., Doney S.C. 2017. Implications of future Northwest Atlantic bottom temperatures on the American lobster (Homarus americanus) fishery. Journal of Geophysical Research: Oceans, 122(12): 9387–9398.
Ricard D., Shackell N.L. 2013. Population status (abundance/biomass, geographic extent, body size and condition), importanthabitat, depth, temperature and salinity preferences of marinefish and invertebrates on the Scotian Shelf and Bay of Fundy. Canadian Technical Report of Fisheries and Aquatic Sciences, 3012.
Rijnsdorp A.D., Van Beek F.A., Flatman S., Millner R.M., Riley J.D., Giret M., De Clerck R. 1992. Recruitment of sole stocks, Solea solea (L.), in the Northeast Atlantic. Netherlands Journal of Sea Research, 29(1): 173–192.
Robinson N.M., Nelson W.A., Costello M.J., Sutherland J.E., Lundquist C.J. 2017. A systematic review of marine-based species distribution models (SDMs) with recommendations for best practice. Frontiers in Marine Science, 4: 421.
Shackell N.L, Frank K. 2007. Compensation in exploited marine fish communities on the Scotian Shelf, Canada. Marine Ecology Progress Series, 336: 235–247.
Shackell N.L., Frank K.T., Fisher J.A.D., Petrie B., Leggett W.C. 2010. Decline in top predator body size and changing climate alter trophic structure in an oceanic ecosystem. Proceedings of the Royal Society B: Biological Sciences, 277(1686): 1353–1360.
Shackell N.L., Ricard D., Stortini C. 2014. Thermal habitat index of many Northwest Atlantic temperate species stays neutral under warming projected for 2030 but changes radically by 2060. PLoS One, 9(3): e90662.
Shackell N.L., Frank K.T., Nye J.A., den Heyer C.E. 2016. A transboundary dilemma: dichotomous designations of Atlantic halibut status in the Northwest Atlantic. ICES Journal of Marine Science, 73(7): 1798–1805.
Shackell N.L., Ferguson K.J., den Heyer C.E., Brickman D., Wang Z., Ransier K.T. 2019. Growing degree-day influences growth rate and length of maturity of Northwest Atlantic halibut (Hippoglossus hippoglussus L.) across the southern stock domain. Journal of Northwest Atlantic Fishery Science, 50: 25–35.
Shackell N.L., Fisher J.A.D., den Heyer C.E., Hennen D.R., Seitz A.C., Le Bris A., et al. 2022. Spatial ecology of Atlantic halibut across the Northwest Atlantic: a recovering species in an era of climate change. Reviews in Fisheries Science & Aquaculture, 30(3): 281–305.
Shackell N.L., Keith D.M., Lotze H.K. 2021. Challenges of gauging the impact of area-based fishery closures and OECMs: a case study using long-standing Canadian groundfish closures. Frontiers in Marine Science, 8.
Sigourney D.B., Ross M.R., Brodziak J., Burnett J. 2006. Length at age, sexual maturity and distribution of Atlantic halibut, Hippoglossus hippoglossus L., off the Northeast USA. Journal of Northwest Atlantic Fishery Science, 36: 81–90.
Stanley R.R.E., DiBacco C., Lowen B., Beiko R.G., Jeffery N.W., Van Wyngaarden M., et al. 2018. A climate-associated multispecies cryptic cline in the northwest Atlantic. Science Advances, 4(3): eaaq0929.
Stortini C.H., Shackell N.L., Tyedmers P., Beazley K. 2015. Assessing marine species vulnerability to projected warming on the Scotian Shelf, Canada. ICES Journal of Marine Science, 72(6): 1731–1743.
Swets J.A. 1988. Measuring the accuracy of diagnostic systems. Science, New Series, 240(4857): 1285–1293.
Timbs J.R., Powell E.N., Mann R. 2019. Changes in the spatial distribution and anatomy of a range shift for the Atlantic surfclam Spisula solidissima in the Mid-Atlantic Bight and on Georges Bank. Marine Ecology Progress Series, 620: 77–97.
Trzcinski M.K., Bowen W.D. 2016. The recovery of Atlantic halibut: a large, long-lived, and exploited marine predator. ICES Journal of Marine Science, 73(4): 1104–1114.
Wang Z., Department of Fisheries and Oceans, Maritimes Region, Ocean Sciences Division, & Bedford Institute of Oceanography, Canada. 2018. BNAM: an eddy-resolving North Atlantic Ocean model to support ocean monitoring. Ocean Sciences Division, Maritimes Region, Fisheries and Oceans Canada, Bedford Institute of Oceanography. Available from http://publications.gc.ca/collections/collection_2018/mpo-dfo/Fs97-18-327-eng.pdf.
Wickham H. 2016. ggplot2: elegant graphics for data analysis.
Wickham H., François R., Henry L., Müller K. 2019. dplyr: a grammar of data manipulation (R package version 0.8.3). Available from https://CRAN.R-project.org/package=dplyr.
Wood S.N. 2006. Generalized additive models: an introduction with R. Chapman and Hall/CRC, Boca Raton, FL. p. 397.
Wood S.N. 2011. Fast stable restricted maximum likelihood and marginal likelihood estimation of semiparametric generalized linear models. Journal of the Royal Statistical Society: Series B (Statistical Methodology), 73(1): 3–36.
Wood S.N. 2017. Generalized additive models: an introduction with R. 2nd ed. Chapman and Hall/CRC, Boca Raton, FL.
Zurell D., Franklin J., König C., Bouchet P.J., Dormann C.F., Elith J., et al. 2020. A standard protocol for reporting species distribution models. Ecography, 43(9): 1261–1277.
Supplementary material
Supplementary Material 1 (DOCX / 2.12 MB).
- Download
- 2.12 MB
Information & Authors
Information
Published In

FACETS
Volume 8 • January 2023
Pages: 1 - 14
Editor: Jeff C. Clements
History
Received: 27 December 2021
Accepted: 15 May 2023
Version of record online: 9 November 2023
Copyright
© 2023 Authors Czich and Avery and The Crown. This work is licensed under a Creative Commons Attribution 4.0 International License (CC BY 4.0), which permits unrestricted use, distribution, and reproduction in any medium, provided the original author(s) and source are credited.
Data Availability Statement
The data analyzed during this study are available through the Open Government of Canada repositories. The BNAM present data can be accessed under the record ID: 5577393c-5eb2-4d07-a64e-d2a1b675a242. The RV data for the Maritimes region is available under the record ID: 1366e1f1-e2c8-4905-89ae-e10f1be0a164. For the Gulf of Saint Lawrence region, the datasets can be found under the record ID: d4ec2d6b-f4bc-4c6c-b866-b26e507a3b76. NAFO Divisions are available under the record ID: 59af1c96-fc8f-4fa0-b398-d65e953eadaa. Newfoundland data and BNAM future climatology data are not currently available on the Open Government of Canada platform but are available upon request.
Key Words
Sections
Subjects
Plain Language Summary
Adapting to Climate Change: Implications for Atlantic Halibut Fisheries in Canada
Authors
Author Contributions
Conceptualization: CEdH, NLS
Data curation: ANC, RRES
Formal analysis: ANC, RRES, TSA
Investigation: ANC, RRES, CEdH, TSA, NLS
Methodology: ANC, RRES, TSA
Resources: RRES, NLS
Software: ANC
Supervision: RRES, TSA, NLS
Validation: ANC, RRES, TSA
Visualization: ANC, RRES, TSA, CEdH, NLS
Writing – original draft: ANC
Writing – review & editing: ANC, RRES, TSA, CEdH, NLS
Competing Interests
The authors declare there are no competing interests.
Metrics & Citations
Metrics
Other Metrics
Citations
Cite As
Andrew N. Czich, R.R.E. Stanley, T.S. Avery, C.E. den Heyer, and N.L. Shackell. 2023. Recent and projected climate change–induced expansion of Atlantic halibut in the Northwest Atlantic. FACETS.
8(): 1-14. https://doi.org/10.1139/facets-2021-0202
Export Citations
If you have the appropriate software installed, you can download article citation data to the citation manager of your choice. Simply select your manager software from the list below and click Download.
There are no citations for this item