Open access

Changes in serum copeptin in the early onset of type 2 diabetes

Publication: FACETS
15 September 2022

Abstract

Copeptin (C-terminal fragment of pro-arginine vasopressin) levels change as fasting plasma glucose (FPG) and blood pressure change. To explore the clinical significance of changes in copeptin levels in development of type 2 diabetes mellitus (T2DM), we enrolled patients undergoing physical health examinations who met diagnostic criteria for prediabetes and T2DM. Subjects were divided into eight subgroups based on FPG levels and presence or absence of hypertension, including: a normal group (NGT), FPG < 5.6 mmol/L; prediabetes A, 5.6 mmol/L ≤ FPG < 6.1 mmol/L; prediabetes B, 6.1 mmol/L ≤ FPG < 7.0 mmol/L; and T2DM, FPG ≥ 7.0 mmol/L; participants were further into two subgroups by whether they had hypertension or not. Measures included biochemical indicators, fasting insulin (FINS), and copeptin. Copeptin levels in prediabetes A, prediabetes B, and T2DM groups increased significantly compared to NGT group (P < 0.01). No significant differences were found in copeptin levels between normal blood pressure and hypertension subgroups in all four groups. Copeptin levels correlated positively with systolic blood pressure, glycosylated hemoglobin (HbA1c), FPG, FINS, and insulin resistance index (HOMA-IR; P < 0.05–0.001), and negatively with insulin secretion index (P < 0.05–0.001). Stepwise regression analysis revealed that copeptin levels correlated independently with elevated HbA1c and aggravated HOMA-IR (P < 0.001). Increase in copeptin levels may aggravate insulin resistance, finally leading to T2DM.

Introduction

Diabetes mellitus type 2 (T2DM) occurs in epidemic proportions globally and was reported by the International Diabetes Federation to involve a worldwide diabetic population of 366 million in 2011 with projections of reaching 552 million by 2030 (Whiting et al. 2011). While diagnostic tools are available for early risk assessment of T2DM (fasting glucose measurement, glucose tolerance tests, insulin sensitivity indexes, and anthropometric measures), new biomarkers are needed to predict early development of T2DM, which may help to ease the global healthcare burden of this disease. Previously, we identified several biomarkers (TRX, TXNIP, NLRP3, 25(OH)D) shown by receiver operating characteristic (ROC) analysis to have predictive value for prediabetes and T2DM (Xie et al. 2021). Now we investigate the predictive value of copeptin, a prognostic biomarker in neurological and cardiovascular diseases (Baranowska and Kochanowski 2019), for potential use in early diabetes risk assessment.
In chronic psychosocial stress, arginine vasopressin (AVP) is not only regulated by plasma osmotic pressure, but it is also associated with endogenous stress stimulation, which activates the hypothalamic–pituitary–adrenal (HPA) axis, resulting in insulin resistance, obesity, diabetes, and metabolic syndrome (Baranowska and Kochanowski 2019; Enhorning et al. 2010). However, AVP is largely bound to platelets in the circulation, is frequently cleared from plasma, and is relatively unstable both in vivo and ex vivo (Enhorning et al. 2010). In contrast, C-terminal pro-AVP fragment (copeptin) directly reflects AVP concentration (Dobsa and Edozien 2013) and is considered to be a marker of insulin resistance, metabolic disorders, and diabetes (Saleem et al. 2009).
Multiple studies have shown that copeptin affects glucose metabolism in several ways by: (i) stimulating glycogen decomposition in the liver (Grazzini et al. 1999; Montero et al. 2006), (ii) activating V1a receptor of hepatocytes to promote gluconeogenesis (Hems and Whitton 1973), (iii) activating the V1b receptor on pancreatic α-cells to increase glucagon secretion (Kim et al. 2021), (vi) activating the phosphatidylinositol receptor pathway to enhance glucose-dependent pancreatic β-cell secretion and insulin release (Lu et al. 1993), and (v) activating the V1b receptor on the adrenal medulla chromaffin cells to increase the adrenaline level and stimulate glycogen decomposition in the liver, leading to hyperglycemia (Montero et al. 2006; Saleem et al. 2009).
When under continuous chronic psychosocial stress such as depression, anxiety, stressful life events, poverty, or lack of social support (Feller et al. 2019), increased circulating copeptin concentration may lead to HPA axis dysfunction, resulting in increased cortisol levels, reduced energy consumption, increased appetite and food intake, increased insulin levels, increased peripheral vascular resistance, and subsequent metabolic disorders such as abdominal obesity, insulin resistance, dyslipidemia, and hypertension (Melander 2016; Roussel et al. 2016; Saleem et al. 2009; Wannamethee et al. 2015). However, the relationship between changes in copeptin levels and blood pressure during the early stage of T2DM and the relationship between copeptin and related metabolic indicators are still unclear. This study aimed to evaluate the clinical significance of changes in copeptin levels in prediabetes and T2DM and relationships between copeptin and various clinical indicators.

Materials and methods

Study sample

Individuals undergoing physical health examinations in the Physical Examination Center of the Second Affiliated Hospital of Ningxia Medical University between September 2020 and November 2020 were recruited. The diagnostic criteria for prediabetes and T2DM met the 2021 American ADA diagnostic standard (American Diabetes 2021), and the diagnostic criteria for hypertension met the 2020 ACC/AHA hypertension guidelines (Flack and Adekola 2020). Prediabetes and T2DM were newly diagnosed in the included subjects, and all included subjects did not receive previous lifestyle interventions or antidiabetic medications. Exclusion criteria were: individuals younger than age 20 years or older than 60 years (we used 60 instead of 65 to avoid the possible effect of older age on the copeptin levels) (Smaradottir et al. 2017); those with previously diagnosed prediabetes, T2DM, or Type 1 diabetes mellitus (T1DM); patients with secondary hypertension, chronic kidney or liver disease or cancer, acute or chronic infection, acute or chronic autoimmune diseases, history of cardiovascular or cerebrovascular diseases, thyroid dysfunction, or any blood disease; individuals who abuse alcohol or drugs or who smoke and women who are receiving hormone replacement; and patients with an incomplete medical record.
Subjects were divided into four groups based on fasting plasma glucose (FPG) levels: normal control group (NGT), FPG < 5.6 mmol/L; prediabetes A (PDA), 5.6 mmol/L ≤ FPG < 6.1 mmol/L; prediabetes B (PDB), 6.1 mmol/L ≤ FPG <7.0 mmol/L; and T2DM group, FPG ≥ 7.0 mmol/L. Each group was further divided into two subgroups according to whether they had hypertension (-h) or not (-n). All study groups were gender and age matched, and the same number of individuals was enrolled in each subgroup.

Ethical considerations

This study was carried out in accordance with the Declaration of Helsinki. The study protocol was reviewed and approved by the ethics committee of Second Affiliated Hospital of Ningxia Medical University (No. 2021050). Signed informed consent was provided by all subjects before they participated in the study.

Study design and methods

This retrospective observational study analyzed the data of subjects with different FPG levels. Data of all included subjects were collected using a standardized questionnaire, including family history of T2DM, history of complications, medical history, measurement of systolic blood pressure (SBP), diastolic blood pressure (DBP), height, weight, waist circumference (WC), hip circumference, calculated body mass index (BMI (kg/m2)) and waist-to-hip ratio (WHR (cm/cm)).
Peripheral venous blood samples were collected after an 8- to 12-h fast. Clinical laboratory testing included: FPG, total cholesterol (TC), low-density lipoprotein (LDL), high-density lipoprotein (HDL), triglycerides (TG), alanine aminotransferase (ALT), aspartate aminotransferase (AST), creatinine (Cr), and uric acid (UA). These parameters were detected using the Beckman Coulter, AU5821 automatic biochemical analyzer (Beckman Coulter, Brea, CA, USA). Serum samples of 2 mL from all subjects were stored at −80 °C. After all blood samples were collected, fasting insulin (FINS) and glycosylated hemoglobin (HbA1c) were detected by ELISA using a fluorescence microplate reader (Promega-GloMax, USA), and the concentrations of copeptin was measured using the ELISA kit from China Jianglai Biological Co., Ltd. (Cat. No.: JL46021; Shanghai, China). The intra-precision and inter-precision of this ELISA kit is <10% and <15%, respectively, as tested with human asprosin. β-cell function was evaluated according to the homeostatic model. Insulin resistance index (HOMA-IR) = FPG × FINS/22.5, and insulin secretion index (HOMA-β) = 20 × FINS/(FPG-3.5).

Statistical analysis

Data are expressed as mean ± standard deviation or count (n) and percentage. Comparisons between different groups were performed using one-way ANOVA, and categorical variables were analyzed using the χ2 test. Correlations between different parameters were analyzed using the Pearson correlation test. Sensitivity and specificity of copeptin and other indicators in the diagnosis of prediabetes and T2DM were analyzed using the ROC curve analysis. A two-sided P value (P < 0.05) was established as statistical significance. All statistical analysis was performed using SPSS version 25.0 (IBM Corp, Armonk, NY, USA)

Results

Baseline demographic and clinical characteristics

A total of 272 subjects were included in this study, including 155 males and 117 females. Every group (NGT, PDA, PDB, and T2DM) contained 68 subjects, with 34 subjects in each subgroup (with or without hypertension). Significant differences were found between glycemia groups in the various measured parameters except TC, HDL and Cr level (P < 0.05) (Table 1). Corresponding to increases in FPG, significant increases were found in SBP, DBP, BMI, WC, WHR, TG, LDL, ALT, AST, HbA1c, FPG, FINS, and HOMA-IR, while HOMA-β decreased significantly. Results for SBP, DBP, BMI, WC, and WHR in the NGT-h and PDA-h groups were significantly higher than those in the NGT-n and PDA-n groups (P < 0.05); results for SBP, DBP, BMI, WC, WHR, ALT and AST were significantly higher in the PDB-h group than those in the PDB-n group (P < 0.05), while results for SBP, DBP, BMI, TG, and UA were significantly higher in the T2DM-h group than those in the T2DM-n group (P < 0.05).
Table 1.
Table 1. Analysis of main metabolic indicators among various groups.
IndicatorNGTPDAPDBT2DMP
NGT-nNGT-hPDA-nPDA-hPDB-nPDB-hT2D-nT2D-h
n3434343434343434 
Gender/male1820202020201720 
Age (years)44.62 ± 8.2044.65 ± 9.5844.76 ± 10.1444.91 ± 9.7445.53 ± 7.1545.56 ± 7.7546.32 ± 4.4446.55 ± 9.780.992
 44.00 (5.72)46.00 (6.68)47.00 (7.10)45.50 (2.80)47.00 (5.40)48.00 (5.30)46.00 (3.09)47.00 (6.44) 
SBP (mmHg)116.71 ± 8.75138.62 ± 10.70122.85 ± 10.29149.06 ± 15.80122.18 ± 7.98151.79 ± 15.66117.65 ± 6.98156.73 ± 15.46<0.001*
 119.00 (6.11)136.50 (7.40)124.00 (7.18)148.50 (11.02)121.00 (5.57)145.00 (10.93)119.00 (4.87)152.50 (10.79) 
DBP (mmHg)74.62 ± 8.1788.09 ± 9.4577.56 ± 7.7694.56 ± 12.9275.09 ± 6.9394.56 ± 12.9275.09 ± 6.9393.65 ± 12.28<0.001*
 73.50 (5.70)89.00 (6.60)78.00 (5.42)95.00 (8.09)78.50 (5.27)95.00 (9.20)75.00 (4.83)92.5 (8.57) 
BMI (kg/m2)23.65 ± 2.7225.91 ± 4.2024.93 ± 3.3926.59 ± 2.9425.18 ± 3.2127.80 ± 5.8325.56 ± 2.9928.16 ± 4.80<0.001*
 24.12 (1.90)25.60 (2.94)25.37 (2.37)26.13 (2.05)24.59 (2.24)26.63 (4.07)25.23 (2.09)27.16 (3.34) 
WC (cm)79.97 ± 8.1285.18 ± 11.5684.85 ± 11.0091.23 ± 9.6284.76 ± 9.3491.23 ± 12.8787.18 ± 9.3289.41 ± 7.69<0.001*
 79.00 (5.66)86.00 (8.07)83.50 (7.68)90.00 (6.71)81.50 (6.52)89.50 (8.98)86.50 (6.51)90.00 (5.36) 
WHR (cm/cm)0.83 ± 0.060.86 ± 0.080.86 ± 0.080.90 ± 0.050.84 ± 0.160.89 ± 0.060.89 ± 0.060.89 ± 0.060.002*
 0.83 (0.05)0.87 (0.06)0.84 (0.06)0.91 (0.04)0.86 (0.11)0.89 (0.04)0.88 (0.04)0.89 (0.05) 
TC (mmol/L)4.83 ± 0.874.64 ± 0.984.99 ± 1.095.19 ± 1.305.31 ± 0.865.02 ± 1.254.90 ± 1.015.39 ± 0.980.061
 4.76 (0.61)4.65 (0.68)5.31 (0.76)5.23 (0.90)5.17 (0.60)4.81 (0.87)4.75 (0.71)5.29 (0.68) 
HDL (mmol/L)1.34 ± 0.281.33 ± 0.221.39 ± 0.251.32 ± 0.181.28 ± 0.221.26 ± 0.191.31 ± 0.231.31 ± 0.270.482
 1.34 (0.19)1.33 (0.15)1.39 (0.18)1.29 (0.16)1.32 (0.12)1.28 (0.15)1.28 (0.13)1.31 (0.19) 
LDL (mmol/L)2.63 ± 0.622.53 ± 0.512.82 ± 0.583.03 ± 0.843.08 ± 0.672.89 ± 0.872.83 ± 0.683.05 ± 0.590.006*
 2.57 (0.43)2.53 (0.36)2.94 (0.40)3.07 (0.59)3.01 (0.47)2.88 (0.61)2.77 (0.48)3.07 (0.41) 
TG (mmol/L)1.57 ± 0.731.95 ± 1.282.04 ± 1.732.52 ± 1.222.87 ± 2.462.26 ± 1.152.04 ± 1.153.01 ± 1.740.001*
 1.37 (0.51)1.70 (0.89)1.69 (1.21)2.19 (0.85)2.09 (1.71)1.86 (0.80)1.82 (0.80)2.51 (1.22) 
ALT (umol/L)22.19 ± 12.6220.51 ± 10.7030.60 ± 25.7628.32 ± 14.5931.29 ± 23.8335.77 ± 22.4027.74 ± 17.9735.32 ± 29.080.019*
 17.70 (8.81)19.00 (7.47)25.10 (18.08)24.30 (10.18)24.65 (17.31)27.5 (15.62)19.90 (12.54)26.3 (20.3) 
AST (umol/L)26.44 ± 7.6625.07 ± 6.1526.44 ± 9.1827.68 ± 7.0727.97 ± 11.5034.53 ± 19.1424.47 ± 8.1329.26 ± 14.420.010*
 25.70 (5.34)24.75 (4.30)24.20 (6.40)26.35 (4.94)24.30 (8.02)28.50 (13.35)23.56 (5.68)25.66 (10.06) 
Cr (mmol/L)66.77 ± 11.7268.93 ± 13.4867.86 ± 12.1268.28 ± 9.4064.95 ± 11.8566.29 ± 16.2358.92 ± 10.9766.56 ± 18.930.079
 67.80 (8.17)67.25 (9.40)70.25 (9.16)68.70 (6.56)66.55 (8.27)68.15 (11.33)60.45 (7.65)64.10 (13.21) 
UA (mmol/L)331.64 ± 94.19346.49 ± 99.70350.95 ± 101.17377.92 ± 56.35353.65 ± 98.54390.03 ± 111.85273.97 ± 86.78355.61 ± 91.55<0.001*
 314.80 (65.73)323.05 (69.58)349.15 (70.6)381.50 (39.33)341.05 (68.77)385.35 (78.06)269.4 (60.55)352.70 (63.89) 
HbA1c (ng/mL)170.31 ± 25.67168.33 ± 25.28182.69 ± 24.92193.86 ± 21.70220.04 ± 20.90218.98 ± 23.34247.70 ± 20.74252.73 ± 20.24<0.001*
 173.41 (17.91)163.92 (17.64)186.33 (17.39)194.02 (15.14)216.42 (7.30)219.97 (16.28)247.95 (14.47)255.99 (14.12) 
FPG (mmol/L)4.98 ± 0.575.02 ± 0.555.51 ± 0.555.48 ± 0.765.60 ± 0.516.01 ± 0.486.82 ± 0.436.76 ± 0.52<0.001*
 4.96 (0.30)5.11 (0.24)5.75 (0.10)5.82 (0.09)6.40 (0.17)6.41 (0.15)6.82 (0.30)8.85 (2.13) 
FINS (mIU/L)4.96 ± 0.554.97 ± 0.535.53 ± 0.565.49 ± 0.756.02 ± 0.515.98 ± 0.466.80 ± 0.476.72 ± 0.54<0.001*
 4.96 (0.40)5.10 (0.41)5.57 (0.39)5.57 (0.53)6.00 (0.36)5.96 (0.33)6.78 (0.37)6.71 (0.36) 
HOMA-β73.29 ± 23.6669.64 ± 23.3048.67 ± 5.2247.84 ± 7.3541.11 ± 4.5240.84 ± 4.2624.55 ± 9.0925.11 ± 10.14<0.001*
 69.77 (16.51)63.22 (16.25)48.61 (3.64)46.68 (5.13)40.89 (3.16)41.33 (2.97)21.28 (6.34)24.36 (7.08) 
HOMA-IR1.10 ± 0.161.12 ± 0.141.41 ± 0.141.41 ± 0.151.72 ± 0.171.73 ± 0.152.99 ± 0.792.98 ± 0.90<0.001*
 1.11 (0.11)1.14 (0.10)1.40 (0.11)1.44 (0.14)1.72 (0.11)1.71 (0.11)2.84 (0.55)2.57 (0.63) 
Copeptin (pg/mL)128.58 ± 41.49122.67 ± 28.62196.59 ± 50.45193.05 ± 45.35218.41 ± 54.95221.45 ± 53.83291.63 ± 59.60306.96 ± 49.48<0.001*
 116.54 (28.95)122.77 (19.97)198.46 (35.2)195.05 (31.65)216.73 (38.35)232.38 (37.56)287.76 (40.19)306.89 (34.52) 

Note: Values are presented in n or mean ± SD and median (IQR). P values represent comparisons between different glycemia groups performed with one-way ANOVA. NGT, normal control group; PDA, prediabetes A; PDB, prediabetes B; T2DM, type 2 diabetes mellitus; Hypertension (-h) or not (-n); SBP, systolic blood pressure; DBP, diastolic blood pressure; BMI, body mass index; WC, Waist circumference; WHR, waist-to-hip ratio; TC, total cholesterol; HDL, high-density lipoprotein; LDL, low-density lipoprotein; TG, triglycerides; ALT, alanine aminotransferase; AST, aspartate aminotransferase; Cr, creatinine; UA, uric acid; HbA1c, glycosylated hemoglobin; FPG, fasting plasma glucose; FINS, fasting insulin; HOMA-β, homeostasis model assessment of β-cell function; HOMA-IR, homeostasis model assessment of insulin resistance; Copeptin, C-terminal pro-AVP fragment.

*P < 0.05.

Changes in copeptin levels between the different groups

Highly significant differences were found in copeptin levels between the NGT, PDA, PDB, and T2DM groups, and copeptin levels increased significantly as FPG levels increased (P < 0.001, Fig. 1). However, no significant differences were found in copeptin levels between the four groups with hypertension and the four groups without hypertension (P > 0.05, Table 1).
Fig. 1.
Fig. 1. The plasma level of copeptin among groups. NGT, normal control group; PDA, prediabetes A; PDB, prediabetes B; T2DM, type 2 diabetes mellitus. Statistical significance: *P < 0.05; ***P < 0.001.

Correlations between copeptin levels and related factors

Pearson correlation analysis showed that copeptin correlated positively with SBP, HbA1c, FPG, FINS, and HOMA-IR (P < 0.05) and correlated negatively with HOMA-β in all subjects (P < 0.05, Table 2). However, no correlations were found between copeptin and age, DBP, BMI, WC, WHR, TC, HDL, LDL, TG, ALT, AST, Cr, and UA (P > 0.05, Table 2).
Table 2.
Table 2. Correlation between copeptin and various metabolic parameters.
CopeptinAgeSBPDBPBMIWCWHRTCHDLLDLTG
r0.0940.127−0.0050.0660.0410.0130.075−.0460.1070.088
P0.1250.0370.9330.2770.5050.8370.2210.4510.0790.149
 ALTASTCrUAHbA1cFPGFINSHOMA–βHOMA–IR 
r−0.052−0.058−0.0550.0490.5320.5530.588−.6340.636
P0.3450.3450.3690.426<0.001*<0.001*<0.001*<0.001*<0.001*

Note: Correlations between different parameters were analyzed using the Pearson correlation test. SBP, systolic blood pressure; DBP, diastolic blood pressure; BMI, body mass index; WC, Waist circumference; WHR, waist-to-hip ratio; TC, total cholesterol; HDL, high-density lipoprotein; LDL, low-density lipoprotein; TG, triglycerides; ALT, alanine aminotransferase; AST, aspartate aminotransferase; Cr, creatinine; UA, uric acid; HbA1c, glycosylated hemoglobin; FPG, fasting plasma glucose; FINS, fasting insulin; HOMA-β, homeostasis model assessment of β-cell function; HOMA-IR, homeostasis model assessment of insulin resistance; Copeptin, C-terminal pro-AVP fragment.

*P< 0.05.

Quartile analysis of copeptin values

Copeptin values of the 272 subjects were divided into four quartiles (Q) in ascending order, Q1: <151.96 pg/mL, Q2: 151.96–229.63 pg/mL, Q3: 229.64–307.29 pg/mL, and Q4: >307.29 pg/mL. As shown in Table 3, statistically significant differences were found between the four groups in the Q1 quartile (P < 0.001), of which NGT group subjects accounted for 64.29%. Statistically significant differences were found between the four groups in the Q2 quartile (P < 0.001), of which patients in the PDA+PDB group accounted for 75%; however, no significant differences were found between the PDA and PDB groups (P > 0.05). Significant differences were noted between the four groups in the Q3 quartile (P < 0.001), of which patients in the PDA+PDB group accounted for 61.18%; however, no significant differences were found between the PDA and PDB groups (P > 0.05). T2DM patients accounted for 100% of the Q4 quartile.
Table 3.
Table 3. Quartile analysis of the copeptin and 25(OH)D values.
Copeptin quartilenNGT, n (%)PDA, n (%)PDB, n (%)T2DM, n (%)P
Q18454 (64.29)17 (20.24)13 (15.48)0 (0.00)<0.001*
Q27212 (16.67)31 (43.06)23 (31.94)6 (8.33)<0.001*
Q3852 (2.35)20 (23.53)32 (37.64)31 (36.47)<0.001*
Q4310 (0.00)0 (0.00)0 (0.00)31 (100.00)<0.001*

Note: Copepetin, C-terminal pro-AVP fragment; NGT, normal control group; PDA, prediabetes A; PDB, prediabetes B; T2DM, type 2 diabetes mellitus.

*P < 0.05.

Copeptin in the diagnosis of prediabetes and T2DM

The ROC curve showed that the sensitivity and specificity of copeptin in the diagnosis of prediabetes were 85.78 and 94.12, respectively (area under curve = 0.922, cutoff = 161.46, P < 0.001) (Fig. 2).
Fig. 2.
Fig. 2. The receiver operating characteristic curve of copeptin for prediabetes and type 2 diabetes mellitus (T2DM). The ROC analysis showed the optimal cut-off value for prediabetes and T2DMis 161.46 pg/mL and 271.1 pg/mL, respectively. The area under curve (AUC) of copeptin for prediabetes and T2DM is 0.922 and 0.883, respectively.

Discussion

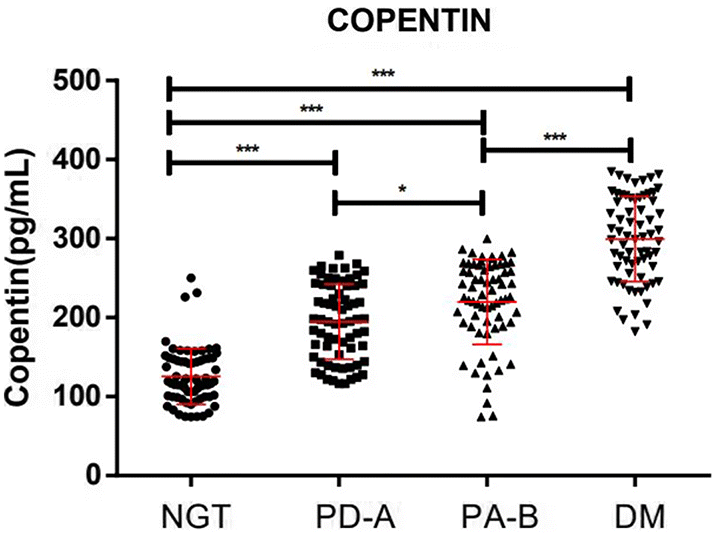
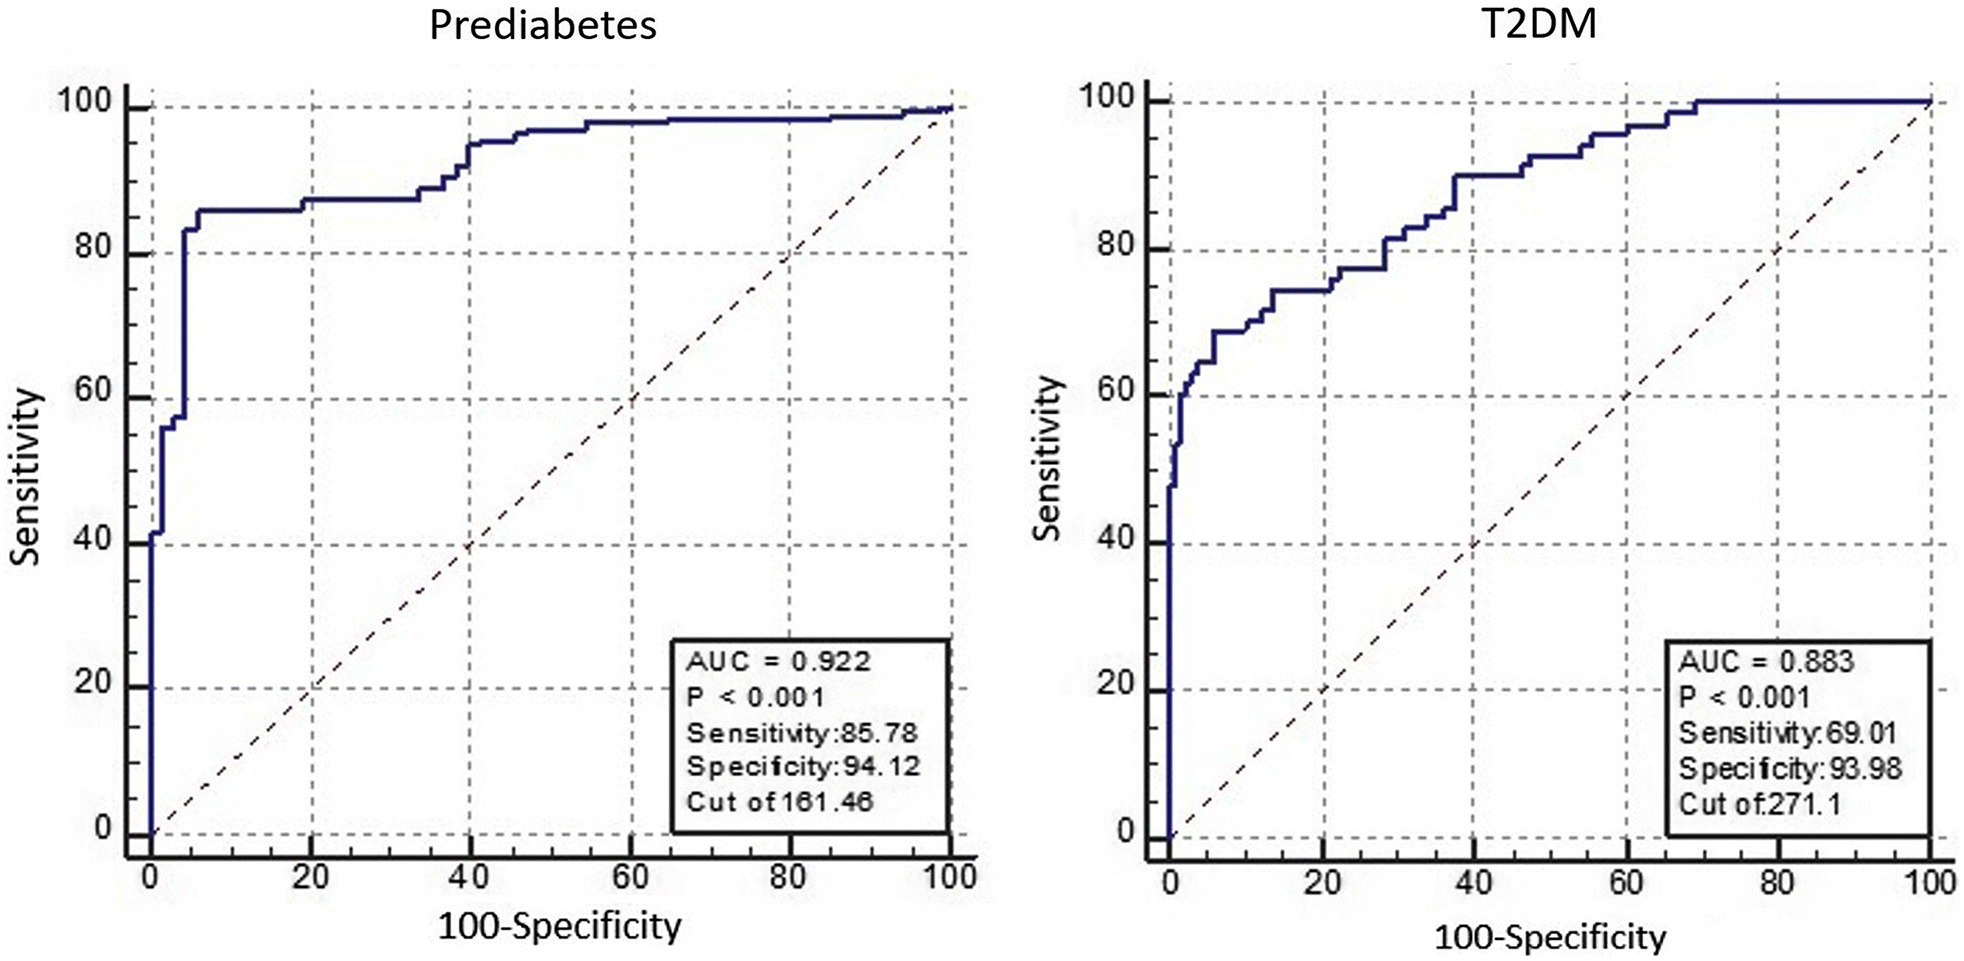
In the present study, we examined copeptin levels and other related indicators in subjects with different FPG levels who had undergone health checkups. The plasma levels of copeptin were significantly higher in individuals diagnosed with prediabetes or T2DM. Copeptin, HbA1c, FINS, and HOMA-IR were significantly increased in patients with prediabetes and T2DM, corresponding with the increase in FPG. Moreover, although copeptin correlated positively with HbA1c, FPG, FINS, and HOMA-IR, it did not correlate with HOMA-β. Also, regression analysis with copeptin as the dependent variable showed that copeptin independently associated with HbA1c and HOMA-IR, but again no association with HOMA-β. These results also agreed with results of quartile analysis, where subjects with T2DM accounted for 100% of all subjects in the top quarter of copeptin levels. Moreover, in ROC curve analysis, the AUC of copeptin for prediabetes and for T2DM were significantly elevated, suggesting that copeptin may play a deleterious role in early T2DM development.
Previous studies have reported that plasma copeptin levels increase significantly in individuals with prediabetes, diabetes and certain vascular complication (Li et al. 2020; Noor et al. 2020; Piani et al. 2021; Sujana et al. 2020; Yin et al. 2020). In patients with prediabetes, diabetes without nephropathy, and diabetic nephropathy, copeptin levels were increased (mean 215.10 pg/mL) and were significantly increased in patients with prediabetes (mean 252.85 pg/mL); copeptin levels also correlated positively with HbA1c (Noor et al. 2020). The presence of newly diagnosed prediabetes and T2DM correlated positively with copeptin, and increased by 1.29 times for every one SD increase of copeptin (Sujana et al. 2020). The present study showed that about 75% of patients with prediabetes had copeptin levels between 151.96 and 229.63 pg/mL, and all patients with T2DM had copeptin levels >307.29 pg/mL. Comparing with copeptin levels in healthy individuals from other literature (6.84–45.24 pg/mL) (Dobsa and Edozien 2013), copeptin measured in the present study were about 10-fold or higher. This was probably due to the use of ELISA method rather than the gold standard (BRAHMS Kryptor system, Thermo Fisher Scientific BRAHMS GmbH) to assess copeptin levels. Nevertheless, although our results showed that the copeptin and HbA1c levels increased significantly with increased FPG levels, regression analysis with copeptin as the dependent variable revealed that the copeptin level associated independently with HbA1c, but not with FPG. Therefore, we suggest that the increase in the plasma copeptin level is closely associated with the gradual increase of glycated hemoglobin following increasing FPG levels during early diabetes development. Changes in copeptin levels may appear in the earlier stage of T2DM; that is, a chronic stress response may occur when FPG is ≥ 5.6 mmol/L, which may stimulate the hypothalamus to secrete a large amount of copeptin into the blood circulation.
Copeptin (reflecting AVP) is a hypothalamic-regulating neuroendocrine factor and has an important influence on the body’s glucose metabolism, as AVP has been shown to stimulate insulin-induced glucagon secretion during hypoglycemia (Kim et al. 2021). In the normal adolescent population, insulin resistance correlates positively with copeptin (Thomsen et al. 2019). In obese and insulin resistant children, serum copeptin levels are significantly increased, and regression analysis shows that when copeptin is used as the dependent variable, it correlates independently with BMI, WC, WHR, TG, FPG, ALT, SBP, DBP and HOMA-IR (Yin et al. 2020). The copeptin level in patients with metabolic syndrome is significantly higher than that in patients without metabolic syndrome, and the incidence of metabolic syndrome in the fourth quartile of the plasma copeptin is as high as 70%–100% (Penit et al. 1983). Other scholars suggest that the copeptin level of patients with newly diagnosed T2DM is significantly higher than that of normal people, but is not different from that of patients with prediabetes (impaired glucose tolerance and (or) impaired fasting plasma glucose), and the increased serum copeptin level in subjects with newly diagnosed T2DM correlates positively with stress (Madhu et al. 2020).
Several studies have confirmed that achieving aerobic fitness (Traustadottir et al. 2005) and increasing water intake to promote metabolism (Brunkwall et al. 2020) decreases plasma copeptin levels and reduces the HPA axis stress response. This suggests that copeptin may be a potential indicator for early medical intervention to prevent progression of T2DM and its complications. Copeptin activates the HPA axis, resulting in various endocrine disorders, including decreased levels of thyroid hormone, growth hormone, and gonadal hormones, and increased levels of cortisol (Volpi et al. 2004). Cortisol is an important endocrine hormone that increases the blood glucose level by reducing insulin-dependent glucose uptake, promoting glucagon secretion, and increasing glycogenolysis. At the same time, the elevated cortisol level can also induce eating behavior and increase food intake, and thereby increase the risk of obesity (Cavagnini et al. 2000). During the prediabetes stage, the elevated copeptin concentration can predict diabetes onset and abdominal obesity, suggesting that the development of T2DM may be associated with the increase of copeptin secretion caused by fat accumulation in the abdominal wall (Enhorning et al. 2013). However, in the present study, copeptin in patients with prediabetes and diabetes did not correlate with the main obesity-related indexes, such as BMI, WC, and WHR, nor with the blood lipid indicators, such as TC, HDL, LDL, and TG, which agrees with the results of studies investigating patients with symptoms related to the metabolic synthesis (Penit et al. 1983). Although earlier animal experiments found that stress is associated with plasma cortisol levels (Kaplan et al. 1996), studies of patients with obesity and cardiometabolic diseases have not found that increased plasma copeptin levels are associated with cortisol levels (van der Valk et al. 2020). In the present study, BMI, WC, WHR, TG, and LDL increased significantly with the gradual increase in FPG, but increases in these indicators did not correlate with plasma copeptin levels.
Patients with prediabetes and T2DM often have comorbid obesity and nonalcoholic fatty liver disease (NAFLD). A study of patients with NAFLD showed that obese patients with NAFLD had significantly higher copeptin levels than obese patients without NAFLD and non-obese patients, and the increased plasma copeptin level correlated independently with NAFLD severity (Barchetta et al. 2019). In the present study, although we found a significant increase in ALT and AST corresponding with the gradual increases in FPG, abnormal liver function did not correlate with changes in the plasma copeptin level. Consequently, we speculated that obesity and NAFLD in the early stage of T2DM may not be associated with increased plasma copeptin levels; the main cause of obesity may not be AVP-induced increases in cortisol levels; it is more likely that unhealthy lifestyles, including sitting for long periods, lack of exercise, and excessive energy intake, contribute more directly to the development of obesity, insulin resistance, and T2DM.
In the present study, under the same blood glucose levels, no significant differences were found in copeptin levels between the groups with and without hypertension. This result is different from the results of previous studies reporting that increased copeptin levels were closely associated with hypertension (Saleem et al. 2009). This explains in part the critical role of AVP in regulating fluid and electrolyte balance, and its release is stimulated by changes in plasma tension, hypovolemia, or hypotension (Penit et al. 1983). Moreover, AVP is associated with activation of the renin–angiotensin–aldosterone system and renal hemodynamic function (Piani et al. 2021). However, when copeptin is used as the dependent variable for multiple regression analysis, it did not correlate with blood pressure, and changes in copeptin correlated mainly with HbA1c and HOMA-IR independently, suggesting that increased plasma copeptin levels have little effect on blood pressure during the development of T2DM, but appears to associate significantly with insulin resistance and glucose metabolism. Indeed, as indicated in other literature, copeptin has larger molecular weight and its clearance from the circulation is slower than AVP (Fenske et al. 2018; Roussel et al. 2014). The copeptin dynamics and how well this reflects changes in AVP in all patient populations remain to be elucidated.
Diabetes or glucose homeostasis is usually assessed or identified using the surrogate biomarkers FPG and HbA1c in clinical practice (Agnello et al. 2019; Bellia et al. 2019). However, as suggested by the Diabetes Control and Complications Trial (Rohlfing et al. 2002), using a single measurement for FPG could be misleading. In addition, only looking at HbA1c is not enough under conditions that survival of erythrocytes is reduced (Bellia et al. 2019; Giglio et al. 2020). As subjects with impaired FPG are usually associated with other metabolic syndrome, other surrogate biomarkers could be considered for a more comprehensive interpretation of the underlying pathological mechanisms.
The present study intended to ascertain how well copeptin distinguish between prediabetes and T2DM by identifying the optimal cut-off points. For prediabetes (FPG level ≥5.6 and < 7.0 mmol/L), the optimal cut-off point was 161.46 ng/mL. This suggests that in early development of T2DM, the level of copeptin should be above 162 ng/mL. For T2DM (FPG level ≥7.0 mmol/L), the optimal cut-off point was 271.10 ng/mL. This suggests that when the copeptin level is >271 ng/mL, it is very likely that T2DM has developed. In the present study, high AUC values in ROC analysis revealed that copeptin may be a potential predictor for prediabetes and T2DM (prediabetes 0.922; T2DM 0.883).

Limitations

This study has several limitations, including its retrospective observational design, which has an inferior level of evidence. In addition, the number of included subjects is limited and we cannot rule out selection bias. Moreover, measurements such as osmolality and glomerular filtration rate were lacking, and glucose-mediated osmotic diuresis might be a hemodynamic stimulus for AVP secretion that resulted in elevated copeptin levels. Furthermore, as the BRAHMS Kryptor system is the gold standard for measuring copeptin, the copeptin levels obtained by the ELISA method in the present study might be inaccurate. The actual magnitude of copeptin in T2DM development remains to be elucidated. Further prospective studies with a larger sample are needed to address these issues.

Conclusions

In the early stage of T2DM, when the FPG level is ≥ 5.6 mmol/L, plasma copeptin levels increase significantly, leading to aggravation of insulin resistance and progression of the development of T2DM. Clinically, plasma copeptin has the potential to become an important biomarker for patients with prediabetes, before it either turns into normal glucose tolerance or progresses to T2DM.

Acknowledgements

We would like to thank our students, Chen Shengli, He Nana, Xiao Zixuan, Mei Qinghua, and Ji Wenrui, for their hard work on this project. Thanks also to Dr. Yue Xuefeng for his hard work in data collation and statistical analysis of this project. Thank you to all the staff of the Health Examination Center of the Second Affiliated Hospital of Ningxia Medical Science.

References

Agnello L, Bellia C, Scazzone C, Bivona G, Iacolino G, Gambino CM. et al. 2019. Establishing the 99(th) percentile for high sensitivity cardiac troponin I in healthy blood donors from Southern Italy. Biochemia Medica, 29: 020901.
American Diabetes A. 2021. 2. Classification and Diagnosis of Diabetes: Standards of Medical Care in Diabetes-2021. Diabetes Care, 44: S15–S33.
Baranowska B, and Kochanowski J. 2019. Copeptin - a new diagnostic and prognostic biomarker in neurological and cardiovascular diseases. Neuroendocrinology Letters, 40: 207–214.
Barchetta I, Enhorning S, Cimini FA, Capoccia D, Chiappetta C, Di Cristofano C, et al. 2019. Elevated plasma copeptin levels identify the presence and severity of non-alcoholic fatty liver disease in obesity. BMC Medicine, 17: 85.
Bellia C, Cosma C, Lo Sasso B, Bivona G, Agnello L, Zaninotto M, et al. 2019. Glycated albumin as a glycaemic marker in patients with advanced chronic kidney disease and anaemia: A preliminary report. Scandinavian Journal of Clinical and Laboratory Investigation, 79: 293–297.
Brunkwall L, Ericson U, Nilsson PM, and Enhorning S. 2020. High water intake and low urine osmolality are associated with favorable metabolic profile at a population level: low vasopressin secretion as a possible explanation. European Journal of Nutrition, 59: 3715–3722.
Cavagnini F, Croci M, Putignano P, Petroni ML, and Invitti C. 2000. Glucocorticoids and neuroendocrine function. International Journal of Obesity and Related Metabolic Disorders, 24(Suppl 2): S77–S79.
Dobsa L, and Edozien KC. 2013. Copeptin and its potential role in diagnosis and prognosis of various diseases. Biochemia Medica, 23: 172–190.
Enhorning S, Bankir L, Bouby N, Struck J, Hedblad B, Persson M, et al. 2013. Copeptin, a marker of vasopressin, in abdominal obesity, diabetes and microalbuminuria: the prospective Malmo Diet and Cancer Study cardiovascular cohort. International Journal of Obesity, 37: 598–603.
Enhorning S, Wang TJ, Nilsson PM, Almgren P, Hedblad B, Berglund G, et al. 2010. Plasma copeptin and the risk of diabetes mellitus. Circulation, 121: 2102–2108.
Feller L, Khammissa RAG, Ballyram R, Chandran R, and Lemmer J. 2019. Chronic Psychosocial Stress in Relation to Cancer. Middle East Journal of Cancer, 10: 1–8.
Fenske W, Refardt J, Chifu I, Schnyder I, Winzeler B, Drummond J, et al. 2018. A Copeptin-Based Approach in the Diagnosis of Diabetes Insipidus. New England Journal of Medicine, 379: 428–439.
Flack JM, and Adekola B. 2020. Blood pressure and the new ACC/AHA hypertension guidelines. Trends in Cardiovascular Medicine, 30: 160–164.
Giglio RV, Lo Sasso B, Agnello L, Bivona G, Maniscalco R, Ligi D, et al. 2020. Recent Updates and Advances in the Use of Glycated Albumin for the Diagnosis and Monitoring of Diabetes and Renal, Cerebro- and Cardio-Metabolic Diseases. Journal of Clinical Medicine, 9(11): 3634.
Grazzini E, Breton C, Derick S, Andres M, Raufaste D, Rickwaert F, et al. 1999. Vasopressin receptors in human adrenal medulla and pheochromocytoma. The Journal of Clinical Endocrinology and Metabolism, 84: 2195–203.
Hems DA, and Whitton PD. 1973. Stimulation by vasopressin of glycogen breakdown and gluconeogenesis in the perfused rat liver. Biochemical Journal, 136: 705–709.
Kaplan JR, Adams MR, Clarkson TB, Manuck SB, Shively CA, and Williams JK. 1996. Psychosocial factors, sex differences, and atherosclerosis: Lessons from animal models. Psychosomatic Medicine, 58: 598–611.
Kim A, Knudsen JG, Madara JC, Benrick A, Hill TG, Abdul Kadir L, et al. 2021. Arginine-vasopressin mediates counter-regulatory glucagon release and is diminished in type 1 diabetes. eLife, 10: e72919.
Li B, Li N, Guo S, Zhang M, Li J, Zhai N, et al. 2020. The changing features of serum adropin, copeptin, neprilysin and chitotriosidase which are associated with vascular endothelial function in type 2 diabetic retinopathy patients. Journal of Diabetes and its Complications, 34: 107686.
Lu M, Soltoff SP, Yaney GC, and Boyd AE, 3rd. 1993. The mechanisms underlying the glucose dependence of arginine vasopressin-induced insulin secretion in beta-cells. Endocrinology, 132: 2141–2148.
Madhu SV, Aslam M, Siddiqui AA, Goyal S, and Mishra BK. 2020. Association of Copeptin With Sense of Coherence in Individuals With Varying Degrees of Glucose Intolerance. Psychosomatic Medicine, 82: 181–186.
Melander O. 2016. Vasopressin, from Regulator to Disease Predictor for Diabetes and Cardiometabolic Risk. Annals of Nutrition and Metabolism, 68(Suppl 2): 24–28.
Montero S, Mendoza H, Valles V, Lemus M, Alvarez-Buylla R, and De Alvarez-Buylla ER. 2006. Arginine-vasopressin mediates central and peripheral glucose regulation in response to carotid body receptor stimulation with Na-cyanide. Journal of Applied Physiology, 100: 1902–1909.
Noor T, Hanif F, Kiran Z, Rehman R, Khan MT, Haque Z, et al. 2020. Relation of Copeptin with Diabetic and Renal Function Markers Among Patients with Diabetes Mellitus Progressing Towards Diabetic Nephropathy. Archives of Medical Research, 51: 548–555.
Penit J, Faure M, and Jard S 1983. Vasopressin and angiotensin II receptors in rat aortic smooth muscle cells in culture. American Journal of Physiology, 244: E72–E82.
Piani F, Reinicke T, Lytvyn Y, Melena I, Lovblom LE, Lai V, et al. 2021. Vasopressin associated with renal vascular resistance in adults with longstanding type 1 diabetes with and without diabetic kidney disease. Journal of Diabetes and its Complications, 35: 107807.
Rohlfing CL, Wiedmeyer HM, Little RR, England JD, Tennill A, and Goldstein DE. 2002. Defining the relationship between plasma glucose and HbA(1c): analysis of glucose profiles and HbA(1c) in the Diabetes Control and Complications Trial. Diabetes Care, 25: 275–278.
Roussel R, El Boustany R, Bouby N, Potier L, Fumeron F, Mohammedi K, et al. 2016. Plasma Copeptin, AVP Gene Variants, and Incidence of Type 2 Diabetes in a Cohort From the Community. The Journal of Clinical Endocrinology and Metabolism, 101: 2432–2439.
Roussel R, Fezeu L, Marre M, Velho G, Fumeron F, Jungers P, et al. 2014. Comparison between copeptin and vasopressin in a population from the community and in people with chronic kidney disease. The Journal of Clinical Endocrinology and Metabolism, 99: 4656–4663.
Saleem U, Khaleghi M, Morgenthaler NG, Bergmann A, Struck J, and Mosley HT. Jr. 2009. Plasma carboxy-terminal provasopressin (copeptin): a novel marker of insulin resistance and metabolic syndrome. The Journal of Clinical Endocrinology and Metabolism, 94: 2558–2564.
Smaradottir MI, Ritsinger V, Gyberg V, Norhammar A, Nasman P, and Mellbin LG. 2017. Copeptin in patients with acute myocardial infarction and newly detected glucose abnormalities - A marker of increased stress susceptibility? A report from the Glucose in Acute Myocardial Infarction cohort. Diabetes and Vascular Disease Research, 14: 69–76.
Sujana C, Seissler J, Jordan J, Rathmann W, Koenig W, Roden M, et al. 2020. Associations of cardiac stress biomarkers with incident type 2 diabetes and changes in glucose metabolism: KORA F4/FF4 study. Cardiovascular Diabetology, 19: 178.
Thomsen CF, Dreier R, Goharian TS, Goetze JP, Andersen LB, Faber J, et al. 2019. Association of copeptin, a surrogate marker for arginine vasopressin secretion, with insulin resistance: Influence of adolescence and psychological stress. Peptides, 115: 8–14.
Traustadottir T, Bosch PR, and Matt KS. 2005. The HPA axis response to stress in women: effects of aging and fitness. Psychoneuroendocrinology, 30: 392–402.
Van Der Valk ES, Van Der Voorn B, Iyer AM, Van Den Berg SAA, Savas M, De Rijke YB., et al. 2020. In adults with obesity, copeptin is linked with BMI but is not associated with long-term exposure to cortisol and cortisone. European Journal of Endocrinology, 183: 669–676.
Volpi S, Rabadan-Diehl C, and Aguilera G. 2004. Vasopressinergic regulation of the hypothalamic pituitary adrenal axis and stress adaptation. Stress, 7: 75–83.
Wannamethee SG, Welsh P, Papacosta O, Lennon L, Whincup PH, and Sattar N. 2015. Copeptin, Insulin Resistance, and Risk of Incident Diabetes in Older Men. The Journal of Clinical Endocrinology and Metabolism, 100: 3332–3339.
Whiting DR, Guariguata L, Weil C, and Shaw J. 2011. IDF diabetes atlas: global estimates of the prevalence of diabetes for 2011 and 2030. Diabetes Research and Clinical Practice, 94: 311–321.
Xie X, Bai G, Liu H, Zhang L, He Y, Qiang D, et al. 2021. Early Predictors in the Onset of Type 2 Diabetes at Different Fasting Blood Glucose Levels. Diabetes, Metabolic Syndrome and Obesity: Targets and Therapy, 14: 1485–1492.
Yin C, Liu W, Xu E, Zhang M, Lv W, Lu Q, et al. 2020. Copeptin and Nesfatin-1 Are Interrelated Biomarkers with Roles in the Pathogenesis of Insulin Resistance in Chinese Children with Obesity. Annals of Nutrition & Metabolism, 76: 223–232.

Information & Authors

Information

Published In

cover image FACETS
FACETS
Volume 7Number 1January 2022
Pages: 1244 - 1257
Editor: Charles Couillard

History

Received: 28 January 2022
Accepted: 11 July 2022
Version of record online: 15 September 2022

Data Availability Statement

The datasets used and (or) analyzed during the current study are available from the corresponding author on request.

Key Words

  1. copeptin
  2. fasting plasma glucose
  3. insulin resistance
  4. prediabetes

Sections

Subjects

Authors

Affiliations

Xiaomin Xie [email protected]
Department of Endocrinology: The First People’s Hospital of Yinchuan, Yinchuan 750001, China
Xiaomin Xie and Guirong Bai are co-first authors.
Guirong Bai
Department of Endocrinology: The First People’s Hospital of Yinchuan, Yinchuan 750001, China
Xiaomin Xie and Guirong Bai are co-first authors.
Dan Qiang
Department of Endocrinology: The First People’s Hospital of Yinchuan, Yinchuan 750001, China
Li Zhang
Department of Endocrinology: The First People’s Hospital of Yinchuan, Yinchuan 750001, China
Huili Liu
Department of Endocrinology: The First People’s Hospital of Yinchuan, Yinchuan 750001, China
Yan Ting He
Department of Endocrinology: The First People’s Hospital of Yinchuan, Yinchuan 750001, China
Xiaojuan Zhang
Department of Endocrinology: The First People’s Hospital of Yinchuan, Yinchuan 750001, China

Author Contributions

XX conceived and designed the study.
DQ, HL, and XZ performed the experiments/collected the data.
LZ analyzed and interpreted the data.
GB and YTH drafted or revised the manuscript.

Competing Interests

The authors declare that they have no competing interests

Funding Information

This work is supported by special projects for the central government to guide local technological development from the Science [2019] No. 49 and Technology Department of Ningxia Hui Autonomous Region (Key R&D Programs of Ningxia, No. 2020BEG03069), Ningxia Natural Science Foundation Project (Number: 2018AAC03228), and Natural Science Foundation of Ningxia (No.2022AAC03732).

Metrics & Citations

Metrics

Other Metrics

Citations

Cite As

Export Citations

If you have the appropriate software installed, you can download article citation data to the citation manager of your choice. Simply select your manager software from the list below and click Download.

There are no citations for this item

View Options

View options

PDF

View PDF

Get Access

Media

Media

Other

Tables

Share Options

Share

Share the article link

Share on social media