Potential impacts of reduced seafood consumption on myocardial infarction among coastal First Nations in British Columbia, Canada
Abstract
The objective of this study is to examine the potential cardiovascular risk of climate-related declines in seafood consumption among First Nations in British Columbia by assessing the combined effects of reduced omega-3 fatty acids and mercury intake from seafood on the risk of myocardial infarction (MI) in 2050 relative to 2009. The data were derived from the First Nations Food, Nutrition, and Environment Study. Seafood consumption among 369 randomly selected participants was estimated, and hair mercury concentrations were measured. Declines in seafood consumption were modelled based on previously projected climate change scenarios, and the associated changes in nutrients and contaminants were used to estimate the cardiovascular risk. Reduced seafood consumption was projected to increase the risk of MI by 4.5%–6.5% among older individuals (≥50 years), by 1.9%–2.6% in men, and by 1.3%–1.8% in women under lower and upper climate change scenarios, respectively. Reduced seafood consumption may have profound cardiovascular implications. Effective strategies are needed to promote sustainable seafood harvests and access to seafood for coastal First Nations.
Introduction
First Nations people experience significant socio-economic and health disparities compared with non-Indigenous populations in Canada (Reading and Wein 2009). They continue to face serious health challenges, including shorter life expectancy, high rates of mortality, and chronic diseases such as obesity, diabetes, and cardiovascular problems (Reading and Wein 2009; FNIGC 2012; Tjepkema et al. 2012; Young 2012; Bruce et al. 2014). Cardiovascular diseases (CVDs) are conditions that describe diseases of the heart and/or blood vessels, including ischemic heart diseases (IHD), cerebrovascular disease (stroke), heart failure, congenital heart disease, inflammatory, rheumatic, and hypertensive heart diseases (WHO/WHF/WSO 2011). Overweight and obesity, a sedentary lifestyle, smoking, and eating a diet high in saturated fat, sodium, and sugar are well-known risk factors for CVD (Cannon 2007).
Among First Nations, CVD remains the second leading cause of death (FNHA 2012; Health Canada 2014; Reading 2015). Historically, the mortality from CVD in First Nations was lower than that among the general Canadian population (Young 2012). Studies conducted in recent decades, however, have demonstrated that heart diseases in First Nations have increased compared with the general Canadian population (RHS 1999). The First Nations Regional Health Survey (RHS) (2002/03) found that the overall prevalence of self-reported heart disease was slightly higher in First Nations than in non-Indigenous people in Canada (7.6% vs. 5.6%) whereas, among older individuals (50–59 years), the rate of heart disease was more than two times higher than in the general Canadian population (11.5% vs. 5.5%) (FNC 2005).
In British Columbia (BC), First Nations living on reserves had rates for ischemic heart diseases 25% higher than the rates among other residents in the province (BC Provincial Health Officer 2009). In 2008/10, the RHS reported that 5.7% of First Nations in Canada (FNIGC 2012) and 6.4% of First Nations in BC were diagnosed with heart disease (First Nations Health Authority 2012). The data on the prevalence of acute myocardial infarction (MI) in First Nations, however, are limited (Reading 2015). Nevertheless, the mortality rates due to MI were estimated to be 25% higher in First Nations men and 55% higher in First Nations women compared with non-Indigenous populations in Canada (Tjepkema et al. 2012).
Harvesting, consuming, and sharing traditional foods (i.e., all culturally acceptable foods within a particular local, natural environment) contribute to physical fitness, provide an abundance of essential nutrients, and are vital for the cultural identity, spiritual and mental health, and social well-being of First Nations (Egeland et al. 2001; Kuhnlein and Receveur 2007; Sheehy et al. 2015). In BC, traditional diets of First Nations include a rich diversity of marine foods such as fish, shellfish, seaweeds, and marine mammals (Mos et al. 2004; Chan et al. 2011), which supply significant sources of protein, micronutrients, and essential polyunsaturated omega-3 fatty acids (n-3 FAs), such as eicosapentaenoic acid (EPA) and docosahexaenoic acid (DHA) (Sheehy et al. 2015).
Health effects of fish and dietary n-3 FAs have been intensively investigated since the first study in the 1970s, demonstrating an inverse relationship between n-3 FAs and IHD among Greenland Inuit (Bang et al. 1971). Following this observation, several clinical and epidemiological studies continue to demonstrate protective effects of fish and dietary n-3 FAs intakes against CVD, such as stroke, MI (Leung Yinko et al. 2014; Elagizi et al. 2018), reduced cardiac death, and total mortality (Breslow 2006; Leung Yinko et al. 2014; Shahidi and Ambigaipalan 2018). These cardioprotective effects of EPA and DHA are attributed to the beneficial modulation of several risk factors for CVD (Innes and Calder 2020). Many prospective studies have demonstrated that EPA and DHA lower plasma triglycerides, improve high-density lipoprotein (HDL) cholesterol, lower blood pressure, inhibit platelet aggregation, and improve endothelial function and vascular reactivity (Yashodhara et al. 2009; McLennan 2014; Shahidi and Ambigaipalan 2018). EPA and DHA have also been reported to reduce inflammatory markers such as acute-phase protein, C-reactive protein, pro-inflammatory cytokines, tumour necrosis factor (TNF)-α, and interleukin (IL)-6 (McLennan 2014; Innes and Calder 2020).
Although dietary n-3 FAs confer a wide range of cardiovascular benefits, they can be attenuated by the adverse effects of the presence of methylmercury (MeHg) in fish (Lipfert and Sullivan 2006; Laird et al. 2013). Indeed, consuming traditionally harvested fish and marine mammals constitutes the major pathway of MeHg exposure among Indigenous people (Laird et al. 2013). The adverse effects of MeHg on the nervous system, growth and development of fetuses and children, and immune function are well-established (Bjørklund et al. 2017; Ha et al. 2017). Recent evidence also indicates that chronic exposure to MeHg may increase the risk of CVD (Hu et al. 2018), including MI (Genchi et al. 2017). The mechanism by which MeHg produces toxic effects on the cardiovascular system is not fully elucidated, but it is believed to increase oxidative stress, increase the production of free radicals, affect heart rate variability, and promote inflammation, hypertension, and plaque development (Genchi et al. 2017). The intake of EPA + DHA and MeHg from seafood depends on the concentrations of EPA + DHA and MeHg, which significantly vary between seafood species and across different regions (Laird et al. 2013; Hu et al. 2017; Chan et al. 2020).
Current seafood consumption contributes to reaching the daily recommendations of EPA and DHA (Marushka et al. 2018a, 2018b). However, traditional food consumption among First Nations has been declining over the past decades and has been gradually replaced with nutrient-poor market foods (Kuhnlein and Receveur 1996; Johnson-Down and Egeland 2013; Sheehy et al. 2013). Several socio-economic and environmental factors, such as poverty, food insecurity, and concerns about the risk of environmental exposure, are contributing to the diet transition (Chan et al. 2011; Kuhnlein et al. 2013). Furthermore, climate change exacerbates the nutrition transition through its impacts on traditional food systems (Ford et al. 2010). Climate change was documented to decrease the abundance and availability of wildlife species by affecting the magnitude and cycles of animals’ growth, reproduction, distributions, and migrations in oceans, rivers, and on land (Hori 2010; Lemmen et al. 2016). Weatherdon et al. (2016) found that climate change may reduce the abundance and alter the distribution of the majority of marine species harvested by coastal First Nations in BC (Weatherdon et al. 2016). We have previously projected the impact of climate change on seafood consumption and the diet quality of coastal First Nations in BC and estimated a decrease in the intake of essential nutrients from seafood by 21% under lower (Representative Concentration Pathway [RCP] 2.6) and 31% under higher (RCP 8.5) climate change scenarios by 2050 relative to 2000 (Marushka et al. 2018b). This follow-up study further investigated the potential implications for human health. The objective of this study was to model the effects of projected declines in seafood consumption on the relative risk (RR) of MI in coastal First Nations in BC under lower and upper climate change scenarios (i.e., 21% and 31%). Specifically, we modelled the combined effects of reduced EPA + DHA and MeHg intake from seafood on the RR of MI.
Methodology
Population and study design
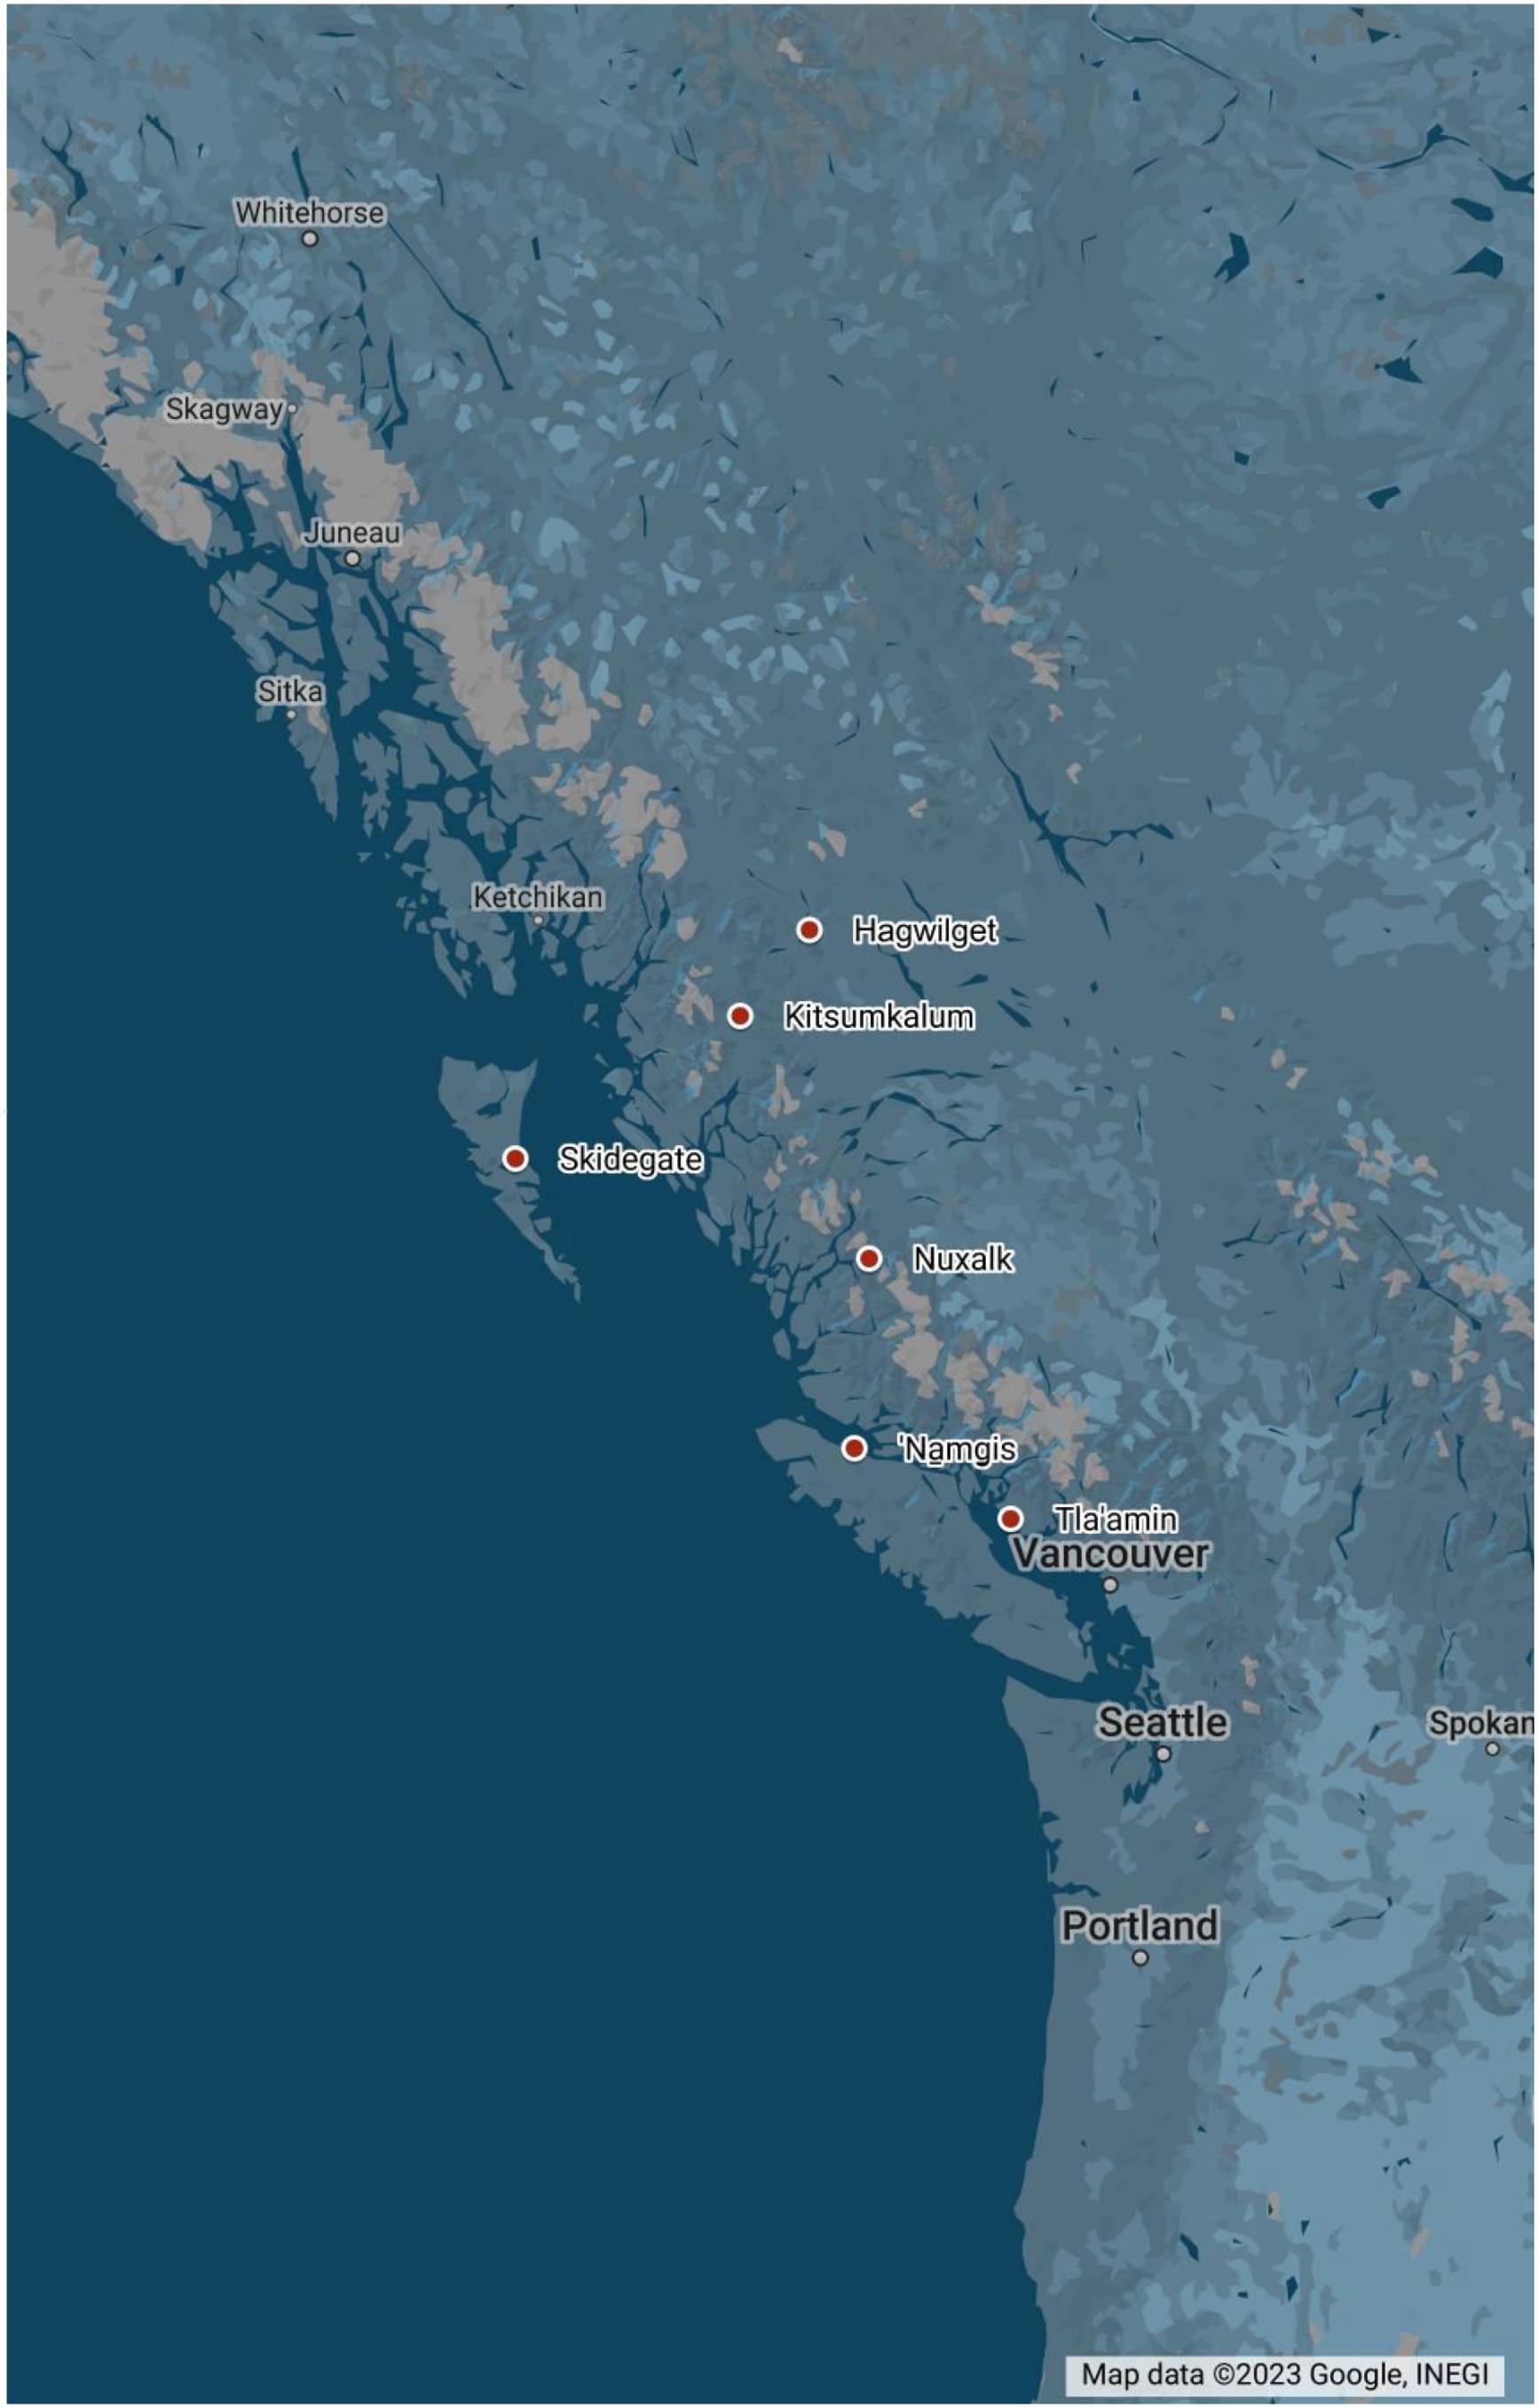
The First Nations Food Nutrition and Environment Study (FNFNES) is a regionally representative survey that was designed to assess traditional food consumption patterns, total diets, and food-related exposure to environmental contaminants in First Nations people living on reserves, south of the 60th parallel across Canada (Chan et al. 2019). In BC, 21 First Nations communities were randomly selected using a combined ecozone area framework to ensure that the diversity in ecozones and cultural areas was represented in the sampling strategy (Chan et al. 2011). An ecozone is a large geographical region identified based on the distribution patterns of plants, animals, geographical characteristics, and climate (www.ecozone.ca). Sampling proceeded in three stages: (1) primary sampling unit—a systematic random sampling of communities within each region; (2) secondary sampling unit—a random sampling of 125 households within each selected community; and (3) tertiary sampling unit—one randomly selected adult in each household who was self-identified as being a First Nations person living on reserve aged 19 and older was asked to participate in the study. For the purpose of this study, data from the six First Nations communities in the Pacific Maritime ecozone were included (Fig. 1). There are 106 First Nations communities in the Pacific Maritime ecozone with a total population of 33,877. In total, 369 participants aged 19 years and older who self-identified as First Nations living on-reserve were recruited in six First Nations communities (total population of 3,566) in this study in the fall of 2008 and 2009. The participation rate in the Pacific Maritime ecozone was 67%. All data were weighted to obtain representative estimates of the total First Nations population living in coastal British Columbia (33,877). The design weights were adjusted based on the assumption that the responding communities represent both responding and non-responding communities (Chan et al. 2011).
Fig. 1.
The study was approved by the Ethical Review Boards at Health Canada, the University of Northern British Columbia, the University of Ottawa, and the Université de Montréal.
Modelling framework
We modelled the increased risk of MI under the projected scenarios of a decline in nutrient intake from seafood with the method developed by Wennberg et al. (2012). This model describes the combined effect of EPA + DHA and MeHg exposure on the risk of MI and is adjusted for confounding factors such as smoking, BMI, blood pressure, diabetes, apolipoprotein (apo) B and apo A-I, education, alcohol intake, and physical activity (Wennberg et al. 2012). The modelling equations and parameters are described below.
MI risk under projected seafood intake scenarios
Equation 1 estimates the RR of MI (RRMI) in scenarios of a decline in seafood consumption. where baseline serum EPA + DHA levels were adopted from James Bay Cree First Nations (Dewailly et al. 2002), and baseline hair mercury (Hg) levels were measured from FNFNES participants in BC. Changes in EPA + DHA and hair Hg levels were estimated using eqs. 2–5. The projected serum EPA + DHA and hair Hg values were calculated by subtracting the change values from the baseline values.
(1)
Baseline serum EPA + DHA and hair Hg
Serum EPA + DHA
The best available data on the n-3 FAs profile of a First Nation population were from the Cree Nation of Eeyou Istchee from the 1991 Santé Québec Health Survey (Dewailly et al. 2002). Both the FNFNES participants in BC and the Cree Nation of Eeyou Istchee consumed a similar amount of fish (approximately 60 g/day). Baseline EPA and DHA profiles in plasma phospholipids (weight% of total lipids) for the FNFNES participants in BC were assumed to be the same as those of members of the Cree Nation of Eeyou Istchee. EPA and DHA in serum were assumed to be the same as in plasma phospholipids for the main analysis. Sensitivity analysis with converted serum EPA and DHA is provided in the supplemental material.
Hair Hg
Hair Hg concentrations were measured for the FNFNES participants. Data on total hair Hg were available from 121 participants. Details on the hair sampling methodology are presented in Chan et al. (2011). Briefly, each hair bundle was cut into 1 cm segments, starting from the scalp end. Three segments were analyzed to determine the level of total mercury in participants’ hair for approximately the last three months. Since MeHg represents 80%–90% of the total mercury in hair, total mercury is commonly used to assess exposure to MeHg (Basu et al. 2018). The limit of quantitation for total mercury was 0.06 ppm (or µg/g) in hair. In total, two hair samples had total mercury concentrations below the limit of detection (LOD). Those values were replaced with ½ of the LOD (e.g., 0.03 µg/g). Hair samples were collected in the fall of 2008–2009 and analyzed in the First Nations and Inuit Health Branch (FNIHB) Laboratory (Chan et al. 2011). Participation in hair sampling was voluntary and based on informed written consent after a verbal and written explanation of the project component (Chan et al. 2011).
Baseline seafood consumption, EPA + DHA and methyl mercury intake
Seafood consumption and EPA-DHA intake
Baseline seafood consumption was estimated from the 24 h dietary recall and Food Frequency Questionnaire (FFQ) from FNFNES 2008–09. The FFQ collected information on the frequency of consumption of all available traditional foods during the four seasons of the prior year and was representative of each participating community. Overall, 208 traditional food items were included in the FFQ. Seafood species comprised 65 food items, including fish (n = 41), shellfish (n = 16), seaweed (n = 4), and marine mammals (n = 4).
The mean portion size of each corresponding food item was calculated from the 24 h dietary recall. The daily intake of each seafood species (grams/day) was estimated by totalling the number of days in the past four seasons when a particular species was consumed, multiplied by the mean portion size, and divided by 360 days (a year included four seasons of 90 days each). The total intake of seafood was calculated as the sum of all seafood species consumed per day. The Canadian Nutrient File (Health Canada 2015), a national food composition database, was used to estimate the daily intake of EPA + DHA from each seafood item, taking into account the preparation method (i.e., baked or broiled, boiled or raw). The total EPA + DHA intake was calculated using eq. 2:
(2)
Methylmercury (MeHg) intake
The concentrations of mercury in seafood species were measured by the FNFNES. Dietary intake of MeHg from seafood was calculated by multiplying the concentration of MeHg (mg per g) in each species by the total amount of each seafood item consumed per day (g). The total MeHg intake was estimated with eq. 3:
(3)
MeHg concentrations in seafood were measured in the FNFNES 2008–09. Seafood species sampled for contaminant analyses were selected as follows: (1) commonly consumed species in each participating community, (2) those species that are of the most significant concern from an environmental perspective, and (3) those seafood species known to accumulate higher concentrations of contaminants (Chan et al. 2011). Each seafood sample was a composite of tissues from up to five different animals or seaweeds. The collected seafood samples were analyzed for several chemical contaminants, including MeHg at Maxxam Analytics, formerly CANTEST (Burnaby, BC). Detailed information on mercury analyses was published elsewhere (Marushka et al. 2018a).
Serum EPA + DHA and hair Hg change
The change in plasma EPA + DHA concentrations due to the projected decline in nutrient intake (i.e., 21% and 31%) was estimated using eq. 4 developed by Patterson et al. (2015). The projected serum EPA + DHA levels were calculated as the difference between baseline serum EPA + DHA and the estimated changes in serum EPA + DHA.
(4)
The changes in hair Hg due to the projected decline in seafood intake (i.e., 21% and 31%) were estimated using an international standard of hair to blood ratio of 250 and a single-compartment toxicokinetic model (eq. 5) (JECFA 2004 cited from Legrand et al. 2010; WHO 1990). The following assumptions were made for Equation 5: 95% of the MeHg intake is absorbed, 5% of the absorbed amount goes to the blood compartment, the average blood volume for survey participants is 5 L, and the elimination constant is 0.01 per day (WHO 1990). The projected hair Hg was estimated as the difference between baseline hair Hg and the estimated changes in hair Hg.
(5)
Projected climate change scenarios for coastal First Nations’ fisheries
This study used previously published projections of the effects of climate change on the distribution, relative abundance, and richness of 98 seafood species representing commercial and cultural importance to First Nations in coastal BC (Weatherdon et al. 2016). Changes in seafood species distribution were modelled under two climate change scenarios: low emission “strong mitigation” (Representative Concentration Pathway (RCP) 2.6) and high emission “business-as-usual” (RCP 8.5) by 2050 relative to 2000. Model simulations were based on the dynamic bioclimate envelope model (DBEM), which is a mechanistic species distribution model projecting changes in annual average species abundance on a 0.5˚ latitude x 0.5˚ longitude grid of the world ocean (Fernandes et al. 2013; Cheung et al. 2016; Weatherdon et al. 2016). Changes in ocean conditions (e.g., sea surface and bottom temperature, salinity, oxygen concentration, surface advection, and net primary production) under climate change scenarios were projected from the Geophysical Fluid Dynamics Laboratory Earth System Model 2M (GFDLESM 2M) (Weatherdon et al. 2016). The DBEM includes four components: (1) temperature and oxygen-dependent size, growth, and mortality, (2) population carrying capacity estimation in each grid cell based on environmental conditions and species’ habitat preferences, (3) modelled ocean conditions-dependent spatial population dynamics with adult movement, and (4) larval dispersal modelled using an advection–diffusion–reaction model (Fernandes et al. 2013). The total annual average abundance on the Pacific Coast of Canada (within Canada's Exclusive Economic Zone) was calculated for each seafood species. Changes in species richness were inferred for 2050 (average between 2041 and 2060) relative to 2000 (average between 1991 and 2010) (Weatherdon et al. 2016). More details on the BBEM are available elsewhere (Fernandes et al. 2013, Cheung et al. 2016; Weatherdon et al. 2016).
Based on the projected scenarios of seafood catch decline, we modelled potential impacts on seafood consumption patterns and nutrient intakes (such as EPA + DHA) for coastal First Nations in BC (Marushka et al. 2019). In the main analysis, declines in EPA + DHA and mercury intake from seafood were assumed to be the same as declines in seafood consumption/availability, which in turn were assumed to be the same as the projected catch decline of all (mixed) seafood species under the lower (RCP 2.6) and upper (RCP 8.5) climate change scenarios, assuming EPA + DHA and mercury concentrations in seafood remained unchanged over time (Marushka et al. 2019).
Statistical analyses
Data management and analysis were performed with STATA statistical software 14.2 (Stata Corp., College Station, TX, USA). Descriptive statistics included the calculation of means and 95% confidence intervals (95%CI) for continuous variables and proportions (%) for categorical variables. Geometric means (95%CI) were estimated for hair Hg concentrations. Student's t-tests and χ2 tests were used to assess if differences between groups were statistically significant. Results with a p-value of less than 0.05 were considered statistically significant. We estimated total seafood consumption and the intake of the top 10 most consumed seafood species, as well as their contribution to the EPA + DHA and MeHg intake for sex and age groups (19–34 years, 35–49 years, and 50 years and above). Sensitivity analyses on the associations (no effect, 50%, 150%, and 200% of the original effect) between mercury, EPA + DHA, and MI were conducted to estimate the uncertainties in the impact of the projected seafood intake decline on MI risk.
Results
This study included 369 participants (140 men and 229 women) with an average age of 47.6 (±14.3), ranging from 21 to 90 years old. Descriptive characteristics and hair Hg concentrations of the study population are presented in Tables S1a and S1b. The hair Hg concentration was relatively higher in men and older individuals than in women and younger respondents. However, the hair Hg means were considerably below the established Health Canada Hg guideline across all genders and age groups (Legrand et al. 2010).
Tables 1A and 1B summarize the mean daily intake of the most frequently consumed seafood species and the corresponding EPA + DHA and MeHg exposure by gender and age groups. The average daily intake of seafood was 78 g/day in men and 50 g/day in women. Older participants reported significantly higher seafood consumption compared with younger individuals, with a mean intake of 34.8, 45.7, and 78.2 g/day among the 19–34, 35–49, and ≥50 years age groups, respectively. The mean EPA + DHA intake from seafood was higher in men compared with women (0.81 and 0.50 g/day, respectively). Likewise, older individuals (≥50 years) consumed more EPA + DHA (0.81 g/day) than the middle age group (35–50 years) (0.49 g/day) and younger individuals (19–34 years) (0.29 g/day). The average daily intake of MeHg from seafood was 5.10 µg/day in men and 3.14 µg/day in women. Among older participants (≥50 years), the average daily MeHg intake was 5.02 µg/day, which is almost two times higher than in younger age groups (2.60 µg/day in 19–34 years and 2.64 µg/day in 35–49 years). The top 10 most consumed species contributed about 65% to the total seafood consumption, 71% to the EPA + DHA intake, and 67% to the MeHg intake. Salmon species (i.e., sockeye, chinook, coho, and salmon eggs) were the most consumed fish types. Salmon was also the main source of EPA + DHA and the second-highest contributor to the MeHg intake. Halibut, the second most consumed fish, was the major source of MeHg and contributed 31% and 47% of total MeHg intake in men and women, respectively. However, halibut provided a low intake of EPA + DHA (Table S2). Herring roe was the fourth most consumed species and provided a good source of EPA + DHA. Shellfish, such as prawn, clam, and crab, contributed little to either EPA + DHA or MeHg. Overall, the daily intake of MeHg in First Nations was below the established Tolerable Daily Intake (TDI) of 0.47 µg/kg bw/day (Legrand et al. 2010). Men and older respondents had relatively higher estimated MeHg exposure than women and younger individuals due to higher seafood consumption.
Table 1A.
| Men | Women | |||||
|---|---|---|---|---|---|---|
| Food intake g/d (95%CI) | EPA + DHA g/d (95%CI) | MeHg µg/d (95%CI) | Food intake g/d (95%CI) | EPA + DHA g/d (95%CI) | MeHg µg/d (95%CI) | |
| Sockeye salmon | 18.0 (6.5, 29.4) | 0.22 (0.08, 0.36) | 0.77 (0.30, 1.30) | 9.6 (5.7, 13.6) | 0.12 (0.07, 0.17) | 0.41 (0.23, 0.58) |
| Halibut | 6.4 (2.5, 10.2) | 0.01 (0.01, 0.02) | 1.60 (0.64, 2.55) | 5.6 (2.8, 8.3) | 0.01 (0.01, 0.02) | 1.49 (0.74, 2.22) |
| Chinook salmon | 5.8 (1.8, 11.9) | 0.10 (0.00, 0.21) | 0.27 (0.01, 0.55) | 3.1 (1.5, 4.7) | 0.05 (0.02, 0.08) | 0.14 (0.06, 0.22) |
| Herring roe | 2.0 (1.3, 6.6) | 0.05 (0.02, 0.07) | 0.00 (0.00, 0.00) | 3.4 (1.5, 2.4) | 0.08 (0.01, 0.15) | 0.00 (0.00, 0.00) |
| Coho salmon | 3.9 (0.9, 3.1) | 0.04 (0.01, 0.07) | 0.15 (0.05, 0.26) | 1.9 (0.5, 6.4) | 0.02 (0.02, 0.03) | 0.08 (0.06, 0.10) |
| Prawn | 2.9 (1.1, 4.6) | 0.01 (0.00, 0.01) | 0.06 (0.02, 0.10) | 2.0 (0.3, 4.3) | 0.00 (0.00, 0.01) | 0.05 (0.01, 0.09) |
| Clam | 2.3 (1.8, 2.8) | 0.01 (0.01, 0.01) | 0.01 (0.01, 0.01) | 2.1 (0.6, 3.5) | 0.01 (0.00, 0.01) | 0.01 (0.002, 0.02) |
| Salmon egg | 2.5 (0.5, 4.6) | 0.06 (0.03, 0.09) | 0.00 (0.00, 0.00) | 1.9 (0.2, 4.0) | 0.05 (0.02, 0.08) | 0.00 (0.00, 0.00) |
| Chum | 2.6 (1.1, 4.7) | 0.03 (0.01, 0.05) | 0.08 (0.02, 0.14) | 1.9 (0.4, 2.4) | 0.02 (0.00, 0.05) | 0.06 (0.01, 0.11) |
| Crab | 2.9 (1.0, 1.9) | 0.01 (0.00, 0.02) | 0.09 (0.04, 0.14) | 1.4 (1.7, 2.1) | 0.01 (0.00, 0.01) | 0.03 (0.01, 0.06) |
| Top 10 combined | 49.3 (26.6, 72.1) | 0.54 (0.24, 0.84) | 3.03 (1.30, 4.76) | 32.8 (24.1, 44.4) | 0.37 (0.22, 0.51) | 2.27 (1.35, 3.18) |
| Total seafood | 78.0 (37.8, 118.2) | 0.81 (0.40, 1.21) | 5.10 (2.20, 8.00) | 50.1 (35.9, 64.2) | 0.50 (0.31, 0.69) | 3.14 (2.07, 4.21) |
Table 1B.
| 19–34 years | 35–49 years | ≥50 years | |||||||
|---|---|---|---|---|---|---|---|---|---|
| Food intake g/day (95%CI) | EPA + DHA g/day (95%CI) | MeHg µg/day (95%CI) | Food intake g/day (95%CI) | EPA + DHA g/day (95%CI) | MeHg µg/day (95%CI) | Food intake g/day (95%CI) | EPA + DHA g/day (95%CI) | MeHg µg/day (95%CI) | |
| Sockeye salmon | 9.5 (4.7, 14.4) | 0.12 (0.06, 0.18) | 0.41 (0.20, 0.61) | 10.3 (6.1, 14.6) | 0.13 (0.07, 0.18) | 0.44 (0.26, 0.63) | 14.4 (6.2, 22.5) | 0.18 (0.08, 0.28) | 0.61 (0.27, 0.96) |
| Halibut | 4.5 (1.6, 7.4) | 0.01 (0.00, 0.02) | 1.14 (0.41, 1.87) | 4.3 (3.0, 5.6) | 0.01 (0.01, 0.01) | 1.08 (0.76, 1.41) | 7.5 (2.6, 12.4) | 0.02 (0.01, 0.03) | 2.01 (0.63, 3.38) |
| Chinook salmon | 1.0 (0.3, 1.7) | 0.02 (0.01, 0.03) | 0.05 (0.02, 0.08) | 2.6 (2.0, 3.2) | 0.04 (0.03, 0.05) | 0.12 (0.09, 0.15) | 6.1 (0.8, 11.5) | 0.11 (0.01, 0.20) | 0.29 (0.04, 0.54) |
| Herring roe | 0.6 (0.0, 1.2) | 0.01 (0.00, 0.03) | 0.00 (0.00, 0.00) | 2.2 (1.4, 2.9) | 0.05 (0.03, 0.07) | 0.00 (0.00, 0.00) | 4.5 (0.3, 8.8) | 0.11 (0.01, 0.21) | 0.00 (0.00, 0.00) |
| Coho salmon | 1.0 (0.4, 1.6) | 0.01 (0.00, 0.02) | 0.04 (0.02, 0.06) | 1.7 (0.5, 2.9) | 0.02 (0.01, 0.03) | 0.07 (0.02, 0.12) | 3.9 (2.5, 5.2) | 0.04 (0.03, 0.05) | 0.15 (0.10, 0.20) |
| Prawn | 3.6 (0.7, 6.5) | 0.01 (0.00, 0.01) | 0.09 (0.01, 0.17) | 1.7 (0.3, 3.1) | 0.00 (0.00, 0.01) | 0.04 (0.01, 0.07) | 2.1 (0.1, 4.3) | 0.00 (0.00, 0.01) | 0.05 (0.00, 0.10) |
| Clam | 1.2 (0.6, 1.8) | 0.00 (0.00, 0.01) | 0.00 (0.00, 0.01) | 2.1 (1.2, 3.1) | 0.01 (0.00, 0.01) | 0.01 (0.00, 0.01) | 2.6 (0.5, 4.7) | 0.01 (0.00, 0.01) | 0.01 (0.00, 0.02) |
| Salmon egg | 0.5 (0.1, 0.8) | 0.01 (0.00, 0.02) | 0.00 (0.00, 0.00) | 1.1 (0.3, 1.8) | 0.03 (0.01, 0.04) | 0.00 (0.00, 0.00) | 3.6 (0.9, 6.3) | 0.09 (0.02, 0.15) | 0.00 (0.00, 0.00) |
| Chum | 1.6 (0.2, 3.0) | 0.02 (0.00, 0.04) | 0.05 (0.01, 0.09) | 2.0 (-1.0, 5.0) | 0.02 (0.01, 0.06) | 0.06 (-0.03, 0.15) | 2.5 (0.1, 4.8) | 0.03 (0.00, 0.06) | 0.07 (0.00, 0.14) |
| Crab | 2.5 (0.2, 4.7) | 0.01 (0.00, 0.02) | 0.06 (0.01, 0.12) | 1.4 (0.8, 2.0) | 0.01 (0.00, 0.01) | 0.04 (0.02, 0.05) | 1.9 (0.4, 3.3) | 0.01 (0.00, 0.01) | 0.06 (0.02, 0.09) |
| Top 10 combined | 26.1 (13.4, 38.8) | 0.22 (0.13, 0.32) | 1.84 (0.80, 2.88) | 29.4 (21.2, 37.5) | 0.31 (0.24, 0.39) | 1.86 (1.34, 2.37) | 49.0 (27.8, 70.3) | 0.58 (2.43, 0.92) | 3.25 (1.34, 5.15) |
| Total seafood | 34.8 (16.8, 52.7) | 0.29 (0.14, 0.44) | 2.60 (1.35, 3.84) | 45.7 (37.9, 53.6) | 0.49 (0.36, 0.54) | 2.64 (2.06, 3.23) | 78.2 (43.3, 113.1) | 0.81 (0.43, 1.20) | 5.02 (2.25, 7.78) |
The modelled effects of the projected decline in seafood consumption on MI risk among coastal First Nations are presented in Fig. 2 and Table S3. Due to the small effect size estimates, we present the percentage change in RR and translate it into the percentage increase in MI risk. We reported the combined effects of reduced EPA + DHA and MeHg intake under lower and upper climate change scenarios (i.e., 21% and 31%). Reduced seafood intake was estimated to increase the risk of MI by 1.9% and 2.6% in men and 1.3% and 1.8% in women under lower and upper climate change scenarios, respectively, by 2050 relative to 2009. When considering age groups, the most prominent adverse effects were observed in participants 50 years of age and older, with the risk of MI projected to increase by 4.5% under lower and 6.5% under upper scenarios of climate change (Fig. 2).
Fig. 2.
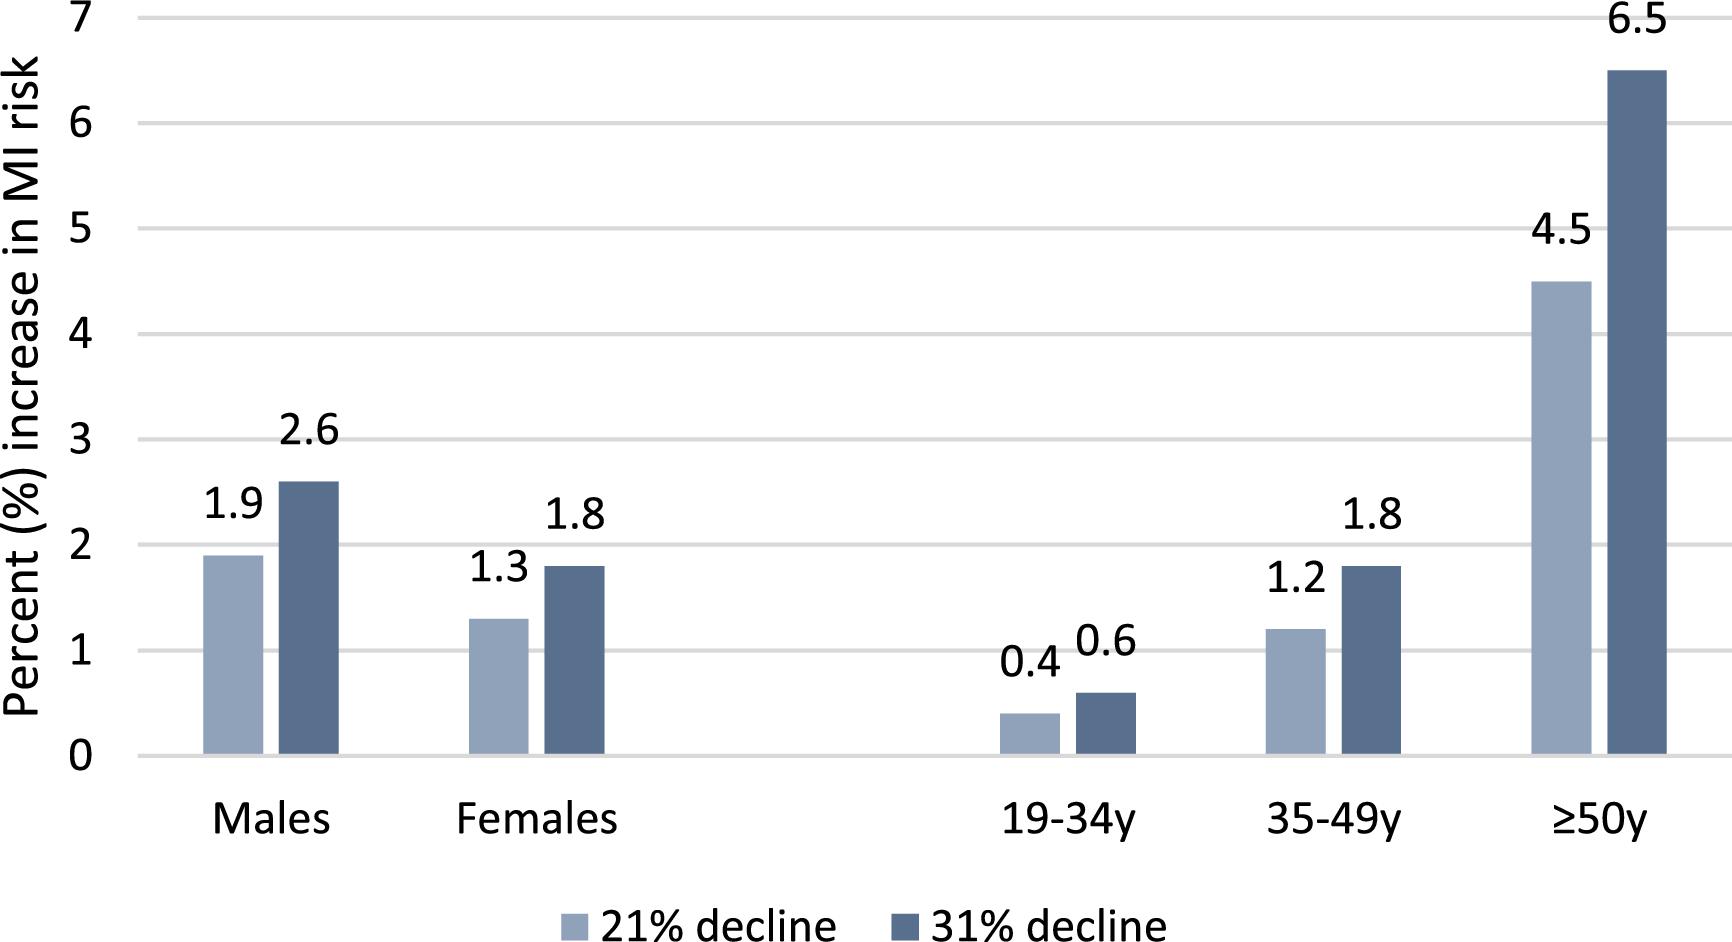
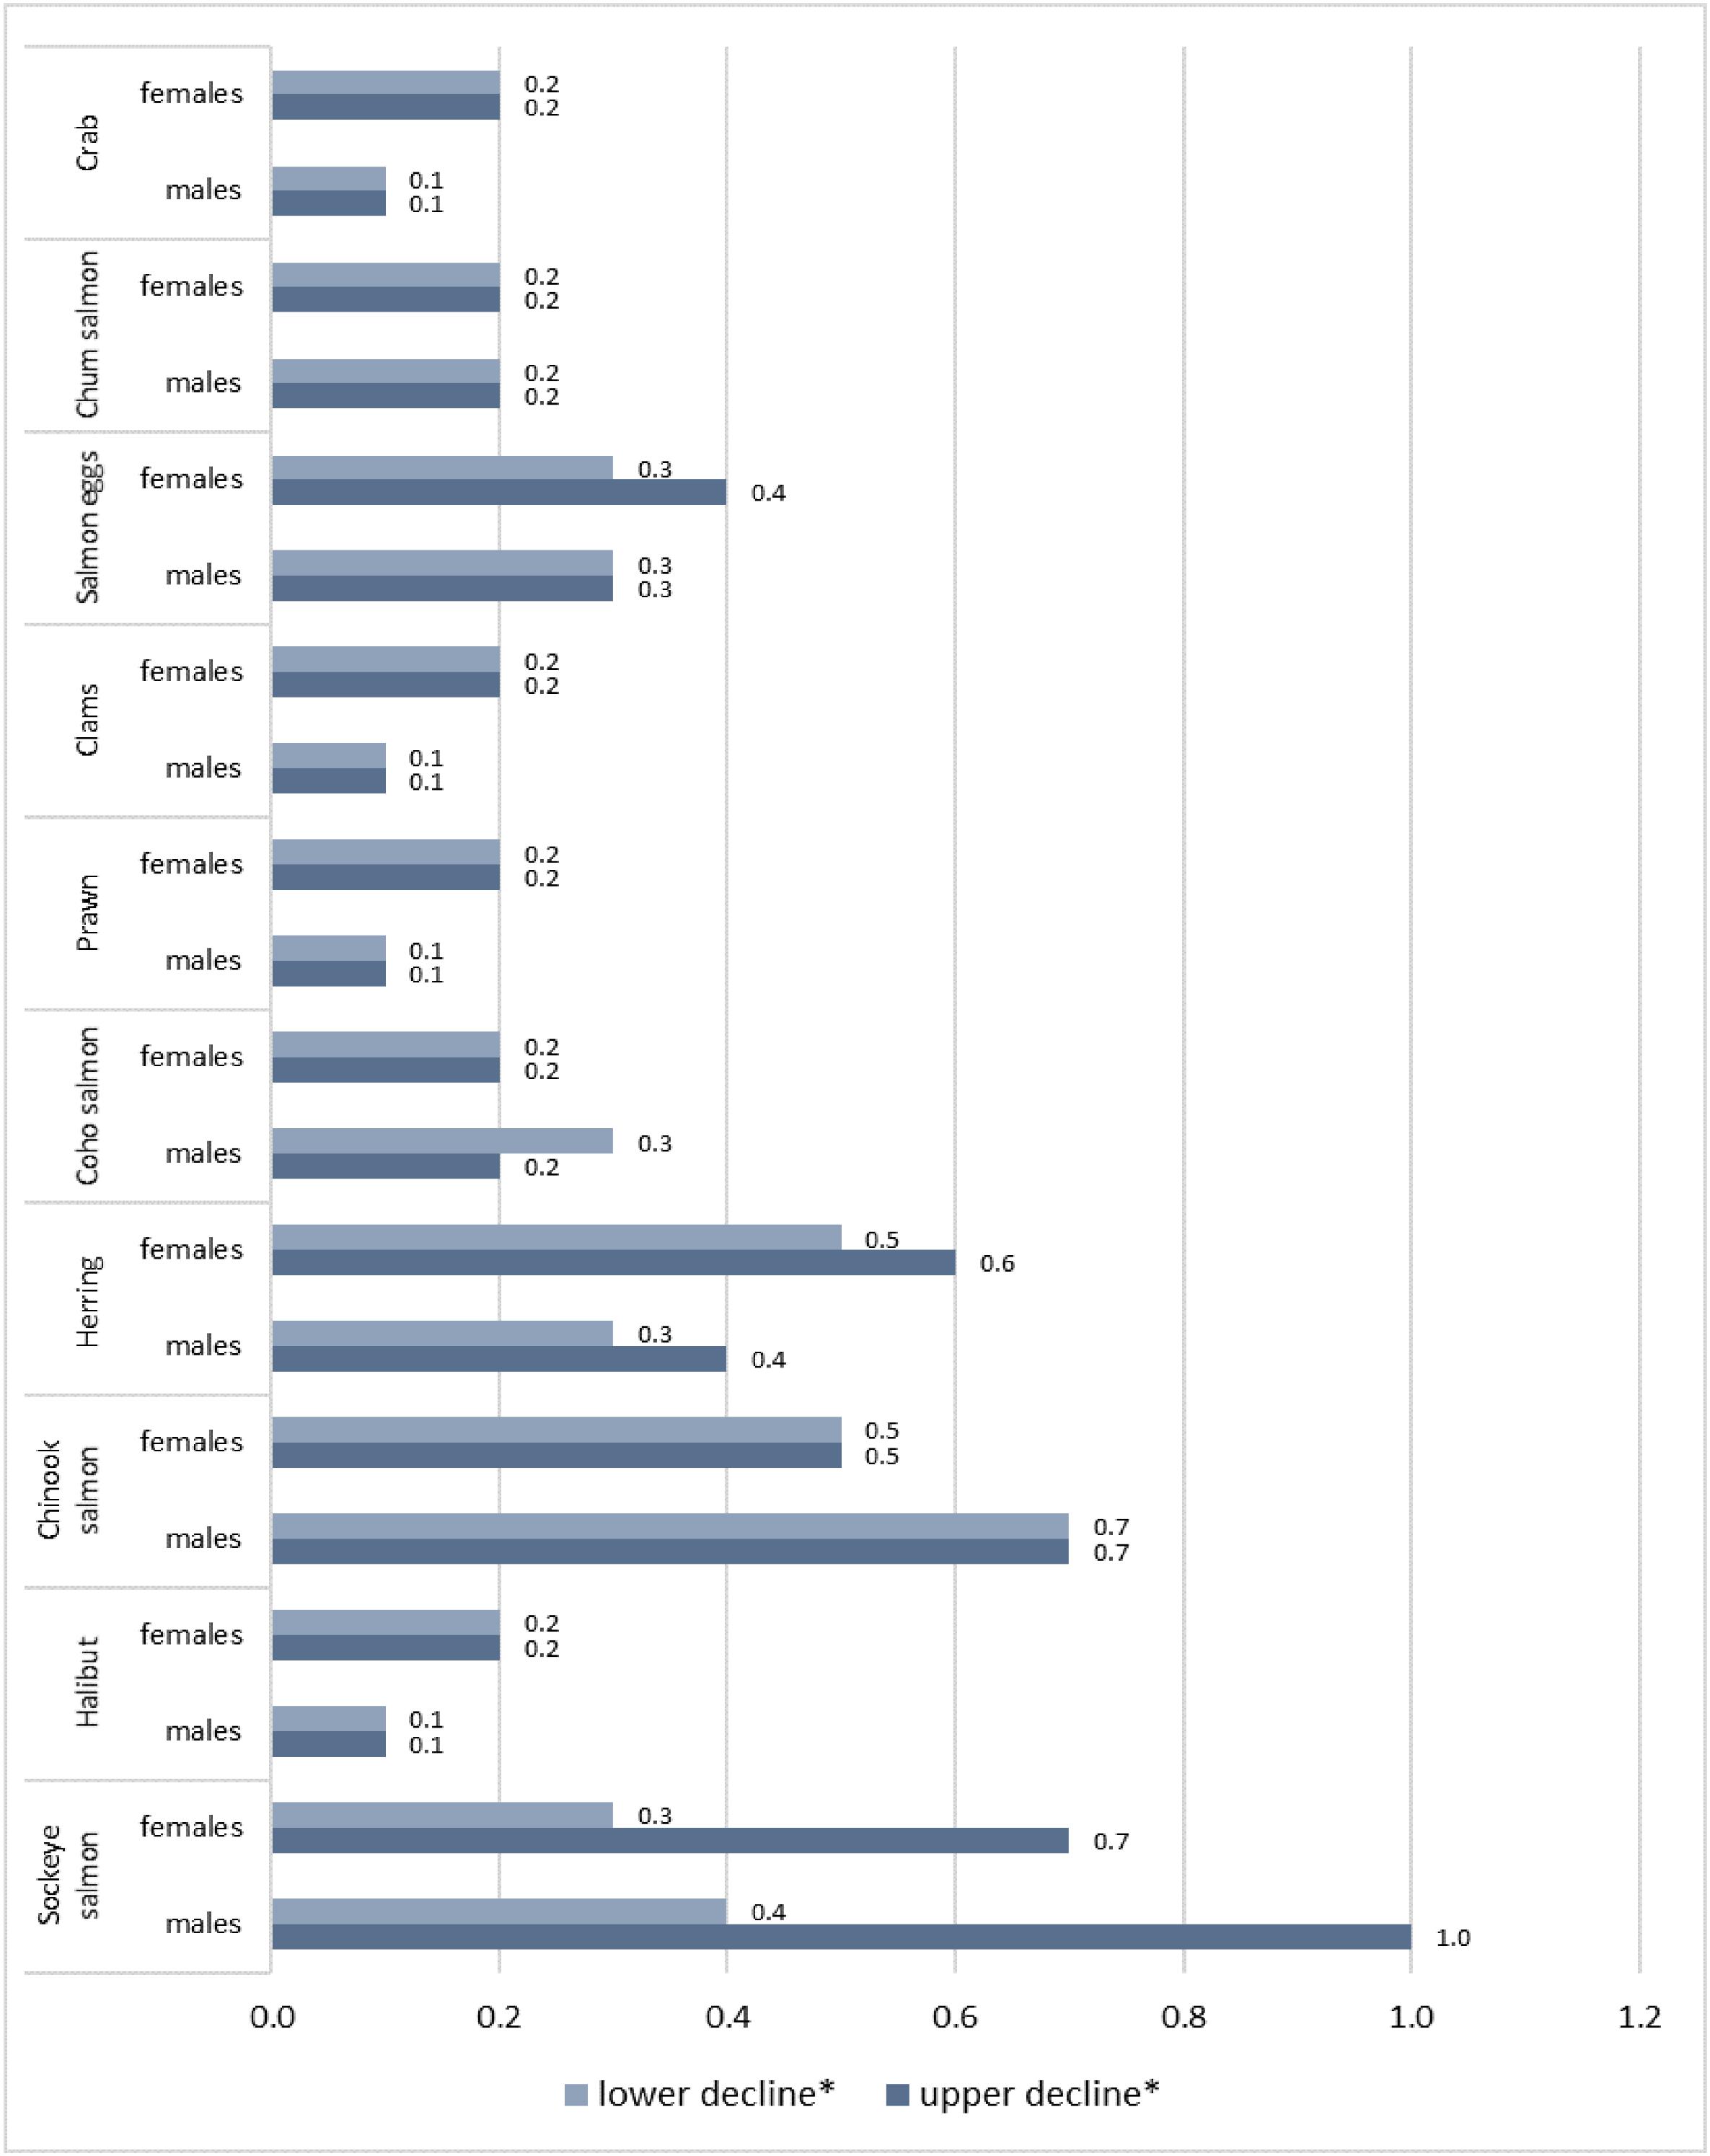
Figure 3 presents the increased MI risk due to the projected decline of the top 10 most consumed seafood species, individually, considering species’ specific data on the decline (Table S4). The most pronounced adverse effects on MI were observed for salmon species and herring, with the increased risk of MI ranging from 0.2% to 0.7% under lower and from 0.2% to 1.0% under upper climate change scenarios (Fig. 3 and Table S5). These species were projected to experience the greatest relative impact of climate change (Table S4). In addition, they contributed relatively high sources of EPA + DHA. The individual effects of reduced halibut and shellfish species were not significant due to their relatively low daily consumption as well as low concentrations of EPA + DHA.
Fig. 3.
Discussion
Although CVD has been decreasing in Canada (PHAC 2018), First Nations continue to experience a growing burden of CVD morbidity and mortality (Reading 2015). In this study, we modelled the effects of the climate-related decline in seafood consumption and consequent dietary EPA + DHA intake on the increased risk of MI among coastal First Nations in BC. Our results showed that reduced EPA + DHA intake may increase the risk of MI by 1.9% and 2.6% in men and by 1.3% and 1.8% in women under lower and upper climate change scenarios, respectively, by 2050 relative to 2009. The most significant impact was observed among older individuals 50 years of age and over, with the risk of MI increasing by 4.5% and 6.5% under the two climate change scenarios, respectively. When considering individual seafood driving this health risk, the most prominent adverse effects on MI risk were the estimated decline in salmon species, such as sockeye (0.4% to 1.0%) and chinook (0.5% to 0.7%) since they are the major source of EPA + DHA intake. In addition, salmon was the most consumed species, which reflects its status as a cultural keystone and dominant food source for coastal First Nations. On the other hand, salmon species are among those that are most sensitive to climate change (Weatherdon et al. 2016). For instance, the abundance of chinook salmon was projected to decline by 47.8% and 46.8% under lower and upper climate change scenarios, respectively (Weatherdon et al. 2016). Traditional seafood continues to play an essential role for coastal First Nations, providing significant sources of n-3 FAs. In the present study, seafood supplied 810 mg/day and 500 mg/day of EPA + DHA in men and women, respectively, and 38% (44% of men and 34% of women) of individuals met the recommended daily intake of 500 mg/day, which is considered sufficient to obtain protective effects for primary prevention of CVD (Academy 2014). Overall, First Nations people obtain more n-3 FAs from fish consumption compared with the general Canadian population. A study in a French-Canadian population found that, on average, daily intake of EPA + DHA was 250 mg among males and 270 mg among females (Garneau et al. 2012). Fish and seafood consumption was estimated to be, on average, 100 g/day (ranging from 98 g/day to 108 g/day) among the general Canadian population, while contributing up to 27% of EPA and 75% of DHA from all food sources (Hu and Chan 2020). In contrast, n-3 FAs intake in coastal First Nations in BC was lower than in the Canadian Inuit people, whose traditional diets were mainly composed of fish and marine mammals rich in n-3 FAs. According to Hu et al. (2017), traditional diets provided about 2.3 g and 1.5 g of EPA + DHA daily for men and women, respectively (Hu et al. 2017). Likewise, Dewailly et al. (2001) reported that the Inuit of Nunavik consumed on average 2.1 g/day of EPA + DHA (Dewailly et al. 2001). Indeed, low rates of IHD in the Inuit population were attributed to the high consumption of n-3 FAs (Bang et al. 1971; Dewailly et al. 2001). At the same time, Inuit people are exposed to higher levels of MeHg through the consumption of marine foods, which diminishes the cardioprotective effect of EPA + DHA (Lipfert and Sullivan 2006). Hu et al. (2017) estimated that seafood accounted for about 38 µg/day intake of MeHg for Inuit men and 25 µg/day for Inuit women. In contrast, First Nations in British Columbia had a MeHg intake of about 5.10 µg/day in men and 3.14 µg/day in women, which is 7.5–8 times lower than among the Inuit population. Compared with inland First Nations living in Manitoba and Ontario, coastal First Nations in British Columbia consumed higher amounts of n-3 FAs (Marushka et al. 2017a, 2017b), which reflects differences in geographical diversity and availability of species. In the current study, younger individuals consumed less seafood and consequently had a lower intake of EPA + DHA than older participants. These findings are consistent with previous studies among Indigenous people (Dewailly et al. 2001; Hu et al. 2017; Marushka et al. 2018a) that there might be a nutrition transition from a traditional diet towards store-bought food, resulting in a decline in fish consumption.
Sensitivity analyses showed that EPA + DHA intake and their association with MI are the dominant contributors to MI risk under current and projected seafood consumption scenarios among coastal BC First Nations, given that their exposure to MeHg from seafood is very low (Tables S6 and S7). In addition to omega-3 FAs, seafood is rich in other essential nutrients, such as selenium, that may provide many cardiovascular health benefits. Recent systematic reviews and meta-analyses suggested that selenium intake was associated with decreased risks of CVD incidence and mortality (Jenkins et al. 2020; Kuria et al. 2021). A study among the Inuit population found that high selenium intake from country food may lower the odds ratios for MI associated with mercury exposure (Hu et al. 2017a). However, results on the protective effects of selenium against CVD are still inconclusive.
First Nations continue to experience a disproportional burden of food insecurity (i.e., the inability to afford nutritionally adequate and safe foods), with prevalence rates greatly exceeding those of the non-Indigenous population in Canada (Chan et al. 2011; Tarasuk 2012). Indeed, 41% of on-reserve First Nations in British Columbia reported living in food-insecure households, compared with 8.4% of the general population in British Columbia (Statistics Canada 2010; Chan et al. 2011). Food insecurity is directly related to unhealthy diets reflecting a low intake of essential nutrients and an increased intake of energy from sugar and fatty foods, which in turn increases the risk of CVD. Several studies have demonstrated that trans-fats increase the “bad” LDL-cholesterol and decrease the “good” HDL-cholesterol levels. Also, trans-fats promote inflammation, increase abdominal fat, and decrease the health of the endothelium, which has metabolic consequences including obesity, diabetes, and CVD (de Souza et al. 2015). Several factors, such as limited income, high cost, and insufficient availability and access to affordable, healthy, and nutritious market food, contribute to food insecurity (Willows 2005).
Traditional food systems undergo significant pressure from various environmental factors, such as climate change, which negatively impacts the availability, diversity, and access to traditional foods, including seafood. Climate change may also affect the bioaccumulation rates of environmental contaminants (such as MeHg) in marine food webs (Alava et al. 2017, 2018). Indigenous people, especially remote and coastal communities, are particularly vulnerable to climate change impacts as they live off the land and the ocean and have limited resources and abilities to adapt to changing conditions. Most of the previous research on the impact of climate change on traditional food systems was performed among Inuit and Northern First Nations in the Canadian Arctic (Ford et al. 2010; Nancarrow and Chan 2010; Rosol et al. 2016). The main documented effects of climate-related changes by the Inuit and Northern First Nations included: warming, increased precipitation, more unpredictable weather patterns, stronger winds, increased coastal erosion, and alteration in sea-ice dynamics (Ford et al. 2010; Rosol et al. 2016). These factors have been reported to affect the availability, distribution, and health of wildlife species, with consequent serious implications for food security in Indigenous communities (Ford et al. 2010; Rosol et al. 2016). Among First Nations in British Columbia, the majority (75%) of participants observed that climate change decreased the availability of traditional foods for harvest through declining abundances, altered growth and migration patterns, and observed diseases in animals (Chan et al. 2011). In addition to climate change, First Nations noted other constraints on traditional food consumption, including government restrictions and industrial activities such as forestry, hydroelectricity, mining, farming, and oil/gas industries. These barriers combined were perceived by 68% of BC First Nations to decrease access to salmon, shellfish, and other fish species (Chan et al. 2011).
This is the first study that models the potential impacts of the climate-related decline in seafood consumption and consequent reduced EPA + DHA intake on the risk of MI among coastal First Nations. The main strengths of this study are a representative sample of coastal First Nations in BC, the use of a comprehensive traditional food frequency questionnaire over the prior year to estimate seafood consumption patterns, as well as empirical analysis of mercury concentrations in seafood species and the hair of the study participants.
There are several uncertainties in this study. First, the strength of associations between n-3 FAs, MeHg, and MI among First Nations in BC may not be the same as observed by Wennberg and colleagues (2012). Second, the baseline serum EPA + DHA concentrations were not measured in the study participants but were adopted from the Cree Nation of Eeyou Istchee. This may introduce bias in the RR estimates. RR estimates with converted serum EPA + DHA values are smaller compared with the corresponding estimates with plasma phospholipid values (Table S3). However, the conclusion will not change since the modelled increase in the MI risk due to seafood decline scenarios mainly depends on the proportional change in EPA + DHA, rather than the absolute value. Cardiovascular health outcomes can be further exacerbated due to significant dietary changes and the consequent increased intake of processed food. Therefore, the estimated increase in MI risk might be underestimated. The levels of MeHg in seafood species may change over time (increase or decrease) due to different environmental factors, including climate change. Our model assumes that the MeHg concentrations in seafood will remain constant over time. Finally, there are some uncertainties about the DBEM model in the projected seafood declines (see Weatherdone et al. 2016).
Conclusion
Marine species continue to be important sources of key nutrients for coastal First Nations in BC, and they play a protective role in cardiovascular health. Our findings show that the potential decline in seafood consumption may negatively impact cardiovascular health among coastal First Nations in BC. The most significant impacts were observed among men and individuals 50 years of age and older because of their stronger reliance on seafood. This study highlights the urgent need for effective strategies to improve seafood harvest potential and access to seafood for coastal First Nations, which would promote nutritional and cardiovascular health among First Nations, in addition to the well-described physical activity and cultural and spiritual benefits. Transformation in fishery management and implementing mitigation and adaptation programs rooted in Indigenous knowledge and fishing and hunting practices would support sustainable fisheries in First Nations communities. In addition, programs and initiatives to improve the availability and affordability of high-quality market food are recommended to improve the quality of diets and reduce the risk of chronic diseases, such as CVD.
Acknowledgements
We would like to thank all participants for their cooperation and participation in the First Nations Food, Nutrition and Environment Study (FNFNES) as well as all First Nations community members who collected food and water samples, assisted in data collection, coordinated research activities, and arranged meetings and public gathering to share information.
References
Academy F.T.H.E. 2014. Position of the Academy of Nutrition and Dietetics: dietary fatty acids for healthy adults.
Alava J.J., Cheung W.W.L., Ross P.S., Sumaila U.R. 2017. Climate change–contaminant interactions in marine food webs: toward a conceptual framework. Global Change Biology, 23: 3984–4001.
Alava J.J., Cisneros-Montemayor A.M., Sumaila R., Cheung W.W.L. 2018. Projected amplification of food web bioaccumulation of MeHg and PCBs under climate change in the Northeastern Pacific. Scientific Reports, 8: 13460.
Bang H., Dyerberg J., Nielsen A. 1971. Plasma lipid and lipoprotein pattern in Greenlandic West-Coast Eskimos. Lancet, 297: 1143–1145.
Basu N., Horvat M., Evers D.C., Zastenskaya I., Weihe P., Tempowski J. 2018. A state-of-the-science review of mercury biomarkers in human populations worldwide between 2000 and 2018. Environmental Health Perspectives 126: 1–14.
Bjørklund G., Dadar M., Mutter J., Aaseth J. 2017. The toxicology of mercury: current research and emerging trends. Environmental Research, 159: 545–554.
Breslow J.L. 2006. n-3 fatty acids and cardiovascular disease. American Journal of Clinical Nutrition, 83: 1477S–1482S.
British Columbia. Provincial Health Officer. 2009. Pathways to health and healing: 2nd report on the health and well-being of Aboriginal people in British Columbia. Provincial Health Officer's Annual Report 2007, Victoria, BC.
Bruce S.G., Riediger N.D., Lix L.M. 2014. Chronic disease and chronic disease risk factors among First Nations, Inuit and Metis populations of northern Canada. Chronic Disease and Self-Injection, 34: 210–217.
C.L. Reading, Wein F. 2009. Health inequalities and social determinants of Aboriginal peoples’ health. pp. 1–47.
Chan H.M., Singh K., Batal M., Maruska L., Tikhonov C., Sadik T., et al. 2020. Levels of metals and persistent organic pollutants in traditional foods consumed by First nations living on reserve in Canada. Canadian Journal of Public Health.
Chan L., Batal M., Sadik T., Tikhonov C., Schwartz H., Fediuk K., et al. 2019. FNFNES Final Report for Eight Assembly of First Nations Regions: Draft Comprehensive Technical Report.
Chan L., Receveur O., Sharp D., Schwartz H., Ing A., Tikhonov C. 2011. First Nations Food, Nutrition and Environment Study (FNFNES): results from British Columbia (2008/2009). University of Northern British Columbia, Prince George.
Cheung W.W.L., Jones M., Reygondeau G., Stock C.A., Lam V.W.Y., Frolisher T.L. 2016. Structural uncertaintly in projecting global fisheries catches under climate change. Ecological Modelling, 325: 57–66.
de Souza R.J., Mente A., Maroleanu A., Cozma A.I., Ha V., Kishibe T., et al. 2015. Intake of saturated and trans unsaturated fatty acids and risk of all cause mortality, cardiovascular disease, and type 2 diabetes: systematic review and meta-analysis of observational studies. British Medical Journal, 351: h3978.
Dewailly E., Blanchet C., Gingras S., Lemieux S., Holub B.J. 2002. Cardiovascular disease risk factors and n-3 fatty acid status in the adult population of James Bay Cree. American Journal of Clinical Nutrition, 76: 85–92.
Dewailly E., Blanchet C., Lemieux S., Sauvé L., Gingras S., Ayotte P., et al. 2001. nϪ3 Fatty acids and cardiovascular disease risk factors among the Nunavik Inuit. American Journal of Clinical Nutrition, 74: 464–473.
Egeland G., Berti P.R., Soueida R., Arbour L.T., Receveur O., Kuhnlein H.V. 2001. Traditional food systems research with Canadian Indigenous Peoples. International Journal of Circumpolar Health, 60: 112–122.
Elagizi A., Lavie C.J., Marshall K., DiNicolantonio J.J., O'Keefe J.H., Milani R.V. 2018. Omega-3 polyunsaturated fatty acids and cardiovascular health: a comprehensive review. Progress in Cardiovascular Diseases.
Fernandes J.A., Cheung W.W.L., Jennings S., Butenschön M., Mora L.de., Frölicher T.L. et al., 2013. Modelling the effects of climate change on the distribution and production of marine fishes: accounting for trophic interactions in a dynamic bioclimate envelop model. Global Change Biology, 19(8): 2596–2607.
First Nations Health Authority. 2012. Healthy children, healthy families, healthy communities. BC Provincial Report. 2008–10 First Nations Regional Health Survey.
FNC. 2005. First Nations Regional Longitudinal Health Survey (RHS) 2002/03: results for adults, youth and children living in First Nations communities. FNC, Ottawa.
FNIGC. 2012. First Nations Regional Health Survey (RHS) 2008/10: national report on youth living in First Nations communities. FNIGC, Ottawa.
Ford J.D., Berrang-Ford L., King M., Furgal C. 2010. Vulnerability of aboriginal health systems in Canada to climate change. Global Environmental Change, 20: 668–680.
Garneau V., Rudkowska I., Paradis AM., Godin G., Julien P., Pérusse L., Vohl MC. 2012. Omega-3 fatty acids status in human subjects estimated using a food frequency questionnaire and plasma phospholipids levels. Nutr J, 11: 46.
Genchi G., Sinicropi M.S., Carocci A., Lauria G., Catalano A. 2017. Mercury exposure and heart diseases. International Journal of Environmental Research and Public Health, 14: 1–13.
Ha E., Basu N., Reilly S.B., Dórea J.G., Mcsorley E., Sakamoto M., Man H. 2017. Current progress on understanding the impact of mercury on human health. Environmental Research, 152: 419–433.
Health Canada. 2014. A statistical profile on the health of First Nations in Canada: vital statisitcs for Atlantic and Western Canada, 2003–2007.
Health Canada. 2015. Canadian nutrient file (CNF) [WWW document]. Available from https://food-nutrition.canada.ca/cnf-fce/index-eng.jsp [accessed 25 May 2020].
Hori Y., 2010. Use of traditional environmental knowledge to assess the impact of climate change on subsistence fishing in the James Bay Region of Northern Ontario, Canada. Waterloo, ON, Canada.
Hu X.F., Laird B.D., Chan H.M. 2017. Mercury diminishes the cardiovascular protective effect of omega-3 polyunsaturated fatty acids in the modern diet of Inuit in Canada. Environmental Research, 152: 470–477.
Hu X.F., Singh K., Chan L.H.M. 2018. Mercury exposure, blood pressure, and hypertension: a systematic review and dose–response meta-analysis. Environmental Health Perspectives, 126.
Hu XF., Chan HM. 2020. Seafood Consumption and Its Contribution to Nutrients Intake among Canadians in 2004 and 2015. Nutrients, 13: 77.
Innes J.K., Calder P.C. 2020. Marine omega-3 (N-3) fatty acids for cardiovascular health: an update for 2020. International Journal of Molecular Sciences, 21: 1–21.
Jenkins D.J.A., Kitts D., Giovannucci E.L., Sahye-Pudaruth S., Paquette M., Blanco Mejia S. et al., 2020. Selenium, antioxidants, cardiovascular disease, and all-cause mortality: a systematic review and meta-analysis of randomized controlled trials. The American Journal of Clinical Nutrition, 112: 1642–1652.
Johnson-Down L.M., Egeland G.M. 2013. How is nutrition transition affecting dietary adequacy in Eeyouch (Cree) adults of Northern Quebec, Canada?. Applied Physiology Nutrition and Metabolism, 38: 300–5.
Kuhnlein H., Receveur O. 1996. Dietary change and traditional food systems of indigenous peoples [WWW Document]. Annual Review of Nutrition.
Kuhnlein H., Fediuk K., Nelson C., Howard E., Johnson S. 2013. The legacy of the Nuxalk Food and Nutrition Program for the Food Security, Health, and Well-being of Indigenous Peoples in British Columbia.
Kuhnlein H.V, Receveur O. 2007. Local cultural animal food contributes high levels of nutrients for Arctic Canadian indigenous adults and children. Journal of Nutrition, 137: 1110–1114. [pii].
Kuria A., Tian H., Li M., Wang Y., Aaseth JO., Zang J., Cao Y.2021. Selenium status in the body and cardiovascular disease: a systematic review and meta-analysis. Critical Reviews in Food Science and Nutrition, 61: 3616–3625.
Laird B.D., Goncharov A.B., Egeland G.M., Chan H.M. 2013. Dietary advice on Inuit traditional food use needs to balance benefits and risks of mercury, selenium, and n3 fatty acids. Journal of Nutrition, 143: 923–930.
Legrand M., Feeley M., Tikhonov C., Schoen D., Li-Muller A. 2010. Methylmercury blood guidance values for Canada. Canadian Journal of Public Health, 101: 28–31.
Lemelin H., Matthews D., Mattina C., McIntyre N., Johnston M., Koster R. 2010. Climate change, wellbeing and resilience in the Weenusk First Nation at Peawanuck: the Moccasin Telegraph goes global. Rural Remote Health, 10: 1333.
Lemmen D.S., Warren F.J., James T.S., Mercer Clarke C.S.L. editors. 2016. Canada's Marine Coasts in a Changing Climate: Government of Canada. Ottawa, ON, 274p.
Leung Yinko S.S.L., Stark K.D., Thanassoulis G., Pilote L. 2014. Fish consumption and acute coronary syndrome: a meta-analysis. American Journal of Medicine, 127: 848–857.
Lipfert F.W., Sullivan T.M. 2006. The competition between methylmercury risks and omega- 3 polyunsaturated fatty acid benefits: a review of conflicting evidence on fish consumption and cardiovascular health. Upton, New York.
Marushka L., Batal M., David W., Schwartz H., Ing A., Fediuk K., et al. 2017a. Association between fish consumption, dietary omega-3 fatty acids and persistent organic pollutants intake, and type 2 diabetes in 18 First Nations in Ontario, Canada. Environmental Research, 156: 725–737.
Marushka L., Batal M., Sharp D., Schwartz H., Ing A., Fediuk K., et al. 2017b. Fish consumption is inversely associated with type 2 diabetes in Manitoba First Nations communities. FACETS, 2: 795–818.
Marushka L., Batal M., Sadik T., Schwartz H., Ing A., Fediuk K., et al. 2018a. Seafood consumption patterns, their nutritional benefits and associated sociodemographic and lifestyle factors among First Nations in British Columbia, Canada. Public Health Nutrition, 1–14.
Marushka L., Kenny T.-A., Batal M., Cheung W.W.L., Fediuk K., Golden CD., et al. 2018b. Impacts of climate-related decline of seafood harvest on nutritional status of coastal First Nations in British Columbia, Canada. PLoS One.
Marushka L., Kenny T.A., Batal M., Cheung W.W.L., Fediuk K., Golden C.D. et al., 2019. Potential impacts of climate-related decline of seafood harvest on nutritional status of coastal First Nations in British Columbia, Canada.PLoS One, 14(2): e0211473.
McLennan P.L. 2014. Cardiac physiology and clinical efficacy of dietary fish oil clarified through cellular mechanisms of omega-3 polyunsaturated fatty acids. European Journal of Applied Physiology, 114: 1333–1356.
Mos L., Jack J., Cullon D., Montour L., Alleyne C., Ross P.S., et al. 2004. The importance of marine foods to a near-urban first nation community in coastal British Columbia, Canada: toward a risk-benefit assessment. Journal of Toxicology and Environment Health, 67: 791–808.
Nancarrow T.L., Chan H.M. 2010. Observations of environmental changes and potential dietary impacts in two communities in Nunavut, Canada. Rural Remote Health, 10: 1370.
Patterson A.C., Chalil A., Aristizabal Henao J.J., Streit I.T., Stark K.D. 2015. Omega-3 polyunsaturated fatty acid blood biomarkers increase linearly in men and women after tightly controlled intakes of 0.25, 0.5, and 1 g/d of EPA + DHA. Nutrition Research, 35: 1040–1051.
Public Health Agency of Canada. 2018. Canadian Chronic Disease Surveillance System (CCDSS) data [WWW document]. Available from https://www.canada.ca/en/public-health/services/surveillance.html#a2Reading.
Reading J. 2015. Confronting the growing crisis of cardiovascular disease and heart health among aboriginal peoples in Canada. Canadian Journal of Cardiology, 31.
RHS. 1999. First Nations and Inuit Regional Health Survey.
Rosol R., Powell-hellyer S., Chan H.M. 2016. Impacts of decline harvest of country food on nutrient intake among Inuit in Arctic Canada: impact of climate change and possible adaptation plan. International Journal of Circumpolar Health, 75.
Shahidi F., Ambigaipalan P. 2018. Omega-3 polyunsaturated fatty acids and their health benefits. Annual Review of Food Science and Technology 9: 345–381.
Sheehy T., Kolahdooz F., Schaefer S.E., Douglas D.N., Corriveau A., Sharma S. 2015. Traditional food patterns are associated with better diet quality and improved dietary adequacy in Aboriginal peoples in the Northwest Territories, Canada. Journal of Human Nutrition, 28: 262–271.
Sheehy T., Roache C., Sharma S. 2013. Eating habits of a population undergoing a rapid dietary transition: portion sizes of traditional and non-traditional foods and beverages consumed by Inuit adults in Nunavut, Canada. Nutrition Journal, 12: 70.
Statistics Canada. 2010. Household food insecurity In Canada in 2007-2008: key statistics and graphics[WWW Document]. Can. Community Heal. Surv. 2007–2008.
Tarasuk V.P. 2012. Household food insecurity in Canada. Topics in Clinical Nutrition, 299–312.
Tjepkema M., Wilkins R., Goedhuis N., Pennock J. 2012. Cardiovascular disease mortality among first nations people in Canada, 1991–2001. Chronic Disease and Self-Injection, 32: 200–207.
Weatherdon L.V, Ota Y., Jones M.C., Close D.A., Cheung W.W.L. 2016. Projected scenarios for coastal First Nations’ fisheries catch potential under climate change : management challenges and opportunities. PLoS One, 11: 1–28.
Wennberg M., Stromberg U., Bergdahl I.A., Jansson J.-H., Kauhanen J., Norberg M., et al. 2012. Myocardial infarction in relation to mercury and fatty acids from fish: a risk-benefit analysis based on pooled Finnish and Swedish data in men. American Journal of Clinical Nutrition, 96: 706–713.
WHO/WHF/WSO. 2011. Global Atlas on cardiovascular disease prevention and control. Publication of the World Health Organization Published by the World Health Organization in collaboration with the World Heart Federation the World Heart Federation and the World Stroke Orga. ISBN: 978-92-4-156437-3.
Willows N.D. 2005. Determinants of healthy eating in aboriginal peoples in Canada the current State of knowledge and research gaps. Canadian Journal of Dietetic Practice and Research, 96.
World Health Organization. 1990. Environmental health criteria 101 – METHYLMERCURY. Geneva.
Yashodhara B.M., Umakanth S., Pappachan J.M., Bhat S.K., Kamath R., Choo B.H. 2009. Omega-3 fatty acids: a comprehensive review of their role in health and disease. Postgraduate Medical Journal, 85: 84–90.
Young T.K. 2012. Cardiovascular health among Canada's aboriginal populations: a review. Heart, Lung and Circulation. 21: 618–622.
Supplementary material
Supplementary Material 1 (DOCX / 38.0 KB).
- Download
- 38.09 KB
Information & Authors
Information
Published In
FACETS
Volume 9 • January 2024
Pages: 1 - 13
Editor: Charles Couillard
History
Received: 28 November 2022
Accepted: 10 August 2023
Version of record online: 18 January 2024
Copyright
© 2024 The Author(s). This work is licensed under a Creative Commons Attribution 4.0 International License (CC BY 4.0), which permits unrestricted use, distribution, and reproduction in any medium, provided the original author(s) and source are credited.
Data Availability Statement
Data are owned by each participating community. The Assembly of First Nations is the data custodian, and any requests will be addressed to AFN through the corresponding author.
Key Words
Sections
Subjects
Authors
Author Contributions
Conceptualization: TK, MB, TS, CDG, WWLC, AKS, HMC
Data curation: LM, TS, HMC
Formal analysis: LM, XFH, WWLC, AKS, HMC
Funding acquisition: TK, MB, TS, CDG, AKS, HMC
Investigation: KF, HMC
Methodology: LM, MB, KF, TS, WWLC, AKS, HMC
Project administration: KF, TS, HMC
Resources: HMC
Supervision: HMC
Writing – original draft: LM, XFH
Writing – review & editing: LM, XFH, TK, MB, KF, CDG, WWLC, AKS, HMC
Competing Interests
The authors have no potential conflicts of interest.
Funding Information
First Nations and Inuit Health Branch of Indigenous Services Canada
National Science Foundation: CNH 1826668, DBI-1052875
Welcome Trust: 106864MA
The Canadian Institute of Health Research (CIHR)
Canada Research Chair Program
National Socio-Environmental Synthesis Center (SESYNC)
FNFNES was funded and supported by the First Nations and Inuit Health Branch of Indigenous Services Canada to HMC, MB, and TS. The Canadian Institute of Health Research (CIHR) funded HMC to communicate the results to the communities participating in FNFNES. This work is supported by a CIHR Operating Grant to HMC, MB, WWLC, and AKS. HMC, MB, and WWLC were supported by the Canada Research Chair Program and AKS by the Natural Sciences and Engineering Research Council of Canada. CDG was supported by the National Socio-Environmental Synthesis Center (SESYNC) under funding received from the National Science Foundation DBI-1052875 (CG), National Science Foundation (CNH 1826668), and the Welcome Trust Our Planet, Our Health [Grant number: 106864MA] (CG, WC).
Metrics & Citations
Metrics
Other Metrics
Citations
Cite As
Lesya Marushka, Xue Feng Hu, Tiff-Annie Kenny, Malek Batal, Karen Fediuk, Tonio Sadik, Christopher D. Golden, William W. L. Cheung, Anne K. Salomon, and Hing Man Chan. 2024. Potential impacts of reduced seafood consumption on myocardial infarction among coastal First Nations in British Columbia, Canada. FACETS.
9(): 1-13. https://doi.org/10.1139/facets-2022-0245
Export Citations
If you have the appropriate software installed, you can download article citation data to the citation manager of your choice. Simply select your manager software from the list below and click Download.
There are no citations for this item