Applying ensemble ecosystem model projections to future-proof marine conservation planning in the Northwest Atlantic Ocean
Abstract
Climate change is altering marine ecosystems across the globe and is projected to do so for centuries to come. Marine conservation agencies can use short- and long-term projections of species-specific or ecosystem-level climate responses to inform marine conservation planning. Yet, integration of climate change adaptation, mitigation, and resilience into marine conservation planning is limited. We analysed future trajectories of climate change impacts on total consumer biomass and six key physical and biogeochemical drivers across the Northwest Atlantic Ocean to evaluate the consequences for Marine Protected Areas (MPAs) and Other Effective area-based Conservation Measures (OECMs) in Atlantic Canada. We identified climate change hotspots and refugia, where the environmental drivers are projected to change most or remain close to their current state, respectively, by mid- and end-century. We used standardized outputs from the Fisheries and Marine Ecosystem Model Intercomparison Project and the 6th Coupled Model Intercomparison Project. Our analysis revealed that, currently, no existing marine conservation areas in Atlantic Canada overlap with identified climate refugia. Most (75%) established MPAs and more than one-third (39%) of the established OECMs lie within cumulative climate hotspots. Our results provide important long-term context for adaptation and future-proofing spatial marine conservation planning in Canada and the Northwest Atlantic region.
Introduction
Marine biodiversity and ocean ecosystems are already altered by climate change on local to global scales, and these impacts are projected to increase over the 21st century and beyond. Observed impacts of climate change include the expansion, contraction or shift of species ranges (e.g., Nye et al. 2009; Poloczanska et al. 2013; Orio et al. 2019), shifting phenology (e.g., Parmesan and Yohe 2003; Dufour et al. 2010; Poloczanska et al. 2013; Langan et al. 2021), and changes in depth distributions (e.g., Dulvy et al. 2008), changes in metabolism (Pörtner and Knust 2007), species composition and abundance (e.g., Hastings et al. 2020; Pershing et al. 2021; Gordó-Vilaseca et al. 2023), species interactions (e.g., Grady et al. 2019), and trophic transfer efficiency (Barneche et al. 2021; Eddy et al. 2021), all of which affect ecosystem structure, functions, and services to human well-being (Bindoff et al. 2019; Pershing et al. 2021). Moreover, climate change can undermine the effectiveness of fisheries management and marine conservation efforts (e.g., Pershing et al. 2015; Tittensor et al. 2019; Wilson et al. 2020; Lotze 2021). However, integration of climate change adaptation, mitigation, and resilience into marine conservation planning and management is limited both in Canada and elsewhere (Bryndum-Buchholz et al. 2022; O'Regan et al. 2021). At present, only 26% of Canadian MPAs consider climate change in their design, monitoring, or management (O'Regan et al. 2021).
Currently, Canada is working towards fulfilling its national target and international commitment to marine conservation by protecting 25% of its ocean area by 2025 and 30% by 2030 (DFO 2021). To achieve this, Canada is continuing to grow its network of marine conservation areas, including Oceans Act Marine Protected Areas (MPAs) and Fisheries Act Other Effective area-based Conservation Measures (OECMs), across its three oceans (DFO 2021). At the time of writing, about 800 marine conservation areas encompassing 13.9% of the exclusive economic zone (EEZ) and 798,861 km2 have been established within Canadian waters (Government of Canada 2022). Of these, ∼2% are MPAs and ∼7% OECMs (Government of Canada 2022), representing 80% of the area protected by some form of marine conservation measure in Canada (Bryndum-Buchholz et al. 2022). Other spatial marine conservation measures in Canada are managed by provincial and territorial governments (1% Marine Conserved Areas), Environment and Climate Change Canada (4% National Wildlife Areas and Bird Sanctuaries), and Parks Canada (15% National Park Reserves and National Marine Conservation Areas) (Government of Canada 2022).
Although all of Canada's oceans will be affected by climate change (Bryndum-Buchholz et al. 2020), the Northwest Atlantic in particular is considered a climate change hotspot, with average rates of projected warming two times higher than the global average (Pershing et al. 2015; Saba et al. 2016). This is largely due to the high sensitivity of the area to changes in the strength and position of the Labrador Current System and the Gulf Stream, which strongly influence oceanographic conditions (Richaud et al. 2016; Gonçalves Neto et al. 2021) and ecological communities (Lotze et al. 2022). Generally, climate and oceanographic conditions in Atlantic Canada have been quite stable over the past 4000 years until a clear warming trend began in the 1960s (Lotze et al. 2022). This recent warming, together with associated changes in other oceanographic conditions (e.g., increase/decrease in primary production, acidification, deoxygenation, sea level rise, and increasing frequency of marine heatwaves), adds to impacts from fishing pressure, habitat alterations, pollution, and other human activities (Halpern et al. 2008, 2015). The combined effects of these factors have contributed to rapid changes at all trophic levels of the marine ecosystem, bringing new challenges to marine management and conservation efforts (Lotze et al. 2022).
To ensure effective long-term marine conservation planning, climate change impacts need to be considered as an integral part of planning and management frameworks. Marine conservation agencies can make use of short- and long-term projections of climate-induced population- or ecosystem-level changes to inform management plans. One approach to projecting climate change impacts on marine ecosystems is to use an ensemble of marine ecosystem models (MEMs) forced by Earth system models (ESMs), which provide a range of physical and biogeochemical conditions under different climate change scenarios (Séférian et al. 2020), to project future changes in marine ecosystems (Tittensor et al. 2018a, 2021). Individual ESMs and MEMs adopt different structures and representations of oceanographic and ecological processes, respectively (Heneghan et al. 2021). Combining outputs from MEMs into model ensembles allows for the quantification of mean trends and estimates of uncertainty in projected changes due to differences in, e.g., model structure, numerical implementations, and parameterizations, in the ESMs and MEMs (Mora et al. 2013; Tittensor et al. 2018a, 2021). Such ensemble projections have become the gold standard in the climate change projection and impact sciences as they provide more reliable outcomes than any individual model (e.g., Eyring et al. 2016; Exbrayat et al. 2018; Tittensor et al. 2018a, 2021; Lotze et al. 2019; Dankers and Kundzewicz 2020; Tokarska et al. 2020).
Here, we analyze future trajectories of climate change impacts on marine animal biomass and key environmental drivers across the Northwest Atlantic Ocean and evaluate the consequences for existing MPAs and OECMs in Atlantic Canada. For this initial effort, we focused on one conservation management agency, and the other Canadian marine conservation measures were not included. Specifically, we identify single-factor and cumulative climate change hotspots and refugia in terms of rates of change in total consumer biomass and key environmental drivers. In marine conservation planning, climate hotspots are areas where climate impacts are likely to affect marine ecosystems more rapidly, requiring climate-change adaptations. Climate refugia can indicate locations that may be less susceptible to expected future climate change impacts, and hence can be priorities for future marine conservation areas if they are simultaneously biodiversity-rich (Keppel et al. 2012; Ban et al. 2016). While climate refugia can play an important role in future-proof marine conservation planning, future conservation efforts should ideally consider a range of vulnerabilities, protecting a seascape that can protect a range of possible ecosystem responses (Tittensor et al. 2019; Bryndum-Buchholz et al. 2022).
We used results from the newest simulation round of the Fisheries and Marine Ecosystem Model Intercomparison Project (Fish-MIP; Tittensor et al. 2018a, 2018b, 2021), which provides standardized outputs of total consumer biomass from nine global MEMs driven by two ESMs from the 6th Coupled Model Intercomparison Project (CMIP6) under a high-emission scenario (SSP5-8.5), as well as the results of these two ESMs in terms of ocean temperature, oxygen content, pH levels, net primary production, and phytoplankton and zooplankton carbon concentration (ZOOC). Our results can provide important long-term context to help inform marine biodiversity conservation planning and decision-making in a rapidly changing ocean.
Materials and methods
Data sets
We extracted spatially explicit (1° × 1° grid) historical (1970–2014) and future projected (2015–2100) time-series of simulated physical, biogeochemical, and ecosystem variables within the focus region from CMIP6 and Fish-MIP outputs (see below). Physical and biogeochemical variables were selected based on their role in shaping marine ecosystem responses and included: sea surface temperature (SST, °C), sea bottom temperature (SBT, °C), dissolved surface oxygen concentration (mol m−3), dissolved bottom oxygen concentration (mol m−3), surface pH, bottom pH, and net primary productivity (NPP; mol C m−2; diazotrophs excluded). Ecosystem variables included: total consumer biomass (TCB; g C m−2; all vertebrates and invertebrates of trophic level >1, excluding zooplanktonic species), phytoplankton carbon concentration (PHYC; mol C m−3), and ZOOC (mol C m−3).
Time-series of marine animal biomass were derived from nine global MEMs included in the Fish-MIP simulation round 3b (Tittensor et al. 2021): APECOSM (Maury 2010), BOATS (Carozza et al. 2016), DBEM (Cheung et al. 2011), DBPM (Blanchard et al. 2012), EcoOcean (Christensen et al. 2015; Coll et al. 2020), Ecotroph (Gascuel et al. 2011; Du Pontavice et al. 2021), FEISTY (Petrik et al. 2020), Macroecological (Jennings and Collingridge 2015), and ZooMSS (Heneghan et al. 2020). The Fish-MIP model ensemble captures a wide range of species or functional groups that can be considered to cumulatively cover the entire or the majority of the ecosystem beyond the plankton. For more details on the individual MEMs, refer to Table S2. The Fish-MIP model simulations in this study do not include fishing; hence, the future TCB projections indicate changes due to climate change only.
Each Fish-MIP model was forced with standardized outputs from two ESMs, GFDL-ESM4.1 (Dunne et al. 2020) and IPSL-CM6A-LR (Boucher et al. 2020), provided by CMIP6 (https://pcmdi.llnl.gov/CMIP6/) with a resolution of 1° grid and accessed via the German Climate Computing Centre (https://www.isimip.org/gettingstarted/data-access/). These two ESMs span a significant fraction of the structural uncertainty of CMIP6 ESMs (Séférian et al. 2020) and provide time-series of the physical and biogeochemical variables we considered. Together, the two ESMs and nine MEMs enabled a model ensemble approach with n = 16 ESM–MEM combinations (two MEMs used IPSL-CM6A-LR forcings only). All model runs provided output for the Shared Socioeconomic Pathway (SSP)5-8.5, which is a no-mitigation and worst-case future scenario. SSP5-8.5 assumes a continued increase in greenhouse gas emissions until 2100 in a world of rapid and unconstrained, fossil fuel-driven economic growth and energy use (O'Neill et al. 2017).
Spatio-temporal changes in key environmental variables from ESMs
To analyse historical and future changes in key environmental variables across the Canadian MPAS and OECMs, we standardized decadal changes to percent change in 2050–2059 (mid-century) and 2090–2099 (end-century) relative to the last decade of the 20th century (1990–1999) for each ESM run and 1° × 1° grid cell. We calculated model agreement in the direction for mid- and end-century percent changes relative to the 1990s for each variable and ESM under the high-emissions scenario SSP5-8.5.
Spatio-temporal changes in total consumer biomass from MEMs
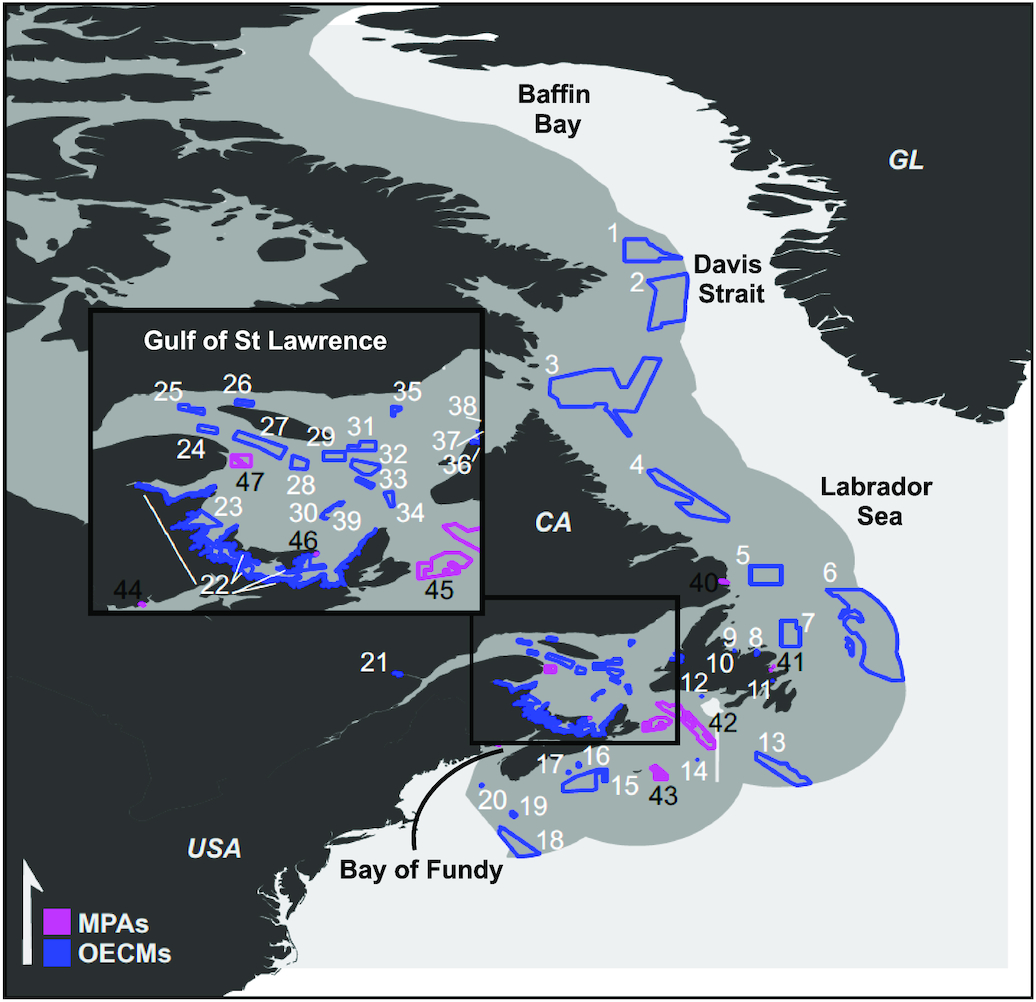
We used a similar approach to analyse historical and projected future changes in total consumer biomass. We calculated relative rather than absolute biomass changes to represent the entire ecosystem because different ecosystem models cover different components of the marine ecosystem (e.g., size classes, trophic groups, and species), and their absolute biomass estimates are not directly comparable (see Table S2 for a detailed model description). We combined the IPSL-CM6A-LR and GFDL-ESM4.1 Fish-MIP biomass runs into spatially explicit ensemble mean changes and calculated the inter-model standard deviation (SD, expressed as %) as a measure of model uncertainty and the % agreement as a measure of agreement in the direction (increase or decrease) of projected changes in the 2050s and 2090s relative to the 1990 s across Fish-MIP models (sensu Bopp et al. 2013). The 100% model agreement occurs when all models have the same direction of change. The 50% (lowest possible value) model agreement occurs when half the models increase and half decrease. All metrics were mapped and overlayed with MPA and OECM boundaries (Fig. 1) to identify which conservation areas may experience the least/most biomass changes by 2050 and 2100.
Fig. 1.
Single-factor and cumulative climate hotspots and refugia
To determine which grid cells and marine conservation areas are projected to experience the highest or lowest rate of change in total consumer biomass, as well as physical and biogeochemical drivers, by mid- and end-century, we used the 90th and 10th percentiles of values showing decreasing or increasing change per grid cell over the study region. For this, we identified the 10% of values showing the largest projected change (upper 90th percentile; increase or decrease) per grid cell, representing single-factor climate hotspots. On the other end of the spectrum, we identified the 10% of values showing the smallest projected change (lower 10th percentile; increase or decrease) per grid cell, representing single factor climate refugia. We selected this 10% threshold after examining the different distributions of projected change within the 95th and 5th percentiles as well as the 98th and 2nd percentiles as a sensitivity analysis; the distributions were similar, and the 90th and 10th percentiles were deemed most informative in the context of providing information for marine managers in the region (Figs. S27–S30).
To understand potential future cumulative environmental impacts, we analysed which grid cells represent a “Cumulative climate hotspot” or “Cumulative climate refuge” by mid- and end-century. We defined “Cumulative climate hotspots” as grid cells with values of projected change in the upper 90th percentile, relative to all values of change in the region, for at least three and more than four environmental drivers: SST/SBT increase only, as a decrease is of lesser concern in terms of climate change impacts for the region; decrease in surface and bottom O2, decrease in surface and bottom pH; and increase and decrease in NPP, PHYC, and ZOOC. Similarly, we defined “Cumulative climate refugia” as the 10% (lower 10th percentile) of all grid cells projected to experience the smallest change in at least three and more than four environmental drivers by mid- and end-century, respectively.
Results
Spatio-temporal changes in key environmental variables (ESMs)
Model projections of mid- and end-century changes in the physical variables showed high spatial variability (Figs. 2 and S1). By the end of the 21st century, projected SST increased across most of the focus region, with single-factor hotspots (upper 90th percentile) along the coast of the Canadian Maritimes, the Scotian Shelf, the Grand Banks of Newfoundland, and northwest Baffin Bay (Fig. 2a). Those areas of SST hotspots were also reflected in the end-century SBT projections; however, large areas in offshore and deeper waters were single-factor refugia (lower 10th percentile) in SBT (Fig. 2b). Overall, the mid-century projections of SST and SBT showed a similar spatial pattern of single-factor hotspots and refugia, though of substantially lower magnitude compared with the end-century projections (Figs. 2a and 2b and S1a and S1b). A total of 87.5% of MPAs were in areas of both high SST and SBT hotspots for both time horizons (2050s and 2090s; Figs. 2a and 2b and S1a and S1b). While 80% of OECMs were within areas of SST hotspots (upper 90th percentile) by the 2090s (Fig. 2a), 56% were located in areas of high SST increases by the 2050s (Fig. S1a). Thirteen percent of OECMs overlapped with SBT refugia (lower 10th percentile) by mid-century (Fig. S1b); however, 8% overlapped by the end of the century (Fig. 2b).
Fig. 2.
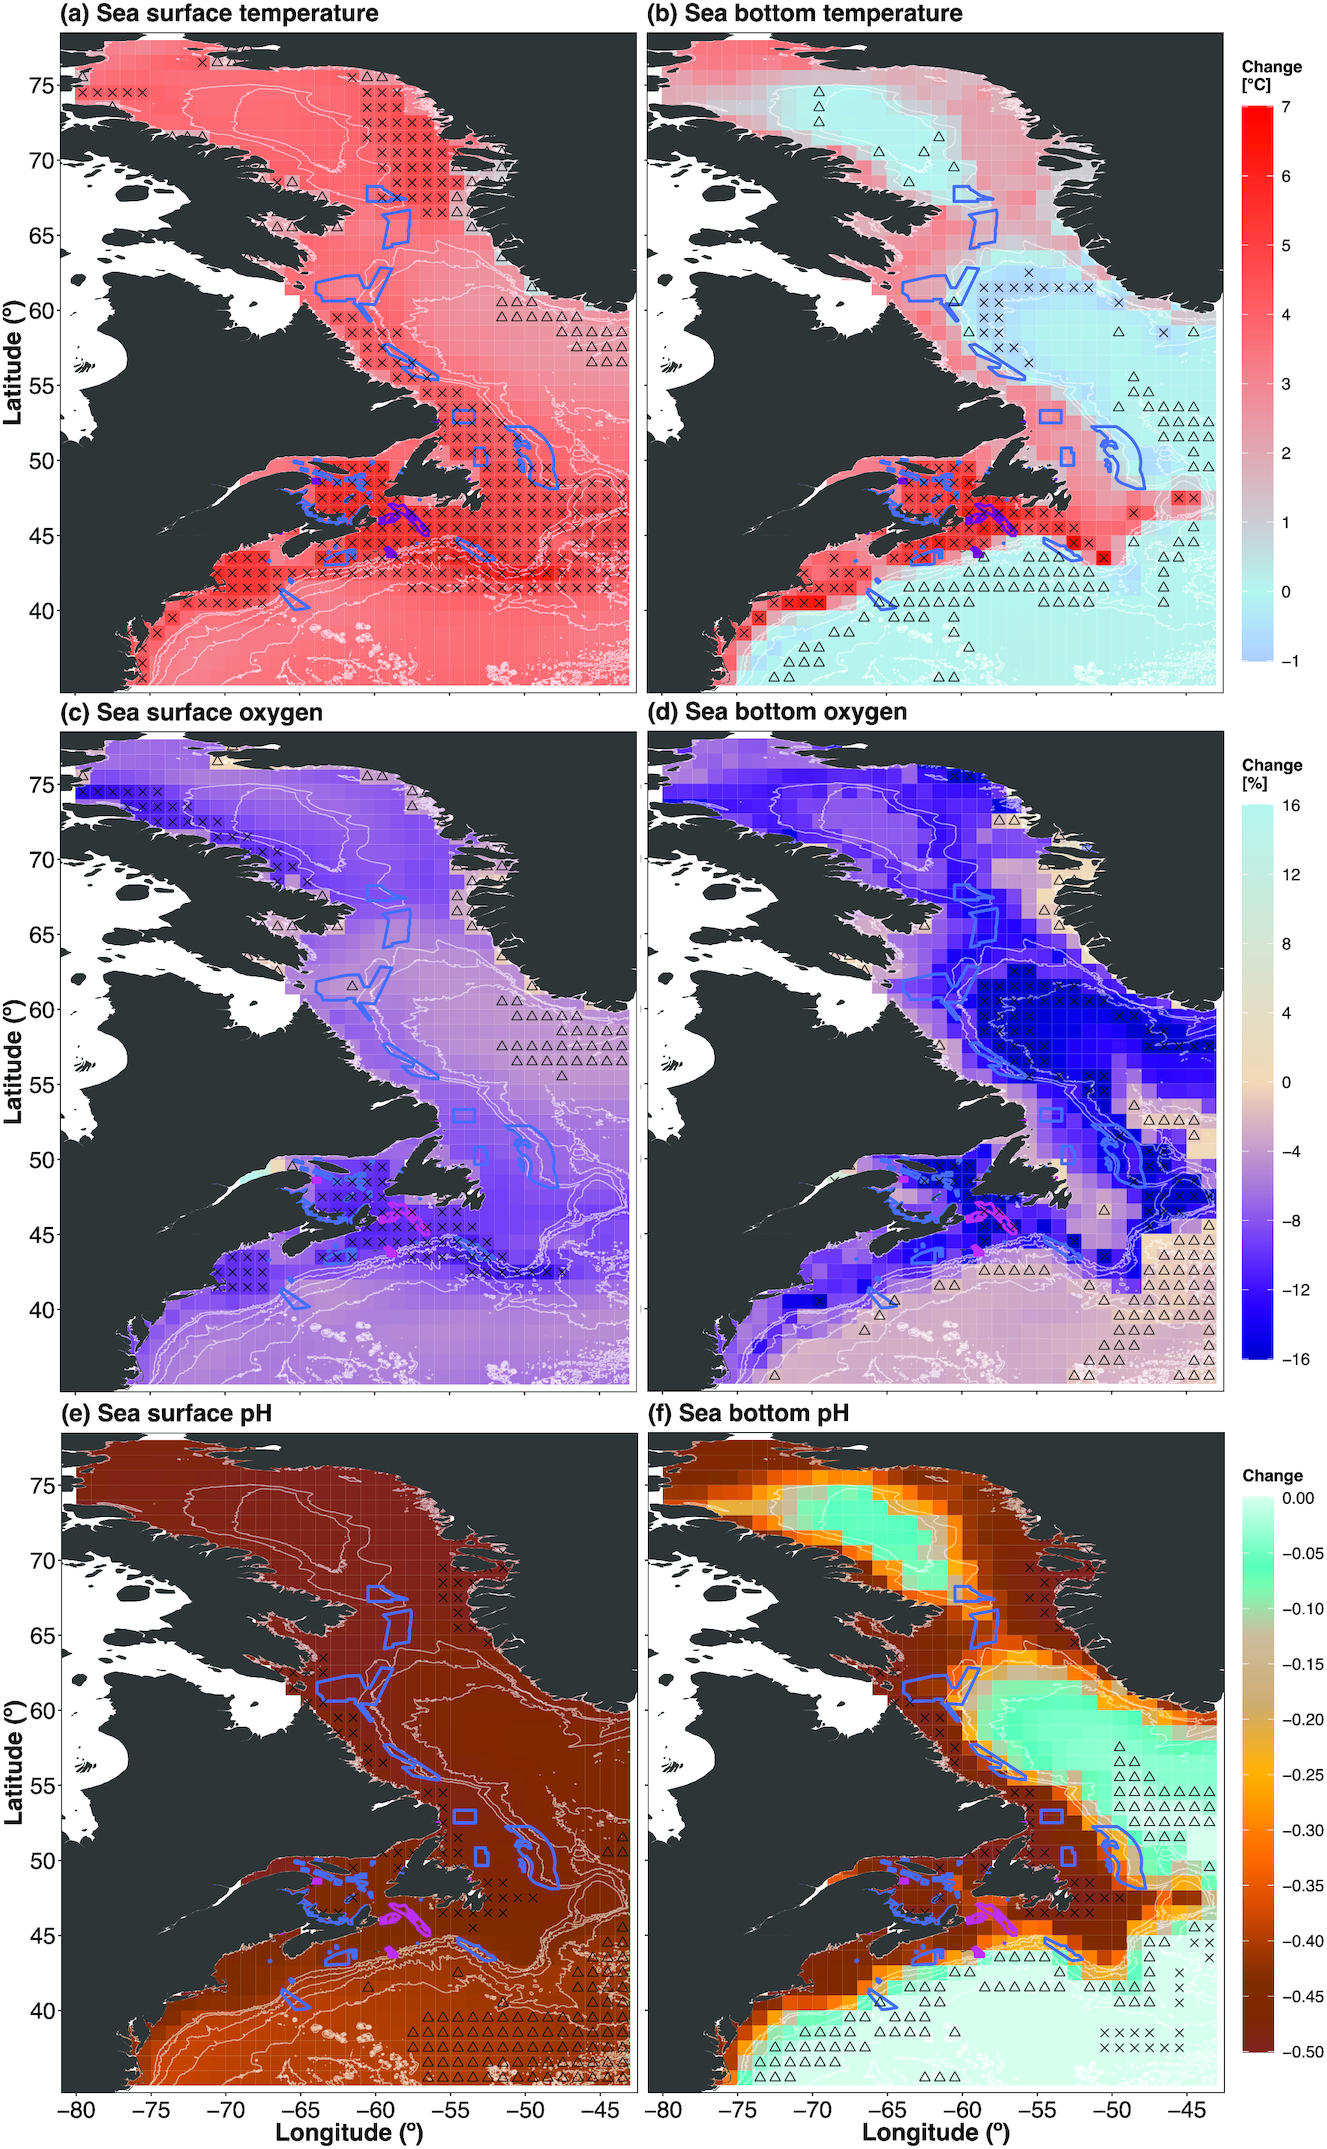
Projected surface oxygen concentrations decreased across the region by the end of the 21st century (Fig. 2c). End-century projections of bottom oxygen concentration showed areas of decreases in the upper 90th percentile within the Gulf of St. Lawrence, the Laurentian Channel, and most of Baffin Bay (Fig. 2d). Those projected changes were reduced substantially under the mid-century projection (Figs. S1c and S1d). Most MPAs and OECMs were located in regions where surface (MPAs: 100%; OECMs: 100%) and bottom (MPAs: 87.5%; OECMs: 100%) oxygen decreased by the end of the century (Figs. 2c and 2d). Notably, 50% of MPAs were within areas of large decreases (upper 90th percentile) in surface oxygen concentration and 25% of MPAs were within areas of large decreases (upper 90th percentile) in bottom oxygen concentration by the end of the century (Figs. 2c and 2d). Twenty-five percent of MPAs were located in areas of strong declines (upper 90th percentile) in bottom oxygen concentration for both time horizons (Figs. 2d and S1d). One exception was the East Port MPA, which was in the bottom oxygen concentration hotspot (upper 90th percentile) by mid-century (Fig. S1d). End-century projections of surface pH revealed strong acidification across the region (Fig. 2e). Bottom pH projections showed the largest decreases along the coast of Canada and Greenland; less so in deeper, offshore regions (Fig. 2f). Mid-century projections of surface and bottom pH showed similar spatial patterns with substantially lower magnitude of change and a shift in areas of highest or lowest change (Figs. S1e and S1f). All MPAs and OECMs were in regions of surface and bottom pH decrease for both time horizons, though none of the conservation areas overlapped with identified areas of pH hotspots and refugia (Figs. 2e and 2f and S1e and S1f).
Model agreement for the ESM projections varied between variables and time horizons (Figs. S2–S9). Projections for SST and surface pH showed the highest model agreement for the mid-and end-century changes across the focus region (Figs. S2a, S2e, S3a, S3e, S4, S5, S8, and S9). ESM projections for the other variables showed consistent clusters of no agreement in the direction of change for both time horizons (Figs. S2b–S2d and S3b–S3d). Notably, the SBT projections did not agree on the direction of change in large areas of Baffin Bay, Davis Strait, and along the coast of the Canadian Maritimes and Maine (Figs. S2b, S3b, S4, and S5).
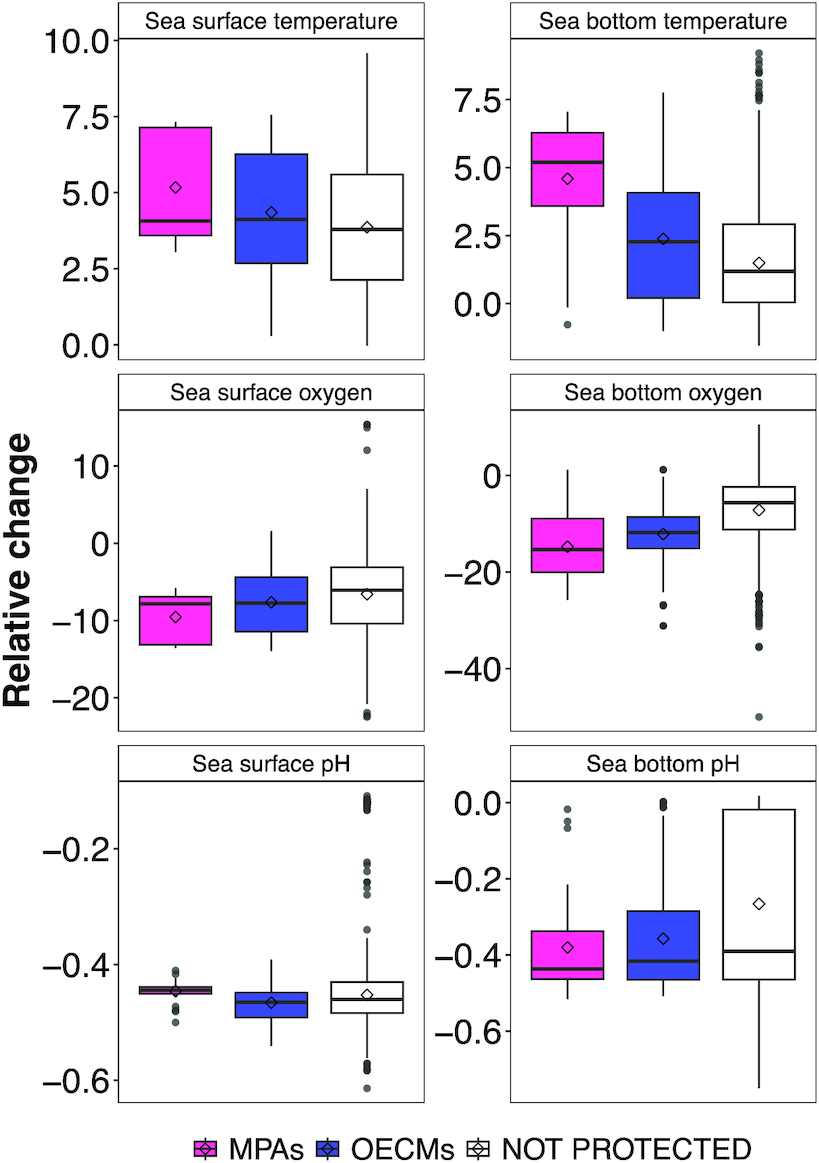
By the end of the century, mean SST and SBT increased, on average, by 5 and 4.5 °C in MPAS and by 4.3 and 2.3 °C in OECMS (Fig. 3). Mean surface oxygen concentration projections decreased to a lesser extent compared with mean bottom oxygen concentration by the end of the century across MPAs (surface: −9.5%; bottom: −14.7%) and OECMs (surface: −7.6%; bottom: −12.2%) (Fig. 3). Mean changes in projected surface and bottom pH were similar across MPAs (surface: −0.44; bottom: −0.38) and OECMs (surface: −0.46; bottom: −0.36) (Fig. 3). Results for mid-century changes across conservation areas are qualitatively comparable (Fig. S10).
Fig. 3.
Mid- and end-century projections of biogeochemical variables NPP, PHYC, and ZOOC followed largely similar regional patterns (Figs. 4 and S13). End-of-century PHYC projections showed areas of increase within the lower 10th percentile (single-factor climate refuge) along the Labrador coast, northern Davis Strait, and Baffin Bay (Fig. 4a), with reductions in the magnitude of projected increases by mid-century (Fig. S13a). Regions of projected decrease within the upper 90th percentile (single-factor climate hotspot) in PHYC were largely in Davis Strait (Fig. 4a). Mid- and end-century ZOOC projections followed the spatial PHYC patterns closely (Figs. 4b and S13b). More than half of OECMs were in areas where PHYC (61%) and ZOOC (69%) increased by mid-century (Figs. S13a and S13b), a pattern that was similar by the end of the 21st century, with more southern OECMs lying in areas of projected PHYC decreases (Figs. 4a and 4b). Notably, 25% of OECMs lie within areas of low ZOOC refugia (10th percentile) by the end of the century (18% of OECMS by mid-century; Fig. 4b and S13b). By the 2090s, all MPAs were in areas of projected PHYC decrease (Fig. 4a). By the end of the 21st century, ZOOC decreased for most MPAS, with the exception of the Gilbert Bay MPA and Banc-des-Américains MPA, where ZOOC was projected to increase (Fig. 4b). This pattern was similar for mid-century projections, albeit with a lower magnitude in the projected changes (Figs. S13a and S13b). Across MPAs and OECMs, mean PHYC was projected to decrease by −13.8% and −11.1%, respectively (Fig. 4d). Mean ZOOC decreased by −16.1% across MPAs and by −7.3% across OECMs (Fig. 4d); mean change across conservation areas was of relatively lower magnitude by mid-century (Fig. S13d).
Fig. 4.

NPP did not follow the spatial patterns of PHYC and ZOOC, notably along the coast of the Canadian Maritimes and Maine (Figs. 4a–4c). Mid-century NPP projections were less pronounced across most of the region, with NPP in the northern Davis Strait already showing strong increases (Fig. S13c) and areas along the Baffin Island coast showing the largest decrease (upper 90th percentile, single-factor climate hotspot; Fig. S13c). By the end of the 21st century, projected NPP increased the most (upper 90th percentile) along the Labrador and northwest Greenland coasts and northern Davis Strait (Fig. 4c), with large areas of lesser increase in the Gulf of St. Lawrence, Scotian Shelf, and northern Gulf of Maine (Fig. 4c). Notable regions of decreasing (upper 90th percentile, single factor climate hotspot) NPP were found along the coast of Baffin Island and northeast of the Grand Banks (Fig. 4c). In contrast to the PHYC and ZOOC, most MPAs and OECMs were within regions of projected NPP increase, except for the Northeast Newfoundland Slope Closure OECM (Figs. 4c and S13c and Table S1).
Model agreement for the biogeochemical ESM projections was similar between both time horizons (Figs. S14–S19). For all three variables, mid- and end-century projections disagreed in the direction of change in most areas of Baffin Bay (Figs. S18a–S18c and S19a–S19c). NPP projections disagreed in most regions of the focus area of mid- and end-century changes, with the strong mean increases driven by the IPSL model (Figs. S18c and S19c). ESM projections agreed largely in the direction of projected mid- and end-century change in Davis Strait for PHYC and ZOOC (Figs. S18a and S18b and S19a and S18b).
Spatio-temporal changes in total consumer biomass (Fish-MIP ensemble)
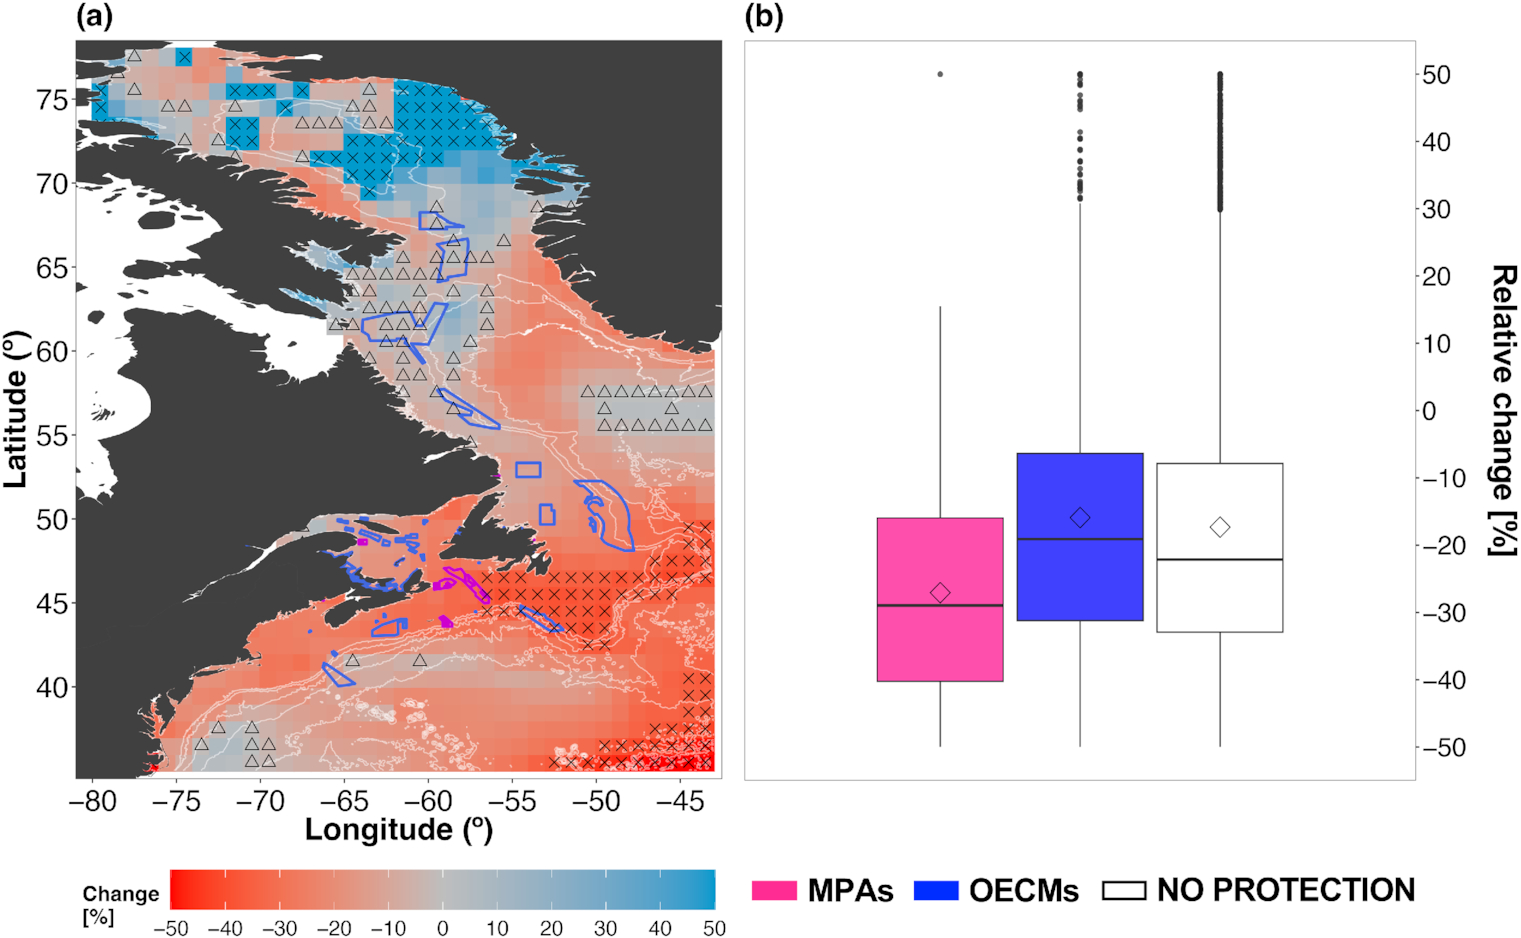
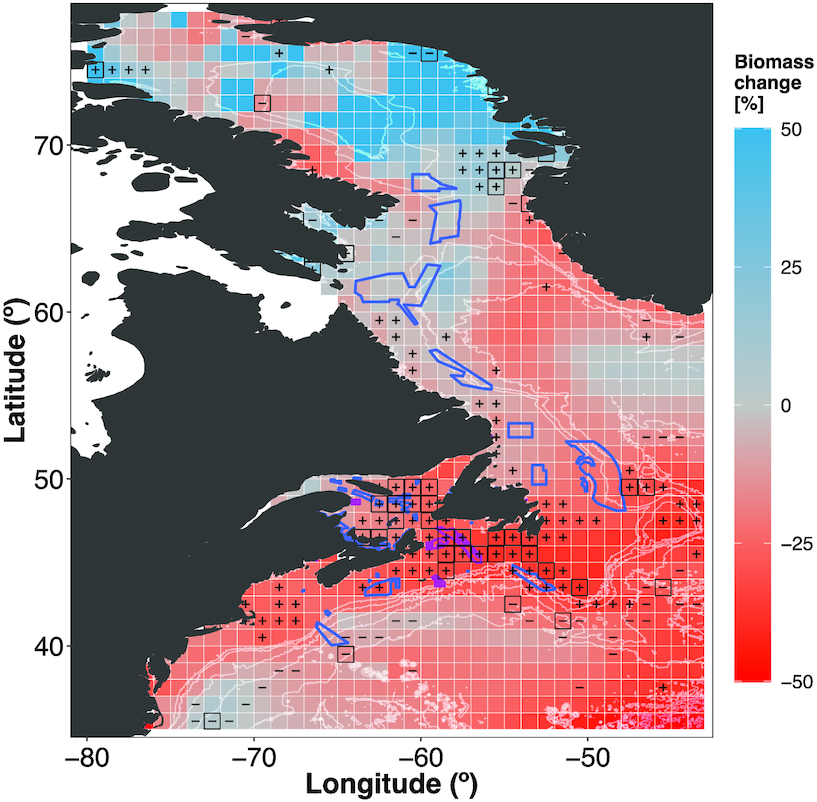
By the end of the century, TCB had increased the most (upper 90th percentile) in the Baffin Bay region (Fig. 5a). In some other areas, e.g., along the Labrador coast and offshore, south of Nova Scotia, biomass was projected to increase up to ∼10% (Fig. 5a). However, projected biomass decreased across large areas of the Northwest Atlantic Ocean, with the largest hotspots (upper 90th percentile) on the Scotian Shelf, the Grand Banks, and the northern Greenland coast (Fig. 5a). Mid-century projections showed a similar spatial pattern, albeit with a lower magnitude (Figs. 5a and S22a). Some areas of projected biomass decreases expanded by the end of the 21st century compared with mid-century projections (Figs. 5a and S22a). All existing MPAs were in regions of projected biomass decreases by the end of the century (Fig. 5a); half of MPAs were by mid-century (Fig. S25a). Notably, the Laurentian Channel MPA lies within areas of high (upper 90th percentile) TCB decrease in both time horizons (mean mid-century change –17.2%; mean end-century change –31.2%; Figs. 1 and 5a and 5b and S25a and S25b). OECMs located along the Labrador and Baffin Island coasts were largely located within areas of low biomass changes (lower 10th percentile, single-factor refugia), whereas OECMs on the Scotian Shelf were in areas of high changes (upper 90th percentile, single-factor hotspot; Figs. 1 and 5a and S22). Across MPAs, the mean TCB was projected to decrease by −27% and by −16% across OCEMs by the end of the century (Fig. 5b). By mid-century, projected TCB decreased by a substantially lesser magnitude across conservation areas (Fig. S22b).
Fig. 5.
The inter-model SD of the TCB ensemble projections was overall lower in the mid-century than the end-century (Figs. 6 and S23). Both the mid- and end-century projections showed pockets of high variability in Baffin Bay (Figs. 6a and S23a). Other regions of high variability existed south of Greenland for the end-century projections (Fig. 6a) and off the Scotian Shelf in the mid-century projection (Fig. S23a). All MPAs were within areas of relatively low uncertainty (SD = 0%–15%) for both time horizons (Figs. 6a and S23a), which largely overlap with areas of hotspots of projected TCB decrease (Fig. 5a and S22a). Four OECMs were fully in areas of high uncertainty (SD = 35%–50%) for both time horizons, which largely overlaps with hotspots of TCB increase. However, the specific OECMs affected differed between the two time horizons (2050s: 1, 2, 18, 19; 2090s: 1, 2, 3, 6; see Table S1 for details).
Fig. 6.
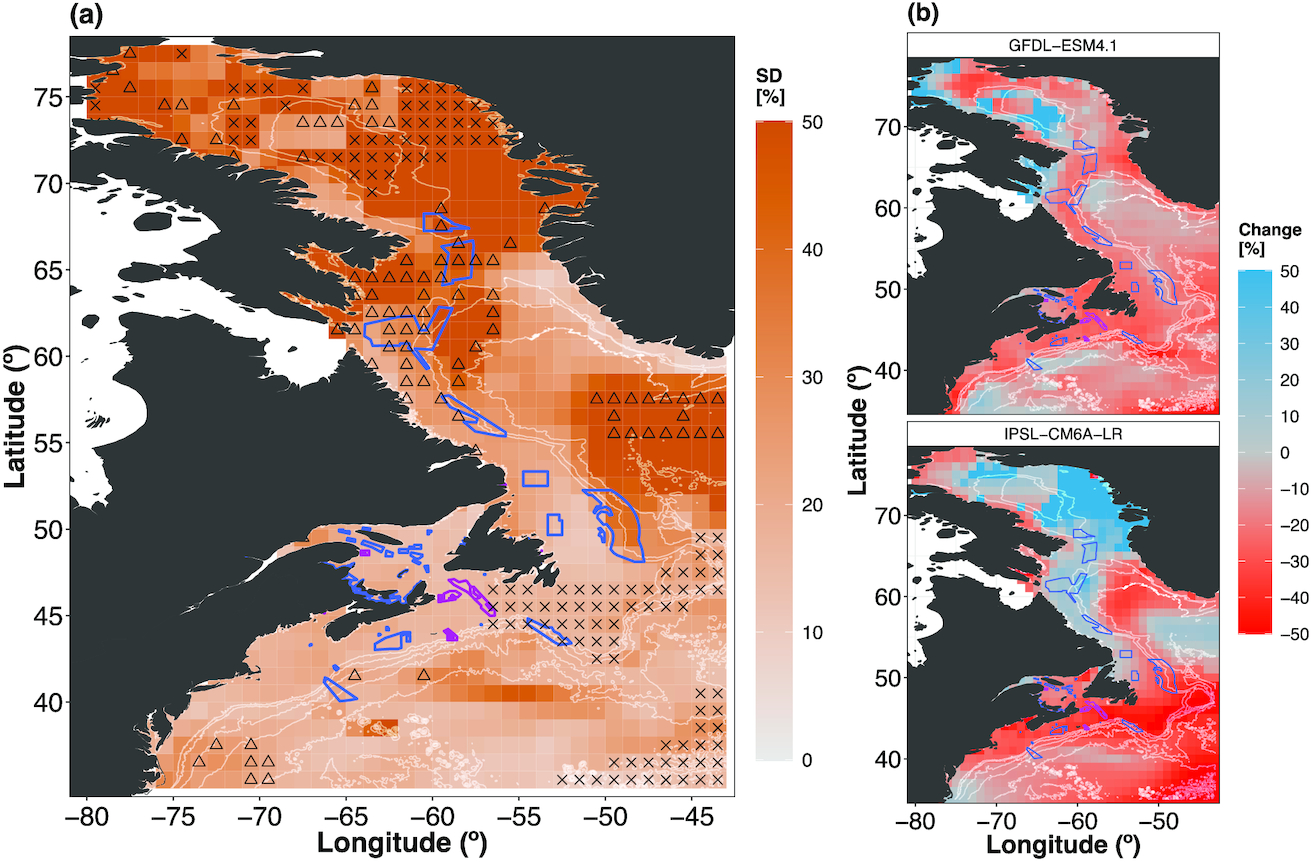
High model agreement within the Fish-MIP ensemble (80%–100%) was largely found in offshore areas as well as on and in the vicinity of the Grand Banks for both time horizons (Figs. S24a and S24b). Low model agreement was found along the Labrador coast and northern Baffin Bay for mid- and end-century projections (Figs. S24a and S24b), as well as the Gulf of St. Lawrence and Scotian Shelf for mid-century projections (Fig. S24a). The large variability and model disagreement were partly due to discrepancies in projected biomass change when MEMs are forced by the two different ESMs, where those forced by IPSL-CM6a-LR showed larger biomass increases in the Baffin Bay and along the Labrador coastline compared with the GFDL-ESM4.1 projections (Figs. 6b, S23b, S24a, and S24b).
Cumulative climate hotspots and refugia
Climate hotspots and refugia were identified across the focus region. While mid-century projections showed that climate hotspots and refugia were spread throughout the region (Fig. S26), end-of-century projections showed a concentration of climate hotspots (changes in more than four drivers) in the Gulf of St. Lawrence, Laurentian Channel, Scotian Shelf, and Grand Banks (Fig. 7). All MPAs in the Canadian EEZ were located within these regions, which also largely overlap with hotspots of projected TCB decrease (Fig. 5a). Other end-of-century climate hotspots were identified in the Gulf of Maine and along the Labrador coast (Fig. 7). For the end-century projections, most climate refugia were identified further offshore, with only a few overlapping with the Canadian EEZ and its existing MPAs and OECMs (Fig. 7). In contrast, for the mid-century projections, climate refugia occurred within the Canadian EEZ, albeit only overlapped with two OECMs (Corsair and Georges Canyons Coral Conservation Area, Funk Island Deep Closure; Fig. S26 and Table S1).
Fig. 7.
Discussion
Our results suggest that marked climate change effects on marine ecosystems are to be expected in the Northwest Atlantic Ocean throughout the 21st century and that these will have consequences for biodiversity conservation planning within the region. Indeed, our analysis revealed that no MPA or OECM in the Canadian EEZ overlaps with cumulative climate refugia, whereas most (75%) established MPAs and more than one third (39%) of the established OECMs lie within cumulative climate hotspots. This evidence suggests that, if greenhouse gas emissions follow the SSP5-8.5 trajectory, current MPAs and OECMs in Atlantic Canada will likely need to be re-evaluated and adaptively managed to fulfill their current or revised future conservation goals. Protected areas with more broadly defined conservation priorities (e.g., biodiversity conservation) than the ones in focus here may be less affected by drastic environmental changes as long as broader regional or national conservation targets are being met and other stressors (e.g., fishing, oil and gas extraction) are avoided or minimized.
The Northwest Atlantic is warming at a higher rate than the global average and can act as a herald of future climate change effects on marine ecosystems and associated biodiversity conservation planning in Canada and beyond. By the end of the 21st century, projected SST and SBT had increased throughout the focus region, with the coast of the Canadian Maritimes and Maine showing the highest values. These projected physical changes, and their associated uncertainties in both magnitude and direction, are alarming, since the most affected regions are important habitats for commercially important groundfish species (e.g., Atlantic cod (Gadus morhua), haddock (Melanogrammus aeglefinus), turbot (Scophthalmus maximus)), the American lobster (Homarus americanus), and snow crab (Chionoecetes opilio) (Castañeda et al. 2020; DFO 2022). For some of those species, OECMs are in place to protect spawning habitats, stock productivity, and nursery areas (e.g., Haddock Box, Gander Bay Lobster Closure, Hawke Channel Closure; Table S1), which may become ineffective.
While projections of PHYC and ZOOC largely agree in the direction of change across the two ESMs, with the exception of areas in northern Baffin Bay, NPP projections disagree. For example, where GFDL-ESM4.1 projects NPP decreases in the Gulf of St. Lawrence, Davis Strait, and northern Baffin Bay, IPSL-CM6A-LR projects large increases. NPP projections are considered to have substantial uncertainties in the CMIP6 ESM ensemble on a global scale (Bopp et al. 2022). Additionally, for ESM projections in Arctic latitudes, where data can be scarce and coastal dynamics difficult to capture (e.g., sea-ice dynamics, biases in Arctic deep water temperature and salinity representation; Khosravi et al. 2022), add another layer to the projection uncertainty. Hence, our results for the northern areas of the focus region should be interpreted with these sources of uncertainty in mind.
The simulated physical and biogeochemical changes are driving TCB changes in MEM simulations. Our MEM ensemble largely projects that marine biomass decreases in the southern, more temperate regions, and increases largely in the polar and subpolar latitudes. All fully established MPAs in Atlantic Canada were located within hotspots of TCB decreases for end-century projections under SSP5-8.5 (50% for mid-century projections). Those projected changes can be expected to be of lesser magnitude under SSP1-2.6, highlighting the importance of implementing effective climate change mitigation policies (Tittensor et al. 2021). OECMs located along the Labrador and Baffin Island coasts were largely located within refugia of biomass changes, whereas OECMs south of Newfoundland and on the Scotian Shelf were in hotspots of TCB changes (Figs. 1 and 5a and S22).
OECMs located along the Labrador and Baffin Island coasts did not overlap with hotspots of TCB changes but were generally in regions of medium to low projected (±0%–20%) mid- and end-century TCB changes. In Canada, OECMs are designated under the Fisheries Act to protect selected populations and their habitats from fisheries impacts, focusing on sustainable fisheries management objectives rather than biodiversity conservation (Lemieux et al. 2019). By mid-century, our TCB projections suggest that 35 out of 39 (∼90%) OECMs may fulfill their objectives to protect some specific habitats under ongoing climate change. This is supported, given that these OECMs overlap with areas of low changes (lower 10th percentile) in key physical variables. By the end of the century, however, only 4 out of 39 (∼10%) OECMs overlapped with areas of low change. These findings should also be interpreted in the context of the state of the Northwest Atlantic groundfish populations, which are still depleted and struggling to recover, despite often being the focus of OECM objectives (Shackell et al. 2021). Achieving long-term, effective protection through OECMs is consequently challenging in regions that have already experienced a collapse of the groundfish community (Petrie et al. 2009; Shackell et al. 2021) in addition to ongoing climate change impacts. This is not a problem unique to OECMs, but rather a general challenge for overexploited fish populations that have lower resilience to added climate change impacts. Here, adaptive management strategies that combine tools and approaches, protecting life stages and habitat more holistically, are needed (Bryndum-Buchholz et al. 2022), which can include OECMs and other spatial marine conservation measures.
The projected TCB changes are particularly robust in the southern region, where inter-model metrics suggest large model agreement and lower inter-model SD. In the northern regions, such as Baffin Bay and along the Labrador and Newfoundland coasts, model agreement is consistently low, indicating less robust biomass projections. Areas of low model agreement among the MEMs appear to be primarily determined by ESM disagreement in NPP and plankton projections, highlighting the important role of these variables in driving marine consumer biomass projection patterns within the Fish-MIP ensemble. The associated MEM disagreement also coheres with the configuration of individual MEMs, where some use NPP and others biomass levels of PHYC and ZOOC to force TCB changes (Heneghan et al. 2021).
We found that the cumulative impacts of four or more drivers concentrated in waters around the Canadian Maritimes and the Gulf of Maine, in both time horizons. The projected changes in the Gulf of Maine are in line with recent observations in the region (Pershing et al. 2021), which may give insight into near-future changes further north in the Canadian Maritimes. Recently, the Gulf of Maine has seen one of the fastest rises in temperatures compared with the global mean, negatively impacting populations of commercially important species such as Atlantic cod and American lobster (Pershing et al. 2015, 2021). On the other hand, an influx of warm-adapted species from the south has led to a restructuring of the food web (Friedland et al. 2019, 2021), and similar northward shifts of species are projected for the Scotian Shelf (Shackell et al. 2014).
To adequately respond to climate-driven changes within established and future conservation areas in the Northwest Atlantic Ocean, directed efforts are needed in terms of area design, placement, and monitoring that are anchored in proactive and climate-adaptive policies and management objectives (Tittensor et al. 2019; O'Regan et al. 2021; Bryndum-Buchholz et al. 2022). The unpredictable dynamics of climate change call for dynamic conservation measures. Conservation network design needs to move away from being firmly static in space towards a coupled network of dynamic and permanent conservation measures (D'Aloia et al. 2019; Tittensor et al. 2019; Bryndum-Buchholz et al. 2022). To identify areas with communities and (or) species most vulnerable to climate change, ecosystem model projections and ecological vulnerability assessments need to be integrated into protected area network design (Bryndum-Buchholz et al. 2022; Boyce et al. 2022a). Directed monitoring that is linked to operational climate-focused indicators, targets, and thresholds is needed for adequate and ongoing effectiveness of the respective protected area (O'Regan et al. 2021; Bryndum-Buchholz et al. 2022).
The identified single-factor and cumulative climate hotspots and refugia in the region can potentially challenge the management objectives of the established MPAs and OECMs in the future. As marine species respond to climate-driven ecosystem changes, including leaving their currently protected habitats, existing conservation measures may become less effective, depending on their goals. While they will always contain some biodiversity, if they are put in place to protect specific species or habitats, these may change over time.
Protection of our identified climate refugia may allow more time for the respective ecosystems to adapt. Such refugia can act as stepping-stones for species moving into new, more favourable habitats due to climate-driven ecosystem changes. Here, for example, the concept of stepping-stones can refer to remaining habitats at the southern edge of species’ distributions, potentially slowing rates of local extirpation and ideally allowing for populations to remain a healthy size as they shift northwards. In addition, climate refugia could be candidates for future protected areas within an adaptive Canadian marine conservation network that includes both static and dynamic conservation areas and adaptive management of surrounding areas (Tittensor et al. 2019; Parks et al. 2023). Ideally, a balanced conservation approach is needed that includes refugia and other climate futures to span all potential futures within the respective area.
Based on the cumulative impacts of identifying future climate refugia, new priority sites for marine conservation areas within the focus region can be suggested. By mid-century, climate refugia are projected to exist on the southern Scotian Shelf, along the east coast of the United States, and in Baffin Bay. Those climate refugia will largely disappear by the end of the 21st century, indicating that proactive conservation measures in these regions may act as buffers against climate-driven changes, facilitating ecosystem resilience. Establishing protected areas in the southern climate refugia, which are also currently important grounds for commercial fisheries, can facilitate ecosystem resilience by minimizing additional stressors, such as intensive fishing pressure, that can act additively or synergistically with climate change impacts (Bindoff et al. 2019; Gissi et al. 2021). Inuit-led and managed protected areas in the northern climate refugia can be beneficial for protecting historically less intensively exploited species and habitats, especially in the context of the expected increase in fishing pressure and other marine exploitation in Canada's Arctic Ocean (Bryndum-Buchholz et al. 2022).
Our ensemble projections can serve as a data source for helping to guide management and marine conservation planning; however, there are a series of limitations that need to be addressed to improve these projections. First, the TCB projections explored here do not account for the effect of fishing impacts, which can interact with climate change impacts (Griffith et al. 2012; Galbraith et al. 2017; Coll et al. 2020), nor do they account for the effects of current MPAs and OECMs on the respective ecosystems they protect now and in the future. Consequently, projected biomass changes in an exploited Northwest Atlantic ecosystem may be dependent on fisheries management regimes, fishing pressure, and spatial management. Other human activities such as oil and gas extraction, marine mining, shipping, and tourism and recreation can add to the cumulative impacts on the ocean (Jouffray et al. 2020), affecting projections of future biomass changes. This is important to consider for current and future marine conservation planning as some MPAs and OECMs in the region do allow for certain types or levels of exploitation, including industrial commercial fishing, subsurface exploration, and mining (Lemieux et al. 2019; Lemieux and Gray 2020).
Second, our analysis focuses on one axis of biological change within the studied region—total consumer biomass. Though we presented the ESM changes in oxygen and pH, very few of the MEMs used these variables to estimate TCB (Table S2). Thus, TCB changes are likely underestimated. For instance, the projected TCB decrease within the Gulf of St. Lawrence may have a higher magnitude for both time horizons, given that some of the climate hotspots within the Gulf of St. Lawrence show low (lower 10th percentile) surface and bottom temperature increases, while surface and bottom oxygen concentrations are projected to decrease considerably (upper 90th percentile) (Tables S3 and S4). Additionally, biological change is characterized by many other axes, such as species richness, relative abundance, species interactions, changes in ecosystem engineers, and disease incidents (Doney et al. 2012). Hence, while our results provide big-picture changes that can guide future marine conservation planning, they do not provide the complete picture of changes in the respective ecosystem. By complementing our study with other indices or metrics that reflect different facets of the impacts of climate change (e.g., Boyce et al. 2022a, 2022b), a more complete picture may emerge.
Third, due to the relatively low resolution (1°) of both the global ESMs and the global MEMs, our ensemble projections need to be interpreted as broader scale insights into potential future effects of climate change in the Northwest Atlantic region. For example, ESMs resolve the large-scale climatological features of ocean physics in the Northwest Atlantic Ocean reasonably well, while the representation of the detailed regional current structure is inadequate (Loder et al. 2015; Lavoie et al. 2019). This leads to a warm bias, which is common among the coarse-resolution global ESMs (Loder et al. 2015; Saba et al. 2016), including GFDL-ESM4 and IPSL-CM6A-LR. Yet, in a recent ranking of model performance in resolving key environmental factors in coastal Northwest Atlantic ecosystems, GFDL-ESM4 and IPSL-CM6A-LR ranked at 4 and 5 out of a selection of 29 ESMs (Laurent et al. 2021), indicating a relatively good representation of observed SST, chlorophyll, and nitrate concentration in the region. In addition, most of the global MEMs have poor taxonomic resolution and restricted representations of several key ecological processes (e.g., benthic–pelagic interactions) that would need to be improved to properly account for local and regional ecosystem dynamics. To project smaller scale and more complex coastal dynamics, regional, high-resolution ecosystem and biogeochemical models are likely more informative for site-specific management decisions; however, at the time of writing, not many high-resolution ecosystem models exist for the study region that project into the future. One method to project regional, coastal marine ecosystem responses to future climate change would be to spatially downscale global ESMs to high-resolution regional models (Holt et al. 2017; Laurent et al. 2018) to force regional MEMs, but that has not been done yet.
Conclusion and outlook
Our ensemble projections in the Northwest Atlantic Ocean support expectations that climate change is impacting and will continue to impact mid- to high-latitude marine ecosystems and result in substantial consequences for Canada's future marine conservation planning. The ESM and MEM ensembles had spatial variations in the uncertainty of projected changes, especially in coastal areas. Nevertheless, our projections can help to indicate where to direct ecosystem vulnerability assessments and climate-informed monitoring and ultimately guide the placement of areas of interest and priority sites for adaptive marine conservation. This includes our identified climate hotspots and refugia in terms of spotlighting priority areas (e.g., Gulf of St. Lawrence, Corsair and Georges Canyons Conservation Area, and Northeast Channel Coral Conservation Area), where monitoring and regional modelling efforts should be enhanced to inform climate-smart protected area management and planning. Ultimately, embedding ensemble projections into Canada's marine conservation toolbox can support climate-resilient marine conservation planning, as the country works towards ambitious national and international conservation commitments.
Acknowledgements
We thank ISIMIP for assistance with processing ESM inputs and outputs and the ESM community for enabling these impact analyses. We also thank all marine ecosystem modelers who contributed to the Fish-MIP initiative. ABB acknowledges financial support from the MEOPAR Postdoctoral Fellowship Award 2020–2021, 2021–2022, and the Ocean Frontier Institute Modules G and H funded by the Canada First Research Excellence Fund. HKL acknowledges funding from the Natural Sciences and Engineering Research Council (NSERC) of Canada. Funding for Hubert du Pontavice was provided by the NOAA NEFSC's "New England's Groundfish in a Changing Climate” program. MC would like to acknowledge partial funding from the Spanish National Project ProOceans (PID2020-118097RB-I00), the EU grant agreement No 101059407 (MarinePlan project), and the “Severo Ochoa Centre of Excellence” accreditation (CEX2019-000928-S) to the Institute of Marine Science. OM acknowledges the EU H2020 Grant No. 817578 (TRIATLAS). CMP acknowledges support from NOAA grants NA20OAR4310438, NA20OAR4310441, and NA20OAR4310442. DPT acknowledges funding from the Jarislowsky Foundation and NSERC. JDE was funded by the Australian Research Council Discovery Project No. DP19010229. JLB and CN were supported by Australian Research Council FT210100798. JG acknowledges support from the National Aeronautics and Space Administration (NASA) under Grant No. 80NSSC21K0420.
References
Ban S.S., Alidina H.M., Okey T.A., Gregg R.M., Ban N.C. 2016. Identifying potential marine climate change refugia: a case study in Canada's Pacific marine ecosystems. Global Ecology and Conservation, 8: 41–54.
Barneche D.R., Hulatt C.J., Dossena M., Padfield D., Woodward G., Trimmer M., Yvon-Durocher G. 2021. Warming impairs trophic transfer efficiency in a long-term field experiment. Nature, 592(7852): 76–79. https://doi.org/10.1038/s41586-021-03352-2.
Bindoff N.L., Cheung W.W.L., Kairo J.G., Arístegui J., Guinder V.A., Hallberg R., et al. 2019. Changing ocean, marine ecosystems, and dependent communities. In IPCC special report on the ocean and cryosphere in a changing climate. Edited by Pörtner H.-O., Roberts D.C., Masson-Delmotte V., Zhai P., Tignor M., Poloczanska E., Mintenbeck K., Alegría A., Nicolai M., Okem A., Petzold J., Rama B., Weyer N.M. Cambridge University Press, Cambridge, UK. pp. 447–587.
Blanchard J.L., Jennings S., Holmes R., Harle J., Merino G., Allen J.I., et al. 2012. Potential consequences of climate change for primary production and fish production in large marine ecosystems. Philosophical Transactions of the Royal Society B: Biological Sciences, 367: 2979–2989.
Bopp L., Aumont O., Kwiatkowski L., Clerc C., Dupont L., Ethé C., et al. 2022. Diazotrophy as a key driver of the response of marine net primary productivity to climate change. Biogeosciences, 19: 4267–4285.
Bopp L., Resplandy L., Orr J.C., Doney S.C., Dunne J.P., Gehlen M., et al. 2013. Multiple stressors of ocean ecosystems in the 21st century: projections with CMIP5 models. Biogeosciences, 10: 6225–6245.
Boucher O., Servonnat J., Albright A.L., Aumont O., Balkanski Y., Bastrikov V., et al. 2020. Presentation and evaluation of the IPSL-CM6A-LR climate model. Journal of Advances in Modeling Earth Systems, 12: e2019MS002010.
Boyce D.G., Tittensor D.P., Fuller S., Henson S., Kaschner K., Reygondeau G., et al. 2022b. Operationalizing climate risk in a global warming hotspot. bioRxiv, 2022-07. bioRxiv.
Boyce D.G., Tittensor D.P., Garilao C., Henson S., Kaschner K., Kenser-Reyes K., et al. 2022a. A climate risk index for marine life. Nature Climate Change, 12: 854–862.
Bryndum-Buchholz A., Boerder K., Stanley R.R.E., Hurley I., Boyce D.G., Dunmall K.M., 2022. A climate-resilient marine conservation network for Canada. FACETS, 7: 571–590.
Bryndum-Buchholz A., Prentice F., Tittensor D.P., Blanchard J.L., Cheung W.W., Christensen V., et al. 2020. Differing marine animal biomass shifts under 21st century climate change between Canada's three oceans. FACETS, 5: 105–122.
Carozza D.A., Bianchi D., Galbraith E.D. 2016. The ecological module of BOATS-1.0: a bioenergetically constrained model of marine upper trophic levels suitable for studies of fisheries and ocean biogeochemistry. Geoscientific Model Development, 9: 1545–1565.
Castañeda R.A., Burliuk C.M., Casselman J.M., Cooke S.J., Dunmall K.M., Forbes L.S., et al. 2020. A brief history of fisheries in Canada. Fisheries, 45: 303–318.
Cheung W.W., Dunne J., Sarmiento J.L., Pauly D. 2011. Integrating ecophysiology and plankton dynamics into projected maximum fisheries catch potential under climate change in the Northeast Atlantic. ICES Journal of Marine Science, 68: 1008–1018.
Christensen V., Coll M., Buszowski J., Cheung W.W., Frölicher T., Steenbeek J., et al. 2015. The global ocean is an ecosystem: simulating marine life and fisheries. Global Ecology and Biogeography, 24: 507–517.
Coll M., Steenbeek J., Pennino G.M., Buszowski J., Kaschner K., Lotze H.K., et al. 2020. Advancing global ecological modelling capabilities to simulate future trajectories of change in marine ecosystems. Frontiers in Marine Science – Marine Fisheries, Aquaculture and Living Resources, 7.
D'Aloia C.C., Naujokaitis-Lewis I., Blackford C., Chu C., Curtis J.M., Darling E., et al. 2019. Coupled networks of permanent protected areas and dynamic conservation areas for biodiversity conservation under climate change. Frontiers in Ecology and Evolution, 7: 27.
Dankers R., Kundzewicz Z.W. 2020. Grappling with uncertainties in physical climate impact projections of water resources. Climatic Change, 163: 1379–1397.
DFO. 2021. Reaching Canada's marine conservation targets. [Online]. Available from https://dfo-mpo.gc.ca/oceans/conservation/plan/index-eng.html.
DFO. 2022. Seafisheries landed value by province. [Online]. https://www.dfo-mpo.gc.ca/stats/commercial/land-debarq/sea-maritimes/s2020pv-eng.htm [accessed 23 December 2022].
Doney S.C., Ruckelshaus M., Emmett Duffy J., Barry J.P., Chan F., English C.A., et al. 2012. Climate change impacts on marine ecosystems. Annual Review of Marine Science, 4: 11–37.
Du Pontavice H., Gascuel D., Reygondeau G., Stock C., Cheung W.W.L. 2021. Climate-induced decrease in biomass flow in marine food webs may severely affect predators and ecosystem production. Global Change Biology, 27: 2608–2622.
Dufour F., Arrizabalaga H., Irigoien X., Santiago J. 2010. Climate impacts on albacore and bluefin tunas migrations phenology and spatial distribution. Progress in Oceanography, 86: 283–290.
Dulvy N.K., Rogers S.I., Jennings S., Stelzenmuller V., Dye S.R., Skjoldal H.R. 2008. Climate change and deepening of the North Sea fish assemblage: a biotic indicator of warming seas. Journal of Applied Ecology, 454: 1029–1039.
Dunne J.P., Horowitz L.W., Adcroft A.J., Ginoux P., Held I.M., John J.G., et al. 2020. The GFDL Earth System Model version 4.1 (GFDL-ESM 4.1): overall coupled model description and simulation characteristics. Journal of Advances in Modeling Earth Systems, 12: e2019MS002015.
Eddy T.D., Bernhardt J.R., Blanchard J.L., Cheung W.W.L., Colleter M., Du Pontavice H., et al. 2021. Energy flow through marine ecosystems: confronting transfer efficiency. Trends in Ecology and Evolution, 36: 76–86.
Exbrayat J.F., Bloom A.A., Falloon P., Ito A., Smallman T.L., Williams M. 2018. Reliability ensemble averaging of 21st century projections of terrestrial net primary productivity reduces global and regional uncertainties. Earth System Dynamics, 9: 153–165.
Eyring V., Gleckler P.J., Heinze C., Stouffer R.J., Taylor K.E., Balaji V., et al. 2016. Towards improved and more routine Earth system model evaluation in CMIP. Earth System Dynamics, 7: 813–830.
Flanders Marine Institute. 2019. Maritime boundaries geodatabase: maritime boundaries and exclusive economic zones (200NM), version 11. Available from https://www.marineregions.org/.
Friedland K.D., Langan J.A., Large S.I., Selden R.L., Link J.S., Watson R.A., et al. 2019. Changes in higher trophic level productivity, diversity and niche space in a rapidly warming continental shelf ecosystem. Science of the Total Environment, 704: 135270.
Friedland K.D., Smoliński S., Tanaka K.R. 2021. Contrasting patterns in the occurrence and biomass centers of gravity among fish and macroinvertebrates in a continental shelf ecosystem. Ecology and Evolution, 11: 2050–2063.
Galbraith E.D., Carozza D.A., Bianchi D.A. 2017. A coupled human–Earth model perspective on long-term trends in the global marine fishery. Nature Communications, 8: 1–7.
Gascuel D., Guenette S., Pauly D. 2011. The trophic-level-based ecosystem modelling approach: theoretical overview and practical uses. ICES Journal of Marine Science, 68: 1403–1416.
Gissi E., Manea E., Mazaris A.D., Fraschetti S., Almpanidou V., Bevilacqua S., et al. 2021. A review of the combined effects of climate change and other local human stressors on the marine environment. Science of the Total Environment, 755:142564.
Gonçalves Neto A., Langan J.A., Palter J.B. 2021. Changes in the Gulf Stream preceded rapid warming of the Northwest Atlantic Shelf. Communications Earth & Environment, 2: 74.
Gordó-Vilaseca C., Stephenson F., Coll M., Lavin C., Costello M.J. 2023. Three decades of increasing fish biodiversity across the north-east Atlantic and the Arctic Ocean. Proceedings of the National Academy of Science of the United States of America, 120: e2120869120.
Government of Canada. 2022. Canadian Protected and Conserved Areas Database. [Online]: Available from https://www.canada.ca/en/environment-climate-change/services/national-wildlife-areas/protected-conserved-areas-database.html.
Grady J.M., Maitner B.S., Winter A.S., Kaschner K., Tittensor D.P., Record S., et al. 2019. Metabolic asymmetry and the global diversity of marine predators. Science, 3636425: eaat4220.
Griffith G.P., Fulton E.A., Gorton R., Richardson A.J. 2012. Predicting interactions among fishing, ocean warming, and ocean acidification in a marine system with whole-ecosystem models. Conservation Biology, 26: 1145–1152.
Halpern B.S., Frazier M., Potapenko J., Casey K.S., Koenig K., Longo C., et al. 2015. Spatial and temporal changes in cumulative human impacts on the world's ocean. Nature Communication, 6: 7615.
Halpern B.S., Walbridge S., Selkoe K.A., Kappel C.V., Micheli F., d'Agrosa C., et al. 2008. A global map of human impact on marine ecosystems. Science, 319: 948–952.
Hastings R.A., Rutterford L.A., Freer J.J., Collins R.A., Simpson S.D., Genner M.J. 2020. Climate change drives poleward increases and equatorward declines in marine species. Current Biology, 30: 1572–1577.
Heneghan R.F., Everett J.D., Sykes P., Batten S.D., Edwards M., Takahashi K., et al. 2020. A functional size-spectrum model of the global marine ecosystem that resolves zooplankton composition.Ecological Modelling, 435: 109265.
Heneghan R.F., Galbraith E., Blanchard J.L., Harrison C., Barrier N., Bulman C., et al. 2021. Disentangling diverse responses to climate change among global marine ecosystem models. Progress in Oceanography, 198: 102659.
Holt J., Hyder P., Ashworth M., Harle J., Hewitt H.T., Liu H., et al. 2017. Prospects for improving the representation of coastal and shelf seas in global ocean models. Geoscientific Model Development, 10: 499–523.
Jennings S., Collingridge K. 2015. Predicting consumer biomass, size-structure, production, catch potential, responses to fishing and associated uncertainties in the world's marine ecosystems. PLoS One, 10: e0133794.
Jouffray J.B., Blasiak R., Norström A.V., Österblom H., Nyström M. 2020. The blue acceleration: the trajectory of human expansion into the ocean. One Earth, 2: 43–54.
Keppel G., Van Niel K.P., Wardell-Johnson G.W., Yates C.J., Byrne M., Mucina L., et al. 2012. Refugia: identifying and understanding safe havens for biodiversity under climate change. Global Ecology and Biogeography, 21: 393–404.
Khosravi N., Wang Q., Koldunov N., Hinrichs C., Semmler T., Danilov S., et al. 2022. The Arctic Ocean in CMIP6 models: biases and projected changes in temperature and salinity. Earth's Future, 10: e2021EF002282.
Langan J.A., Puggioni G., Oviatt C.A., Henderson M.E., Collie J.S. 2021. Climate alters the migration phenology of coastal marine species. Marine Ecology Progress Series, 660: 1–18.
Laurent A., Fennel K., Kuhn A. 2021. An observation-based evaluation and ranking of historical Earth system model simulations in the northwest North Atlantic Ocean. Biogeosciences, 18: 1803–1822.
Laurent A., Fennel K., Ko D.S., Lehrter J. 2018. Climate change projected to exacerbate impacts of coastal eutrophication in the northern Gulf of Mexico. Journal of Geophysical Research: Oceans, 123: 3408–3426.
Lavoie D., Lambert N., Gilbert D. 2019. Projections of future trends in biogeochemical conditions in the northwest Atlantic using CMIP5 Earth system models. Atmosphere-Ocean, 57: 18–40.
Lemieux C.J., Gray P.A. 2020. How Canada “hamburger manufactured” its way to marine protected area success and a more effective and equitable way forward for the post-2020 conservation agenda. Journal of Environmental Studies and Sciences, 10: 483–491.
Lemieux C.J., Gray P.A., Devillers R., Wright P.A., Dearden P., Halpenny E.A., et al. 2019. How the race to achieve Aichi Target 11 could jeopardize the effective conservation of biodiversity in Canada and beyond. Marine Policy, 99: 312–323.
Loder J.W., van der Baaren A., Yashayaev I. 2015. Climate comparisons and change projections for the Northwest Atlantic from six CMIP5 models. Atmosphere–Ocean, 53: 529–555.
Lotze H.K. 2021. Marine biodiversity conservation. Current Biology, 31: R1190–R1195.
Lotze H.K., Mellon S., Coyne J., Betts M., Burchell M., Fennel K., et al. 2022. Long-term ocean and resource dynamics in a hotspot of climate change. FACETS, 7: 1142–1184.
Lotze H.K., Tittensor D.P., Bryndum-Buchholz A., Eddy T.D., Cheung W.W.L., Galbraith E.D., et al. 2019. Global ensemble projections reveal trophic amplification of ocean biomass declines with climate change. Proceedings of the National Academy of Sciences, 116: 12907–12912.
Maury O. 2010. An overview of APECOSM, a spatialized mass balanced “Apex Predators ECOSystem Model” to study physiologically structured tuna population dynamics in their ecosystem. Progress in Oceanography, 84: 113–117.
Mora C., Frazier A.G., Longman R.J., Dacks R.S., Walton M.M., Tong E.J., et al. 2013. The projected timing of climate departure from recent variability. Nature, 502: 183–187.
Nye J.A., Link J.S., Hare J.A., Overholtz W.J. 2009. Changing spatial distribution of fish stocks in relation to climate and population size on the Northeast United States continental shelf. Marine Ecology Progress Series, 393: 111–129.
O'Neill B.C., Kriegler E., Ebi K.L., Kemp-Benedict E., Riahi K., Rothman D.S., et al. 2017. The roads ahead: narratives for shared socioeconomic pathways describing world futures in the 21st century. Global Environmental Change, 42: 169–180.
O'Regan S.M., Archer S.K., Friesen S.K., Hunter K.L. 2021. A global assessment of climate change adaptation in marine protected area management plans. Frontiers in Marine Science, 8: 1155.
Orio A., Bergström U., Florin A.B., Lehmann A., Šics I., Casini M. 2019. Spatial contraction of demersal fish populations in a large marine ecosystem. Journal of Biogeography, 46: 633–645.
Parks S.A., Holsinger L.M., Abatzoglou J.T., Littlefield C.E., Zeller K.A. 2023. Protected areas not likely to serve as steppingstones for species undergoing climate-induced range shifts. Global Change Biology, 29: 2681–2696.
Parmesan C., Yohe G. 2003. A globally coherent fingerprint of climate change impacts across natural systems. Nature, 421: 37–42.
Pershing A.J., Alexander M.A., Brady D.C., Brickman D., Curchitser E.N., Diamond A.W., et al. 2021. Climate impacts on the Gulf of Maine ecosystem: a review of observed and expected changes in 2050 from rising temperatures. Elementa Science of the Anthropocene, 9: 00076.
Pershing A.J., Alexander M.A., Hernandez C.M., Kerr L.A., Le Bris A., Mills K.E., et al. 2015. Slow adaptation in the face of rapid warming leads to collapse of the Gulf of Maine cod fishery. Science, 350: 809–812.
Petrie B., Frank K.T., Shackell N.L., Leggett W.C. 2009. Structure and stability in exploited marine fish communities: quantifying critical transitions. Fisheries Oceanography, 18: 83–101.
Petrik C.M., Stock C.A., Andersen K.H., van Denderen P.D., Watson J.R. 2019. Bottom-up drivers of global patterns of demersal, forage, and pelagic fishes. Progress in Oceanography, 176: 102124.
Petrik C.M., Stock C.A., Andersen K.H., van Denderen P.D., Watson J.R. 2020. Large pelagic fish are most sensitive to climate change despite pelagification of ocean food webs. Frontiers in Marine Science, 7: 588482.
Poloczanska E.S., Brown C.J., Sydeman W.J., Kiessling W., Schoeman D.S., Moore P.J., et al. 2013. Global imprint of climate change on marine life. Nature Climate Change, 3: 919–925.
Pörtner H.O., Knust R. 2007. Climate change affects marine fishes through the oxygen limitation of thermal tolerance. Science, 315: 95–97.
Richaud B., Kwon Y.O., Joyce T.M., Fratantoni P.S., Lentz S.J. 2016. Surface and bottom temperature and salinity climatology along the continental shelf off the Canadian and US East Coasts. Continental Shelf Research, 124: 165–181.
Saba V.S., Griffies S.M., Anderson W.G., Winton M., Alexander M.A., Delworth T.L., et al. 2016. Enhanced warming of the Northwest Atlantic Ocean under climate change. Journal of Geophysical Research: Oceans, 121: 118–132.
Séférian R., Berthet S., Yool A., Palmieri J., Bopp L., Tagliabue A., et al. 2020. Tracking improvement in simulated marine biogeochemistry between CMIP5 and CMIP6. Current Climate Change Reports, 6: 95–119.
Shackell N.L., Keith D.M., Lotze H.K. 2021. Challenges of gauging the impact of area-based fishery closures and OECMs: a case study using long-standing Canadian groundfish closures. Frontiers in Marine Science, 8: 612859.
Shackell N.L., Ricard D., Stortini C. 2014. Thermal habitat index of many Northwest Atlantic temperate species stays neutral under warming projected for 2030 but changes radically by 2060. PLoS One, 9: e90662.
Tittensor D.P., Beger M., Boerder K., Boyce D.G., Cavanagh R.D., Cosandey-Godin A., et al. 2019. Integrating climate adaptation and biodiversity conservation in the global ocean. Science Advances, 5: eaay9969.
Tittensor D.P., Eddy T.D., Lotze H.K., Galbraith E.D., Cheung W., Barange M., et al. 2018a. A protocol for the intercomparison of marine fishery and ecosystem models: Fish-MIP v1.0. Geoscientific Model Development, 11: 1421–1442.
Tittensor D.P., Lotze H.K., Eddy T.D., Galbraith E.D., Cheung W.W.L., Bryndum-Buchholz A., et al. 2018b. ISIMIP2a simulation data from fisheries and marine ecosystems (Fish-MIP; global) sector. GFZ Data Services.
Tittensor D.P., Novaglio C., Harrison C.S., Heneghan R.F., Barrier N., Bianchi D., et al. 2021. Next-generation ensemble projections reveal higher climate risks for marine ecosystems. Nature Climate Change, 11: 973–981.
Tokarska K.B., Stolpe M.B., Sippel S., Fischer E.M., Smith C.J., Lehner F., et al. 2020. Past warming trend constrains future warming in CMIP6 models. Science Advances, 6: eaaz9549.
Wilson K.L., Tittensor D.P., Worm B., Lotze H.K. 2020. Incorporating climate change adaption into marine protected area planning. Global Change Biology, 26: 3251–3267.
Supplementary material
Supplementary Material 1 (DOCX / 55.5 MB).
- Download
- 55.53 MB
Information & Authors
Information
Published In

FACETS
Volume 8 • January 2023
Pages: 1 - 16
Editor: S.J. Cooke
History
Received: 13 February 2023
Accepted: 31 May 2023
Version of record online: 17 August 2023
Notes
This article is part of a collection entitled "Climate change and the Canadian marine conservation framework".
Copyright
© 2023 The Authors. This work is licensed under a Creative Commons Attribution 4.0 International License (CC BY 4.0), which permits unrestricted use, distribution, and reproduction in any medium, provided the original author(s) and source are credited.
Data Availability Statement
All standardized forcing variables from the ESMs are available at https://doi.org/10.48364/ISIMIP.575744.1; all outputs from the MEMs are available via ISIMIP (https://www.isimip.org/gettingstarted/data-access/).
Key Words
Sections
Subjects
Plain Language Summary
Model ensemble emphasizes marine conservation challenges in the Northwest Atlantic Ocean with climate change
Authors
Author Contributions
Conceptualization: ABB, HKL
Formal analysis: ABB
Methodology: ABB, HKL
Resources: JLB, MC, HDP, JDE, JG, RFH, OM, CN, JPA, CMP, DPT, HKL
Validation: JLB, MC, HDP, JDE, JG, RFH, OM, CN, JPA, CMP, DPT, HKL
Visualization: ABB
Writing – original draft: ABB
Writing – review & editing: ABB, JLB, MC, HDP, JDE, JG, RFH, OM, CN, JPA, CMP, DPT, HKL
Competing Interests
The authors have declared that no competing interests exist.
Metrics & Citations
Metrics
Other Metrics
Citations
Cite As
Andrea Bryndum-Buchholz, Julia L. Blanchard, Marta Coll, Hubert Du Pontavice, Jason D. Everett, Jerome Guiet, Ryan F. Heneghan, Olivier Maury, Camilla Novaglio, Juliano Palacios-Abrantes, Colleen M. Petrik, Derek P. Tittensor, and Heike K. Lotze. 2023. Applying ensemble ecosystem model projections to future-proof marine conservation planning in the Northwest Atlantic Ocean. FACETS.
8(): 1-16. https://doi.org/10.1139/facets-2023-0024
Export Citations
If you have the appropriate software installed, you can download article citation data to the citation manager of your choice. Simply select your manager software from the list below and click Download.
There are no citations for this item