A social–ecological geography of southern Canadian lakes
Abstract
Anthropogenic pressures, including urban and agricultural expansion, can negatively influence a lake's capacity to provide aquatic ecosystem services (ES). However, identifying lakes most at risk of losing their ES (i.e., higher vulnerability) requires integrating information on lake ecological state, global change threats, and ES use. Here, we provide a social–ecological framework that combines these features within a regional context by evaluating the ecological state of 659 lakes across Canada. Using the deviation of impacted lakes from reference ones, we identified much higher total nitrogen and chloride concentrations as the main indicators of an altered lake ecological state in all regions identified. Lake ecological state was mapped using an additive colour model along with regional scores of threat levels and recreational ES use. Urban and agriculturally developed areas were linked to higher lake vulnerability and ES loss. Lakes in Southern Ontario were most concerning, being highly altered, under threat, and heavily used. Lakes near coastal urban centers were altered and used, but less threatened, whereas those in the Prairies were altered and threatened, but less used. Our novel framework provides the first social–ecological geography of Canadian lakes, and is a promising tool to assess lake state and vulnerability at scales relevant for management.
Introduction
With over 900,000 lakes shaping its landscape, Canada is the most lake-rich country in the world (Minns et al. 2008). These lakes hold inherent cultural, economic, and ecological value to the peoples of Canada, including indigenous communities (i.e., First Peoples), and provide a wide variety of aquatic ecosystem services (ES), ranging from drinking water to recreational opportunities such as fishing and swimming, which all contribute to human well-being (Millennium Ecosystem Assessment 2005; Keeler et al. 2012; Bradford et al. 2017). In fact, over 90% of Canadians rely on lakes and rivers for their drinking water (Environment Canada 2011), and recreational fisheries represent a $2.5 billion (CAN) industry (Fisheries and Oceans Canada 2019). However, these valuable ES are under threat by anthropogenic pressures that alter surface water quality (Brauman et al. 2007; Keeler et al. 2012; Dugan et al. 2017). These include local land-use changes, increasing nutrient and pollutant inputs from the watershed, as well as regional climate change that can severely disrupt a lake's hydrological regime, thermal structure, and internal processing, thus altering a lake's chemical and biological properties (Schindler 2001; Vincent 2009; Carpenter et al. 2011; Jeppesen et al. 2014). Human dependence on aquatic ES is also expected to increase in the face of climate adaptation and increasing population growth (Guo et al. 2010; Cimon-Morin et al. 2014), where water use and withdrawal will need to be adjusted for changes in availability or quality given demands (Brandes and Ferguson 2004; Schindler and Donahue 2006; Bakker and Cook 2011). Therefore, there is an urgent need to protect lakes and the ES they deliver (Baron et al. 2002; Culhane et al. 2019; Hossu 2019), which begins with understanding the regional context in which a lake's ES are threatened.
The response of a lake to different anthropogenic pressures, be they changes in climate or land use, is highly variable given the diversity of lake and watershed traits. A lake's morphometry, regional geology, watershed topography, soil composition, and land cover are all factors that can either amplify or mitigate its response to various pressures (Tang et al. 2005; Jeppesen et al. 2009; Nõges 2009). Combined, these biophysical features will influence a lake's baseline conditions and resilience in providing different aquatic ES. For example, human activities in watersheds increase nutrient loads to lakes (Nielsen et al. 2012), but lakes with a high drainage ratio (watershed area: lake area) tend to be naturally more enriched, receiving greater terrestrial inputs, and as such may be more susceptible to eutrophication (Knoll et al. 2015). Likewise, lakes from the prairies are geologically embedded in nutrient-rich sedimentary rocks and have naturally higher phosphorus (P) concentrations as compared to those in the Boreal Shield (D'Arcy and Carignan 1997; Prepas et al. 2001), resulting in different reference conditions of unimpacted ecosystems. Given the broad range in topographies and surface geologies across Canada (Boyce 2015), the limnological landscape is likely highly diverse. Therefore, a lake's state needs to be considered within a regional biophysical context (Kumagai and Vincent 2003; Soranno et al. 2015) to establish how severely it deviates from its natural state to implement efficient lake management strategies and set reasonable restoration targets.
Beyond understanding how a lake's state deviates from regional reference conditions, protecting a lake's capacity to provide ES into the future requires information on human-driven threats to that state and on known ES use by the population (Villamagna et al. 2013). The latter two components could be considered the social dimensions of a lake's state in terms of the potential loss of ES imparted by human drivers that could influence future use and result in economic loss (Grizzetti et al. 2016; Jones et al. 2016). To our knowledge, this type of integrative assessment does not exist for Canada, and one of the challenges of creating it on a national scale is that the required information is fragmented across various jurisdictions. For example, although there are many water quality monitoring programs across Canada, these initiatives are either carried out at provincial or more local levels, and the methods used to compare lakes are not standardized (Huot et al. 2019). In terms of threats to lakes, there is a high degree of regional variability in land-use change or impacts from invasive species (Minns et al. 2008; Mandrak and Cudmore 2010; Walsh et al. 2016), and although climate change may be more ubiquitous, climate effects vary spatially across Canada (Barrow et al. 2004; Murray et al. 2023). Which ES are valued and how intensively lakes are used for those services will also differ across regions. This may be related to the proximity of human populations to lakes, but it may also differ as to which ES may be available as a function of lake type (Hunt and Dyck 2011). Regardless, knowing whether a lake's ES is at risk or not requires an understanding of whether the ES is used (realized) or in demand (potential use) (Villamagna et al. 2013; Chaplin-Kramer et al. 2019; Mitchell et al. 2021), and this will vary as a function of not only biophysical conditions but social interests as well as accessibility.
The overarching goal of this study is to generate the first social–ecological geography of Canadian lakes. With the purpose of sustaining water quality and aquatic ES into the future, we present an integrated regional spatial analysis of lake ecological state, impending human threats, and recreational ES use across Southern Canada. This required establishing a regionally based evaluation of lake ecological state by first determining the reference biophysical and chemical properties of unimpacted lakes and estimating the deviation of impacted lakes from this regional reference. Using a colour additive model, we then combined this newly derived information on lake ecological state with existing national data sets assessing human threats to lakes and ES use, thus creating a novel and easily interpreted social–ecological portrait of lakes across the country. We suggest that the integration of these three components provides a holistic approach to assessing the overall state or health of the lake ecosystem and enables the identification of the most vulnerable lakes within a region, i.e., those at risk of losing their capacity to deliver ES, for targeted protection.
Methods
Study area, datasets, and socio-ecological framing
To assess the three components of the socio-ecological geography of Southern Canada, data were collected or retrieved from three large-scale national datasets: (1) lake biophysical and chemical characteristics, from the NSERC Canadian Lake Pulse Network—Lake Survey (Huot et al. 2019), (2) threat level, from the World Wildlife Fund (WWF) Canada—Watershed Reports (2017), and (3) recreational uses as ES, from Statistics Canada—Survey on the Importance of Nature to Canadians (Special Surveys Division 1996). We chose these datasets because they were at the national scale and standardized across that scale. For example, other ES could have been explored, such as drinking water, but that information is heavily fragmented across jurisdictions.
The ecological component of our assessment included the novel use of information generated by the Lake Pulse Network Lake Survey in considering how lakes within distinctive lake regions deviated from reference conditions. The social component of our assessment included information derived from the WWF Watershed Reports (2017) on threats to surface waters (https://watershedreports.wwf.ca/#intro), and data from Statistics Canada on in-land water recreational use. WWF did a comprehensive analysis of human-driven threats to surface waters at the watershed level across the country, where information for 167 different sub-watersheds was used. Pressures assessed in that report were similar to those linked to ecosystem status as well as recreational ES in Grizzetti et al. (2016). Finally, we incorporated a quantitative assessment of recreational ES use of lakes across Canada as another social metric. ES use was corrected for the current population and considered realized; we did not assess demand for services (potential use or projected use), although we anticipate that with climate change, demand will increase. The socio-ecological framing of the work presented borrows from theoretical approaches suggested in the literature (Villamagna et al. 2013; Grizzetti et al. 2016), but with a more spatially explicit and quantitative component similar to Martín-López et al. (2017). Although the loss of recreational services would have an economic cost to many regions across Canada (Fisheries and Oceans Canada 2019), we did not incorporate the economic value of these ES in this assessment (Jones et al. 2016).
Lake biophysical and chemical characteristics
Lake selection and classification
One of the goals of the NSERC Canadian Lake Pulse Network was to conduct a national assessment of lake health (Huot et al. 2019). Descriptions of Canada's physiographic regions as well as information on land use and population density are available in supplementary information (supplementary material Text S1, Figs. S1a and S1b). A total of 664 lakes in 12 Canadian ecozones were sampled by Lake Pulse over three yearly summer sampling campaigns (2017–2019). Lakes were selected based on road accessibility and three criteria in a stratified random design: ecozone, lake size, and human impact index (Huot et al. 2019). Ecozones are ecological regions delineated based on similar climate and geological characteristics, such as dominant vegetation and landform features (Ecological Stratification Working Group 1996). Most lakes were sampled in the nine southernmost ecozones (Boreal Shield, Atlantic Maritime, Boreal Plains, Prairies, Montane Cordillera, Pacific Maritime, Boreal Cordillera, Taiga Cordillera, Atlantic Highlands, and Semi-Arid Plateaus) with a few additional lakes sampled in three other ecozones located further north (Taiga Plains, Boreal Cordillera, and Taiga Cordillera). As such, this assessment is largely restricted to southern areas of Canada, nearer to urban areas, and at a maximum distance of 1 km from roads for accessibility. Lakes were also divided into three size classes, such as small (0.1–0.5 km2), medium (0.5–5 km2), and large (5–00 km2), and into three human impact classes (low, moderate, and high). Impact classes were defined as a function of the proportion of land use and land cover (LULC) in each watershed, where urban areas, mines, and agriculture had the highest human impact value (1), pasture and forestry had a medium impact value (0.5), and natural landscapes had no impact (0). Impact classes were attributed to ecozones using the Jenks optimization method based on the distribution of human index values. Thus, the proportion of human land use needed to classify a lake in the “low” or “high” human impact class differed by ecozone (see Huot et al. 2019).
Lake sampling and laboratory analysis
Lakes were sampled between July and the beginning of September using standardized protocols (NSERC Canadian Lake Pulse Network 2021), with approximately 100 variables collected in each lake. For this study, we selected 20 core variables that are relevant for determining the biophysical and ecological state of lakes in Canada and removed those that captured redundant information (Pearson r > 0.8; Table 1). We grouped variables into those that describe physical features such as lake basins and morphometry and those that describe water chemistry (including chlorophyll a—Chl a—as a biological indicator). For chemical variables, we chose variables that reflected lake productivity (total nitrogen, TN; total phosphorus, TP; Chl a, Secchi depth), geology (chloride, Cl−; pH; conductivity; sulphate, SO42−), and carbon inputs (dissolved organic carbon, DOC; absorption coefficients of coloured dissolved organic matter (CDOM) at 254 and 440 nm wavelengths: A440 and SUVA254). All variables considered for this study were sampled from the epilimnion at the deepest sites of the lake (based on a bathymetric map or a rapid depth survey by sampling teams) from a boat.
Table 1.
| Type of variable | Variable | Unit | Transformation |
|---|---|---|---|
| Chemical | Total nitrogen (TN) | mg/L | Log |
| Total phosphorus (TP) | µg/L | Log | |
| Chlorophyll a (Chl a) | µg/L | Log | |
| Dissolved organic carbon (DOC) | mg/L | Log | |
| Secchi depth | m | Square root | |
| A440 | 1/m | Log | |
| SUVA254 | L/mg-m | Square root | |
| Chloride (Cl-) | mg/L | Log | |
| Sulphate (SO42−) | mg/L | Log | |
| C:N ratio | – | Log | |
| C:P ratio | – | Log | |
| N:P ratio | – | Log | |
| pH | – | – | |
| Conductivity (specific) | µS/cm | Log | |
| Morphometric | Lake area | km2 | Log |
| Mean depth | m | Log | |
| Mean slope | – | Log | |
| Altitude | m | Square root | |
| Drainage ratio | – | Log | |
| Dynamic ratio | – | Log | |
| LULC | Fraction of land-use categories in the watershed (agriculture, forestry, mines, pasture, urban, water, or natural landscape) | % | – |
Measurements of Secchi depth (Secchi disk), pH (RBR multi-parameter sonde or a Hannah pH-meter), and conductivity (RBR multi-parameter sonde) were taken on site. For all other chemical variables, water samples were collected in the field with a 2 m-long tube sampler, placed in pre-cleaned conditioned carboys on the boat, transferred into individual samples on shore, stored, and analyzed later. TN, fixed with H2SO4 and stored at 4 °C, was analyzed with a continuous flow analyzer (OI Analytical Flow Solution 3100) using the alkaline persulphate digestion method, coupled with a cadmium reactor (Patton and Kryskalla 2003). TP, stored at 4 °C, was analyzed by colorimetric detection with a spectrophotometer (Ultrospec 2100pro) at 890 nm after potassium persulphate digestion (Wetzel and Likens 2000). Chl a samples were filtered in the dark on GFF filters and stored at −80 °C until measured by fluorometry using a Turner Trilogy Laboratory Fluorometer (Welschmeyer 1994; MacIntyre and Cullen 2005). DOC, prefiltered using a 0.45 µm syringe filter, fixed with HNO3, and stored at 4 °C, was analyzed with an OI Analytical Aurora 1030 W TOC Analyzer following persulphate oxidation. For CDOM absorption coefficients, samples were prefiltered at 0.45 µm using a syringe and stored in an amber bottle at 4 °C, and measured by spectrophotometry after a final filtration at 0.22 µm (Brezonik et al. 2019). We calculated the specific ultraviolet absorbance at 254 nm (SUVA254) by dividing the absorbance at 254 nm (1/m) by the DOC concentration (mg/L) (Weishaar et al. 2003), while A440 was used as is. Cl− and SO42− were prefiltered using a 0.45 µm syringe filter, fixed with HNO3, stored at −20 °C, and analyzed using a Dionex DX-600 Ion Chromatographer following the US Environmental Protection Agency Anion—Method 300.1 (US EPA 1997). We calculated carbon (C), nitrogen (N), and phosphorus (P) ratios from the molar concentrations of DOC, TN, and TP.
Physical variables and land use and land cover
Physical variables included lake depth, size, and shape, along with watershed topographic features. The lake area was obtained from the National Hydro Network (Natural Resources Canada 2015). Mean depth was modelled from the lakemorpho 1.2.0 package in R (Hollister and Stachelek 2017; R Core Team 2020). The mean slope is the mean of the percentage rise inside the watershed calculated from the difference in altitude obtained from the Canadian Digital Elevation Model (CDEM) data layer (Natural Resources Canada 2013). Drainage ratio, an indicator of the amount of external loading to a lake, was calculated as watershed area divided by lake area (Kalff 2002), and the dynamic ratio, an indicator of the proportion of the lake bottom that is subject to resuspension (low-value bowl-like and high-value dish-like lakes), was calculated by dividing the square root of lake area by the mean depth (Håkanson 1982). LULC was derived from the geographic information system (GIS) and calculated as the fraction of the lake watershed area covered by agriculture, forestry, mines, pastures, urban areas, water, or natural landscapes (see Huot et al. 2019 for more information and references).
Determining the lake ecological state
All statistical analyses were performed in R v. 4.0.2 (R Core Team 2020). Five lakes were considered outliers and removed from the dataset: Kississing Lake, which exceeded the size range with an area of 266 km2, Embrees Pond, which was very saline and likely connected to the sea, and the three lakes in the Taiga Cordillera because of a lack of representation in this ecozone. Our final dataset, therefore, contained 659 lakes from 11 ecozones. Missing data for chemical variables were imputed by a random forest algorithm using the “missForest” package (Stekhoven and Buhlmann 2012). Most variables had less than 12% of missing data, except for pH at 21%. In addition, to reduce distribution asymmetry, variables were log or square root transformed (Table 1). To choose the appropriate transformation, we performed the Shapiro–Wilk normality test using the shapiro.test() function and visually assessed distributions using histograms.
To determine the natural reference conditions of lakes in different regions across Canada, we used the chemical and morphometric characteristics of lakes that were classified as having low human impact within the different ecozones (Huot et al. 2019). Within a given region, less than 5% of the watershed area (median value) was used for human activities (agriculture, pasture, grassland, forestry, mines, and urban development; Fig. S2). We performed a linear discriminant analysis (LDA; Legendre et Legendre 2012) to determine how these potential reference lakes differed across groups following Borcard et al. (2018) with the MASS, vegan, and rrcov packages (Venables and Ripley 2002; Todorov and Filzmoser 2010; Oksanen et al. 2020). LDA is a canonical technique that divides a response matrix according to a factor and determines the variables that best discriminate between groups. The descriptors (morphometric and chemical variables) were standardized to compute discriminant functions to quantify the relative contribution of the variable to the discrimination between groups (Borcard et al. 2018). Mean depth and nutrient ratios were excluded from this analysis due to collinearity with other variables. For each group, we computed the percentage of lakes correctly classified by the discriminant functions.
To evaluate the difference between impacted and non-impacted lakes within each group from the LDA, we calculated the deviation of impacted lakes from regional reference conditions. To compare multiple variables with different units, standard scores were calculated per group for each variable using all lakes (including low, medium, and high human impact). The regional lake reference conditions (or “baseline values”) were estimated for each variable by averaging the standard score of their low human impact lakes. The deviation from reference conditions was calculated as the standard score of high and moderate human impact lakes minus the baseline values. Thus, the baseline values were set to zero for every region, allowing the comparison of deviations among different lake regions.
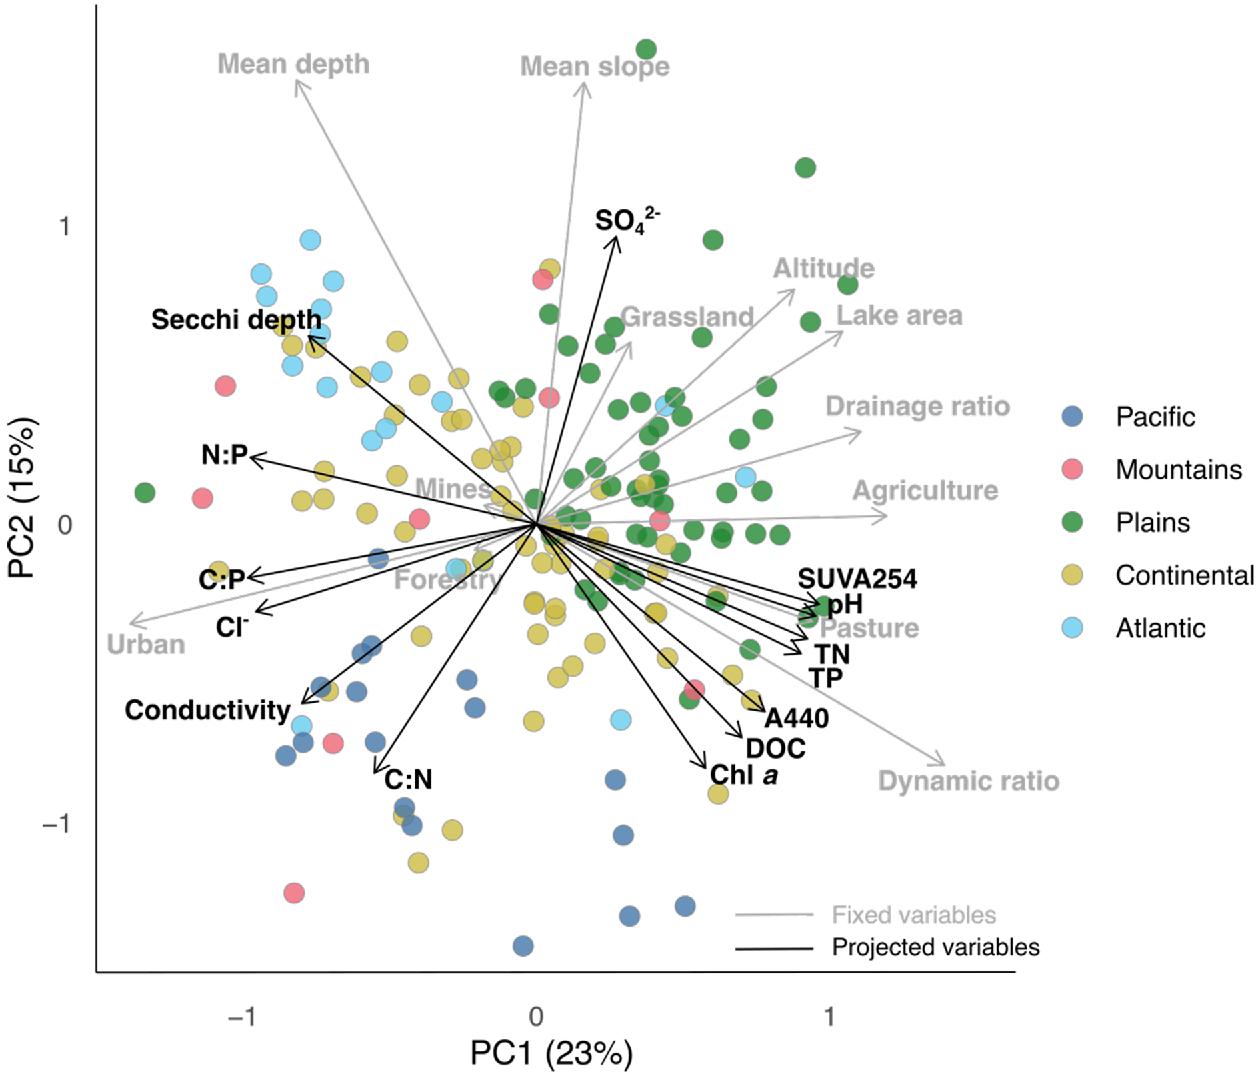
To visualize the correlation between chemical variables and the more fixed landscape components of lake shape and anthropogenic land use in the watershed, we used a principal component analysis (PCA) with passive projection estimated from the vegan package (Oksanen et al. 2020). The deviation in morphometric and land-use variables, which are considered fixed in space, was used to determine the principal components, and the chemical variables were then passively projected onto these principal components. The projected chemical variable represents the linear trend with the environmental variables (morphometry and land use).
Threat level
Based on threats to drinking water sources and aquatic ecosystem health identified by Environment Canada (Environment Canada 2001), WWF's 2017 Watershed Report (WWF-Canada 2017) developed seven indicators of the most significant threats currently facing Canada's watershed, namely pollution, habitat loss, habitat fragmentation, overuse of water, invasive species, flow alteration, and climate change. Among the seven threat indicators reported by the WWF, we selected five that apply to lakes (pollution, climate change, invasive species, overuse of water, and habitat loss). Flow alteration and habitat fragmentation were discarded in part because these threats apply more to rivers, as well as some of the built-in redundancy of some of these indicator threats. The remaining five indicators were calculated based on more specific sub-indicators that are of growing regional concern: pollution includes point-source pollution, pipeline incidents, transportation accidents, and agricultural contamination risks from nitrogen, phosphorus, and pesticide release; habitat loss includes LULC as well as forest loss; overuse of water indicates the ratio of water withdrawal to water supply; invasive species indicates the presence of invasive species; and climate change includes summer and winter temperature anomalies and spring and summer precipitation anomalies.
The presence and magnitude of these threats were assessed in 167 sub-watersheds of Canada's 25 Pearse watersheds (WWF-Canada 2015). The data were originally gathered by the WWF to establish a relative ranking of threats across the country. Threat categories (ranging from “none” to “very high”) for individual indicators were defined according to a regular interval classification system (WWF-Canada 2015). For more details on the methods, see WWF's 2017 Watershed Report “Threat methodology” (https://watershedreports.wwf.ca/#intro). We used the average threat score for the five chosen indicators in the 167 sub-watersheds to capture as much variation as possible. Although sub-watershed scores were presented as threats to rivers, the report explicitly states that the same level of threat applies to lakes and wetlands located within these same sub-watersheds.
Recreational ES use
Statistics Canada conducted the Survey on the Importance of Nature to Canadians among 87,000 Canadians aged 15 years and older in 1996. This survey assessed the social and economic value that Canadians place on nature-related recreational activities (Environment Canada 1999). Of interest to our study is the “water and recreation” theme of this survey, which provides information on four freshwater recreational uses, including participation in (1) swimming and beach activities, (2) sport fishing, (3) canoeing, kayaking, and sailing, and (4) power boating. The metric we applied to assess ES use in this study is participation measured as days per km2 of major drainage area for these four recreational water activities. Participation was calculated by major drainage area (11 in Canada): Maritime Provinces, St. Lawrence, Northern Quebec and Labrador, Southwestern Hudson Bay, Nelson River, Western and Northern Hudson Bay, Great Slave Lake, Pacific, Yukon, Arctic, and Mississippi as defined by the Standard Drainage Area Classification (Natural Resources Canada 2003). Data on recreational use were adjusted to reflect today's population in each major drainage area by multiplying the use frequency by the ratio of the current population (2016 census) to the one in 1996. A composite score was based on the sum of the measured participation in the four recreational services.
Social–ecological geography: creating gradients across Canada
We overlayed the three components of change in lake ecological state, threat level, and recreational ES to create a socio-ecological geography of southern Canadian lakes. The map represents a quantitative approach to assess whether lakes are used recreationally and are vulnerable to losing their capacity to deliver ES or undergoing a decline in their ecological health due to anthropogenic pressures. To produce the map, we used the chemical variables of the impacted lakes that consistently and most strongly deviated from regional baseline values as indicators of the alteration of the lake ecological state. We assigned a default value of 0 to the low human impact lakes (n = 273) since they were used to establish the reference of their region. Given that the selected indicators were typically higher in the impacted lakes compared to the reference, the moderate lakes that had a negative deviation value (n = 45) were also set to 0 and considered unaltered. To obtain an overall score for all threats combined, we averaged the scores for the five selected threats within the sub-watershed. The data for the four recreational ES were summed to give a total number of days of use per major drainage area. Given that the ES data were classes (i.e., from 1–10, 10–15, to >15), we chose the lower limit of these ranges (0.5 when it was 0) for our summed calculation, as the maximum limit was not reported.
To combine all three components, each sampled lake was given a score for threat level, lake state, and recreational ES use according to its geographical position. Each component was assigned a colour: green for lake state, red for threat level, and blue for recreational use. Components were also scaled from 0 to 255, the units of colour intensities, to display the green, red, and blue (RGB) map. Zero (0) represents the lowest value in Canada and appears in black, while 255 represents the highest value in Canada and results in the brightest colour (Fig. 1a). A RGB additive colour model was used to combine all three components on a single map and produce an assortment of colours (Fig. 1b), similar to the approach used in Seekell et al. (2018). The colour gradient helps to identify areas with similar patterns across Canada. We chose this approach as it provides a broad spectrum of possibilities and enables an assessment of the different influences of lakes across the country. For example, a green area indicates a highly altered lake ecological state, a red area indicates a high threat level, and a blue area indicates high recreational ES use. When all three colours are strongly present, the result is white. This means that the recreational services being used are at risk of being lost because the state of the lake and its threat level are of concern. Other possible combinations of two of these colours will result in the following colour code: when recreational services are being used and the lake is altered, but not threatened, cyan; when services are being used and there is a high level of threat, but not altered, magenta; and when the lake is altered, and the threat level is high, but not used, yellow. Ultimately, the lakes to be monitored are located in the magenta, cyan, and white zones because their recreational services are used, and at risk of being lost due to threats (magenta), lake state (cyan), or a combination of both (white).
Fig. 1.

To generate a continuous map over Canada, sampled lake polygons were converted to points based on their centroid. Points were interpolated to a continuous raster surface using ordinary spherical kriging with a variable 12-point search radius. The surface of the raster output was then smoothed using a 100 km-radius focal mean. Subsequently, a three-band composite image was created by assembling the rasters of all three metrics (i.e., threats in red, lake state in green, and services in blue). The colours of the three-band composite image were scaled with a minimum–maximum scaling method where the lower value of a band equals 0 and the highest value equals 255. All raster layers were done in ArcMap 10.6.1.
Results
Determining regional baselines
When low-impacted lakes were considered using LDA, we observed a considerable amount of overlap, suggesting similarities in morphometric and chemical properties among lakes in certain ecozones (Fig. S3). Overlap generally occurred between adjacent ecozones and within a common physiographic region (Fig. S1). For example, lakes in the Prairies, Boreal Plains, and Taiga Plains ecozones, all from the Interior Plain physiographic region, had similarly high Secchi depth, high conductivity, and reduced watershed slope. This suggested that these ecozones could be merged into a large lake region with shared physical and chemical baseline conditions (see Table S1). Based on the amount of overlap observed in the LDA reflecting shared properties among ecozones and on physiographic spatial proximity, we aggregated several ecozones into five “lake regions” (Fig. 2a). These were renamed from west to east as the “Pacific” (n = 69), the “Mountains” (n = 137), the “Plains” (n = 165), the “Continental” (n = 220), and the “Atlantic” (n = 68) lake regions (Fig. 2b). The LDA performed with the new lake regions was more robust, where the two first canonical variates explained 49% and 40% of the total variance, compared to 52% and 29% for the LDA among the original ecozones. Attribution of lakes to their group (ecozone or lake region) was also improved by using the discriminant functions of the new aggregated lake regions. The classification was correct, with a mean of 85% using the lake region as the grouping when compared to 76% when using ecozones (Table S2). Table 2 describes the variability of the unimpacted reference lake conditions for each lake region.
Fig. 2.
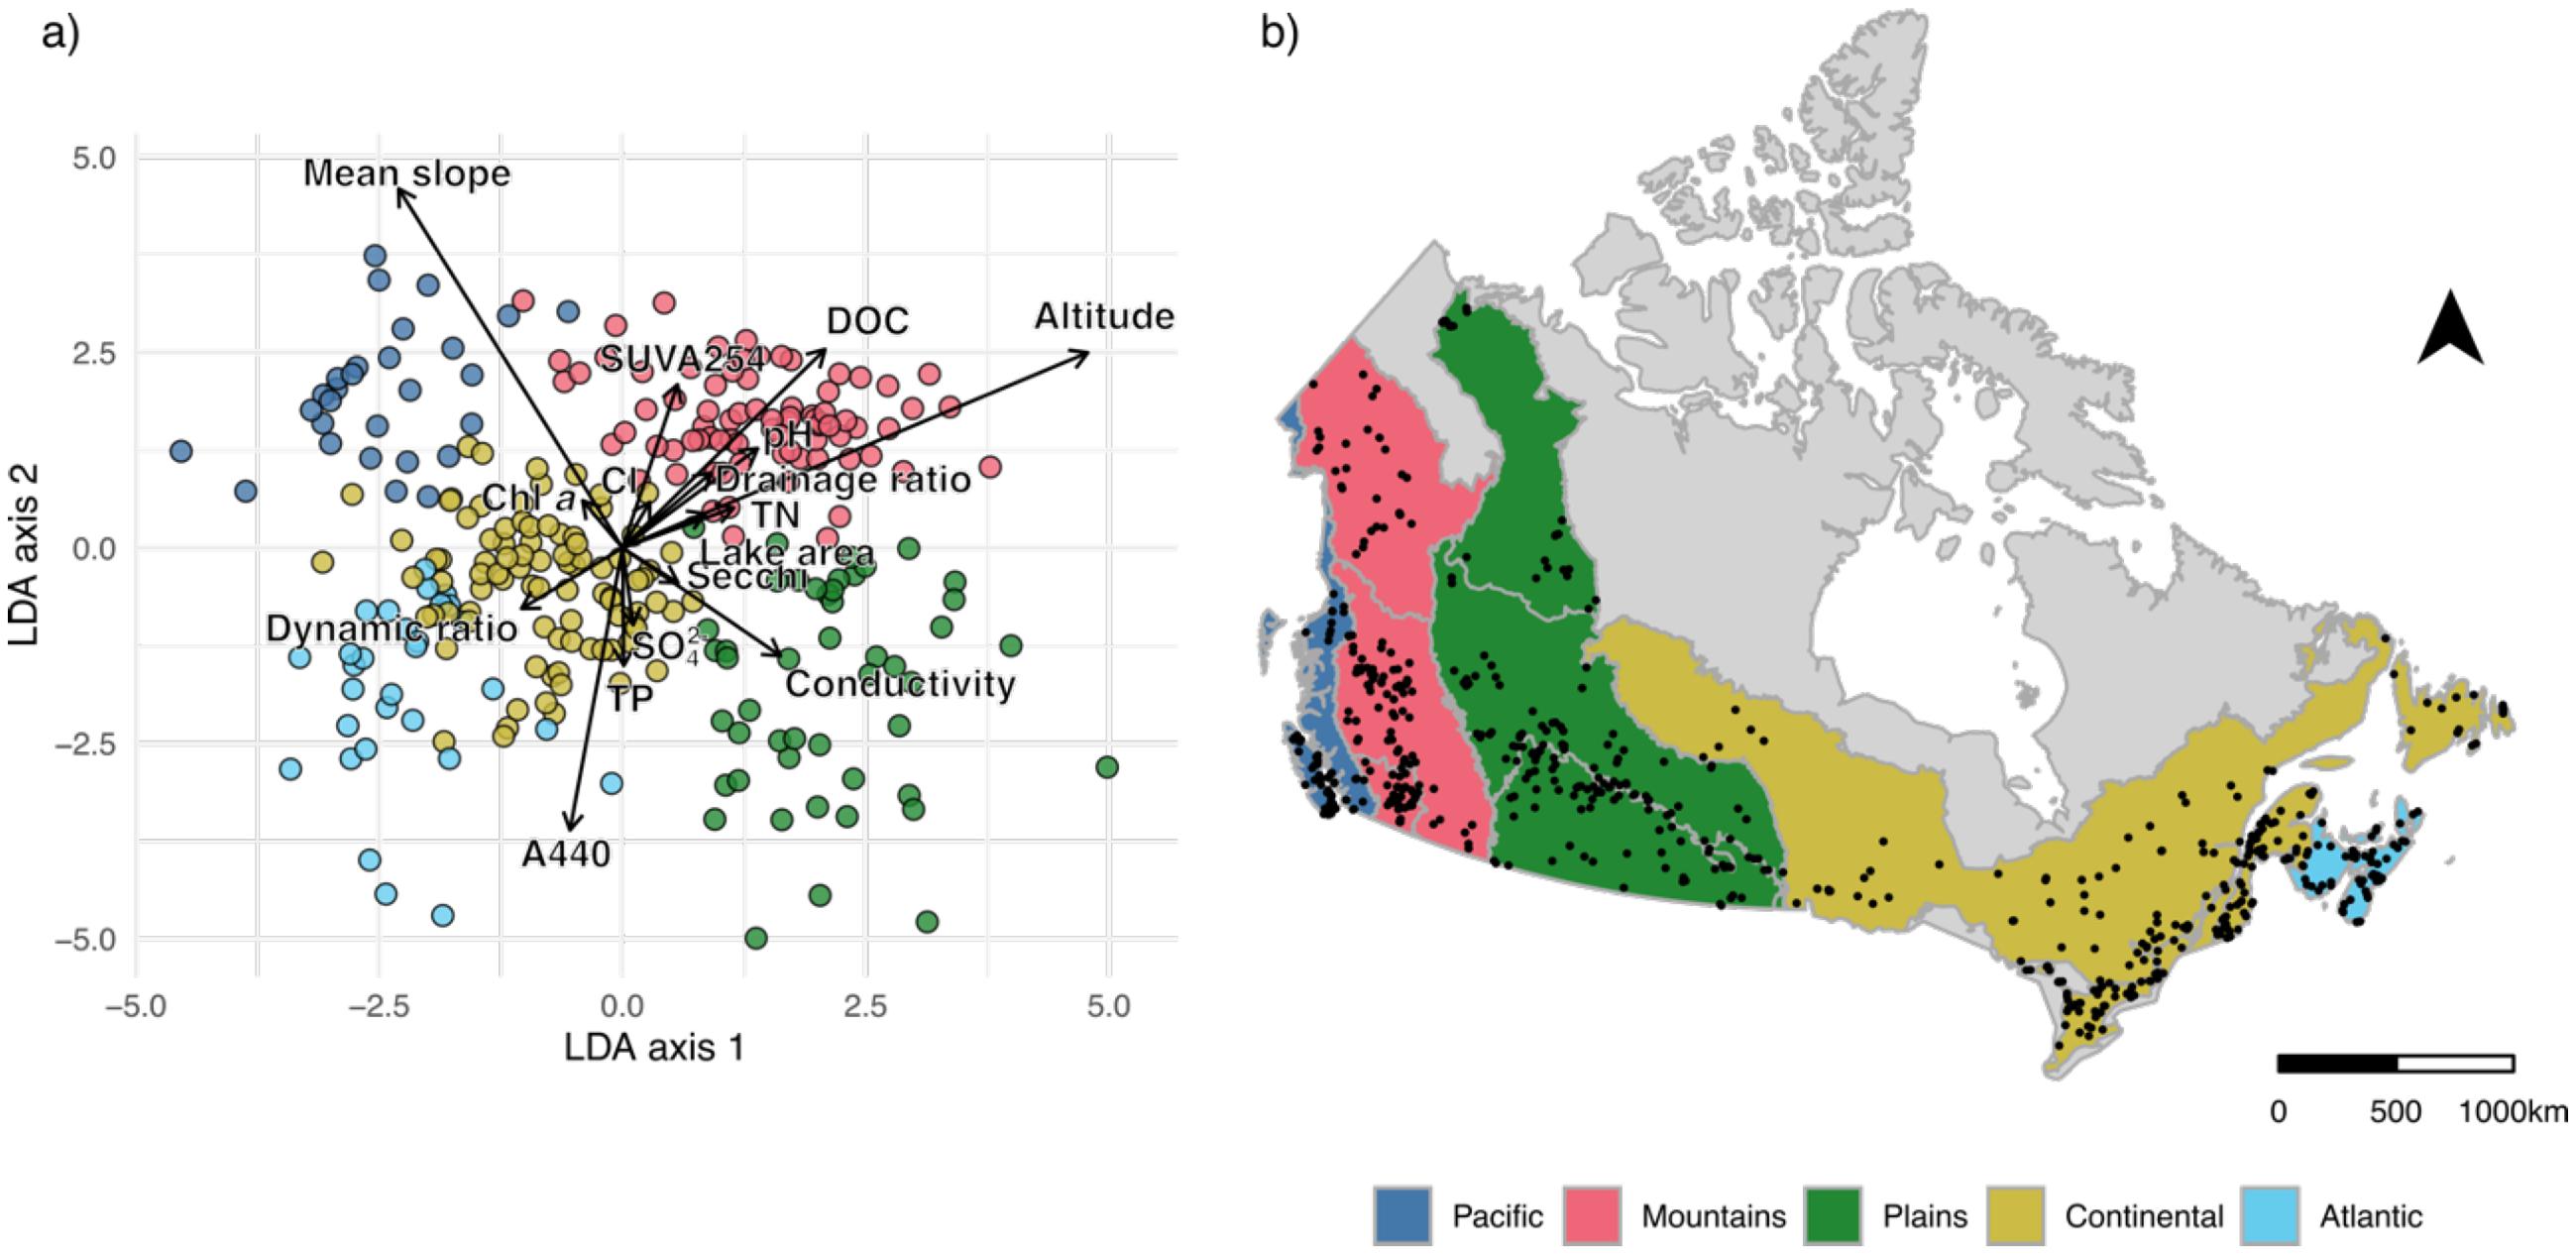
Table 2.
| Variables | Pacific | Mountains | Plains | Continental | Atlantic |
|---|---|---|---|---|---|
| Secchi depth (m) | 5.9 (4.5) | 4.1 (3.2) | 1.7 (1.3) | 3.3 (1.8) | 2.2 (2.1) |
| TN (mg/L) | 0.1 (0.1) | 0.2 (0.32) | 0.5 (0.64) | 0.2 (0.1) | 0.1 (0.2) |
| TP (µg/L) | 7.0 (6.8) | 15.5 (36.6) | 32.6 (84.0) | 12.4 (15.7) | 15.8 (11.5) |
| Chl a (µg/L) | 1.0 (1.5) | 2.2 (24.7) | 4.1 (25.5) | 2.2 (2.7) | 2.9 (2.0) |
| DOC (mg/L) | 1.6 (4.3) | 7.8 (12.8) | 21.5 (28.9) | 6.6 (4.6) | 6.5 (6.1) |
| SUVA254 (L/mg-m) | 5.4 (1.7) | 5.1 (1.9) | 3.5 (1.2) | 5.5 (2.0) | 8.0 (2.1) |
| A440 (1/m) | 0.2 (1.8) | 0.9 (1.7) | 1.4 (1.7) | 1.3 (1.6) | 2.7 (4.4) |
| Cl− (mg/L) | 1.3 (6.6) | 0.8 (14.7) | 5.3 (45.2) | 1.2 (5.4) | 3.3 (5.0) |
| SO42− (mg/L) | 2.0 (4.2) | 5.9 (169.3) | 12.5 (1207.4) | 2.4 (150.1) | 1.3 (2.1) |
| C:N | 23 (29) | 48 (33) | 45 (40) | 50 (45) | 57 (43) |
| C:P | 1064 (699) | 1141 (907) | 1698 (2028) | 1294 (1334) | 1131 (853) |
| N:P | 32 (94) | 21 (34) | 34 (25) | 25 (30) | 19 (18) |
| Conductivity (µS/cm) | 43 (24) | 159 (466) | 388 (2389) | 113 (249) | 36 (39) |
| pH | 7.3 (0.6) | 8.3 (0.6) | 8.7 (0.5) | 7.7 (0.8) | 6.8 (0.5) |
| Drainage ratio | 27 (40) | 24 (105) | 12 (87) | 15 (1267) | 12 (28) |
| Mean depth (m) | 9.9 (11.5) | 6.0 (11,1) | 1.2 (2.4) | 3.8 (4.5) | 1.3 (3.0) |
| Lake area (km2) | 2.0 (14.6) | 1.2 (17.5) | 0.8 (16.9) | 1.6 (15.3) | 0.8 (14.6) |
| Mean slope (%) | 28 (16) | 13 (13) | 2 (2) | 5 (4) | 4 (3) |
| Altitude (m) | 215 (233) | 850 (252) | 476 (318) | 241 (131) | 96 (94) |
| Dynamic ratio | 0.16 (0.14) | 0.20 (1.13) | 0.82 (2.06) | 0.35 (2.14) | 0.97 (0.78) |
The LDA discriminant function indicated that altitude, mean watershed slope, colour (A440), DOC, and conductivity were the variables that best distinguished lake regions (Fig. 2a and Tables S3 and S4). We observed that Pacific lakes were generally deep (highest mean depth and low dynamic ratios), unproductive (high Secchi depth, low TN, low TP, low Chl a, and low DOC), and with steep catchment slopes. Mountain lakes were typically quite clear (high Secchi), contained little Cl−, and were, unsurprisingly, generally located at much higher altitudes. In contrast, Plains lakes were located within shallow catchments and were the most naturally productive and ion-rich lakes. Indeed, baseline values of TN, TP, DOC, and conductivity were twice as high as in other regions, but Secchi and SUVA254 were the lowest. Lakes in the Continental region generally exhibited median values falling in the middle of the distribution of most variables. Atlantic lakes tended to be small and shallow (second lowest mean depth and high dynamic ratio), located at low altitudes, and rather coloured (high A440) with low conductivity. Also, the Atlantic was the only region where pH was acidic (<7) for most lakes. Conditions of reference lakes in some regions—TN in the Plains for example—were higher than those considered high in all other regions. As such, regional reference conditions need to be established rather than a national average when assessing the deviation for lake ecological state or relative lake health (Table 2).
Deviation of impacted lakes from reference
To characterize the deviation of lakes from reference conditions, we compared how the morphometric, chemical, and land-use characteristics of highly impacted lakes deviated from the low-impact ones (Fig. 3). These deviations were calculated using region-specific z-scores, allowing us to compare the direction and/or magnitude of changes among lake regions. For morphometry, impacted lakes generally had lower values compared to reference (Fig. 3a), indicating that these lakes tended to be shallower, smaller, had shallower watershed slopes, lower drainage and dynamic ratios, and were located at lower altitudes. The Plains region was an exception to this trend, as most morphometric variables had positive deviations, and impacted lakes tended to be larger with higher drainage and dynamic ratios and located at higher altitudes. Other exceptions were observed in the Pacific region (higher dynamic ratio) and in the Atlantic (deeper lakes with a steeper slope). Finally, while all morphometric variables from impacted lakes in the Continental region were similar to reference, there were large differences for some variables in other regions, namely the much lower slope in the Pacific, the much lower altitude in the Mountains, and the much lower dynamic ratio in the Atlantic.
Fig. 3.
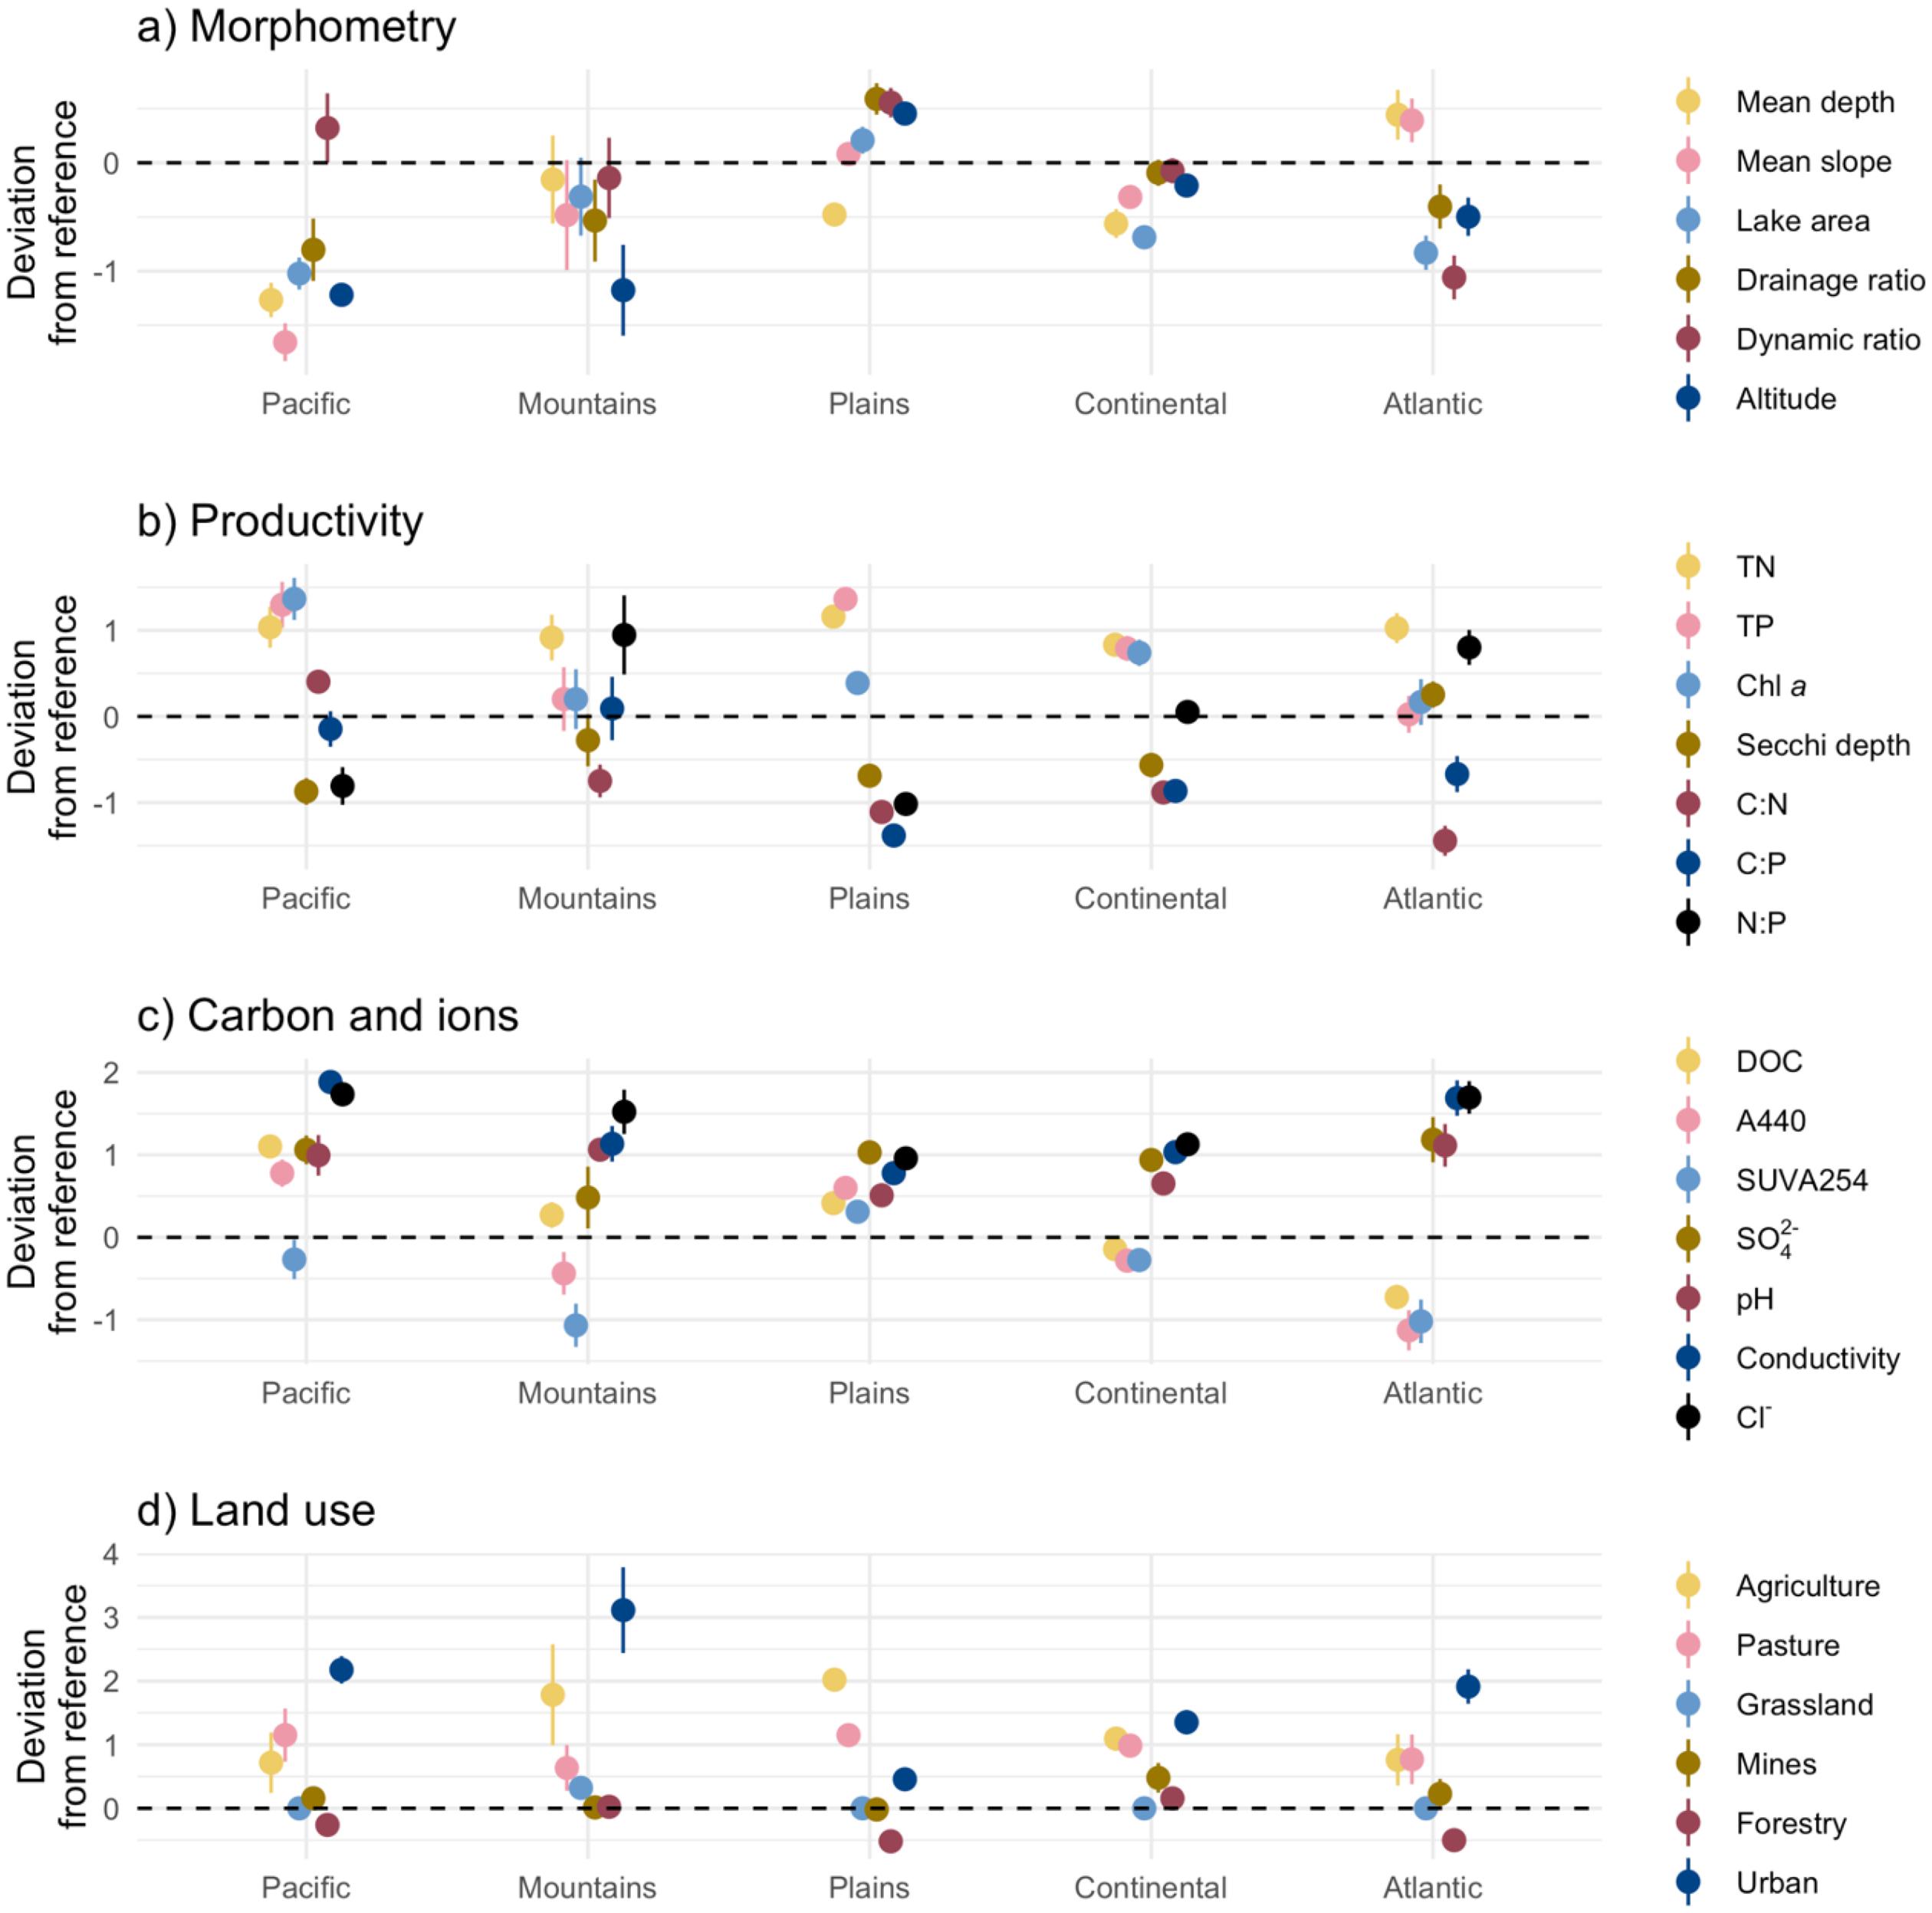
For the deviation of chemical variables, we visualized nutrients, Chl a, and Secchi separately from variables related to changes in carbon (DOC and spectral properties), pH, and ions (Figs. 3b and 3c, respectively). TP and Chl a, which are classically used to characterize eutrophication, were higher in impacted lakes for several regions but not all (Fig. 3b). Concentrations in the Mountain and Atlantic regions were similar to reference, and although there was an increase in TP in the Plains, there was no corresponding increase in Chl a. Secchi, which is also classically used to assess eutrophication, was lower in impacted lakes in all regions except in the Atlantic, where it was on average higher, and as such, highly impacted lakes were counterintuitively more transparent. TN, however, increased rather strongly and consistently across all regions. Fluctuations in nutrients were also observable in the relative changes in N:P ratios, where regions responded rather differently. When C:N and C:P ratios were considered, the responses were equally divergent. If TN increased in all cases and DOC stayed the same, the ratios should have all decreased. This, however, was not always the case, as DOC increased regionally in impacted lakes in the Pacific region, decreased in the Atlantic, but remained unchanged in the others (Fig. 3c). Spectral measures of A440 and SUVA254, which represent coloured and terrestrial DOC composition, respectively, were largely similar between lakes of low and high impact, with some notable decreasing trends in both the Atlantic and Mountain Regions and an increasing trend of A440 in the Pacific. Cl−, conductivity, sulphate, and pH increased consistently across all regions in impacted lakes, but the magnitude of the response for Cl− was the strongest.
Across regions, not surprisingly, differences in land use for highly impacted lakes were driven predominantly by increasing agriculture or urban expansion in their watersheds (Fig. 3d). Urban expansion was the main anthropogenic change across all regions except for the Plains, where agriculture was most dominant. Mountain and Continental lakes were strongly affected by both drivers, whereas the Atlantic and Pacific were primarily impacted by urban development. We used a PCA to look for correlations among the deviations from reference lakes of different variables across regions (Fig. 4). This allowed us to determine more generalized patterns of changes in chemical variables in response to changes in physical and land-use features. Axis one separated impacted lakes between those influenced by changes in urban areas and those influenced by agricultural land use. Compared to the latter, lakes impacted by urban expansion in their watershed tended to be smaller, clearer, with lower nutrients, located at lower altitudes, and associated with increasing Cl− concentrations. Those impacted by agriculture and pasture tended to be shallower and had higher drainage and sediment dynamic ratios, with higher TP, TN, Chl a, and DOC concentrations. As Cl− tended to be more indicative of an urban signal and TN, one of agriculture, and both had a consistently strong deviating response across all regions (Figs. 3b and 3c and Fig. S4), we used both these variables as our indicators of altered lake ecological state.
Fig. 4.
Social–ecological biogeography: creating gradients across Canada
Using TN and Cl− as indicators of human impact, we created a national map of lake ecological state based on sampled lakes (Fig. 5a). Altered lakes were scattered across Canada, but dense clusters were observed in Southern Ontario and across the Prairies. Regional patterns in lake state attributed to either Cl−, TN, or a combination of both emerged (see individual maps of lake state based on Cl− or on TN; Fig. S5). Newfoundland, Nova Scotia, Northern Ontario, and the Vancouver area were predominantly altered due to Cl−, while alteration in the central part of the Prairies (Manitoba, Saskatchewan, and Alberta) was attributable to TN. The alteration in the middle of British Columbia, the southern part of the Prairies, Southern Ontario, and the Lower St. Lawrence in Quebec was due to a combination of both. The northern regions (Northern British Columbia, Alberta, Saskatchewan, and Quebec) and Western Ontario showed little change in lake state.
Fig. 5.
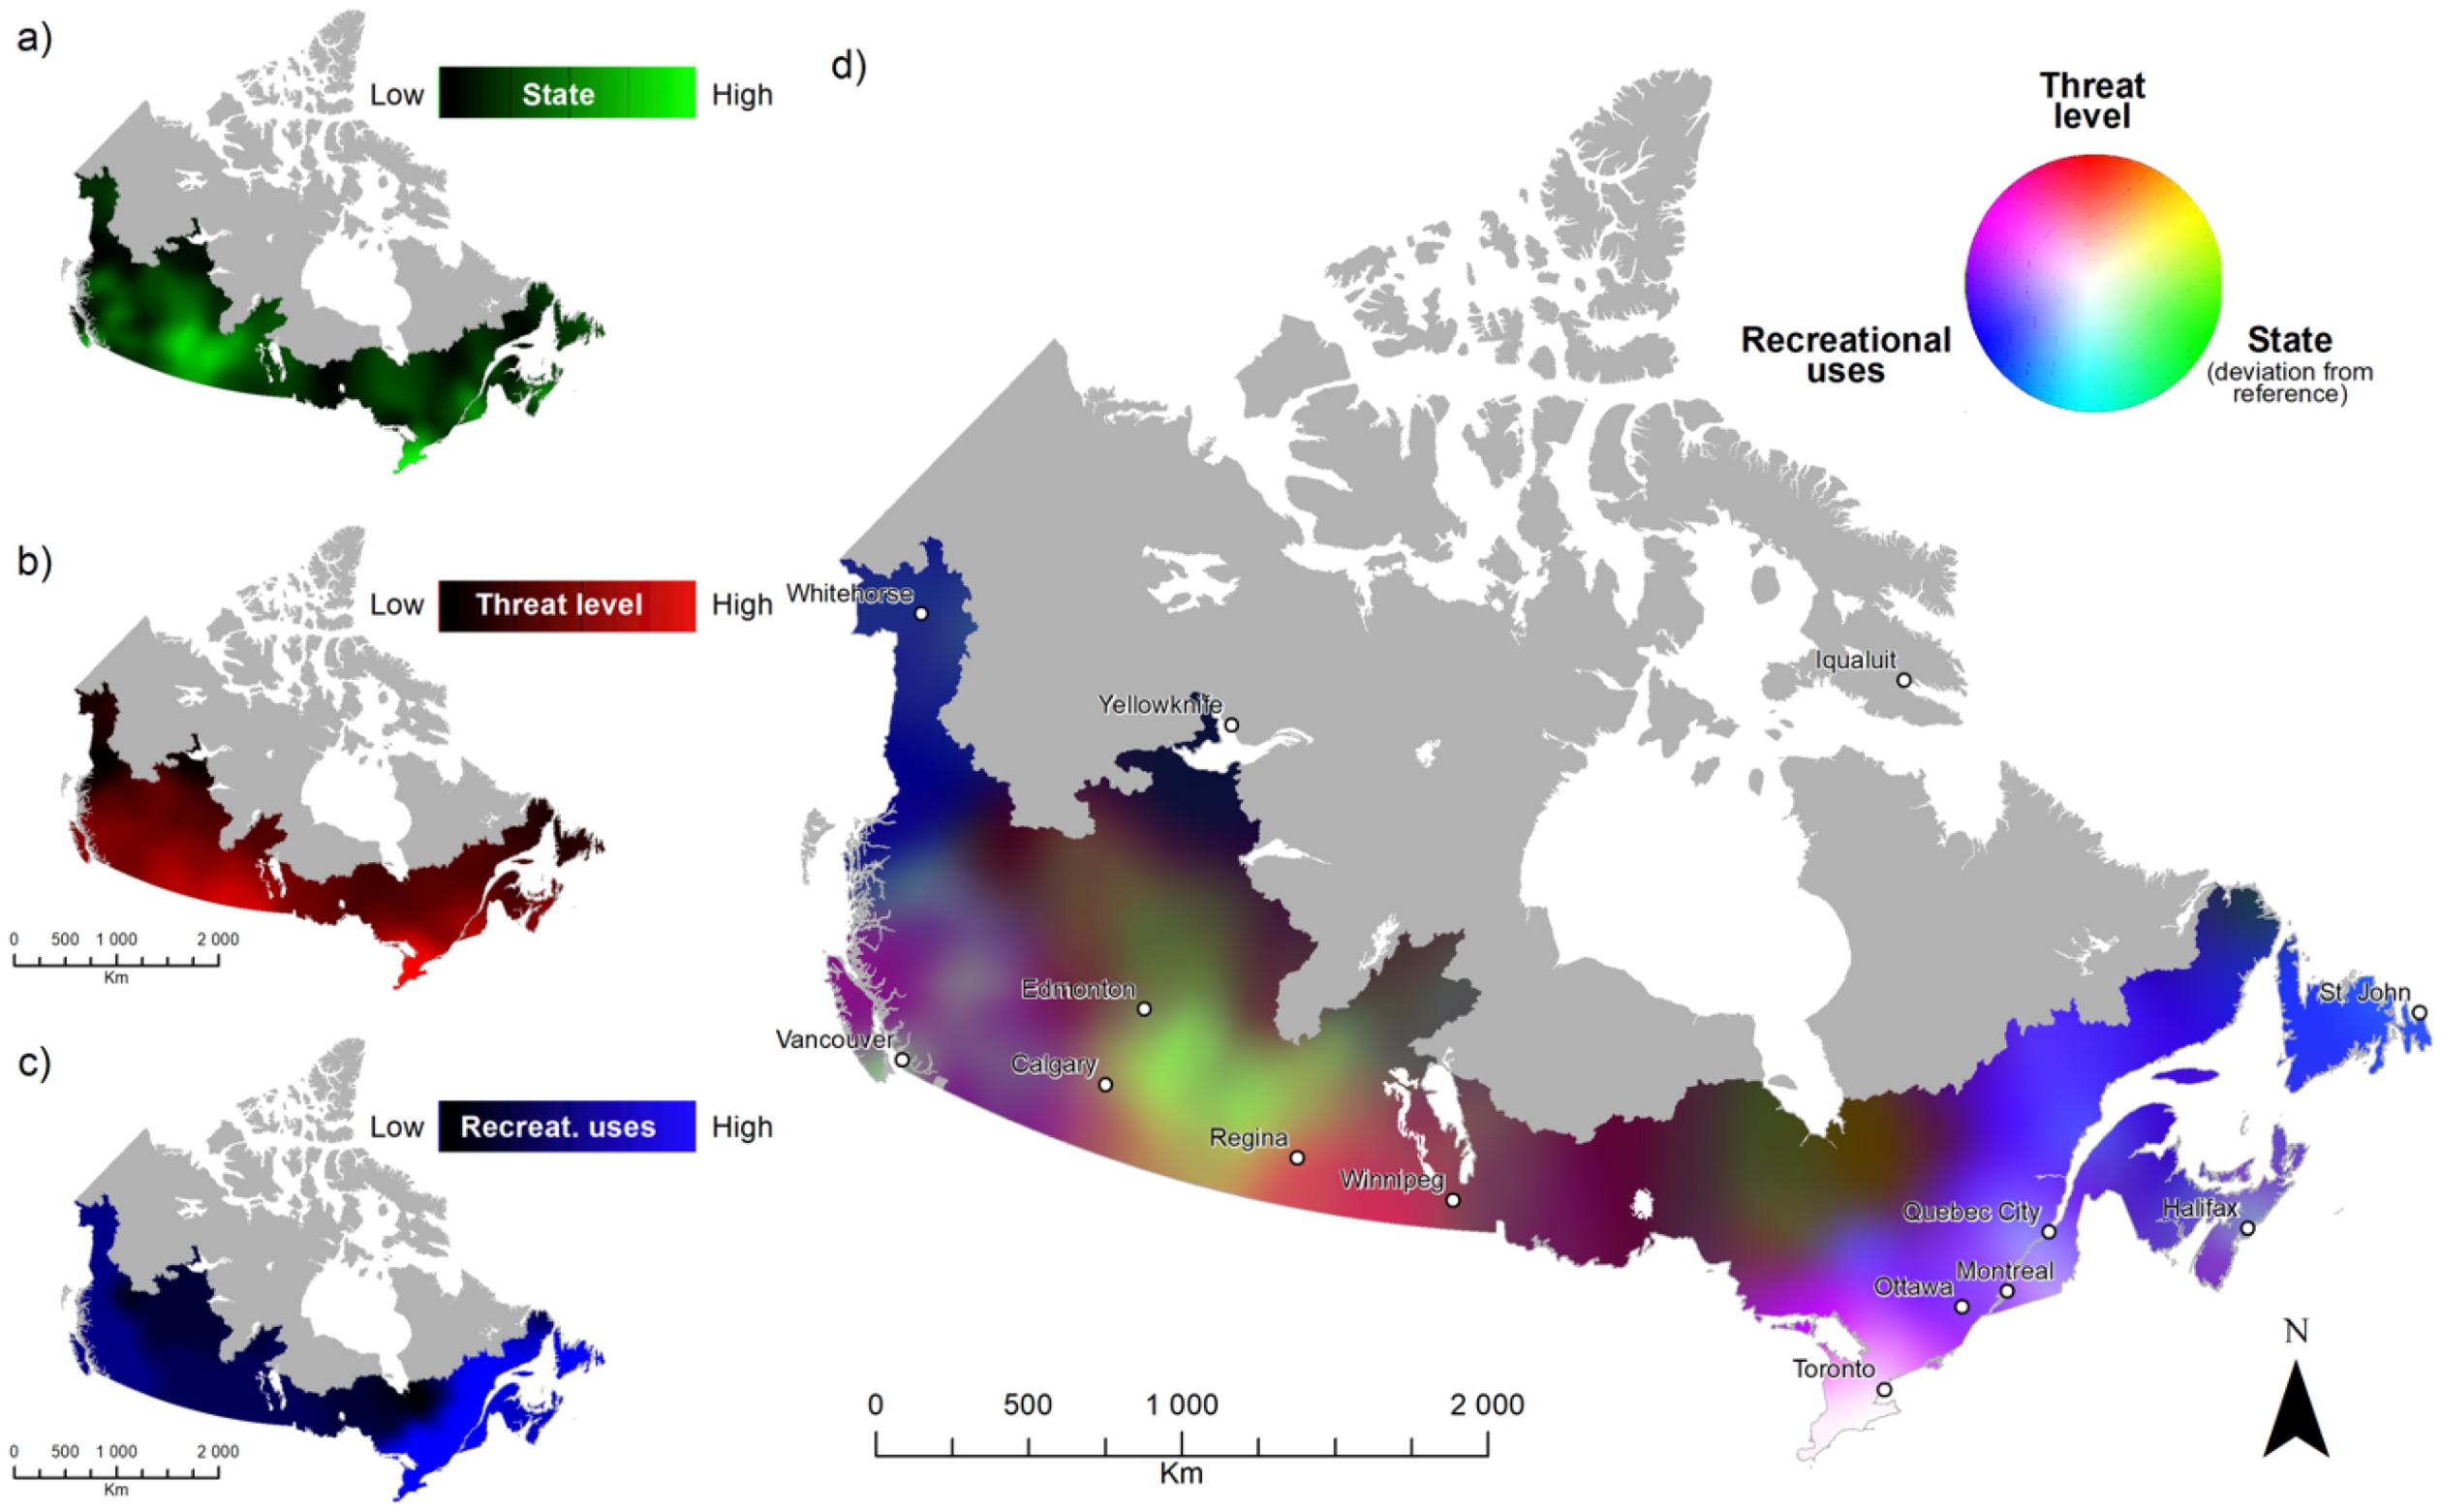
Threat levels (Fig. 5b) were higher in the southern part of Canada, which coincides with higher population densities. However, northern areas were also subject to threats, mainly climate change and habitat loss. The highest overall threat levels were found around the Great Lakes and in the southern part of the Prairies. In these regions, all of the threats considered were present at a very high level. Exceptions were habitat loss and climate change in Southern Ontario (moderate level) and for invasive species in the Southern Prairies (low level). Regions within the St. Lawrence watershed were the only ones affected by water overuse, whereas pollution level was a widespread threat, particularly along the border with the United States (WWF-Canada 2017).
Recreational use (Fig. 5c) was highest in Eastern Canada, followed by the West Coast. Participation in terms of days/km2 of watershed in all four categories of recreational ES (swimming and beach activities, sport fishing, power boating, and paddle and sail boating) was highest in the St. Lawrence Drainage Area (Quebec, Newfoundland, and Southern Ontario). In the Maritimes Provinces, participation was also very high in most ES categories, except for power boating. In the Pacific Drainage Area (British Columbia and a part of Alberta), all ES categories were popular, particularly for sport fishing and swimming, but participation in days/km2 of watershed was lower than in Eastern Canada. Use in the Nelson River Drainage Area (Prairies) was low compared to the other three regions, but fishing and swimming were the most popular ES in that region. In the less densely populated northern regions, overall use of recreational ES was low, with sport fishing as the main ES (Environment Canada 1999).
On the composite map (Fig. 5d), the dominant colour in Eastern Canada changes from purple in the north to magenta in the south, reflecting the high recreational ES use (blue) in this region, with threat level (red) intensifying from north to south. We also note the presence of cyan patches in Southern Quebec and Nova Scotia, particularly around Quebec City and Halifax respectively, implying the presence of altered lakes actively used for recreation. The tip of Southern Ontario appears in white, indicating that lakes were altered, threatened, and intensively used. In Western Canada, similar colour gradients as in the East emerged, but shades tended to be darker. This suggests that the same components (recreational uses and threat level) were present, but at lower levels compared to the East. The threat level also intensifies on a north–south gradient in the west, from Whitehorse to Vancouver. The few diffuse green spots indicate areas where lakes were particularly altered. In Southern Manitoba, the red to orange colour suggests that despite the strong presence of threats, the lakes in this region have suffered minimal alteration compared to their reference state. In Southern Saskatchewan, however, the yellowish colour indicates significant levels of threat and lake alteration. In the middle of these two provinces, there is a light green clump signifying the alteration of several lakes, but with a lower threat level than those located to the south. Recreational use does not emerge in these regions, as the level of participation was considered low compared with the rest of Canada. The main colour obtained in Northern Canada (Northern Quebec and Ontario, Northern Saskatchewan and Alberta, and Northwest Territories) was dark brown, indicating a low level of threat, little to no recreational use, and low levels of lake alteration.
Discussion
In this study, we determined the regionally specific reference conditions of lake ecological state for five lake regions across Canada. Reference conditions were based on shared physical and chemical characteristics of unimpacted lakes from ecozones with the same physiographic properties. With this information, we were able to evaluate how severely impacted lakes, with greater human activities in their watershed deviated from reference conditions, and found two consistent indicators of human altered lake ecological state across Canada: an increase in TN and Cl− concentrations. The ecological state of several lakes determined using these indicators was then geographically linked to two other aspects of the overall lake state, which included future human threats to lakes and recreational ES use. By combining lake ecological state, aquatic ecosystem threats, and ES use in an additive colour scheme, we created the first national social–ecological geography of Canadian lakes. This novel approach allows us to identify areas where lakes are most vulnerable to being altered or losing their capacity to provide ES, and that can serve as priority sites for conservation or restoration to sustain or improve water quality.
Determining lake ecological state: regional references and human indicators of alteration
Understanding how severely a lake is altered by human activities in its watershed requires the knowledge of reference conditions prior to those changes. Spatial differences in the underlying geology that influence the topography, morphometry, and land cover will likely create regionally distinct lake references (Boyce 2015; Read et al. 2015), which are essential to characterize when carrying out comparisons at the continental scale (Cheruvelil et al. 2013). The stratified design of LakePulse sampling, which included a series of low or unimpacted lakes across most of the country, allowed us to determine these reference conditions (Huot et al. 2019). We found that unimpacted lakes from several Canadian ecozones adjacent to one another with shared physiography had similar morphometric and chemical reference traits. Landscape and watershed characteristics such as elevation and mean slope were the most important variables in discriminating lake properties between regions, followed by conductivity, DOC, and, to a lesser extent, nutrients. This finding highlights the role of physiography in creating lake regions across Canada (Boyce 2015), suggesting that climate and vegetation type related to ecozones had less of an overall influence on reference lake physical and chemical characteristics.
The deviation of highly impacted lakes from their regional reference allowed us to evaluate which chemical variables were most consistent in capturing a lake's response to anthropogenic changes in its watershed. Most regions behaved as expected and experienced cooccurring higher concentrations of TN, TP, and Chl a, with reduced Secchi due to increased turbidity (Minns et al. 2008; Webster et al. 2008) and land-use changes (Carpenter et al. 1998; Nielsen et al. 2012). However, higher TN in impacted lakes was more consistently observed across the lake regions and was not always accompanied by higher TP and Chl a or transparency loss. Increases in TP, and as a consequence algal biomass, may have been dampened in regions where urban expansion was dominant due to legislative reductions from point-source sewage inputs or well-managed septic systems (Budd and Jones 1978; Schindler 2006). One exception was the naturally P-rich region of the Prairies (Table 2), where, despite a significant increase in both nutrients, the increase in Chl a was not as marked. This could be explained by a threshold response of Chl a to increasing TN (Filstrup et al. 2018). Another possible explanation of why TN was more indicative of human impact in the watershed is the relatively higher applications of N as compared to P fertilizers on agricultural lands (Glibert et al. 2014; Goyette et al. 2016) or inputs from atmospheric N deposition (Elser et al. 2009). Excessive N inputs relative to P in conditions when both are high is cause for concern as higher N:P ratios tend to favour the establishment of more toxic species of algae and cyanobacteria (Leavitt et al. 2006; Scott and McCarthy 2010; Glibert et al. 2014; Taranu et al. 2017), which impinge on multiple valuable aquatic ES.
Another striking and consistent difference between human-impacted and reference lakes among regions was higher Cl− concentrations. In northern freshwaters, this increase in Cl− concentrations is primarily attributed to road salt used for de-icing during winter, which explains why it was most associated with urbanization in the watershed (Chapra et al. 2009; Canadian Council of Ministers of the Environment 2011; Dugan et al. 2017). Regions with the highest road salt use in Canada are Southern Ontario, Quebec, and the Maritimes (Environment Canada and Health Canada 2001; Evans and Frick 2001), and salt application is also reported to be high in the Prairies (Morin et al. 2000), consistent with our observations of altered Cl− concentrations in these regions (Fig. S5a). The environmental impact of increased Cl− concentration in lakes is of growing concern, particularly with changing climate conditions where warmer average winter temperatures and changes in precipitation may require more salt for de-icing (Kaushal et al. 2021). High levels of Cl− can have adverse effects on aquatic life, with chronic toxicity occurring at 250 mg/L (Evans and Frick 2001) and recent experimental work showing adverse effects and shifts in community composition at even lower Cl- concentrations, highlighting the need to downscale toxicity levels even further (Hébert et al. 2022; Hintz et al. 2022). Increased salinization may also impact physical lake properties, including stronger and more prolonged stratification, with cascading repercussions on major biogeochemical cycles (Kaushal et al. 2005; Dugan et al. 2017). As such, increased Cl− concentrations may influence the provisioning of several ES, including sport fishing. However, the overall consequences of increased salinization on lake ecosystem functioning and services remain underexplored. Regardless, Cl− was the strongest human indicator of urban expansion, whereas TN was both an agricultural and urban indicator. Both TN and Cl− can render drinking water unpotable due to concerns around human health and taste, respectively (Kaushal et al. 2005; Howard and Maier 2007; Karimi et al. 2020), making their combined deviation a good proxy for assessing the altered lake ecological state and vulnerability to provide different ES.
Beyond the clear patterns of TN and Cl− increase in impacted lakes, we also found some regional anomalies in the deviations from certain chemical variables. For example, impacted lakes in the Atlantic and mountain regions were clearer than reference lakes on average, with a higher or unchanged Secchi depth. As Chl a concentrations in impacted lakes were similar to those in reference lakes, this enhanced water clarity could be explained by lower coloured DOC (A440, Brezonik et al. 2019). A possible influence on this loss in colour is the photobleaching of CDOM, which can increase water transparency (Del Vecchio and Blough 2002; Kalff 2002). Overall, lakes from the mountain region are on average deeper and at higher altitudes (Table 2), whereas impacted Atlantic lakes, morphometrically, tend to be deeper with a lower sediment-dynamic ratio (Fig. 3). For both, this would result in longer water residence times, favouring photobleaching. Indeed, in terms of morphometric, topographic, and landscape variables, most impacted lakes tended to be near or lower than reference lakes (with the exception of the Plains), but each region has its peculiarities. One overarching tendency is that impacted lakes across multiple regions were more accessible to human populations. This includes impacted Pacific, Mountain, and Atlantic lakes that were at lower altitudes, similar to what has been reported elsewhere (Ebner et al. 2022). In the case of the Pacific region, impacted lakes had much shallower watershed slopes than unimpacted ones and were presumably easier to develop on. In the Plains, Pacific, and Continental regions, impacted lakes were generally smaller and shallower, making them more vulnerable to changes in the landscape due to higher internal loading and reduced volume (Nõges 2009). Impacted lakes in the Plains had both higher drainage and dynamic ratios, resulting in a higher proportion of terrestrial inputs (Kalff 2002) and a greater proportion of the water in contact with sediments (Håkanson 1982), respectively. These physical features combined could explain the slightly higher colour in the impacted lakes of this specific region, as their physical properties make them inherently more vulnerable to human pressure.
A first social–ecological geography of overall lake state
To create the first social–ecological geography of lakes in southern Canada, we developed an innovative framework that spatially links regional lake ecological state, emerging lake threats, and recreational ES use. By colour-coding ecological and social gradients, the RGB composite map (Fig. 5) allowed us to visualize hotspots of aquatic ecosystem vulnerability and ES conservation. This approach clearly identified areas where lakes were used by people and where there was a risk of losing recreational ES due to threats or lake degradation. From the perspective of preserving recreational ES, the colours of interest were white (high alteration, threats, and use), cyan (high alteration and use), and magenta (high threats and use), where use coincided with an altered lake state and/or threat. This first broad-scale national attempt suggests that locations expressing these colours should be considered priority areas for restoration or for monitoring as a precaution to ensure ES will not be lost over time.
Through this framework, we found that populated urbanized areas were of greatest concern. The southern tip of Ontario, which includes the Greater Toronto Area and accounts for nearly 20% of the country's population (Canada Population 2021), appeared in white on the map due to a combination of lakes being intensively altered, threatened, and used. Other areas of concern include the Lower St. Lawrence River between the cities of Montreal and Quebec and the Halifax region in Nova Scotia, which all exhibit a colour approaching light cyan, indicating high recreational use combined with an altered lake ecological state and a moderate threat level. All these urban locations should be monitored, as a degraded lake state could potentially lead to the loss of lake services. The same colour combinations were found in British Columbia around the cities of Vancouver and Victoria. However, according to the data we had, recreational use on the West Coast was lower, which resulted in the altered lake ecological state (in lighter green) emerging as a more prominent component overall. Areas coloured magenta were found in southeastern Ontario, southern Quebec, and the lower part of British Columbia. Here, recreational use and threat levels were high, but lakes, on average, are not yet significantly degraded. As such, management efforts should be implemented now to maintain their current healthy state. Finally, in the Plains, particularly around Saskatoon, Saskatchewan, and Edmonton, Alberta, lakes were altered and threatened by growing agriculture and urbanization, even though recreational ES use is low.
We believe our approach is valuable in identifying priority areas for ES and aquatic ecosystem protection, and the results presented here should be considered a proof of concept. One of the benefits of our proposed framework is that it is very flexible in that it can be applied at different scales of inquiry, with a focus on more regional threats of concern where applicable (for example, mining, logging, or wildfires), and assess the use of different ES than the ones used here. It also provides a striking visual representation that is relatively easy to understand. The approach may be most useful to management and stakeholders at smaller regional or local scales of inquiry, where information on a broader suite of ES valued by local communities may be available or more quantitatively robust. The challenge, perhaps at smaller scales, is assessing the deviation of a lake's ecological condition from baseline. However, the latter could be taken from a broader context of spatial assessment (i.e., the Lake Region presented here), whereas threats and use could be quantified more locally (Martín-López et al. 2017).
Limits and considerations
One limitation to our study is that our indicators of altered lake ecological state, TN and Cl−, do not necessarily impinge directly on the delivery of the four recreational services assessed here but may act as a proxy for some. For example, Health Canada's Guidelines for Canadian Recreational Water Quality (2012) related to swimming have threshold values for cyanobacteria and E. coli related to the risk to human health in the case of direct contact with skin. High concentrations of TN are known to promote toxic algal and cyanobacterial blooms (Glibert et al. 2014; Monchamp et al. 2014; Taranu et al. 2017) and are indirectly linked to the loss of this ES. Similarly, Cl− may, through food web effects (Dugan et al. 2017; Hintz et al. 2022), influence sport fisheries, although that remains underexplored. A more appropriate ES to assess with nitrate (as part of TN) and Cl− is the loss of drinking water, as increasing concentrations of both can render water unpotable due to human health concerns and taste, respectively (Kaushal et al. 2005; Howard and Maier 2007; Karimi et al. 2020), but we did not find easily accessible data around that ES across Canada.
There were also several limits to the recreational ES dataset we used. First, it was dated from 1996, and although adjusted for the current population, it is possible that recreational habits have changed over time and no longer accurately reflect current use. Second, the ES dataset covered broad watershed areas across the country and was not as spatially explicit as other components in our model. The recreational ES data were also only available in days of use per square kilometer of major watershed, which reflects the intensity of use over a given area, not the intensity of use by individuals. As such, whether the lakes assessed in Lake Pulse were actually used for these recreational ES is uncertain, although given the proximity of these lakes to roads, chances are more likely. Less densely populated areas are disadvantaged as use could be diluted by watershed size, where a sparsely populated area in which individuals use ES intensively can be equivalent to a densely populated area where individual use is infrequent. Furthermore, many of these sparsely populated areas are inhabited by First Peoples who were not considered in the census; given their intimate relationship with natural resources, we argue the need to prioritize the protection of ES for those nations that rely directly on them for provisioning (Berkes 1990; Islam and Berkes 2016).
Conclusion
Our holistic social–ecological approach allowed us to synthesize a large amount of information about the overall state of lakes across Canada. We have shown that there are broad regions where restoration and conservation efforts should be focused given the combined influence of alteration of lake ecological state, emerging threats, and ES use. Despite the caveats related to some of the data used in our study, there is strength in quantifying ES use directly, and future work should try to do this more explicitly. Although ES are easily identified and defined (MEA 2005), they are often not quantified (Raudsepp-Hearne et al. 2010), and most frameworks to assess threats are theoretical (Villamagna et al. 2013; Grizetti et al. 2016). The framework and approach provided here quantify and integrate ecological state, threats, and ES use. Lake ecological state also needs to be put into regional context, and indicators of lake state may need to be revisited to allow for more commonly measured proxies to be used in broader spatial and historical evaluations (St-Gelais et al. 2020). Our approach is both powerful in its easily understood visual representation and adaptable at different spatial scales. We recommend its use at finer regional scales to identify hotspots relevant to management. Furthermore, we encourage that it be adapted to metrics or proxies known to differently impact and threaten lake ES valued at more local scales. In the context of climate change adaptation, the demand for freshwater recreational ES as well as others will increase. It is, therefore, essential to secure the ES of lakes by reducing pressures and anticipating changes in state. Our study offers a useful and novel tool for management to evaluate ES vulnerability, helping identify places to intervene for long-term ES sustainability.
Acknowledgements
We would like to thank all of the participants of the LakePulse Strategic Network for the collection and processing of samples, with a special thanks to lead PI Y. Huot (University of Sherbrooke) and all members of the coordinating, sampling, and analytical teams. We thank A. Prince for help with all map figures, including the RGB model; R. Siron from OURANOS for discussions; and three anonymous reviewers for very helpful comments. Funding for this study came from Lake Pulse NSERC Strategic Network, a MITACS with OURANOS, NSERC Discovery, and a CRC in Aquatic Ecosystem Science and Sustainability to RM as well as a BIOS² CREATE program student scholarship to AD. This work is a contribution to the Groupe de Recherche Interuniversitaire en Limnologie (GRIL), an FQRNT Strategic cluster. We acknowledge that this work was carried out on lands and waters belonging to many First Peoples across the mid-northern areas of Turtle Island and share the desire to restore and protect them now and for future generations.
Preprint statement
The preprint for this article is available on BioRxiv at https://doi.org/10.1101/2023.03.09.531893.
References
Bakker K., Cook C. 2011. Water governance in Canada : innovation and fragmentation. International Journal of Water Resources Development, 27(2): 275–289.
Baron J.S., Poff N.L., Angermeier P.L., Dahm C.N., Gleick P.H., Hairston N.G., Jr., et al. 2002. Meeting ecological and societal needs for freshwater. Ecological Applications, 12(5): 1247–1260.
Barrow E., Maxwell B., Gachon P. 2004. Climate variability and change in Canada: past, present and future. ACSD Science Assessment Series No. 2. Meteorological Service of Canada, Environment Canada, Toronto, 114p.
Berkes F. 1990. Native subsistence fisheries : a synthesis of harvest studies in Canada. Arctic, 43(1): 35–42.
Borcard D., Gillet F., Legendre P. 2018. Numerical ecology with R. Springer International Publishing.
Boyce F.M. 2015. Lake. Dans The Canadian Encyclopedia. Available from https://www.thecanadianencyclopedia.ca/en/article/lake.
Bradford L.E.A., Ovsenek N., Bharadwaj L.A. 2017. Indigenizing water governance in Canada. In Water policy and governance in Canada. Edited by Renzetti D S., Dupont D. P. Springer International Publishing. pp. 269–298.
Brandes O.M., Ferguson K. 2004. The future in every drop : the benefits, barriers and practice of urban water demand management in Canada. POLIS Project on Ecological Governance, University of Victoria. Available from https://www.deslibris.ca/ID/205039.
Brauman K.A., Daily G.C., Duarte T.K., Mooney H.A. 2007. The nature and value of ecosystem services: an overview highlighting hydrologic services. Annual Review of Environment and Resources, 32(1): 67–98.
Brezonik P.L., Bouchard R.W., Finlay J.C., Griffin C.G., Olmanson L.G., Anderson J.P., et al. 2019. Colour, chlorophyll a, and suspended solids effects on Secchi depth in lakes: implications for trophic state assessment. Ecological Applications, 29(3).
Budd R.A., Jones P.H. 1978. Detergent phosphorus legislation: a technical appraisal of its effectiveness. Water Quality Research Journal, 13(1): 1–20.
Canada Population. 2021. Toronto Population 2021. Available from https://canadapopulation.org/toronto-population/.
Canadian Council on Ecological Areas. 2014. Canada ecozones version 5. Available from https://ccea-ccae.org/ecozones-downloads/.
Canadian Council of Ministers of the Environment. 2011. Canadian water quality guidelines for the protection of aquatic life—chloride (No 1299; Canadian Environmental Quality Guidelines). Canadian Council of Ministers of the Environment.
Carpenter S.R., Caraco N.F., Correll D.L., Howarth R.W., Sharpley A.N., Smith V.H. 1998. Nonpoint pollution of surface waters with phosphorus and nitrogen. Ecological Applications, 8(3): 559–568.
Carpenter S.R., Stanley E.H., Vander Zanden M.J. 2011. State of the world's freshwater ecosystems: physical, chemical, and biological changes. Annual Review of Environment and Resources, 36(1): 75–99.
Chaplin-Kramer R., Sharp R.P., Weil C., Bennett E.M., Pascual U., Arkema K.K., et al. 2019. Global modeling of nature's contributions to people. Science.
Chapra S.C., Dove A., Rockwell D.C. 2009. Great Lakes chloride trends : long-term mass balance and loading analysis. Journal of Great Lakes Research, 35(2): 272–284.
Cheruvelil K.S., Soranno P.A., Webster K.E., Bremigan M.T. 2013. Multi-scaled drivers of ecosystem state: quantifying the importance of the regional spatial scale. Ecological Applications, 23(7): 1603–1618.
Cimon-Morin J., Darveau M., Poulin M. 2014. Towards systematic conservation planning adapted to the local flow of ecosystem services. Global Ecology and Conservation, 2: 11–23.
Culhane F., Teixeira H., Nogueira A.J.A., Borgwardt F., Trauner D., Lillebø A., et al. 2019. Risk to the supply of ecosystem services across aquatic ecosystems. Science of The Total Environment, 660: 611–621.
DʼArcy P., Carignan R. 1997. Influence of catchment topography on water chemistry in southeastern Québec Shield lakes. Canadian Journal of Fisheries and Aquatic Sciences, 54: 2215–2227.
Del Vecchio R., Blough N.V. 2002. Photobleaching of chromophoric dissolved organic matter in natural waters: kinetics and modeling. Marine Chemistry, 78(4): 231–253.
Dugan H.A., Bartlett S.L., Burke S.M., Doubek J.P., Krivak-Tetley F.E., Skaff N.K., et al. 2017. Salting our freshwater lakes. Proceedings of the National Academy of Sciences, 114(17): 4453–4458.
Ebner M., Schirpke U., Tappeiner U. 2022. How do anthropogenic pressures affect the provision of ecosystem services of small mountain lakes. Anthropocene, 100–336.
Ecological Stratification Working Group. 1996. A national ecological framework for Canada. Centre for Land and Biological Resources Research (Canada).
Elser J.J., Andersen T., Baron J.S., Bergström A.K., Jansson M., Kyle M., et al. 2009. Shifts in lake N:P stoichiometry and nutrient limitation driven by atmospheric nitrogen deposition. Science, 326(5954): 835–837.
Environment Canada. 1999. The importance of nature to Canadians: survey highlights. Environment Canada.
Environment Canada. 2001. Threats to sources of drinking water and aquatic ecosystem health in Canada (No 1; NWRI Scientific Assessment Report Series). National Water Research Institute.
Environment Canada. 2011. 2011 Municipal water use report (No En11-2/2009E). Environment Canada.
Environment Canada, & Health Canada. 2001. Priority substances list assessment report—road salts(Canadian Environmental Protection Act, 1999).
Esri Canada. 2023. Bing basemaps. Available from https://pro.arcgis.com/en/pro-app/latest/help/data/services/use-bing-maps.htm#ESRI_SECTION1_1DF09CBF894B4CDE86D9ABF788B8694F.
Evans M., Frick C. 2001. The effects of road salts on aquatic ecosystems (N.W.R.I. Contribution Series; 02-308). Environment Canada.
Filstrup C.T., Wagner T., Oliver S.K., Stow C.A., Webster K.E., Stanley E.H., Downing J.A. 2018. Evidence for regional nitrogen stress on chlorophyll a in lakes across large landscape and climate gradients. Limnology and Oceanography, 63(S1).
Fisheries and Oceans Canada. 2019. Survey of recreational fishing in Canada, 2015. Fisheries and Ocean Canada and Statistics Canada.
Glibert P.M., Maranger R., Sobota D.J., Bouwman L. 2014. The Haber Bosch–harmful algal bloom (HB–HAB) link. Environmental Research Letters, 9(10): 105001.
Goyette J.-O., Bennett E.M., Howarth R.W., Maranger R. 2016. Changes in anthropogenic nitrogen and phosphorus inputs to the St. Lawrence sub-basin over 110 years and impacts on riverine export. Global Biogeochemical Cycles, 30(7): 1000–1014.
Grizzetti B., Lanzanova D., Liquete C., Reynaud A., Cardoso A.C. 2016. Assessing water ecosystem services for water resource management. Environmental Science & Policy, 61: 194–203.
Guo Z., Zhang L., Li Y. 2010. Increased dependence of humans on ecosystem services and biodiversity. PLoS One, 5(10): e13113.
Håkanson L. 1982. Lake bottom dynamics and morphometry: the dynamic ratio. Water Resources Research, 18(5): 1444–1450.
Health Canada, & Water, A. and C. C. B. 2012. Guidelines for Canadian recreational water quality. 3rd ed. (Catalogue No H129-15/2012E). Water, Air and Climate Change Bureau, Healthy Environments and Consumer Safety Branch, Health Canada. Available from https://central.bac-lac.gc.ca/.item?id=H129-15-2012-eng&op=pdf&app=Library.
Hébert M.-P., Symons C.C., Cañedo-Argüelles M., Arnott S.E., Derry A.M., Fugère V., et al. 2022. Lake salinization drives consistent losses of zooplankton abundance and diversity across coordinated mesocosm experiments. Limnology and oceanography Letters, 8: 19–29.
Hintz W.D., Arnott S.E., Symons C.C., Greco D.A., McClymont, Brentrup J.A., et al. 2022. Current water quality guidelines across North America and Europe do not protect lakes from salinization. Proceedings of the National Academy of Sciences, 119(9): e2115033119.
Hollister J., Stachelek J. 2017. lakemorpho: calculating lake morphometry metrics in R (6:1718). F1000Research.
Hossu C.A. 2019. Ecosystem services appreciation of urban lakes in Romania. Synergies and trade-offs between multiple users. Ecosystem Services. p. 16.
Howard K.W.F., Maier H. 2007. Road de-icing salt as a potential constraint on urban growth in the Greater Toronto Area, Canada. Journal of Contaminant Hydrology, 91(12): 146–170.
Hunt L.M., Dyck A. 2011. The effects of road quality and other factors on water-based recreation demand in Northern Ontario, Canada. Forest Science, 57(4): 281–291.
Huot Y., Brown C.A., Potvin G., Antoniades D., Baulch H.M., Beisner B.E., et al. 2019. The NSERC Canadian Lake Pulse network : a national assessment of lake health providing science for water management in a changing climate. Science of the Total Environment, 695: 133–668.
Islam D., Berkes F. 2016. Can small-scale commercial and subsistence fisheries co-exist? Lessons from an indigenous community in northern Manitoba, Canada. Maritime Studies, 15(1): 1.
Jeppesen E., Søndergaard M., Jensen H.S., Ventäla A.-M. 2009. Lake and reservoir management. In Encyclopedia of inland waters. Edited by Likens D G. E. Academic Press. pp. 295–309.
Jeppesen E., Meerhoff M., Davidson T.A., Trolle D., Søndergaard M., Lauridsen T.L., et al. 2014. Climate change impacts on lakes : an integrated ecological perspective based on a multi-faceted approach, with special focus on shallow lakes. Journal of Limnology, 73(s1).
Jones L., Norton L., Austin Z., Browne A.L., Donovan D., Emmett B.A., et al. 2016. Stoks and flows of natural and human-derived capital in ecosystem services. Land Use Policy, 52: 151–162.
Kalff J. 2002. Limnology: inland water ecosystems. Prentice Hall.
Karimi R., Pogue S.J., Kröbel R., Beauchemin K.A., Schwinghamer T., Henry Janzen H. 2020. An updated nitrogen budget for Canadian agroecosystems. Agriculture, Ecosystems & Environment, 304: 107046.
Kaushal S.S., Groffman P.M., Likens G.E., Belt K.T., Stack W.P., Kelly V.R., et al. 2005. Increased salinization of fresh water in the northeastern United States. Proceedings of the National Academy of Sciences, 102(38): 13517–13520.
Kaushal S.S., Likens G.E., Pace M.L., Reimer J.E., Maas C.M., Galella J.G., et al. 2021. Freshwater salinization syndrome : from emerging global problem to managing risks. Biogeochemistry, 154(2): 255–192.
Keeler B.L., Polasky S., Brauman K.A., Johnson K.A., Finlay J.C., O'Neill A., et al. 2012. Linking water quality and well-being for improved assessment and valuation of ecosystem services. Proceedings of the National Academy of Sciences, 109(45): 18619–18624.
Knoll L., Hagenbuch E., Stevens M., Vanni M., Renwick W., Denlinger J., et al. 2015. Predicting eutrophication status in reservoirs at large spatial scales using landscape and morphometric variables. Inland Waters, 5(3): 203–214.
Kumagai M., Vincent W. F. (eds). 2003. Freshwater management: global versus local perspectives. Springer.
Leavitt P.R., Brock C.S., Ebel C., Patoine A. 2006. Landscape-scale effects of urban nitrogen on a chain of freshwater lakes in central North America. Limnology and Oceanography, 51(5): 2262–2277.
Legendre P., Legendre L. 2012. Chapter 11—canonical analysis. In Developments in environmental modelling (Vol. 24). Edited by Dans P., Legendre, Legendre L. Elsevier. pp. 625–710.
MacIntyre H.L., Cullen J.J. 2005. Using cultures to investigate the physiological ecology of microalgae. Algal Culturing Techniques, 287–326.
Mandrak N.E., Cudmore B. 2010. The fall of native fishes and the rise of non-native fishes in the Great Lakes Basin. Aquatic Ecosystem Health & Management, 13(3): 255–268.
Martín-López B., Palomo I., García-Llorente M., Iniesta-Arandia I., Castro A.J., García Del Amo D., et al. 2017. Delineating boundaries of social-ecological systems for landscape planning: a comprehensive spatial approach. Land Use Policy, 66: 90–104.
Millennium Ecosystem Assessment. 2005. Ecosystems and human well-being: wetlands and water synthesis. Island Press.
Minns C.K., Moore J.E., Shuter B.J., Mandrak N.E. 2008. A preliminary national analysis of some key characteristics of Canadian lakes. Canadian Journal of Fisheries and Aquatic Sciences, 65(8): 1763–1778.
Mitchell M.G.E., Schuster R., Jacob A.L., Hanna D.E.L., Dallaire C.O., Raudsepp-Hearne C., et al. 2021. Identifying key ecosystem service providing areas to inform national-scale conservation planning. Environmental Research Letters, 16(1): 014038.
Monchamp M.-E., Pick F.R., Beisner B.E., Maranger R. 2014. Nitrogen forms influence microcystin concentration and composition via changes in Cyanobacterial community structure. PLoS One, 9(1): e85573.
Morin D., Snodgrass W., Brown J., Arp P.A. 2000. Impacts evaluation of road salt loadings on soils and surface waters [Supporting document for the road salts PSL assessment. Report submitted to the Environment Canada CEPA Priority Substances List Environmental Resource Group on Road Salts]. Commercial Chemicals Evaluation Branch, Environment Canada.
Murray J., Ayers J., Brookfield. 2023. The impact of climate change on monthly base flow trends across Canada. Journal of Hydrology, 618: 12954.
Natural Resources Canada. 2003. National scale frameworks hydrology—drainage areas, Canada, Version 5.0. Available from https://www.statcan.gc.ca/en/subjects/standard/sdac/sdacinfo1.
Natural Resources Canada. 2013. Canadian digital elevation model. Open government licence—Canada. Available from https://open.canada.ca/en/open-government-licence-canada.
Natural Resources Canada. 2015. National hydro network—NHN—GeoBase series. Open Government Portal. Available from https://open.canada.ca/data/en/dataset/a4b190fe-e090-4e6d-881e-b87956c07977.
Natural Resources Canada. 2019. Physiographic region of Canada. Open Government Portal. Available from https://open.canada.ca/data/en/dataset/a3dfbaf4-1b20-4061-aa0a-e7a79953f52d.
Nielsen A., Trolle D., Søndergaard M., Lauridsen T.L., Bjerring R., Olesen J.E., Jeppesen E. 2012. Watershed land use effects on lake water quality in Denmark. Ecological Applications, 22(4): 1187–1200.
Nõges T. 2009. Relationships between morphometry, geographic location and water quality parameters of European lakes. Hydrobiologia, 633(1): 33–43.
NSERC Canadian Lake Pulse Network. 2021. NSERC Canadian Lake Pulse Network field manual 2017—2018—2019 surveys. Edited by Varin M.-P., Beaulieu M.-L., Huot Y. Université de Sherbrooke.
Oksanen J., Blanchet G., Michael F., Kindt R., Legendre P. 2020. vegan: community ecology package.
Patton C.J., Kryskalla J.R. 2003. Methods of analysis by the U.S. Geological Survey National Water Quality Laboratory : evaluation of alkaline persulfate digestion as an alternative to Kjeldahl digestion for determination of total and dissolved nitrogen and phosphorus in water. U.S. Department of the Interior, U.S. Geological Survey.
Prepas E.E., Planas D., Gibson J.J., Vitt D.H., Prowse T.D., Dinsmore W.P., et al. 2001. Landscape variables influencing nutrients and phytoplankton communities in Boreal Plain lakes of northern Alberta: a comparison of wetland- and upland-dominated catchments. Canadian Journal of Fisheries and Aquatic Sciences, 58: 1286–1299.
R Core Team. 2020. A langauge and environement for statistical computing. R Foundation for Statistical Computing. Available from https://www.R-project.org/.
Raudsepp-Hearne C., Petersen G.D., Bennett E.M. 2010. Ecosystem service bundles for analyzing tradeoffs in diverse landscapes. Proceedings of the National Academy of Sciences of the United States of America, 107: 5242–5247.
Read E.K., Patil V.P., Oliver S.K., Hetherington A.L., Brentrup J.A., Zwart J.A., et al. 2015. The importance of lake-specific characteristics for water quality across the continental United States. Ecological Applications, 25(4): 943–955.
Schindler D.W. 2001. The cumulative effects of climate warming and other human stresses on Canadian freshwaters in the new millennium. Canadian Journal of Fisheries and Aquatic Sciences, 58(1): 18–29.
Schindler D.W. 2006. Recent advances in the understanding and management of eutrophication. Limnology and Oceanography, 51(1, part 2): 356–363.
Schindler D.W., Donahue W.F. 2006. An impending water crisis in Canada's western prairie provinces. Proceedings of the National Academy of Sciences of the United States of America, 103(19): 7210.
Scott J.T., McCarthy M.J. 2010. Nitrogen fixation may not balance the nitrogen pool in lakes over timescales relevant to eutrophication management. Limnology and Oceanography, 55(3): 1265–1270.
Seekell D.A., Lapierre J.-F., Cheruvelil K.S. 2018. A geography of lake carbon cycling: geography of lake carbon cycling. Limnology and Oceanography Letters, 3(3): 49–56.
South A. 2017. Rnaturalearth: world map data from Natural Earth. R package version 0.1.0. Available from https://CRAN.R-project.org/package=rnaturalearth.
Soranno P.A., Cheruvelil K.S., Wagner T., Webster K.E., Bremigan M.T. 2015. Effects of land use on lake nutrients: the importance of scale, hydrologic connectivity, and region. PLoS One, 10(8): e0135454.
Special Surveys Division. 1996. Survey on the importance of nature to Canadians in 1996. Statistics Canada and Environment Canada, Ottawa, ON.
Stekhoven D.J., Buhlmann P. 2012. MissForest—non-parametric missing value imputation for mixed-type data. Bioinformatics, 28(1): 112–118.
St-Gelais N.F., Lapierre J.-F., Siron R., Maranger R. 2020. Evaluating trophic status as a proxy of aquatic ecosystem service provisioning on the basis of guidelines. Bioscience, 70: 1120–1126.
Tang Z., Engel B.A., Pijanowski B.C., Lim K.J. 2005. Forecasting land use change and its environmental impact at a watershed scale. Journal of Environmental Management, 76(1): 35–45.
Taranu Z.E., Gregory-Eaves I., Steele R.J., Beaulieu M., Legendre P. 2017. Predicting microcystin concentrations in lakes and reservoirs at a continental scale : a new framework for modelling an important health risk factor. Global Ecology and Biogeography, 26(6): 625–637.
Todorov V., Filzmoser P. 2010. An object-oriented framework for robust multivariate analysis. Journal of Statistical Software, 32: 147.
US EPA. 1997. Method 300.1: determination of inorganic anions in drinking water by ion chromatography (revision 1.0).
Venables W.N., Ripley B.D. 2002. Modern applied statistics with S. Edited by Venables W. N., Ripley B. D. Springer.
Villamagna A.M., Angermeier P.L., Bennett E.M. 2013. Capacity, pressure, demand, and flow : a conceptual framework for analyzing ecosystem service provision and delivery. Ecological Complexity, 15: 114–121.
Vincent W.F. 2009. Effects of climate change on lakes. Dans Encyclopedia of Inland Waters. Elsevier. pp. 55–60.
Walsh J.R., Carpenter S.R., Vander Zanden M.J. 2016. Invasive species triggers a massive loss of ecosystem services through a trophic cascade. Proceedings of the National Academy of Sciences, 113(15): 4081–4085.
Webster K.E., Soranno P.A., Cheruvelil K.S., Bremigan M.T., Downing J.A., Vaux P.D., et al. 2008. An empirical evaluation of the nutrient-colour paradigm for lakes. Limnology and Oceanography, 53(3): 1137–1148.
Weishaar J.L., Aiken G.R., Bergamaschi B.A., Fram M.S., Fujii R., Mopper K. 2003. Evaluation of specific ultraviolet absorbance as an indicator of the chemical composition and reactivity of dissolved organic carbon. Environmental Science & Technology, 37(20): 4702–4708.
Welschmeyer N.A. 1994. Fluorometric analysis of chlorophyll a in the presence of chlorophyll b and pheopigments.Limnology and Oceanography, 39(8): 1985–1992.
Wetzel R.G., Likens G.E. 2000. Limnological analyses. Springer, New York.
WWF-Canada. 2015. Technical protocol for the freshwater threats assessment.
WWF-Canada. 2017. Watershed reports: a national assessment of Canada's freshwater. WWF.
Supplementary material
Supplementary Material 1 (DOCX / 4.80 MB).
- Download
- 4.80 MB
Information & Authors
Information
Published In

FACETS
Volume 8 • January 2023
Pages: 1 - 16
Editor: S.J. Cooke
History
Received: 20 February 2023
Accepted: 5 July 2023
Version of record online: 16 November 2023
Copyright
© 2023 The Author(s). This work is licensed under a Creative Commons Attribution 4.0 International License (CC BY 4.0), which permits unrestricted use, distribution, and reproduction in any medium, provided the original author(s) and source are credited.
Data Availability Statement
All LakePulse data that were analyzed for this study will be made publicly available in 2023 on the Gordon Foundation Datastream platform and in another public database soon after.
Data on threat levels across Canada analyzed for this study can be requested from the World Wildlife Fund Canada.
Data on freshwater recreational use across Canada analyzed for this study are available from Environment Canada (https://www150.statcan.gc.ca/n1/en/catalogue/11M0001X).
The data calculated for this study, including deviation from reference conditions and the additive colour maps, are openly available on Zenodo at https://doi.org/10.5281/zenodo.8043536.
Key Words
Sections
Subjects
Plain Language Summary
Assessing overall lake health across Canada to identify sites for restoration and conservation
Authors
Author Contributions
Conceptualization: AD, MB, NFS, RM
Data curation: AD, NFS, MB
Formal analysis: AD, MB, NFS, TP, RM
Funding acquisition: RM
Investigation: AD
Project administration: RM
Resources: RM
Supervision: MB, NFS, TP, RM
Visualization: AD, MB
Writing – original draft: AD, MB, RM
Writing – review & editing: AD, MB, NFS, TP, RM
Competing Interests
The authors declare there are no competing interests.
Metrics & Citations
Metrics
Other Metrics
Citations
Cite As
Andréanne Dupont, Morgan Botrel, Nicolas Fortin St-Gelais, Timothée Poisot, and Roxane Maranger. 2023. A social–ecological geography of southern Canadian lakes. FACETS.
8(): 1-16. https://doi.org/10.1139/facets-2023-0025
Export Citations
If you have the appropriate software installed, you can download article citation data to the citation manager of your choice. Simply select your manager software from the list below and click Download.
There are no citations for this item