Lower extremity muscle strength reference values for young Saudi male adults aged 21 to 23 years and their correlation with anthropometric parameters and balance
Abstract
Normative reference values for muscle strength are needed for muscle strength assessment and estimation of prognosis in lower extremity related neuromuscular disorders, as muscle strength influenced by anthropometric parameters and muscle strength itself affects balance. Normative reference values for muscle strength in the Saudi Arabian population is lacking in the literature. Hence, the current study aimed to establish normative reference values for lower extremity muscle strength and to correlate these values with anthropometric parameters and balance. Lower extremity muscle strength and balance were assessed by baseline hand-held dynamometer and by forward, lateral, and oblique direction reach tests in 421 young male adults between 21 and 23 years of age. The mean and standard deviation of lower extremity strength ranged from 43.83 ± 16.92 lb to 62.07 ± 10.74 lb. Body weight, body mass index, and oblique and lateral reach distances were correlated with some knee and ankle muscle strength values. Body weight, body mass index, and balance showed significant effect on lower extremity muscle strength. Furthermore, decreased muscle strength may impair balance; the current clinical practice should evaluate body weight, body mass index, and muscle strength during the assessment process.
Introduction
Muscle strength is defined as a muscle’s ability to generate force (Higgins 2011). Muscle strength is critically important for functional performance (Powers et al. 2006; Higgins 2011). Young adults demonstrate high levels of muscle performance compared with their elders; as age increases, muscle performance decreases (Stoll et al. 2000). Adequate muscle strength at a young age is important for aesthetics and is crucial for sports performance and injury prevention (Bourne et al. 2018; Soylu et al. 2019). Many disorders in young adults, including obesity, malnutrition, issues with mental health, technology or internet addiction, drugs, alcohol, and smoking, can be mitigated by participating in physical activities like muscle strengthening (World Health Organization 2014; Lam and Riba 2016; Foster et al. 2018; Cangin et al. 2018). The management of these disorders requires normative reference values for muscle strength to accurately understand muscle capacity (Bhattacharyya et al. 2017).
Many studies have identified reference values for muscle strength (Bisen et al. 2012; Leong et al. 2016; McKay et al. 2017). However, normative reference values for young adults are not well established, as this population is rarely studied except as a part of larger age groups (Bohannon 2011). Because muscle strength declines in old age, chronic diseases that affect muscle strength are most common in the elderly (Francis et al. 2017); therefore, research has focused more on establishing reference values in the elderly rather than in young healthy populations. Muscle testing methods have changed over time; just a few decades ago, manual muscle testing was a common clinical method for assessing muscle strength (Fisher and Harrington 2015). Even though it is an ideal method in clinical practice, it does not have good reliability and validity for the assessment of muscle strength (Cuthbert and Goodheart 2007). The most common objective methods for assessing muscle strength are isokinetic and portable dynamometers (Benfica et al. 2018). Other tools that assess muscle strength, such as the leg press, plate spring gauge, and pull down, show good reliability, but validity has not been proven for these tools (Mijnarends et al. 2013; Alqahtani et al. 2017). The isokinetic dynamometer is considered the ideal muscle testing method, and it provides both isokinetic (concentric and eccentric) and isometric measures (Benfica et al. 2018); however, the hand-held dynamometer and myometer are currently very popular in clinical use because of their availability and low cost, and they provide isomeric measures. The hand-held dynamometer has been shown to have good reliability and validity in clinical use. (Mentiplay et al. 2015).
Many factors can affect muscle strength, including age, gender, anthropometric parameters, nutritional status, and physical activity. Muscle strength has been positively correlated with function, balance, and gait in many disease populations. (Kamat et al. 2012; Wang et al. 2016; Callesen et al. 2019). Anterior cruciate ligament, meniscal injuries due to road traffic accidents, and ankle sprains are common in young healthy population, leading to reduced lower extremity muscle strength as the primary impairment (Thomas et al. 2013). In clinical practice, rehabilitation of these individuals requires reference values for muscle strength in the young, healthy population.
However, the factors that affect muscle strength in young populations are not extensively established due to a lack of literature. In the Kingdom of Saudi Arabia, reference values for muscle strength have been commonly confined to the hand (Alahmari et al. 2019), and normative reference values taken with a hand-held dynamometer for the remaining muscles are scarce. There is a high incidence of road traffic accidents in the Kingdom of Saudi Arabia, and many of the victims, most of whom are young males, experience head, neck, and upper and lower extremity injuries (Mansuri et al. 2015). In addition, the obesity rate in the Kingdom of Saudi Arabia is 33.7%, making it the 15th most obese country in the world (Alqarni 2016; Habbab and Bhutta 2020). Moreover, many Saudi Arabian children are addicted to smartphones, games, and the internet, which further exacerbates obesity in the young adult population (Albursan et al. 2019). Both accidents and obesity have an effect on muscle strength.
Improving muscle strength is a critical intervention that is required to address these issues; hence, normative data is needed to prescribe strengthening program parameters and to estimate progress. The current study aims to establish normative reference values for lower extremity muscle strength in the young adult population of Saudi Arabia using a hand-held dynamometer and to assess the correlation between strength and anthropometric parameters and balance.
Methodology
Approval for this cross-sectional study was obtained from the institutional ethical review board (approval no. REC # 2016-08-29). The sample size calculation was performed online using Calculator.net software. A total sample size of 424 was determined based on a 95% confidence interval, 5% margin of error, population proportion of 50% of the expected sample size, and 10% dropout rate.
Using computer-generated numbers, we recruited college students randomly for a duration of six months. The study was conducted in the Department of Medical Rehabilitation Sciences, College of Applied Medical Sciences, King Khalid University, Abha, Saudi Arabia, and we chose college-going students aged 21–23 years because that is a vulnerable age for accidents, addictions, and obesity. A total of 424 male students with no history of lower extremity fractures or ligament injuries were included in the study. Students with any congenital, neurological, or debilitating diseases were excluded from the study. Students who were suffering from a cold, fever, or infection; who were taking any medication that alters muscle contraction; or who were suffering from any acute pain such as back pain, neck pain, delayed onset muscle soreness, or muscular aches were also excluded. The included students were introduced to the research aims and asked to complete a written informed consent.
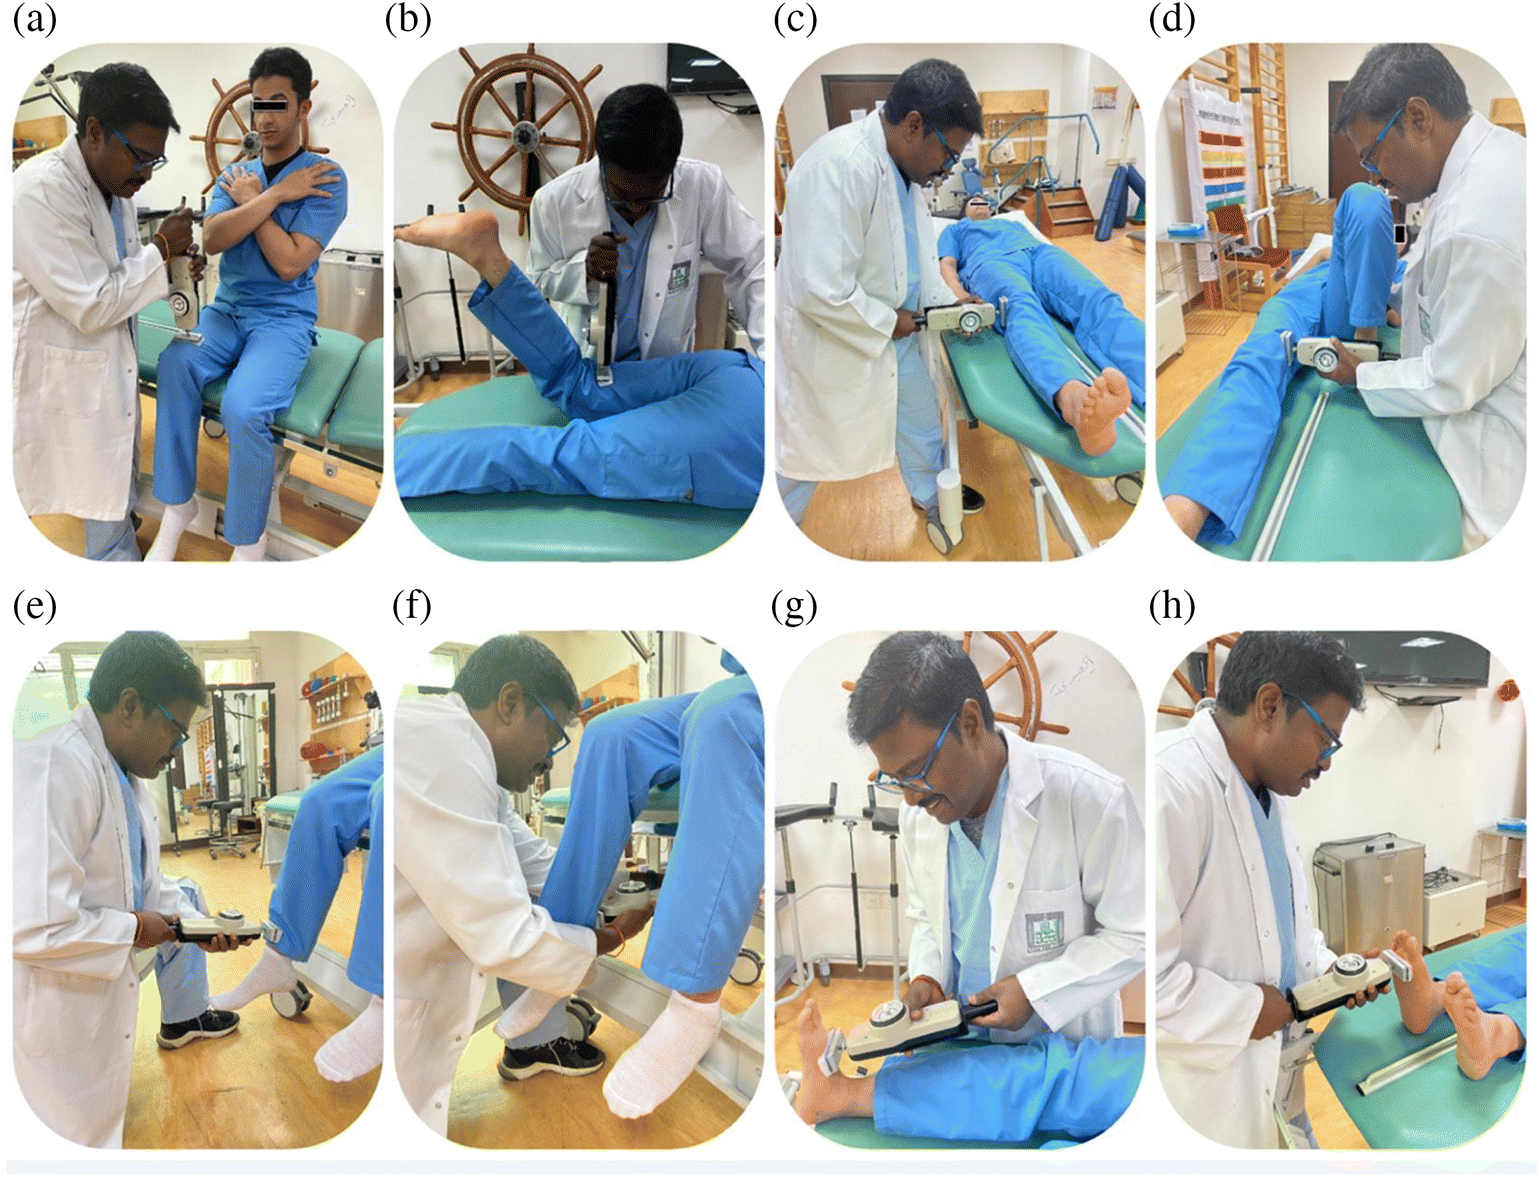
Demographic characteristics, including age, height, weight, upper limb length, trunk length, and lower limb length, were measured and entered in the data entry sheet. To measure upper limb length, we measured from the acromion process of the shoulders to the radial styloid process; for measuring lower limb length, we measured from anterior superior iliac spine on the pelvis to the medial malleolus; for measuring trunk length, we measured from the acromion process of the shoulder to the anterior superior iliac spine on the pelvis. All the length measurements were taken using a tape measure in centimeters. The validity of the measurements was proved by comparing them with a computed tomographic scan for measuring limb length (Neelly et al. 2013). The lower extremity muscle groups included in this study were hip flexors, extensors, abductors, adductors; knee flexors and extensors; and ankle plantar flexors and dorsiflexors. A baseline hydraulic push–pull dynamometer of 250 lb with an analog (dial) gauge (Model: FEI-12-0394, Fabrication Enterprises Inc., USA) was used for muscle strength assessment. This instrument has good concurrent validity by comparison with isokinetic dynamometers for testing hip, knee, and ankle muscles (Mijnarends et al. 2013). We used the “make test” for the assessment process, in which the participant exerted force against the dynamometer for 3–5 s. We followed the standard method of dynamometer assessment, and the protocol for the starting position, therapist position, and placement of the dynamometer was based on Tedla et al. (2012). The students were provided detailed instructions for the muscle strength assessment, and we obtained muscle strength values three times for each muscle group (Kelln et al. 2008) as shown in Fig. 1. The average of the three measurements was used for the analysis. If there was a difference of more than 10 lb between each measurement, we performed additional trials to ensure that there were no mistakes in the values obtained. Between each muscle group measurement, at least 30 s of rest was provided to decrease fatigue. Balance was assessed using the standard procedures for the forward, lateral, and oblique direction reach test. A piece of graph paper was affixed to a movable white board. The subject was asked to stand in a relaxed position with legs shoulder width apart and without shoes, and the white board was placed parallel to the forward center line to them. To measure the forward reach, the participants were instructed to raise their arm to shoulder level and to keep their arms parallel to the graph paper on the white board. The starting position was recorded with a pen mark on the graph paper with the tip of third metacarpal as reference point. Participants reached forward as far as possible without raising their heels or taking a step. The end position was also recorded on the graph paper with a pen mark. The difference between the end position and the starting position was measured in centimeters. The lateral reach and oblique direction reach were also measured in a similar manner by changing the position of the participants and the white board, as explained by Tedla et al. (2021).
Fig. 1.
Data collection took 30–45 min per subject in one or two sessions, depending up on the subject’s fatigue level. If the subject’s assessment was planned in two sessions, then the duration of the two sessions was not more than one hour in total.
Statistical analysis
We used IBM SPSS Statistics for Windows Version 22.0 (Armonk, NY: IBM Corp.) for the data analysis. Descriptive statistics were performed to calculate the mean, standard deviation, minimum, and maximum. An assessment of the normality of the data was conducted using the Shapiro–Wilk test. Differences between the right and left sides were calculated using an independent t-test, and correlations between variables were measured using the Pearson correlation coefficient. Based on the guidelines provided by Schober and Schwarte (2018), we interpreted the r value as follows: 0.00–0.10, negligible correlation; 0.10–0.39, weak correlation; 0.40–0.69, moderate correlation; 0.70–0.89, strong correlation; and 0.90–1.00, very strong correlation.
Results
The descriptive statistics for demographic characteristics, including age, height, weight, body mass index (BMI), upper limb length, lower limb length, and trunk length, as well as the balance measurements are provided in Table 1. The normative reference values for lower extremity muscle strength, presented as means and standard deviations, minimums and maximums, and p values for right- and left-side differences, are provided in Table 2. In the analysis of side-to-side differences, only the hip flexors and knee extensors had statistically significant differences between the right and left sides, with p values of 0.003 and 0.014, respectively. The correlations between muscle strength and upper extremity length, trunk length, lower extremity length, height, weight, BMI, age, and balance were calculated. Of all the variables, weight, BMI, forward reach distance, and oblique reach distance had positive correlations with strength. Weight had a moderate correlation with left hip flexors and right and left knee extensors, with correlation r values (p values) of 0.40 (0.03), 0.526 (< 0.001), and 0.579 (< 0.001), respectively. In contrast, weight had a weak correlation with left hip abductors, with a correlation r value (p value) of 0.362 (0.05). Similarly, BMI had a moderate correlation with left hip flexors, abductors, and right and left knee extensors, with correlation r values (p values) of 0.440 (0.02), 0.415 (0.02), 0.536 (< 0.001), and 0.602 (< 0.001), respectively. The details are provided in Table 3.
Table 1.
| Variables | Mean ± standard deviation | Minimum | Maximum |
|---|---|---|---|
| Age (years) | 21.93 ± 0.74 | 21 | 23 |
| Height (m) | 1.69 ± 0.04 | 1.6 | 1.77 |
| Weight (kg) | 73.99 ± 17.67 | 50 | 118 |
| Body mass index (wt/m2) | 26.04 ± 6.32 | 17.72 | 45.52 |
| Upper limb length (cm) | 57.03 ± 2.91 | 52 | 64 |
| Trunk length (cm) | 49.30 ± 2.90 | 44 | 57 |
| Forward reach (cm) | 31.39 ± 4.62 | 22.5 | 41 |
| Lateral reach (cm) | 23.78 ± 4.61 | 13.33 | 33 |
| Oblique direction reach (cm) | 25.48 ± 4.98 | 18 | 42.67 |
Table 2.
| Muscle group and side | Mean ± standard deviation | Minimum | Maximum | p |
|---|---|---|---|---|
| Right hip flexors | 62.07 ± 10.74 | 37.67 | 90 | 0.003** |
| Left hip flexors | 59.04 ± 9.58 | 38.67 | 83.33 | |
| Right hip extensors | 57.24 ± 10.97 | 36.67 | 80.33 | 0.467 |
| Left hip extensors | 56.39 ± 12.72 | 27.33 | 87.33 | |
| Right hip abductors | 66.62 ± 12.78 | 40.33 | 95.67 | 0.227 |
| Left hip abductors | 64.46 ± 12.43 | 34 | 106.67 | |
| Right hip adductors | 43.83 ± 16.92 | 18.67 | 89 | 0.165 |
| Left hip adductors | 46.09 ± 18.32 | 19 | 83.33 | |
| Right knee extensors | 55.81 ± 10.35 | 32.33 | 78.33 | 0.014* |
| Left knee extensors | 53.88 ± 10.24 | 36.67 | 79.33 | |
| Right knee flexors | 58.13 ± 9.12 | 41.67 | 76 | 0.166 |
| Left knee flexors | 56.44 ± 9.69 | 35 | 76 | |
| Right ankle dorsi flexors | 50.77 ± 7.85 | 33.33 | 71.67 | 0.315 |
| Left ankle dorsi flexors | 49.89 ± 7.34 | 41 | 77 | |
| Right ankle plantar flexors | 45.69 ± 12.46 | 24.67 | 75 | 0.394 |
| Left ankle plantar flexors | 44.67 ± 15.04 | 24.33 | 83.33 |
Note
*Correlation is significant at the 0.05 level (2-tailed). **Correlation is significant at the 0.01 level (2-tailed).
Table 3.
| Variables Correlated | r | p | |
|---|---|---|---|
| Weight (kg) | LHF | 0.398* | 0.03 |
| RKE | 0.526** | 0.00 | |
| LKE | 0.579** | 0.00 | |
| LHAB | 0.362* | 0.05 | |
| Body mass index (wt/m2) | LHF | 0.440* | 0.02 |
| RKE | 0.536** | 0.00 | |
| LKE | 0.602** | 0.00 | |
| LHAB | 0.415* | 0.02 | |
| Lateral reach (cm) | RKE | 0.451* | 0.01 |
| LKE | 0.512** | 0.00 | |
| RADF | 0.504** | 0.00 | |
| LADF | 0.379* | 0.04 | |
| Oblique direction reach (cm) | RKE | 0.412* | 0.02 |
| LKE | 0.377* | 0.04 | |
| RADF | 0.457* | 0.01 | |
| LADF | 0.462* | 0.01 | |
| RAPF | 0.403* | 0.03 |
Note
*Correlation is significant at the 0.05 level (2-tailed). **Correlation is significant at the 0.01 level (2-tailed). R, Pearson correlation coefficient value; p, probability value; BMI, body mass index; LHF, left hip flexors; RKE, right knee extensors; LKE, left knee extensors; LHAB, left hip abductors; RADF, right ankle dorsi flexors; LADF, left ankle dorsi flexors; RAPF, right ankle plantar flexors.
Balance as tested by forward reach, lateral reach, and oblique reach distances showed some interesting findings. No muscle strength values were correlated with forward reach distance, whereas lateral reach and oblique reach demonstrated some moderate correlations with strength. Lateral reach had a moderate correlation with right and left knee extensors and right ankle dorsiflexors, with correlation r values (p values) of 0.451 (0.01), 0.512 (< 0.001), and 0.504 (< 0.001), respectively. Lateral reach had a weak correlation with left ankle dorsiflexors, with a correlation r value (p value) of 0.379 (0.04). Oblique reach had a moderate correlation with right and left knee extensors and right ankle dorsiflexors, with correlation r values (p values) of 0.451 (0.01), 0.512 (< 0.001), and 0.504 (< 0.001), respectively.
Discussion
These are the first normative reference values to be established for lower extremity muscle strength in young adults in Saudi Arabia, and the correlation analysis between various demographic characteristics and balance and muscle strength revealed interesting findings. Previous researchers who proposed normative reference values for lower extremity muscle strength for the populations of Switzerland (Stoll et al. 2000), Brazil (Daloia et al. 2018), and Australia (Stoll et al. 2000) reported normative values similar to those found in our study for many of the muscle groups. In our study, we found a moderate correlation between BMI and left hip flexors, abductors, and right and left knee extensors, with correlation r values (p values) of 0.44 (0.02), 0.415 (0.02), 0.536 (0.001), and 0.62 (0.001), respectively. Pasco et al. (2020) conducted a study in the Southeastern Australian population between the ages of 20 and 97 years and established a weak and positive correlation between BMI and muscle strength: for males, r = 0.16 for hip flexors (p = 0.058), and r = 0.13 for hip abductors (p = 0.002). In contrast to our study, the correlation between the BMI and muscle strength was weak in their study. This could be because the ages of the included participants covered a wider age range, from 20 to 97 years, and also because the total number of young males included in their study was comparatively less than the middle and older age groups.
Stoll et al. (2000) found significant differences in the right- and left-side muscle strength of the hip adductors, hip external rotators, hip flexors, knee flexors, ankle dorsiflexors, and ankle plantar flexors. Our study found significant differences between right and left hip flexors and knee extensors. Except for hip flexors, the muscle groups found in the study by Stoll et al. (2000) differ from those found in our study, and we believe that the differences can be attributed to differences in the type of muscle strength measurement performed. They measured muscle strength in kilopascals, and we measured strength in pounds. Compared with pounds, kilopascals are quite minute, which could explain the larger differences between the right and left sides seen in the previous study. These measurement unit variations among studies may be the reason for the differences in the results. In addition, differences in the age groups and muscle testing methods could significantly influence the muscle strength values obtained. The muscle strength of right hip flexors and knee extensors was high compared with left-side hip flexors and knee extensors. This could be due to the usage of the right side in many activities of daily living. The repeated use of a dominant side creates efficient neural connections from the brain and leads to greater strength (Daloia et al. 2018).
Another finding of note in our study was the correlation between body weight and BMI and some muscle groups, including hip flexors and knee extensors. Similar results were obtained by Nobuyuki et al. (2012) who studied the influence of anthropometric parameters on muscle strength in Japanese adolescents. Nobuyuki et al. (2012) also found high correlations between height and leg muscle strength, which we did not find in our study.
The correlations between the reach tests and muscle strength found in our study were similar to those of previous studies. Oya et al. (2008) confirmed the importance of knee extensor muscle strength assessment in the identification of fall risk in the elderly and reported that insufficient knee extensor muscle activity can increase fall risk. Our study found a similar relation between knee extensor muscle strength and lateral and oblique reach distances. While some authors have discussed that ankle dorsiflexor and hip abductor muscle activity can influence balance, there has not been concrete evidence of this (Newton 2001). This is because the direction of movement of the center of gravity on the base of support can initiate complex muscle combinations depending on need (Kazemi et al. 2017). In the general population, any reach beyond the base of support causes an initiation of distal ankle strategy muscles. As the reach distance increases, the activity is shifted to more proximal muscles and finally leads to a step if the muscles fail to control the center of gravity. It is difficult to determine which muscle synergy will be active in each reach direction, and muscle activity changes as the direction of the reach changes (Afschrift et al. 2016). Because of the center of gravity shift during oblique direction and lateral direction tests, we assume that the ankle dorsiflexors and knee extensors played an important role in controlling the center of gravity, which explains the positive correlation between the muscle strength of these muscle groups and the reach test distance.
The data collection process was tedious and time consuming. We managed the data collection by planning the examination in various stations. The subjects were moved from one station to another station with sufficient rest. As the subject population was young males, we did not encounter any difficulty during the data collection; a few people experienced fatigue, but they recovered within a few minutes and continued the remaining examination without any discomfort.
Due to cultural issues and practical difficulties, we considered only male subjects from a single university, and the age group included was young adults between 21 and 23 years of age because that was the only age group available at our university campus. In the future, we suggest involving both genders and various age groups from multiple centers and the use of more advanced outcome measures such as isokinetic dynamometers and pressure platforms. The effect of physical activity and fatigue also should be considered in future studies. This may provide more culturally robust and sensitive data related to muscle strength in the population of the Kingdom of Saudi Arabia.
Conclusion
This research established reference values for lower extremity muscle strength in young male adults in Saudi Arabia. Mean and standard deviation of muscle strength ranged from 43.83 ± 16.92 lb to 62.07 ± 10.74 lb. Body weight, BMI, lateral reach distance, and oblique reach distance had positive correlations with lower extremity muscle strength values.
Acknowledgements
We would like to sincerely thank the Deanship of scientific research, King Khalid University, Abha, KSA for funding this research project with research project number RGP.1/52/42.
References
Afschrift M, Jonkers I, De Schutter J, and De Groote F. 2016. Mechanical effort predicts the selection of ankle over hip strategies in nonstepping postural responses. Journal of Neurophysiology. American Physiological Society Bethesda, MD, 116(4): 1937–1945.
Alqarni SSM. 2016. A review of prevalence of obesity in Saudi Arabia. Journal of Obesity & Eating Disorders, 2: 2.
Alahmari K, Kakaraparthi VN, Reddy RS, Silvian PS, Ahmad I, and Rengaramanujam K. 2019. Percentage difference of hand dimensions and their correlation with hand grip and pinch strength among schoolchildren in Saudi Arabia. Nigerian Journal of Clinical Practice, 22(10): 1356.
Albursan, IS, AlQudah MF, Dutton E, Hassan EMAH, Bakhiet SFA, Alfnan AA, et al. 2019. National, sex and academic discipline difference in smartphone addiction: A study of students in Jordan, Saudi Arabia, Yemen and Sudan. Community Mental Health Journal, 55(5): 825–830.
Alqahtani BA, Ferchak MA, Huppert TJ, Sejdic E, Perera S, Greenspan SL, et al. 2017. Standing balance and strength measurements in older adults living in residential care communities. Aging Clinical and Experimental Research, 29(5): 1021–1030.
Benfica P, do A, Aguiar LT, Brito SAF, Bernardino LHN, Teixeira-Salmela LF, et al. 2018. Reference values for muscle strength: A systematic review with a descriptive meta-analysis. Brazilian Journal of Physical Therapy. Associação Brasileira de Pesquisa e Pós-Graduação em Fisioterapia, 22(5): 355–369.
Bhattacharyya N, Gubbels SP, Schwartz SR, Edlow JA, El-Kashlan H, and Fife T. 2017. Clinical practice guideline: Benign Paroxysmal Positional Vertigo (Update). Otolaryngology - Head and Neck Surgery (United States), 156(3).
Bisen RS, Tedla JS, and Kumar KV. 2012. Reference values of isometric trunk muscle strength in school age children using a hand held dynamometer: A cross- sectional study. Physiotherapy and Occupational Therapy Journal, 5(3): 107–115.
Bohannon RW. 2011. Literature reporting normative data for muscle strength measured by hand-held dynamometry: A systematic review. Isokinetics and Exercise Science, 19(3): 143–147.
Bourne, MN, Timmins RG, Opar DA, Pizzari T, Ruddy JD, and Sims C. 2018. An evidence-based framework for strengthening exercises to prevent hamstring injury. Sports Medicine, 48(2): 251–267.
Callesen J, Dalgas U, Brincks J, and Cattaneo D. 2019. How much does balance and muscle strength impact walking in persons with multiple sclerosis?-A cross-sectional study. Multiple Sclerosis and Related Disorders. Elsevier, 29: 137–144.
Cangin C, Harris R, Binkley P, Schwartzbaum J, and Focht B. 2018. Anaerobic muscle strengthening physical activity and depression severity among USA adults. Preventive Medicine Reports, 10: 299–303.
Cuthbert SC, and Goodheart GJ. 2007. On the reliability and validity of manual muscle testing: a literature review. Chiropractic & Osteopathy, 15(1): 4.
Daloia LMT, Leonardi-Figueiredo MM, Martinez EZ, and Mattiello-Sverzut AC. 2018. Isometric muscle strength in children and adolescents using Handheld dynamometry: reliability and normative data for the Brazilian population. Brazilian Journal of Physical Therapy, 22(6): 474–483.
Fisher MI, and Harrington S. 2015. Research round-up : Manual muscle testing research round-up. pp. 1–2.
Foster C, Moore JB, Singletary CR, and Skelton JA. 2018. Physical activity and family-based obesity treatment: A review of expert recommendations on physical activity in youth. Clinical Obesity, 8(1): 68–79.
Francis P, Lyons M, Piasecki M, McPhee J, Hind K, and Jakeman P. 2017. Measurement of muscle health in aging. Biogerontology, Springer Netherlands, 18(6): 901–911.
Habbab RM, and Bhutta ZA. 2020. Prevalence and social determinants of overweight and obesity in adolescents in Saudi Arabia: A systematic review. Clinical Obesity, 10(6): e12400.
Higgins M. 2011. Therapeutic Exercise: From Theory to Practice. F. A. Davis Company.
Kamat PA, Ganesan S, and Tedla JS. 2012. Relationship of lower limb spasticity, strength and gross motor function in children with spastic diplegia: A cross-sectional study. 4(18): 109–122.
Kazemi K, Arab AM, Abdollahi I, López-López D, and Calvo-Lobo C. 2017. Electromiography comparison of distal and proximal lower limb muscle activity patterns during external perturbation in subjects with and without functional ankle instability. Human Movement Science, Elsevier, 55: 211–220.
Kelln BM, McKeon PO, Gontkof LM, and Hertel J. 2008. Hand-Held Dynamometry : Reliability of Lower Extremity Muscle Testing in Healthy, Physically Active, Young Adults Dynamométrie main-main : Fiabilité des tests musculaires des membres inférieurs chez les jeunes adultes en bonne santé, physiquement actifs. Journal of Sport Rehabilitation, 17: 160–170.
Lam LCW, and Riba M. 2016. Physical Exercise Interventions for Mental Health. Cambridge University Press (Cambridge medicine).
Leong DP, Teo KK, Rangarajan S, Kutty VR, Lanas F, and Hui C. 2016. Reference ranges of handgrip strength from 125,462 healthy adults in 21 countries: a prospective urban rural epidemiologic (PURE) study. Journal of Cachexia, Sarcopenia and Muscle, 7(5): 535–546.
Mansuri FA, Al-Zalabani AH, Zalat MM, and Qabshawi RI. 2015. Road safety and road traffic accidents in Saudi Arabia. Saudi Medical Journal, 36(4): 418–424.
McKay MJ, Baldwin JN, Ferreira P, Simic M, Vanicek N, and Burns J. 2017. Normative reference values for strength and flexibility of 1,000 children and adults. Neurology, 88(1): 36–43.
Mentiplay BF, Perraton LG, Bower KJ, Adair B, Pua Y-H, Williams GP, et al. 2015. Assessment of lower limb muscle strength and power using hand-held and fixed dynamometry: A reliability and validity study. PLoS ONE, 10(10): e0140822.
Mijnarends DM, Meijers JMM, Halfens RJG, Borg ST, Luiking YC, Verlaan S, et al. 2013. Validity and reliability of tools to measure muscle mass, strength, and physical performance in community-dwelling older people: A systematic review. Journal of the American Medical Directors Association, Elsevier Ltd, 14(3): 170–178.
Neelly K, Wallmann HW, and Backus C. 2013. Validity of measuring leg length with a tape measure compared to a computed tomography scan. Physiotherapy Theory and Practice, 29(6): 487–492.
Newton, RA. 2001. Validity of the multi-directional reach test: A practical measure for limits of stability in older adults. Journals of Gerontology - Series A Biological Sciences and Medical Sciences, 56(4): 4–9.
Nobuyuki M, Miyachi M, Tabata I, Sakano N, Hirao T, and Numata T. 2012. Relationship between muscle strength and anthropometric, body composition parameters in Japanese adolescents. Health. Scientific Research Publishing, 4(1): 1–5.
Oya Y, Nakamura M, Tabata E, Morizono R, Mori S, Kimuro Y, et al. 2008. Fall risk assessment and knee extensor muscle activity in elderly people. Nihon Ronen Igakkai zasshi. Japanese journal of geriatrics, 45(3): 308–314.
Pasco JA, Stuart AL, Holloway-Kew KL, Tembo MC, Sui SX, Anderson KB, et al. 2020. Lower-limb muscle strength: Normative data from an observational population-based study. BMC Musculoskeletal Disorders, 21(1): 4–11.
Powers SK, Dodd SL, and Noland VJ. 2006. Total fitness and wellness brief edition. Benjamin-Cummings Publishing Company.
Schober P, and Schwarte LA. 2018. Correlation coefficients: Appropriate use and interpretation. Anesthesia and Analgesia, 126(5): 1763–1768.
Soylu Ç, Altundağ E, Akarçeşme C, and Yildirim NU. 2019. The relationship between isokinetic knee flexion and extension muscle strength, jump performance, dynamic balance and injury risk in female volleyball players. Journal of Human Sport and Exercise, 15(3):
Stoll T, Huber E, Seifert B, Michel BA, and Stucki G. 2000. Maximal isometric muscle strength: normative values and gender-specific relation to age. Clinical Rheumatology, 19(2): 105–113.
Tedla, JS, Shenoy UV, Jeganathan PS, Reddy RSY, and Gopalakrishna A. 2012. Normative data for trunk and lower extremity muscle strength by hand held dynamometer for Indian children aged 5-14 years: A cross sectional study. International Journal of Health Sciences & Research, 2(6): 1–19.
Tedla JS, Sangadala DR, Gular K, Reddy RS, Alshahrani MS, Ahmad I, et al. 2021. Normative reference values for functional, lateral, and oblique direction reach tests in Saudi children aged six to 15 years old and psychometric properties of the oblique direction reach test. Nigerian Journal of Clinical Practice, 24: 576–583.
Thomas AC, Villwock M, Wojtys EM, and Palmieri-Smith RM. 2013. Lower extremity muscle strength after anterior cruciate ligament injury and reconstruction. Journal of Athletic Training, 48(5): 610–620.
Wang H, Ji Z, Jiang G, Liu W, and Jiao X. 2016. Correlation among proprioception, muscle strength, and balance. Journal of physical therapy science. The Society of Physical Therapy Science, 28(12): 3468–3472.
World Health Organization. 2014. Adolescents: Health risks and solutions. Fact Sheet No. 345(3): 345.
Information & Authors
Information
Published In
FACETS
Volume 7 • Number 1 • January 2022
Pages: 98 - 109
Editor: Charles Couillard
History
Received: 28 July 2021
Accepted: 22 November 2021
Version of record online: 27 January 2022
Copyright
© 2022 Tedla et al. This work is licensed under a Creative Commons Attribution 4.0 International License (CC BY 4.0), which permits unrestricted use, distribution, and reproduction in any medium, provided the original author(s) and source are credited.
Data Availability Statement
All relevant data are within the paper.
Key Words
Sections
Subjects
Authors
Author Contributions
JST, DRS, and RSR conceived and designed the study.
JST, KG, and VNK performed the experiments/collected the data.
JST, DRS, KG, and PSS analyzed and interpreted the data.
JST, RSR, VNK, and PSS contributed resources.
All drafted or revised the manuscript.
Competing Interests
The authors certify that no conflict of interest exists.
Metrics & Citations
Metrics
Other Metrics
Citations
Cite As
Jaya Shanker Tedla, Devika Rani Sangadala, Ravi Shankar Reddy, Kumar Gular, Venkata Nagaraj Kakaraparthi, and Paul Silvian Samuel. 2022. Lower extremity muscle strength reference values for young Saudi male adults aged 21 to 23 years and their correlation with anthropometric parameters and balance. FACETS.
7(): 98-109. https://doi.org/10.1139/facets-2021-0111
Export Citations
If you have the appropriate software installed, you can download article citation data to the citation manager of your choice. Simply select your manager software from the list below and click Download.
There are no citations for this item