Trapped river otters (Lontra canadensis) from central Saskatchewan differ in total and organic mercury concentrations by sex and geographic location
Abstract
Mercury (Hg) in wildlife remains of great concern, especially for apex piscivores. Despite this, exposure information from many species in many areas is lacking, so that management decisions are hampered. Here we examine Hg concentrations in fur, liver, and kidney tissues from river otters (Lontra canadensis (Schreber, 1777)) (n = 203) to quantify existing Hg concentrations over a broad geographic area in Saskatchewan. Mean fur total Hg (THg) (9.68 ± 7.52 mg/kg fresh weight (f.w.)) was significantly correlated with THg and organic Hg (OHg) in liver and kidney tissue, showcasing the potential for using fur as a noninvasive method of monitoring Hg in top-level mammals. Livers of males had higher mean OHg concentrations than livers of females (males: 2.71 mg/kg d.w., females: 1.87 mg/kg d.w.), but not significantly so. No sex-related differences were observed in kidney OHg concentrations. THg concentrations in otter fur collected in the Boreal Shield ecozone (Churchill River Upland) were significantly higher (mean = 16.1 mg/kg f.w.) than in otter fur collected from the Boreal Plain ecozone (mean = 8.59 mg/kg f.w.). Fur from otters (n = 20; trapping block N66) trapped near a decommissioned smelter contained the highest concentrations of THg in the study (mean = 18.4 mg/kg f.w.).
Introduction
Mercury (Hg) is a naturally occurring element that is transferred from lithospheric reservoirs to aquatic and terrestrial systems primarily by anthropogenic processes (Driscoll et al. 2013). Atmospheric inorganic Hg (Hg(II)) enters aquatic systems via wet and dry deposition and can be converted into methylmercury (MeHg; a form of organic Hg (OHg)) predominantly by anaerobic microorganisms in sediments and wetlands, resulting in the bioaccumulation of MeHg in food webs (Compeau and Bartha 1985; Fleming et al. 2006; Hamelin et al. 2011; Yu et al. 2013). This is of particular concern because MeHg is a developmental neurotoxicant in wildlife (Basu and Head 2010). Neurologic impacts related to MeHg poisoning include lethargy, anorexia, impairment of sensory and motor skills, convulsions, and even death (Scheuhammer et al. 2007; Basu and Head 2010).
Otters (Lontra canadensis (Schreber, 1777)) are aquatic mammals whose diet consists mostly of fish (Gilbert and Nancekivell 1982; Reid et al. 1994). Due to biomagnification, otters may be exposed to greater concentrations of Hg than species feeding at lower trophic levels or those foraging on terrestrial prey. This, along with their wide distribution, makes otters ideal for studying Hg variation and impacts, both individually and at the landscape level (Kucera 1983; Mierle et al. 2000; Fortin et al. 2001; Yates et al. 2005; Strom 2008; Stansley et al. 2010; Spencer et al. 2011). Moreover, there are studies showing adverse biochemical and organismal effects, and potentially population-level impacts on otters related to MeHg exposure (Wren 1991; Basu et al. 2005; Sleeman et al. 2010).
The primary purpose of this study was to assess Hg accumulation in otters collected in central Saskatchewan, Canada (52°N to 56°N). First, we examined the relationship between total Hg (THg) concentrations in fur and OHg concentrations in the liver and kidney. THg concentration in the fur can be highly correlated with internal organ concentrations (liver, kidney, muscle, and brain) for both THg and OHg (Evans et al. 1998; Mierle et al. 2000; Strom 2008). Measuring THg in fur is a cost-effective (i.e., requiring less sample preparation than tissue) and noninvasive way to gauge exposure that creates more opportunities to monitor Hg across larger spatial areas without influencing otter populations.
Our second objective was to investigate whether sex and age influenced variation in fur THg concentrations and liver and kidney OHg concentrations. Sex and age have been associated with varying Hg concentrations in otters (Mierle et al. 2000), and yet the influence of these variables is not fully understood. Most studies report little difference in THg concentrations between males and females (Mierle et al. 2000; Fortin et al. 2001; Yates et al. 2005; Strom 2008; Stansley et al. 2010), but other studies report higher values in males (Kucera 1983) or females (Klenavic et al. 2008). Yates et al. (2005) observed higher mean THg concentrations in adult otters than in juveniles, whereas Mierle et al. (2000) found that THg in fur changed with age in a nonlinear manner. Other studies failed to document any relationship with age (Fortin et al. 2001; Strom 2008). It should be noted that these studies examined sex and age effects on THg concentration only and did not examine the relationships with forms of OHg.
Lastly, we examined whether variation in THg concentrations in otter fur can be related to geography, which has been associated with Hg bioaccumulation in otters (Mierle et al. 2000; Fortin et al. 2001; Yates et al. 2005). Proximity to anthropogenic point sources of Hg (i.e., industrial centers) and ecosystems with high rates of methylation (i.e., reservoirs, wetlands) are critical variables; however, underlying geology may also be important (Driscoll et al. 2013). These factors influence rates of regional deposition of Hg, as well as methylation of Hg(II) into the more toxic MeHg.
Methods
Study area
Two hundred and three otter carcasses were collected from two ecozones (Boreal Shield and Boreal Plain) in Saskatchewan, Canada (52°N to 56°N), during the 2011/2012 and 2012/2013 trapping seasons. The Boreal Shield, the largest ecozone in Canada, covering approximately one third of Saskatchewan (18.7 million ha) (Acton et al. 1998), contains the Churchill River Upland and Athabasca Plain, two topographically and geologically distinct ecoregions. All carcasses collected in the Boreal Shield (n = 33) were from the more southern Churchill River Upland ecoregion, which is the largest ecoregion in the province (occupying 17% of Saskatchewan’s total area), and is sparsely covered with glacial drift and bedrock outcrops (Acton et al. 1998). The subarctic climate in this region is characterized by long, very cold winters and short, cool summers. Precipitation is low and variable and tends to decrease from south to north. The mean annual temperature (1981–2010) was 0.2 °C, and the mean annual precipitation was 486.2 mm, approximately 30% of which fell as snow (Environment and Climate Change Canada 2017).
The remaining 170 otter carcasses were collected from the more southern Boreal Plain ecozone, which encompasses the Mid-Boreal Lowland, Mid-Boreal Upland, and Boreal Transition ecoregions, covering more than 27% of Saskatchewan’s land mass (approximately 17 million ha) (Acton et al. 1998). The mean annual temperature (1981–2010) was 1.0 °C, and the mean annual precipitation was 457.7 mm, approximately 25% of which fell as snow (Environment and Climate Change Canada 2017).
The phasing out of Hg in commercial products and the placement of emission controls on coal-fired utilities have resulted in a general global decline in anthropogenic Hg emissions and, therefore, decreased atmospheric Hg in North America (Zhang et al. 2016). However, locations with elevated Hg concentrations from historical point sources still exist within the study area. From 1931 to 2010, Hudson Bay Mining and Smelting (now Hudbay Minerals) operated a total of 15 base metal mines and a copper–zinc smelter in and around the area of Flin Flon, Manitoba, situated immediately across the eastern Saskatchewan border from trapping block N66 (54.77°N, −101.88°W). While in operation, this smelter was the single largest source of atmospheric Hg emissions in Canada (Outridge et al. 2011). Distinct differences were observed in Hg stable isotopes (δ202) between pre- and post-1930 sediments, associated with periods before and after smelting operations commenced, suggesting that emissions from the smelter were the predominant Hg source in this area (Ma et al. 2013). The smelting operation was decommissioned in 2010 (Hudbay Minerals 2017).
Sample collection and processing
During the 2011/2012 and 2012/2013 trapping seasons, licensed trappers from 26 trapping blocks (Fig. 1) submitted 203 skinned and frozen otter carcasses to the Saskatchewan Ministry of Environment field offices. Carcasses were thawed for 24 h at 20 °C and each individual’s intact liver and one kidney were removed using a sterile scalpel. Each organ was placed into a separate polyethylene bag. Fur was removed from the dorsal surface of a front paw (if front paws were missing fur, fur was taken from a back paw instead) using a sterile scalpel and placed in wax paper and a polyethylene bag. Organs and fur were stored at −20 °C until analyses could be conducted. A lower canine tooth was extracted using a stainless steel dental elevator to gently pry the tooth from the jaw bone. Fur was not collected from four otters due to the removal of all feet by the trapper during skinning. In addition, three livers and two kidneys were not removed as a result of extensive decomposition of the carcass.
Fig. 1.
Variation of Hg in pelts
For all otter carcasses, trappers had previously removed the pelt as part of their normal trapping operations. Due to different pelting techniques, it was not always possible to sample fur from the same paw for each individual. To determine whether this resulted in variation in the interpretation of our results, we sampled multiple locations on a single completely intact otter carcass. Three repeat samples were collected from the dorsal surface of all paws, the dorsal base of the skull, the middle dorsal surface, and the middle ventral surface and were analyzed as described below. Mean THg concentrations at the eight sampled locations differed (F7,16 = 23.9, p < 0.01); however, THg concentrations in the fur from the four paw locations were not significantly different (F3,8 = 1.0, p = 0.45; Fig. S1); thus, fur collected from any single paw was an appropriate sampling method.
Organ subsampling
A preliminary tissue distribution study was conducted on one liver and one kidney from a randomly selected individual to determine whether THg concentrations were variably distributed throughout these organs. Organs were allowed to thaw at 4 °C until the tissue became pliable. Subsamples were taken from 13 locations on the liver and four locations on the kidney. THg concentrations varied from 2.72 to 12.8 mg/kg dry weight (d.w.) in the liver and from 8.71 to 11.1 mg/kg d.w. in the kidney (Table S1). The final locations of the subsamples for analysis of each liver and kidney were chosen based on these results (Fig. S2). For final analysis, approximately 2 g wet weight was taken from each of the chosen tissue locations (four subsamples from each liver and two subsamples from each kidney), combined into a single composite sample for each organ, and analyzed as described below (Liber et al. 2013).
Tissue homogenization
Liver tissue subsamples were transferred directly into single-use 7 mL polypropylene co-polymer tubes containing 35–40, 2.8 mm zirconium oxide beads (Bertin Technologies, Montigny-le-Bretonneux, France) and homogenized with 2 mL plasma grade water (Thermo Fisher Scientific Inc., Waltham, Massachusetts, USA) using a Minilys personal tissue homogenizer (Bertin Technologies). Two 30 s cycles at 5000 rpm resulted in a relatively smooth, even consistency of tissue homogenate (Liber et al. 2013). Kidney tissue samples were transferred directly into acid-washed, disposable 60 mL borosilicate glass culture tubes. Samples were homogenized in 5 mL of plasma grade water (Thermo Fisher Scientific Inc.) using a handheld tissue homogenizer (Tissue-Tearor™, Biospec Products Inc., Bartlesville, Oklahoma, USA) set at 15 000 rpm for 40 s, followed by a quick pulse at 18 000 rpm. Liquefied samples for both tissues were poured into polypropylene snap cap vials and placed into a drying oven maintained at 65 °C for 5 d or until the samples were completely dry. Previous studies have reported the fresh weight of tissue, out of concern for loss of volatile Hg species during drying. However, Evans et al. (2000) compared Hg concentrations in both fresh and dried subsamples of liver and kidney tissue, and found no significant difference.
THg and OHg analysis
THg was measured in fur, liver, and kidney samples, whereas OHg was measured in only liver and kidney samples (Table S2). Samples for THg analysis were measured directly from the dried sample without further treatment, whereas samples for OHg were first treated with Tris–HCl buffer (with sequential additions of protease, NaOH, cysteine, CuSO4, and acidic NaBr) followed by extraction with toluene and Na2S2O3 (Nam and Basu 2011). Only THg was measured in fur because the majority of Hg in the fur or hair is believed to be OHg (Evans et al. 2000). THg and OHg concentrations were measured in the liver and kidney because these organs appear to demethylate OHg resulting in variable proportions of Hg(II) and OHg (Scheuhammer et al. 2007; Eagles-Smith et al. 2009). THg and OHg concentrations were measured by thermal decomposition, amalgamation, and atomic absorption spectrophotometry (EPA method 7473; US EPA 2007) in a direct mercury analyzer (direct mercury analyzer (DMA)-80, Milestone Inc., Shelton, Connecticut, USA) based on methods detailed elsewhere (Nam and Basu 2011; Nam et al. 2011). Blanks and Standard Reference Materials (SRMs; DOLT-4, Dogfish Liver; National Research Council of Canada) were measured in 10% of the number of samples. The accuracy (% of SRM) for 2011/2012 and 2012/2013 was 98.0% ± 5.8% and 103.4% ± 4.8%, respectively. Replicate measures (% of relative standard deviation) were 3.6% ± 4.6% and 2.9% ± 2.1% for the 2011/2012 and 2012/2013 trapping seasons, respectively.
Age determination
Individual age was determined by counting cementum annuli (darkly stained rings formed in the cementum of teeth during winter months contrasted with lightly stained cementum formed during the growth seasons of spring and summer) and subsequent analysis used a standardized cementum aging model (Matson’s Laboratory LLC., Manhattan, Montana, USA). A cementum age analysis is both species-specific and based on a standardized tooth type; technicians from Matson’s Laboratory aged all river otter teeth from this study.
Data analysis
All analyses were performed using STATISTICA version 12.5 (StatSoft, Inc. 2014). Hg concentrations in otter tissue were skewed, with many small values and a few large ones. For this reason, data were log10 transformed to improve normality for satisfaction of parametric statistics. Data were also separated into sexually immature and sexually mature classes to determine whether physiological changes that occur during sexual maturity might affect Hg concentrations in the fur, liver, and kidney. Two-way analysis of variance (ANOVA) was used to test for the effects of sex and maturity class. Both male and female otters become sexually mature at 2 years of age; therefore, the young-of-the-year (<1 years old) and 1-year-old classes were considered “immature” and classes ≥2 years old were considered “mature”. If differences were significant, Tukey’s honest significant difference (HSD) test for unequal sample sizes was used to determine where those differences occurred (Zar 2010). THg and OHg concentrations were assessed in terms of age (years) between males and females using one-way ANOVA. To improve sample size in the later year classes, otters ≥7 years of age were combined; however, older age classes still suffered from reduced sample sizes and any inferences made with respect to age should be made with caution. Parametric correlations between concentrations of THg in fur and concentrations of THg and OHg in liver and kidney were performed. A nonparametric Spearman’s rank-order correlation was used to test for a relationship between the amount of THg and the amount of THg in the organic form (%OHg) in male and female livers. A Wilcoxon matched pairs test was used to test %OHg differences between the liver and kidney within individuals. To determine which of the measured dependent variables best discriminates between the ecoregions, a discriminant function analysis was performed. It indicated that THg concentration in fur was well suited for assessing regional differences. Trapping blocks were grouped by the ecoregion in which they were caught. ANOVA determined whether differences occurred among the ecoregions. Results from animals collected in trapping blocks within the Churchill River Upland ecoregion were further separated into two groups to examine legacy inputs of Hg from the Hudson Bay copper–zinc smelter. Tukey’s HSD for unequal sample sizes was used to determine where differences occurred among the groups.
Results
Age and sex differences
Fur
THg
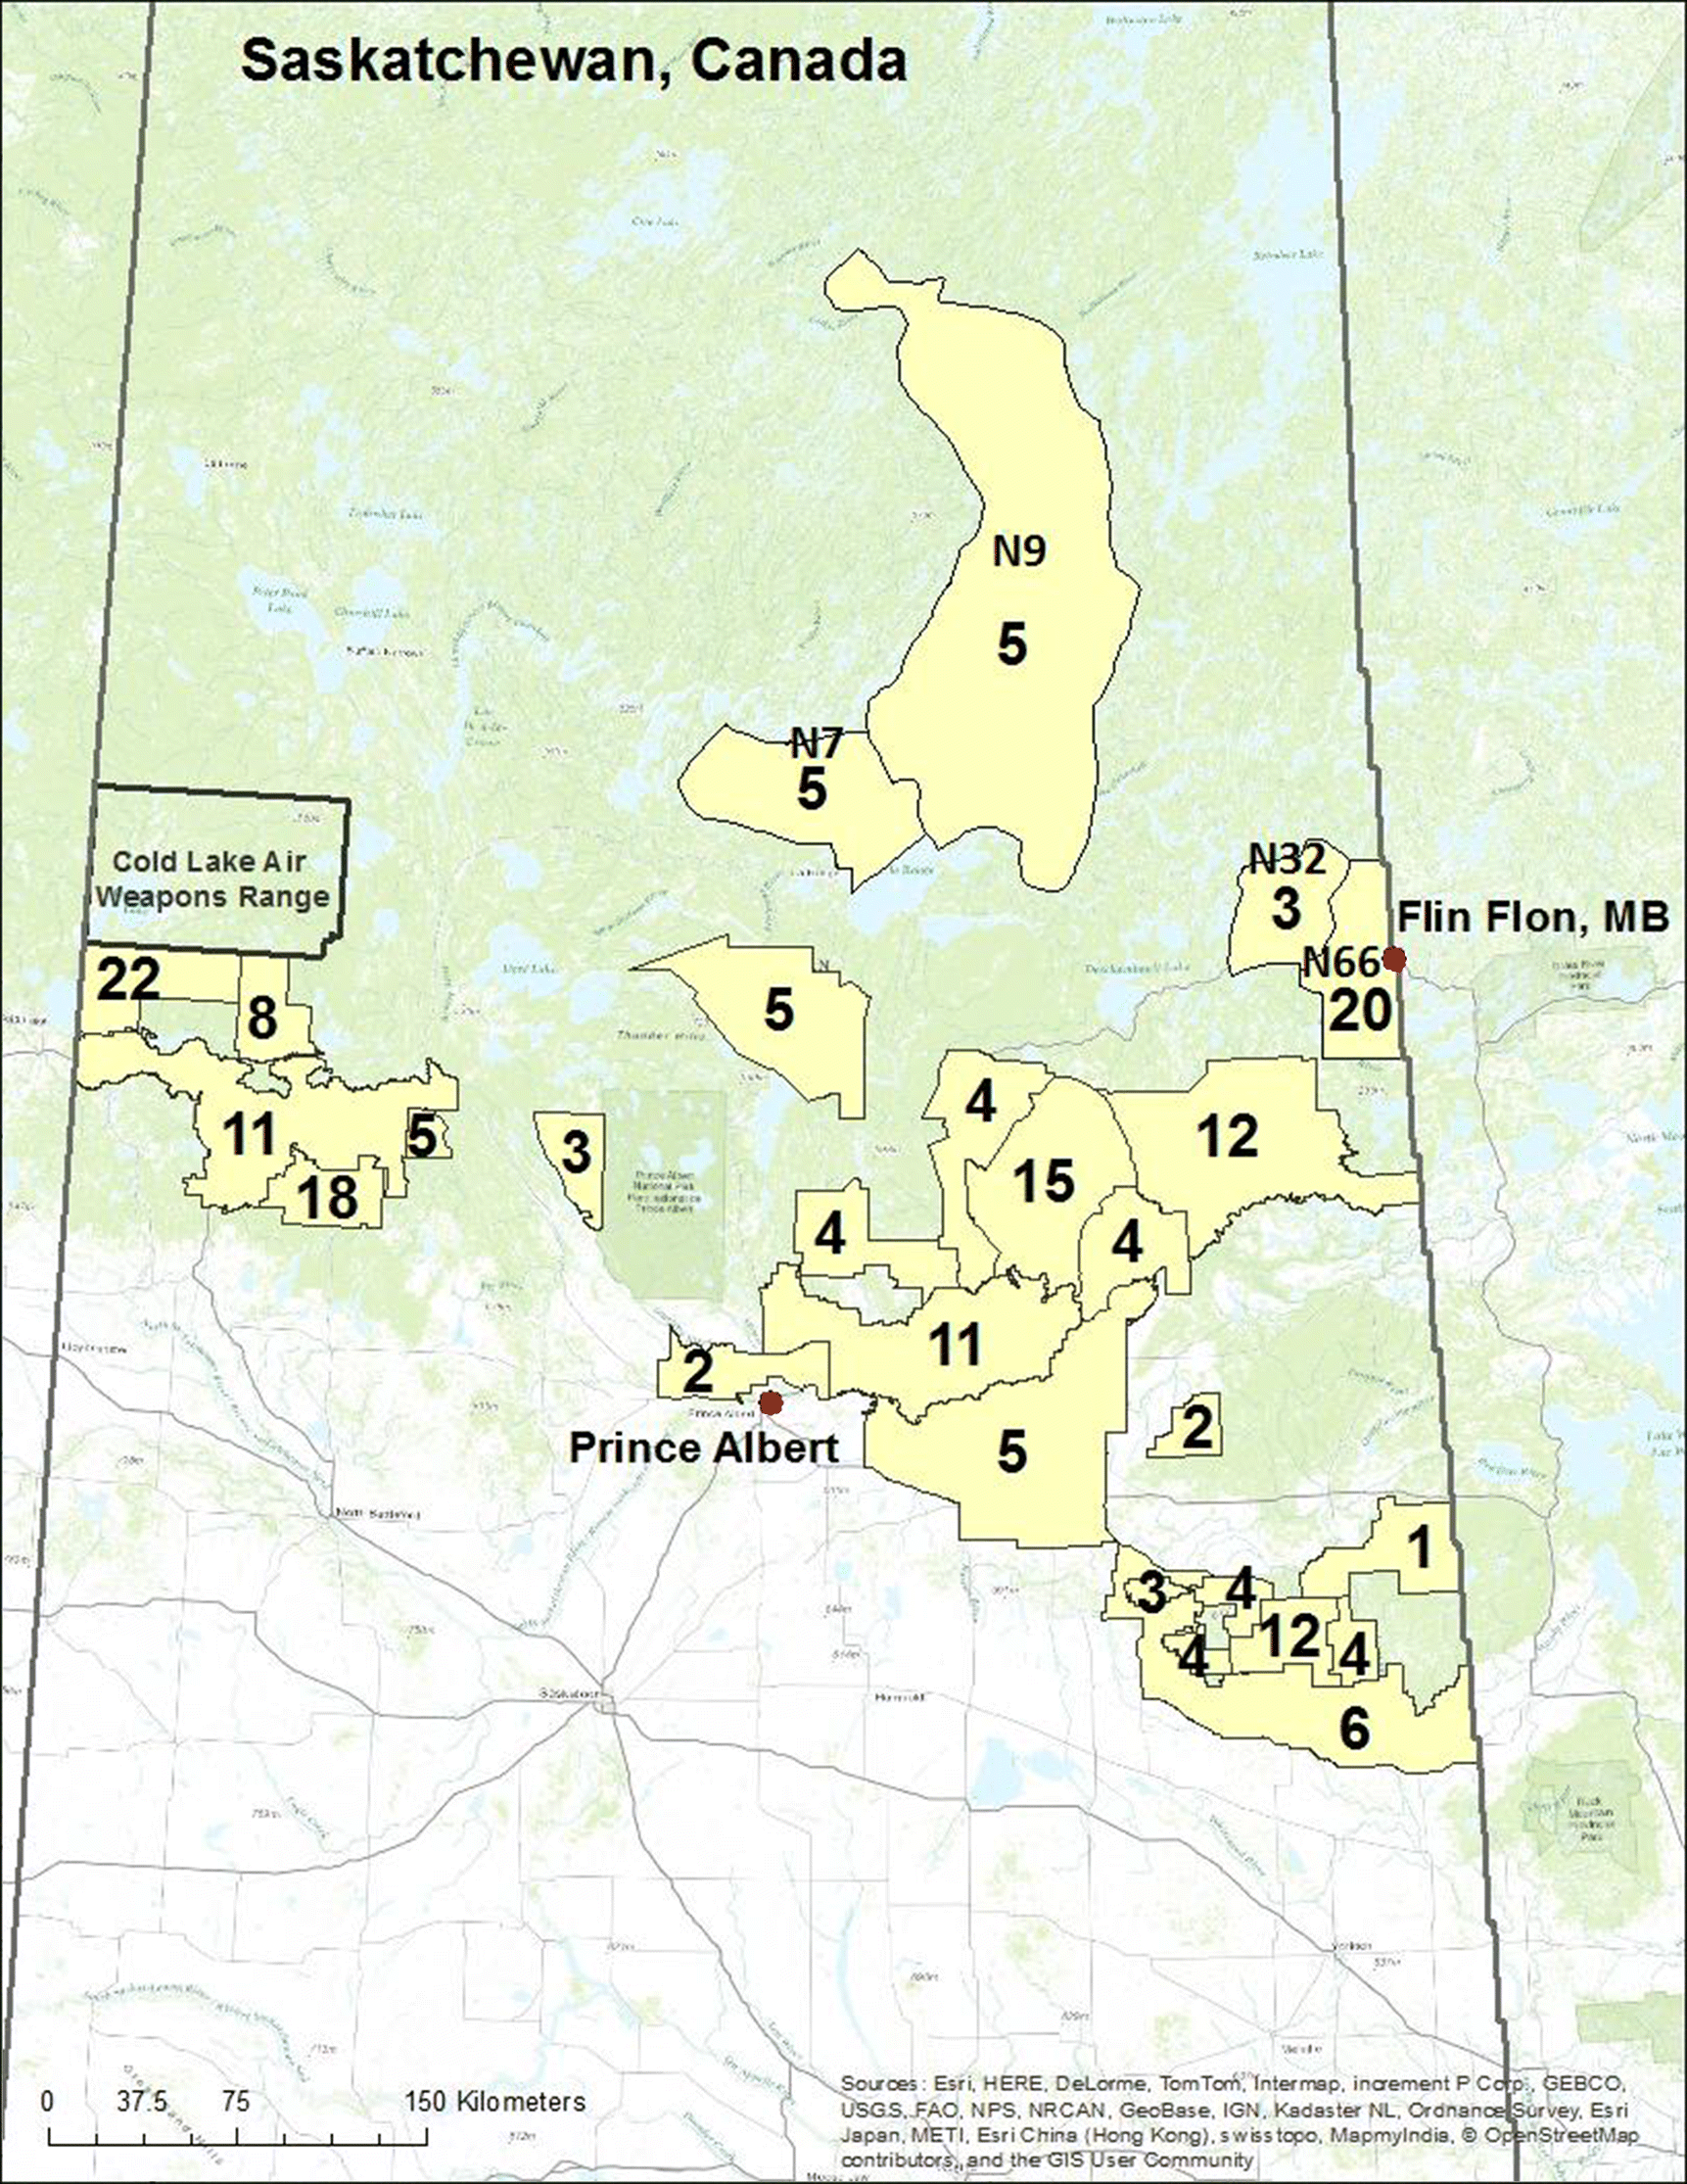
A significant proportion of the variance in THg concentration in the fur was explained by the main effect of maturity class (Fig. 2A; Table 1). No relationship between age or sex and THg in the fur was observed in males (Fig. 3A) or females (Fig. 3B). Post hoc analysis (Tukey’s HSD test for unequal sample sizes) revealed significantly higher THg concentrations in the fur of mature males than that of immature females. Mature females also contained higher THg concentrations in fur, but not significantly so. It should be noted that the mature female class contained the smallest sample size (n = 27). The interaction between sex and maturity class was also not significant. THg in the fur was significantly correlated with both THg and OHg in the liver and kidney (Table 1).
Fig. 2.
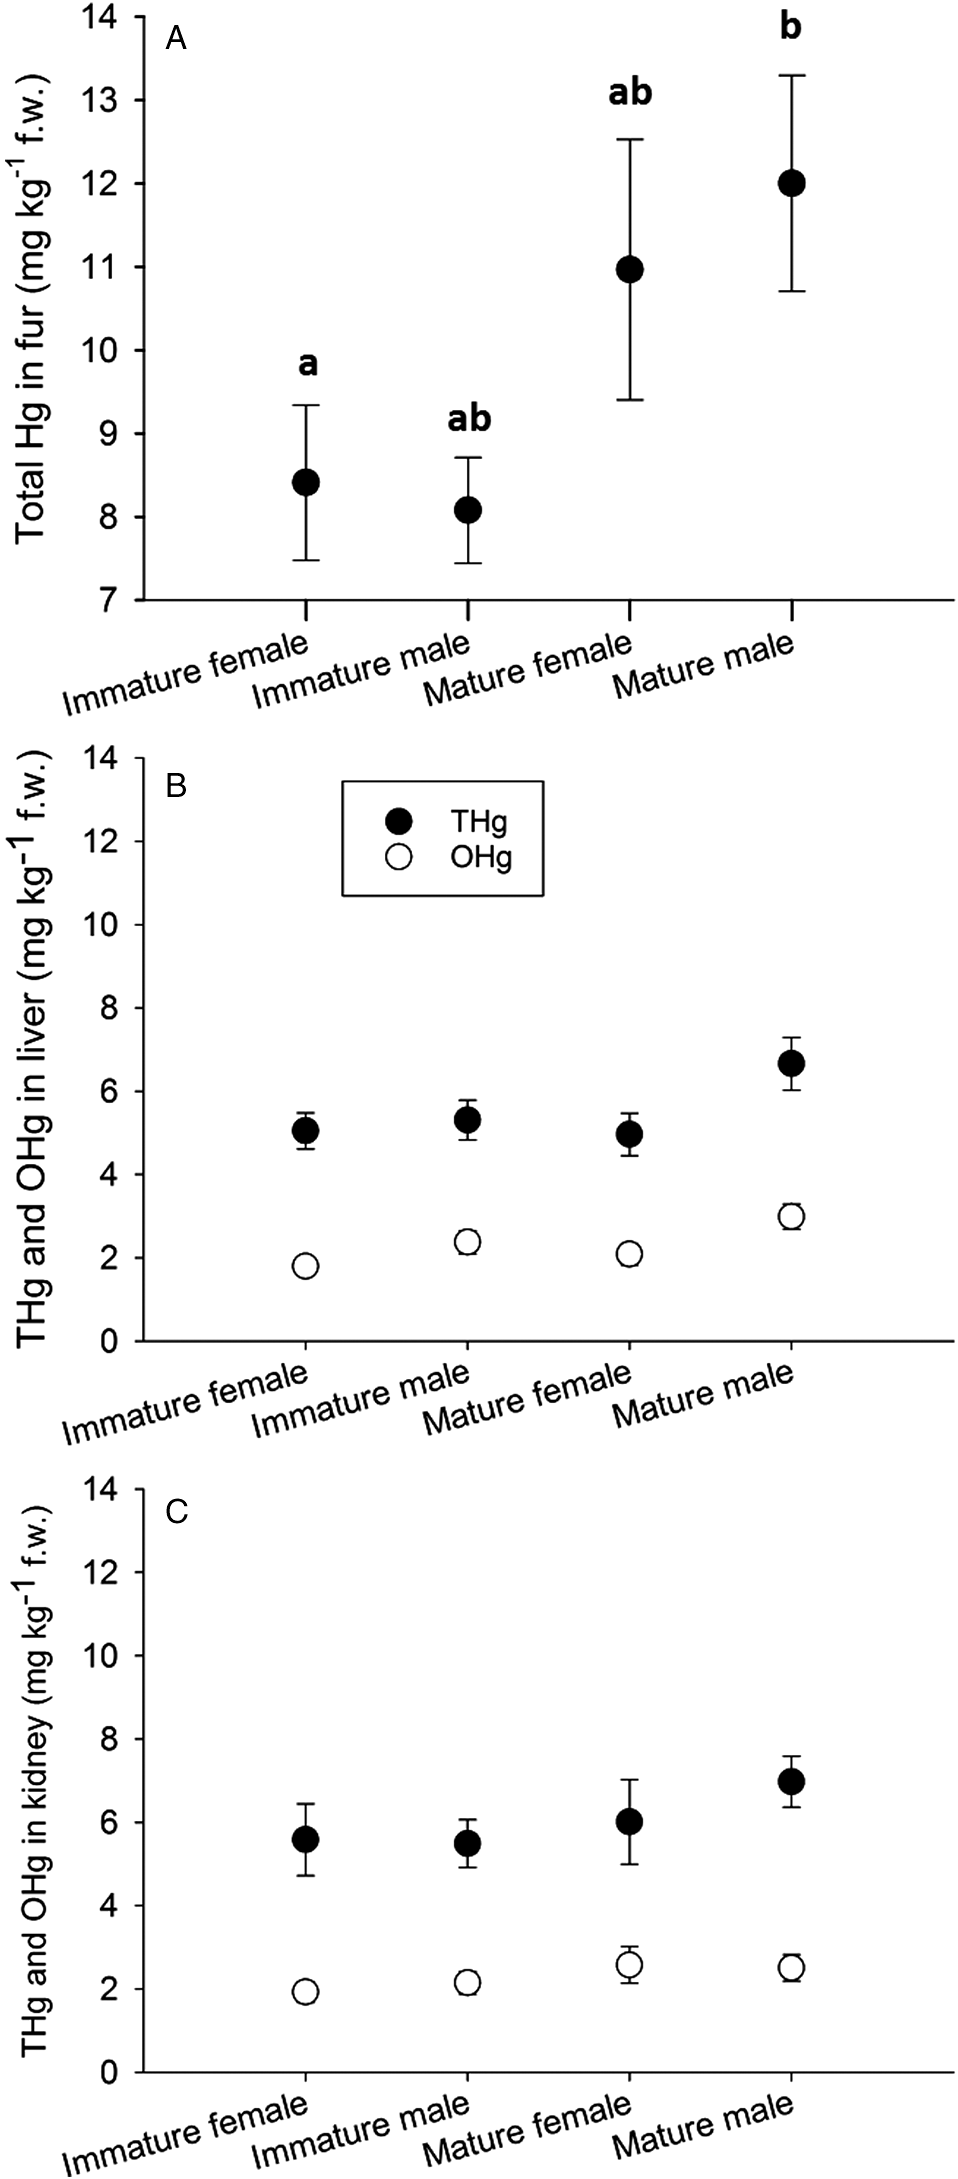
Fig. 3.
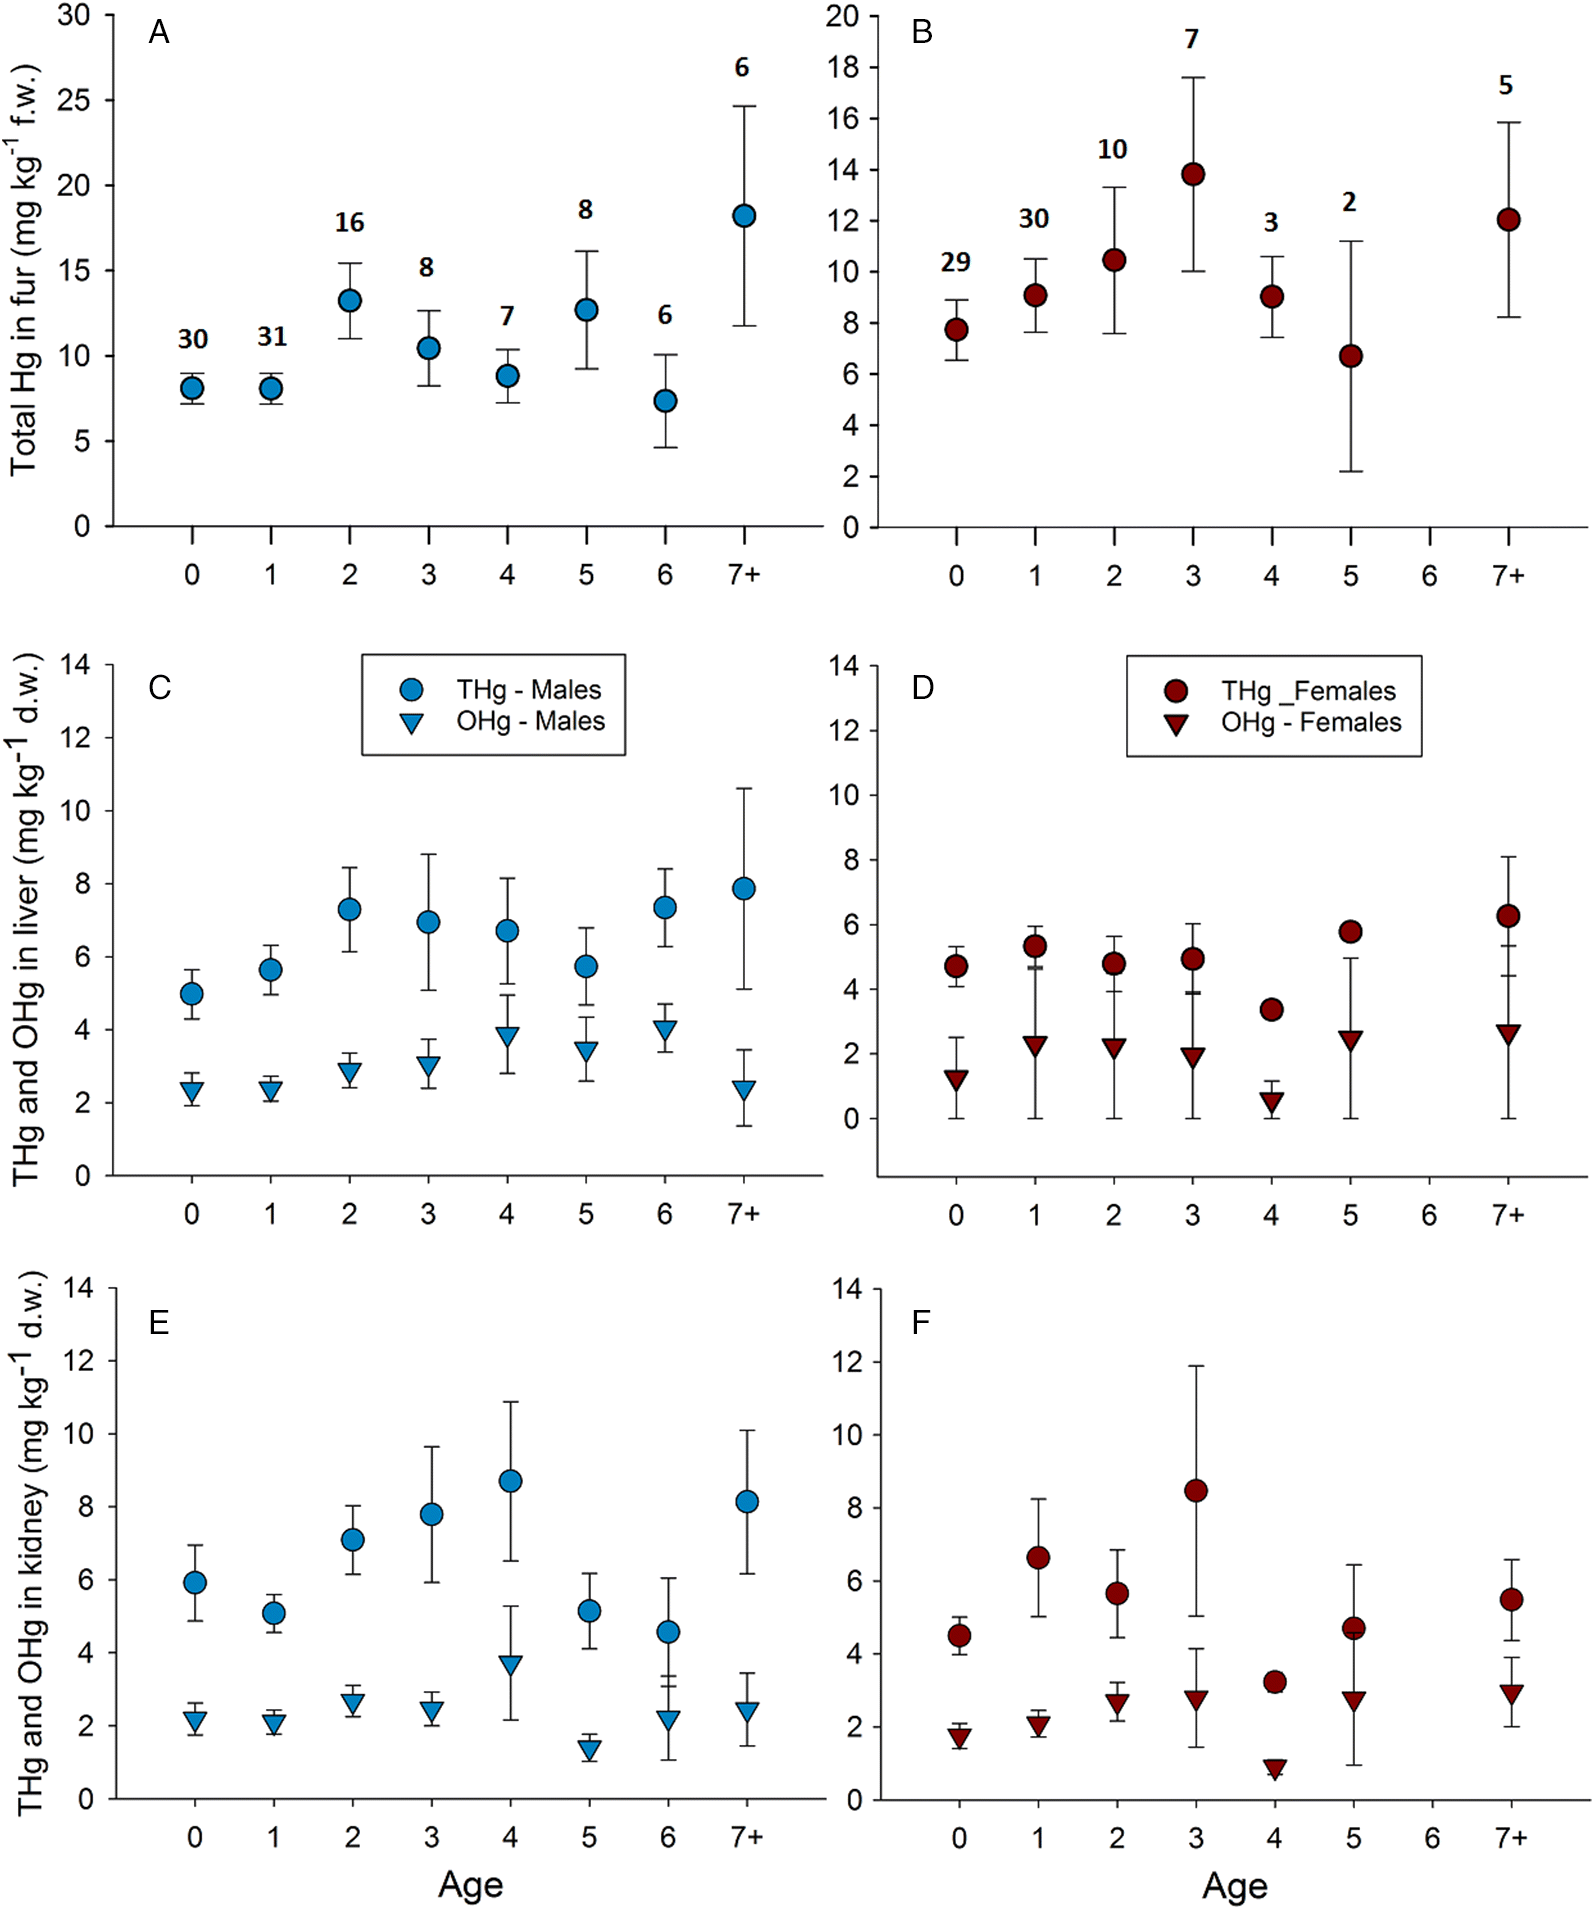
Table 1.
| Relationship tested | Significant | Test results | Figure | |
|---|---|---|---|---|
| THg concentrations in fur | Age (males) | No | F7,102 = 1.46, p = 0.189 | Fig. 3A |
| Age (females) | No | F6,77 = 0.93, p = 0.482 | Fig. 3B | |
| Sex | No | F1,190 = 0.30, p = 0.584 | — | |
| Maturity class | Yes | F1,190 = 9.84, p = 0.002 | Fig. 2A | |
| Interaction effect of maturity and sex | No | F1,190 = 0.03, p = 0.874 | — | |
| THg concentrations in liver | Age (males) | No | F7,101 = 1.01, p = 0.431 | Fig. 3C |
| Age (females) | No | F6,76 = 0.94, p = 0.473 | Fig. 3D | |
| Sex | No | F1,188 = 0.65, p = 0.423 | — | |
| Maturity class | Yes | F1,188 = 4.09, p = 0.044 | Fig. 2B | |
| Interaction effect of maturity and sex | No | F1,188 = 0.15, p = 0.700 | — | |
| OHg concentrations in liver | Age (males) | No | F7,103 = 0.83, p = 0.567 | Fig. 3C |
| Age (females) | Yes | F8,75 = 2.47, p = 0.031 | Fig. 3D | |
| Sex | No | F1,191 = 3.26, p = 0.072 | — | |
| Maturity class | No | F1,191 = 3.26, p = 0.072 | Fig. 2B | |
| Interaction effect of maturity and sex | No | F1,191 = 0.15, p = 0.695 | — | |
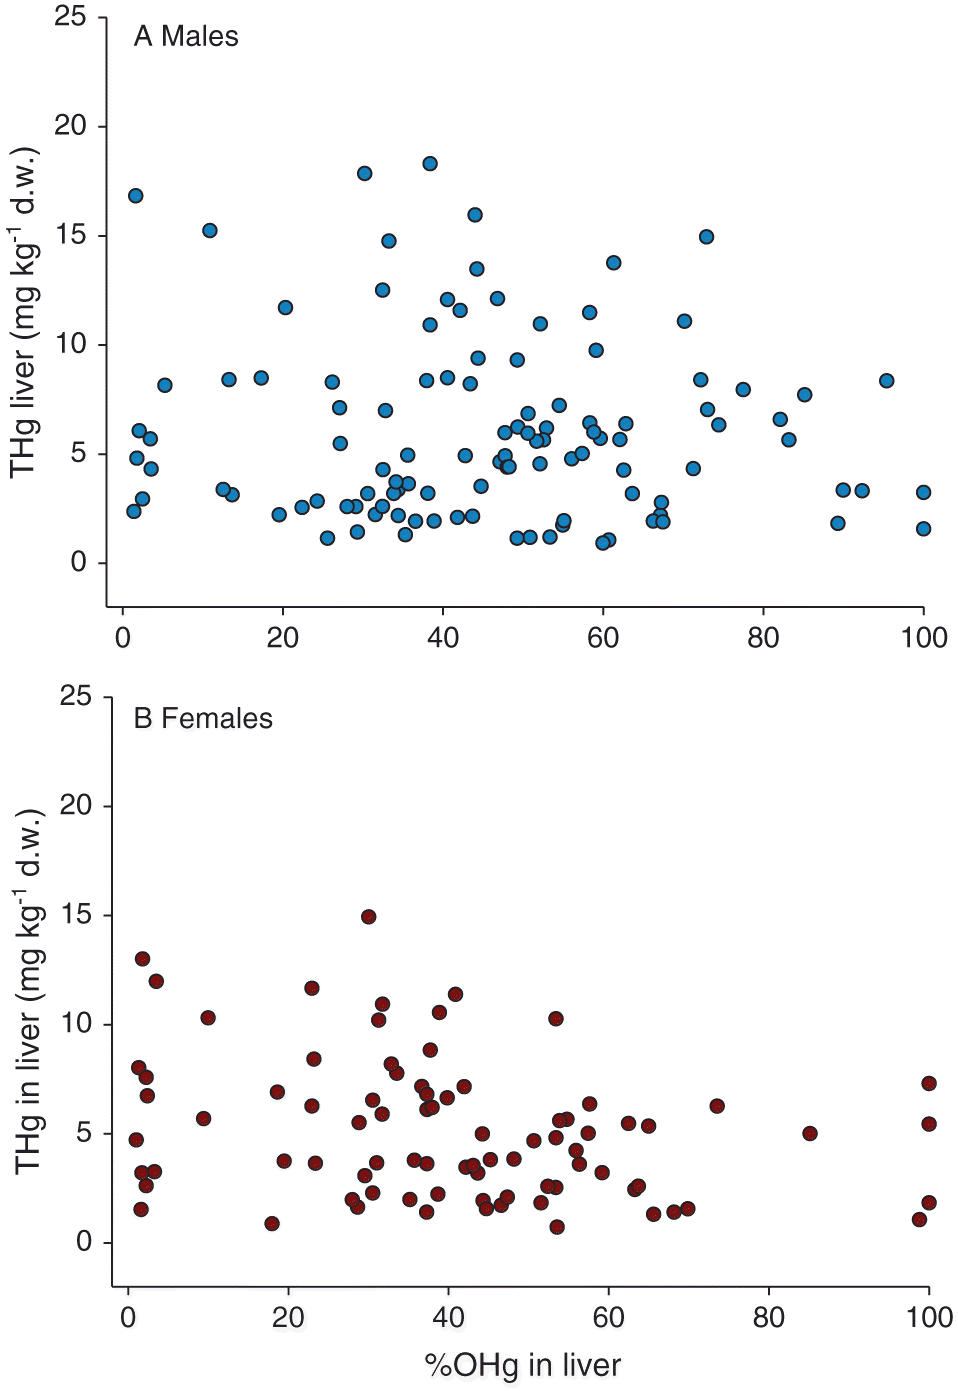
| %OHg (males) | No | rs = −0.02, n = 111, p = 0.841 | Fig. 4A | |
| %OHg (females) | Yes | rs = −0.30, n = 84, p = 0.006 | Fig. 4B | |
| THg concentrations in kidney | Age (males) | No | F7,103 = 1.51, p = 0.174 | Fig. 2E |
| Age (females) | No | F6,77 = 0.55, p = 0.770 | Fig. 2F | |
| Sex | No | F1,191 = 0.95, p = 0.332 | — | |
| Maturity class | Yes | F1,191 = 4.50, p = 0.035 | Fig. 2C | |
| Interaction effect of maturity and sex | No | F1,191 = 0.59, p = 0.443 | — | |
| OHg concentrations in kidney | Age (males) | No | F7,104 = 0.60, p = 0.753 | Fig. 3E |
| Age (females) | No | F6,77 = 0.87, p = 0.520 | Fig. 3F | |
| Sex | No | F1,192 = 0.05, p = 0.818 | — | |
| Maturity class | No | F1,192 = 3.15, p = 0.077 | Fig. 2C | |
| Interaction effect of maturity and sex | No | F1,192 = 0.30, p = 0.582 | — | |
| %OHg (males) | No | rs = −0.03, n = 113, p = 0.760 | — | |
| %OHg (females) | No | rs = 0.01, n = 85, p = 0.900 | — | |
Liver and kidney
THg
OHg
ANOVA results suggest that only age class (0–7+) explained a significant proportion of the variance in mean OHg in the liver of females (but not in males) (Fig. 3D), but the results of the post hoc analyses were not significant. THg concentration in the liver was negatively correlated with %OHg for females (Fig. 4B), but not for males (Fig. 4A; Table 2). OHg concentrations in the kidneys of males (Fig. 3E) and females (Fig. 3F) showed no relationship with age, %OHg, sex, or maturity class (Fig. 2C).
Table 2.
| Variable | THg fur | THg liver | OHg liver | THg kidney | OHg kidney |
|---|---|---|---|---|---|
| THg fur | 1 | 0.734 | 0.395 | 0.685 | 0.439 |
| THg liver | — | 1 | 0.510 | 0.816 | 0.472 |
| OHg liver | — | — | 1 | 0.431 | 0.453 |
| THg kidney | — | — | — | 1 | 0.575 |
| OHg kidney | — | — | — | — | 1 |
Note: All p-values were <0.01; n = 192.
Fig. 4.
Geographic variability
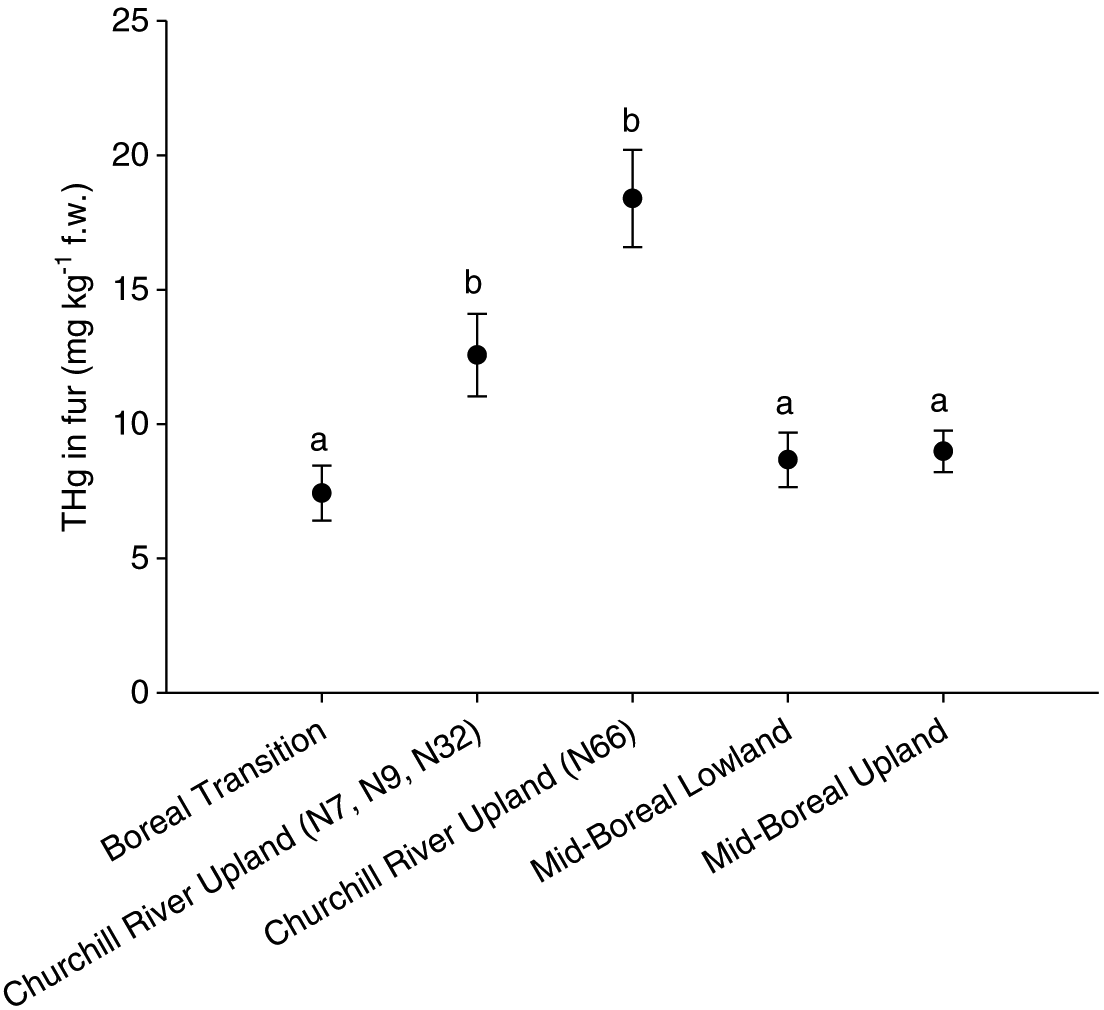
THg concentrations in fur and kidney were both effective at predicting geographic category membership in the discriminant function analysis (i.e., ecoregion) (F3,178 = 5.7, p < 0.01; F3,178 = 4.1, p < 0.01, respectively). THg concentration in fur was the variable chosen to examine geographic variability and revealed that THg concentrations in the fur of otters collected in the Churchill River Upland were significantly higher (F3,189 = 11.6, p < 0.01; Fig. 5) than THg concentrations in the fur of otters collected from all other ecoregions. Local inputs of Hg from the now decommissioned copper–zinc smelter located immediately adjacent to the trapping block N66 likely contributed to this difference among the ecoregions. Therefore, data from otters captured in the trapping block closest to the smelter (N66) were separated from the remaining trapping blocks and the ANOVA was repeated. Concentrations of THg in fur from otters captured within the Churchill River Upland remained significantly higher than in fur from otters captured in the remaining ecoregions (F3,169 = 3.3, p = 0.02). THg concentrations in fur from otters captured in the trapping block closest to the smelter (N66) were higher than in those captured in the other three trapping blocks within the Churchill River Upland ecoregion, but not significantly so (Fig. 5).
Fig. 5.
Discussion
Hg concentrations in tissues
Fur contained the highest THg concentrations of all tissues sampled, which suggests that the fur is a site of storage of Hg translocated from internal tissues. Other studies have found that the majority of Hg in fur/hair is OHg, highlighting the importance of fur as a receptacle of OHg from the body (Wolfe et al. 1998; Evans et al. 2000). THg concentrations in fur, liver, and kidney in otters collected from central Saskatchewan were comparable with concentrations in otters from unimpacted areas within Canada (Kucera 1983; Evans et al. 1998, 2000; Mierle et al. 2000; Klenavic et al. 2008; Spencer et al. 2011).
Age and sex differences
Of all the relationships examined, only OHg concentration in the liver of females was significantly related to age; however, a distinct trend was not obvious. This is consistent with literature reporting no consensus on relationships between age and Hg levels in otters. Mierle et al. (2000) and Yates et al. (2005) observed that Hg levels in otters varied with age; however, other studies have failed to document this relationship (Wren et al. 1986; Fortin et al. 2001; Strom 2008). Although a significant relationship between Hg and age was observed in OHg concentrations from female livers in our study, a trend was not obvious. Otters collected ranged in age from <1 to 9 years, with the young-of-the-year (<1) and 1-year-old otters constituting 61% of the total sample size. Therefore, any perceived relationship between Hg and age should be made with caution due to smaller sample sizes within the older age classes.
We observed no overall differences in males versus females in THg or OHg concentrations in fur, livers, or kidneys, contrasting Yates et al.’s (2005) study showing tissue-specific sex differences. However, when sex was further categorized into sexually immature and mature individuals, a relationship did emerge. Mature otters had more THg in their fur, livers, and kidneys than immature otters. The transition from immaturity to sexual maturity could affect how otters process and store Hg. Categorizing otters into sexually mature and immature individuals to address potential hormonal changes that occur during transition into reproductive age has not been attempted previously. Because Hg bioaccumulates, it is not surprising that the Hg concentrations in mature otters would be higher than in immature otters. However, a trend of increasing Hg concentration with age was not observed, corroborating findings from other studies (Wren et al. 1986; Fortin et al. 2001; Strom 2008). Thus, these elevated THg concentrations in all tissues examined from mature otters compared with immature otters requires additional consideration.
The negative correlation between THg concentrations and %OHg in livers from females and not males suggests different processing methods between the sexes. The liver is an organ in which demethylation of OHg to Hg(II) occurs (Evans et al. 2000; Scheuhammer et al. 2007; Eagles-Smith et al. 2009); lower %OHg in female livers may indicate that females are more efficient at demethylating OHg than males. This negative relationship between THg and %OHg was observed for both male and female otters from Wisconsin (Strom 2008), and mink (Mustela vison) in the lower Great Lakes region of Ontario, Canada (Martin et al. 2011), and the Yukon, Canada (Gamberg et al. 2005). To our knowledge this study is the first to report this relationship in a single sex, highlighting the importance of considering sex when examining OHg concentration in the liver. No correlation was observed between THg concentration and %OHg in the kidney in either males or females, indicating that if demethylation of OHg is occurring in the kidney it is not influenced by THg concentration. Additional study into the exact physiological differences in liver function between males and females may therefore be warranted.
Geographic variation in Hg levels
Of the three tissues analyzed in our study, fur was chosen to address geographic variation of Hg at the landscape level. THg concentration in fur was highly correlated with THg and OHg concentrations in liver and kidney tissues. Other studies have shown similar trends in muscle (Strom 2008) and brain (Mierle et al. 2000) tissue. In addition, THg in fur has been used to a greater extent than kidney Hg concentration when examining locational differences in other studies throughout North America (Mierle et al. 2000; Yates et al. 2005; Klenavic et al. 2008; Spencer et al. 2011). Using THg in fur was the preferred method for examining geographic differences and is a noninvasive, inexpensive way to monitor Hg over large geographic areas.
Elevated THg concentrations in fur observed in otters captured within the Churchill River Upland ecoregion could be at least partly due to anthropogenic emissions of Hg(II) from the smelter. Comparison of Hg concentrations in sediment cores in that area indicates a substantial decrease in Hg concentration with increasing distance from the smelter (Ma et al. 2013). Legacy atmospheric deposition of Hg(II) from the smelter is the most logical explanation for the elevated THg concentrations in the fur from otters found closest to the smelter, although intrinsic factors that influence OHg production (e.g., pH, dissolved organic carbon quality and concentration) may also be important.
Conclusion
For the first time in Saskatchewan, river otters were used to investigate THg and OHg concentrations across the central portion of the province to gain insight into the potential ecological impact of Hg contamination. THg concentrations in fur, liver, and kidney were higher in sexually mature otters than in sexually immature otters; the mechanisms controlling this difference (e.g., age, dietary, and physiological changes) are unknown. A combination of some or all of these factors is possible and requires additional study. Demethylation of OHg is expected to occur in the liver. A significant negative correlation between THg in the liver and %OHg in females suggest a sex-related difference in how otters process OHg in the liver.
A significant correlation was observed between THg concentration in fur and both THg and OHg concentrations in the liver and kidney of trapped otters. Because fur is easier to collect and fur collection is noninvasive, using fur THg concentration to monitor mammalian Hg burdens within an ecosystem appears to be reasonable. Overall, Hg concentrations in river otters from central Saskatchewan were relatively low. Otters trapped within the Churchill River Upland ecoregion contained higher Hg concentrations than otters trapped within the Boreal Plain ecoregions. Otters collected close to the now decommissioned mining and smelting operation in Flin Flon, Manitoba, contained the highest concentrations of THg in fur in this study.
Acknowledgements
Thank you to The Saskatchewan Trappers Association and more specifically to Don Gordon (President) for providing the otter carcasses for this study. Makenzie Garbe and Kimberly Niles assisted with sample pick-up and dissection. Funding was provided by the Technical Resources Branch of the Saskatchewan Ministry of Environment. Thank you to the two anonymous reviewers who substantially improved the quality of this paper.
References
Acton AF, Padbury GA, and Stushnoff CT. 1998. The ecoregions of Saskatchewan. Canadian Plains Research Center/Saskatchewan Environment and Resource Management, Regina, Saskatchewan. 205 p.
Basu N, and Head J. 2010. Mammalian wildlife as complementary models in environmental neurotoxicology. Neurotoxicology and Teratology, 32: 114–119.
Basu N, Scheuhammer AM, Grochowina NM, Klenavic K, Evans RD, O’Brien M, et al. 2005. Effects of mercury on neurochemical receptors in wild river otters (Lontra canadensis). Environmental Science & Technology, 39(10): 3585–3591.
Compeau GC, and Bartha R. 1985. Sulfate-reducing bacteria: principal methylators of mercury in anoxic estuarine sediment. Applied Environmental Microbiology, 50: 498–502.
Driscoll CT, Mason RP, Chan HM, Jacob DJ, and Pirrone N. 2013. Mercury as a global pollutant: sources, pathways, and effects. Environmental Science & Technology, 47: 4967–4983.
Eagles-Smith CA, Ackerman JT, Yee J, and Adelsbach TL. 2009. Mercury demethylation in waterbird livers: dose–response thresholds and differences among species. Environmental Toxicology and Chemistry, 28(3): 568–577.
Environment and Climate Change Canada. 2017. Canadian climate normals [online]: Available from climate.weather.gc.ca/climate_normals/index_e.html.
Evans RD, Addison EM, Villeneuve JY, MacDonald KS, and Joachim DG. 1998. An examination of spatial variation in mercury concentrations in otter (Lutra canadensis) in south-central Ontario. Science of the Total Environment, 213: 239–245.
Evans RD, Addison EM, Villeneuve JY, MacDonald KS, and Joachim DG. 2000. Distribution of inorganic and methylmercury among tissues in mink (Mustela vison) and otter (Lutra canadensis). Environmental Research, 84: 133–139.
Fleming EJ, Mack EE, Green PG, and Nelson DC. 2006. Mercury methylation from unexpected sources: molybdate-inhibited freshwater sediments and an iron-reducing bacterium. Applied and Environmental Microbiology, 72: 457–464.
Fortin C, Beauchamp M, Dansereau N, Larivière N, and Bélanger D. 2001. Spatial variation in mercury concentrations in wild mink and river otter carcasses from the James Bay Territory, Québec, Canada. Archives of Environmental Contamination and Toxicology, 40: 121–127.
Gamberg M, Boila G, Stern G, and Roach P. 2005. Cadmium, mercury and selenium concentrations in mink (Mustela vison) from Yukon, Canada. Science of the Total Environment, 351–352: 523–529.
Gilbert FF, and Nancekivell EG. 1982. Food habits of mink (Mustela vison) and otter (Lutra canadensis) in northeastern Alberta. Canadian Journal of Zoology, 60: 1282–1288.
Hamelin S, Amyot M, Barkay T, Wang Y, and Planas D. 2011. Methanogens: principal methylators of mercury in lake periphyton. Environmental Science & Technology, 45: 7693–7700.
Hudbay Minerals. 2017. Timeline [online]: Available from timeline.hudbayminerals.com/en/.
Klenavic K, Champoux L, O’Brien M, Daoust P-Y, Evans DR, and Evans HE. 2008. Mercury concentrations in wild mink (Mustela vison) and river otters (Lontra canadensis) collected from eastern and Atlantic Canada: relationship to age and parasitism. Environmental Pollution, 156: 359–366.
Kucera E. 1983. Mink and otter as indicators of mercury in Manitoba waters. Canadian Journal of Zoology, 61: 2250–2256.
Liber K, Carter C, Matthews A, and Wang X. 2013. Analysis of river otter (Lontra canadensis) livers and kidneys from northern Saskatchewan for metals and trace elements via ICP-MS. University of Saskatchewan Toxicology Centre, Saskatoon, Saskatchewan. 17 p.
Ma J, Hintelmann H, Kirk JL, and Muir DCG. 2013. Mercury concentrations and mercury isotope composition in lake sediment cores from the vicinity of a metal smelting facility in Flin Flon, Manitoba. Chemical Geology, 336: 96–102.
Martin PA, McDaniel TV, Hughes KD, and Hunter B. 2011. Mercury and other heavy metals in free-ranging mink of the lower Great Lakes basin, Canada 1998–2006. Ecotoxicology, 20: 1701–1712.
Mierle G, Addison EM, MacDonald KS, and Joachim DG. 2000. Mercury levels in tissues of otters from Ontario, Canada: variation with age, sex, and location. Environmental Toxicology and Chemistry, 19(12): 3044–3051.
Nam D-H, and Basu N. 2011. Rapid methods to detect organic mercury and total selenium in biological samples. Chemistry Central Journal, 5: 3–5.
Nam D-H, Adams DH, Reyier EA, and Basu N. 2011. Mercury and selenium levels in lemon sharks (Negaprion brevirostris) in relation to a harmful red tide event. Environmental Monitoring and Assessment, 176: 549–559.
Outridge PM, Rausch N, Percival JB, Shotyk W, and McNeely R. 2011. Comparison of mercury and zinc profiles in peat and lake sediment archives with historical changes in emissions from the Flin Flon metal smelter, Manitoba, Canada. Science of the Total Environment, 409: 548–563.
Reid DG, Code TE, Reid ACH, and Herrero SM. 1994. Food habits of the river otter in a boreal ecosystem. Canadian Journal of Zoology, 72: 1306–1313.
Scheuhammer AM, Meyer MW, Sandheinrich MB, and Murray MW. 2007. Effects of environmental methylmercury on the health of wild birds, mammals, and fish. AMBIO: A Journal of the Human Environment, 36(1): 12–19.
Sleeman JM, Cristol DA, White AE, Evers DC, Gerhold RW, and Keel MK. 2010. Mercury poisoning in a free-living northern river otter (Lontra canadensis). Journal of Wildlife Diseases, 46(3): 1035–1039.
Spencer SH, Shutler D, and O’Brien MS. 2011. Correlates of mercury in female river otters (Lontra canadensis) from Nova Scotia, Canada. Environmental Toxicology and Chemistry, 30: 1879–1884.
Stansley W, Velinsky D, and Thomas R. 2010. Mercury and halogenated organic contaminants in river otters (Lontra canadensis) in New Jersey, USA. Environmental Toxicology and Chemistry, 29(10): 2235–2242.
StatSoft, Inc. 2014. STATISTICA (data analysis software system), version 12 [online]: Available from statsoft.com/Products/STATISTICA-Features.
Strom SM. 2008. Total mercury and methylmercury residues in river otters (Lutra canadensis) from Wisconsin. Archives of Environmental Contamination and Toxicology, 54: 546–554.
US Environmental Protection Agency (US EPA). 2007. Method 7473 (SW-846): mercury in solids and solutions by thermal decomposition, amalgamation, and atomic absorption spectrophotometry. Revision 0 [online]: Available from epa.gov/sites/production/files/2015-07/documents/epa-7473.pdf.
Wolfe MF, Schwarzbach S, and Sulaiman RA. 1998. Effects of mercury on wildlife: a comprehensive review. Environmental Toxicology and Chemistry, 17(2): 146–160.
Wren CD. 1991. Cause-effect linkages between chemicals and populations of mink (Mustela vison) and otter (Lutra canadensis) in the Great Lakes basin. Journal of Toxicology and Environmental Health, 33: 549–585.
Wren CD, Stokes PM, and Fischer KL. 1986. Mercury levels in Ontario mink and otter relative to food levels and environmental acidification. Canadian Journal of Zoology, 64(12): 2854–2859.
Yates DE, Mayack DT, Munney K, Evers DC, Major A, Kaur T, et al. 2005. Mercury levels in mink (Mustela vison) and river otter (Lontra canadensis) from northeastern North America. Ecotoxicology, 14: 263–274.
Yu R-Q, Reinfelder JR, Hines ME, and Barkay T. 2013. Mercury methylation by the methanogen Methanospirillum hungatei. Applied and Environmental Microbiology, 79(20): 6325–6330.
Zar JH. 2010. Biostatistical analysis. 5th edition. Pearson Prentice Hall, Upper Saddle River, New Jersey.
Zhang Y, Jacob DJ, Horowitz HM, Chen L, Amos HM, Krabbenhoft DP, et al. 2016. Observed decrease in atmospheric mercury explained by global decline in anthropogenic emissions. Proceedings of the National Academy of Sciences of the United States of America, 113(3): 526–531.
Supplementary material
Supplementary Material 1 (DOCX / 351 KB)
- Download
- 350.35 KB
Information & Authors
Information
Published In
FACETS
Volume 3 • Number 1 • October 2018
Pages: 139 - 154
Editor: Nelson O’Driscoll
History
Received: 27 June 2017
Accepted: 18 October 2017
Version of record online: 12 February 2018
Copyright
© 2018 Wilkie et al. This work is licensed under a Creative Commons Attribution 4.0 International License (CC BY 4.0), which permits unrestricted use, distribution, and reproduction in any medium, provided the original author(s) and source are credited.
Data Availability Statement
All relevant data are within the paper and in the Supplementary Material.
Key Words
Sections
Subjects
Authors
Author Contributions
SCW and RHME conceived and designed the study.
SCW and RHME performed the experiments/collected the data.
SCW, RHME, and BDH analyzed and interpreted the data.
NB and KL contributed resources.
All drafted or revised the manuscript.
Competing Interests
The authors have declared that no competing interests exist.
Metrics & Citations
Metrics
Other Metrics
Citations
Cite As
Steven C. Wilkie, Richard H.M. Espie, Niladri Basu, Karsten Liber, and Britt D. Hall. 2018. Trapped river otters (Lontra canadensis) from central Saskatchewan differ in total and organic mercury concentrations by sex and geographic location. FACETS.
3(1): 139-154. https://doi.org/10.1139/facets-2017-0082
Export Citations
If you have the appropriate software installed, you can download article citation data to the citation manager of your choice. Simply select your manager software from the list below and click Download.
Cited by
1. Mercury exposure and risk assessment for Eurasian otters (Lutra lutra) in Denmark
2. Towards more compassionate wildlife research through the 3Rs principles: moving from invasive to non-invasive methods
3. Relationships between mercury concentrations in fur and stomach contents of river otter (Lontra canadensis) and mink (Neovison vison) in Northern Alberta Canada and their applications as proxies for environmental factors determining mercury bioavailability
4. Selenium and mercury in the hair of raccoons (Procyon lotor) and European wildcats (Felis s. silvestris) from Germany and Luxembourg
5. Distribution of organic and inorganic mercury across the pelts of Canadian river otter (Lontra canadensis)