A methodology for quantifying and characterizing litter from trash capture devices (TCDs) to measure impact and inform upstream solutions
Abstract
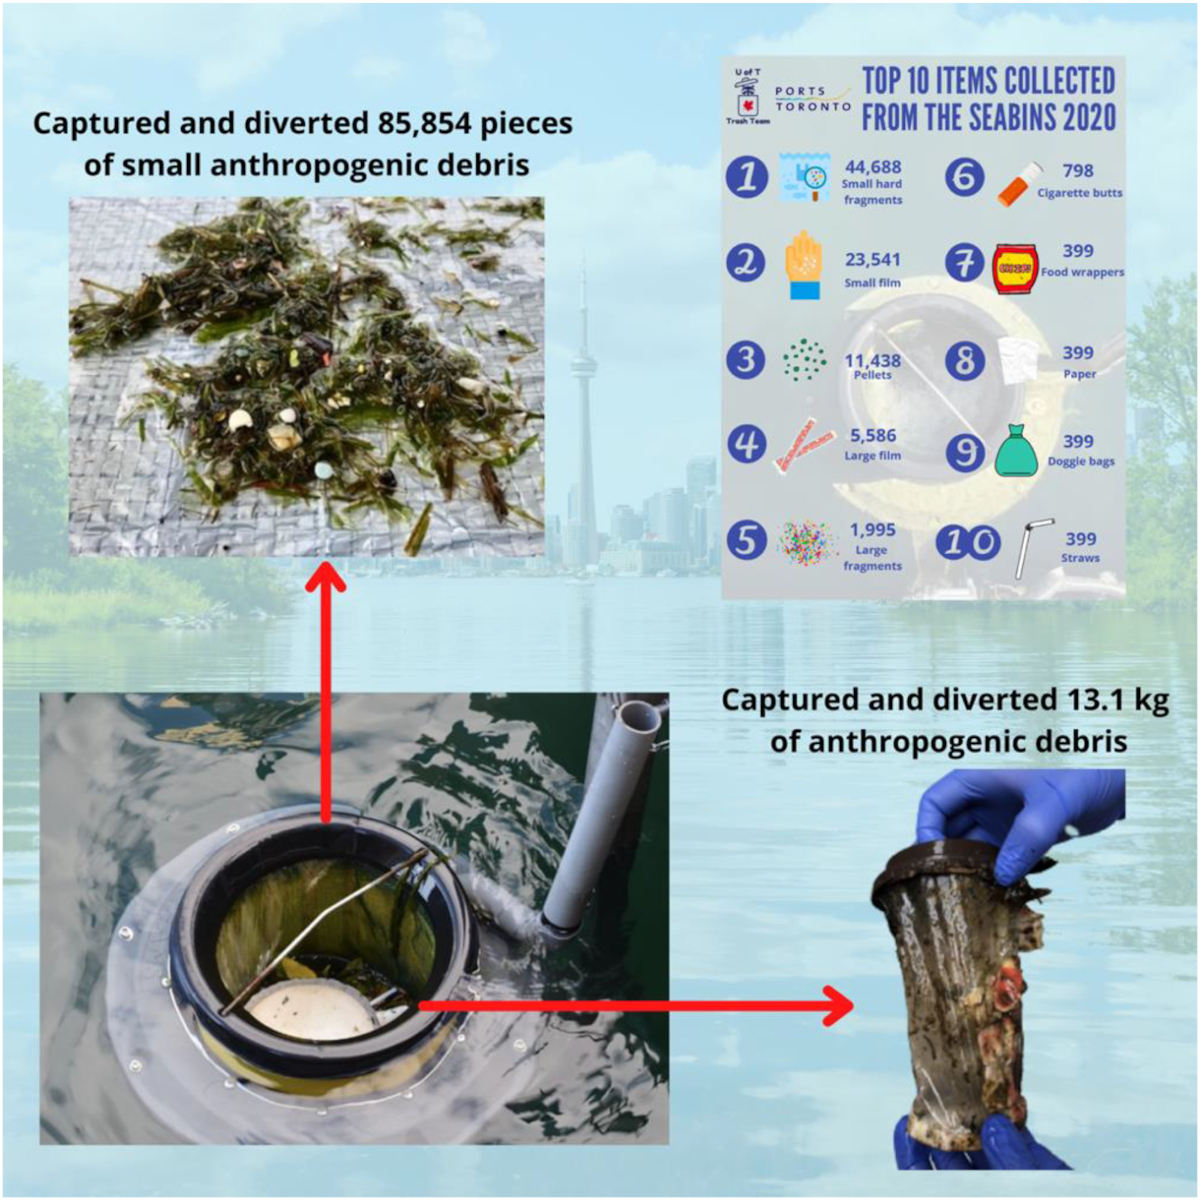
Trash capture devices (TCDs) are a rapidly evolving tool for municipal governments, non-governmental organizations, and industries to divert litter from our waterways. Here, we introduce protocols to initiate trash trapping projects to quantify and characterize captured anthropogenic litter based on a case study using Seabins. In addition, we have introduced a network for global data collection via TCDs. Our first protocol is a visual audit of the potential site to inform the type and location for TCD deployment. Our next two protocols quantify and characterize the litter captured by TCDs: (1) a simple protocol intended for daily monitoring and (2) a detailed protocol to characterize and quantify all large debris (>3 cm) and a subset of the small debris (2 mm–3 cm) caught in the devices. Using Seabins in the Toronto Harbour to test our methodology, we found that our subsampling methodology has a 6.9% error rate. Over a 19-week period, the Seabins captured ∼85 000 pieces of small debris. Our study highlights the utility of TCDs and proposes methods to realize this utility globally. TCDs should become more widespread and utilized as a triple threat: a cleanup tool, a data collection tool, and a platform for outreach and education.
Graphical Abstract
Introduction
Globally, all plastic ever produced is equivalent to twice the overall mass of terrestrial and marine animals combined (Elhacham et al. 2020). Due to the lack of well-designed management strategies for plastics, much of it ends up as pollution, where researchers have estimated 19–23 million metric tons (mt) of plastic waste entered aquatic ecosystems in 2016 alone, and if we continue “business as usual” this number may triple or quadruple by 2030 (Borelle et al. 2020). Plastics have been reported globally in oceans, rivers, lakes, soils, and the atmosphere (Barnes et al. 2009; Eriksen et al. 2013; Wright et al. 2013; Corcoran et al. 2015; Gall and Thompson 2015; Allen et al. 2019; Emmerik and Schwarz 2019; Wang et al. 2020). With such widespread contamination and evidence of negative impacts (Bucci et al. 2020; Everaert et al. 2020), it begs the need for widespread solutions.
Due to the complex problems that plastic pollution poses to our environment, societies, and economies, many diverse solutions have been proposed across all sectors. Some examples are reducing plastic production, improvements in waste management, a transition to a circular economy, the invention of substitutions (e.g., biodegradable packaging), and cleanups (Gontard and Gulibert 1994; Borelle et al. 2017; Garcia et al. 2019). There is no one-size-fits-all solution, and Borelle et al. (2020) demonstrate the need for several solutions in parallel. Although cleanups should be a last resort and upstream solutions prioritized, it is essential at present while leakage and contamination remain high.
There are many different types of cleanups; the most common is a volunteer-based manual cleanup. In 2019, more than 9 million kg (0.009 mt) of anthropogenic debris was recovered globally by volunteers from the International Coastal Cleanup (ICC; Ocean Conservancy 2020). Although this is an enormous effort, it is a small number compared to the millions of tonnes of plastic waste entering aquatic ecosystems annually (Jambeck and Johnsen 2015; Borrelle et al. 2020). This suggests a need to supplement volunteer efforts with other proposed solutions such as the implementation of specialized technologies—e.g., trash capture devices (TCDs).
The benefit of TCDs is that they can clean 7 days a week, 24 h per day. They typically capture litter that has already entered the aquatic environment and can also effectively capture small particles, diverting these materials from aquatic ecosystems. Still, there is concern regarding their efficiency as well as their potential to negatively impact ecosystems through the accidental collection of biota (Falk-Andersson et al. 2020; Leone et al. 2022). Researchers have suggested methods that can be used to conduct cost-benefit analyses to determine how the positive impact of removing plastic debris compare to any negative impact to an ecosystem (Falk-Andersson et al. 2020; Leone et al. 2022). Using these methods, along with other information and proposed methods to assist stakeholders in choosing a type of device and location for deployment (Schmaltz et al. 2020; Helinski et al. 2021), effective and safe trash-capturing programs can be implemented. Today, TCDs are mobilized in different parts of the world to either (1) prevent anthropogenic debris from entering our waterways through capture upstream (e.g., storm drain technologies) or (2) capture debris after it enters marine or freshwater ecosystems (e.g., river collectors) (Schmaltz et al. 2020).
In addition to diverting plastic pollution from the environment, TCDs can also collect data to measure positive impact and inform preventative policies upstream. TCDs can also be utilized as a centrepiece for outreach and education regarding plastic and microplastic pollution. A TCD developed and deployed in Baltimore, Mr Trash Wheel, is a great example of successful removal of plastic debris, data collection, and increasing waste literacy through education and outreach. The success of Mr Trash Wheel inspired us to learn more about TCDs and see whether we could scale up cleanup efforts, data collection, and waste literacy globally through a harmonized global network of TCDs.
Here, we begin our work in the Toronto Harbour using Seabins as a case study to (1) develop methodology to inform the most appropriate type of TCDs and the most effective location where TCDs should be deployed (“Tracking Trash”) and (2) deploy TCDs to develop a methodology that could be globally harmonized for quantifying and characterizing anthropogenic debris trapped by TCDs to measure positive impact and inform policies upstream (“Trapping Trash”). Ultimately, this work was completed to improve our own TCD programming with local stakeholders and to develop the International Trash Trap Network.
Materials and methods
This work was carried out in the Toronto Harbour located in Toronto, ON, Canada. The City of Toronto, Canada’s most populated city (>2.7 million people), sits on the northwest shore of Lake Ontario. The Toronto Harbour, like many urban water bodies, has high amounts of plastic contamination compared to some marine environments. This has been reported in local sediments (Ballent et al. 2016), surface water (Grbic et al. 2020), and wildlife (Munno et al. 2021). Transport pathways of plastic debris to the harbour include outflows from a combined sewage system, general litter deposited along the shoreline, and local storm drains. In addition, a significant pathway of plastic debris to the harbour includes the heavily urbanized Don River. Still, direct sources are not well understood; thus, further research is critical to mitigate sources upstream.
Tracking trash: identifying litter hotspots to inform the location of TCDs
Prior to deploying a TCD, it is critical to determine the best type of trap, the best location, and the timing of deployment. First, it is important to understand spatial and temporal patterns of local contamination—which can inform the type of device, the location for its deployment, and the times of the year that the device should be deployed. It is best to strategically place a device where it can safely make the most impact, which may depend on major pathways for litter and accumulation hotspots. It also may depend on seasonal variability as well as any potential to pose negative effects on the ecosystem. To inform the most efficient and successful trash trapping programs, we developed a method for a visual audit, which quantifies and characterizes local anthropogenic debris across various locations.
Prior to conducting a visual audit, steps should be taken to plan and prepare. First, identify the times when an audit should be conducted relevant to when a trap may be deployed. For example, we do not keep our TCDs deployed in Winter in Toronto; thus, audits do not need to occur during winter months. Next, identify multiple potential sites for a TCD to audit. This may be based on expert or local stakeholder knowledge of where plastic pollution is common. A preliminary assessment can be conducted to aid in this process and make sure sites are accessible.
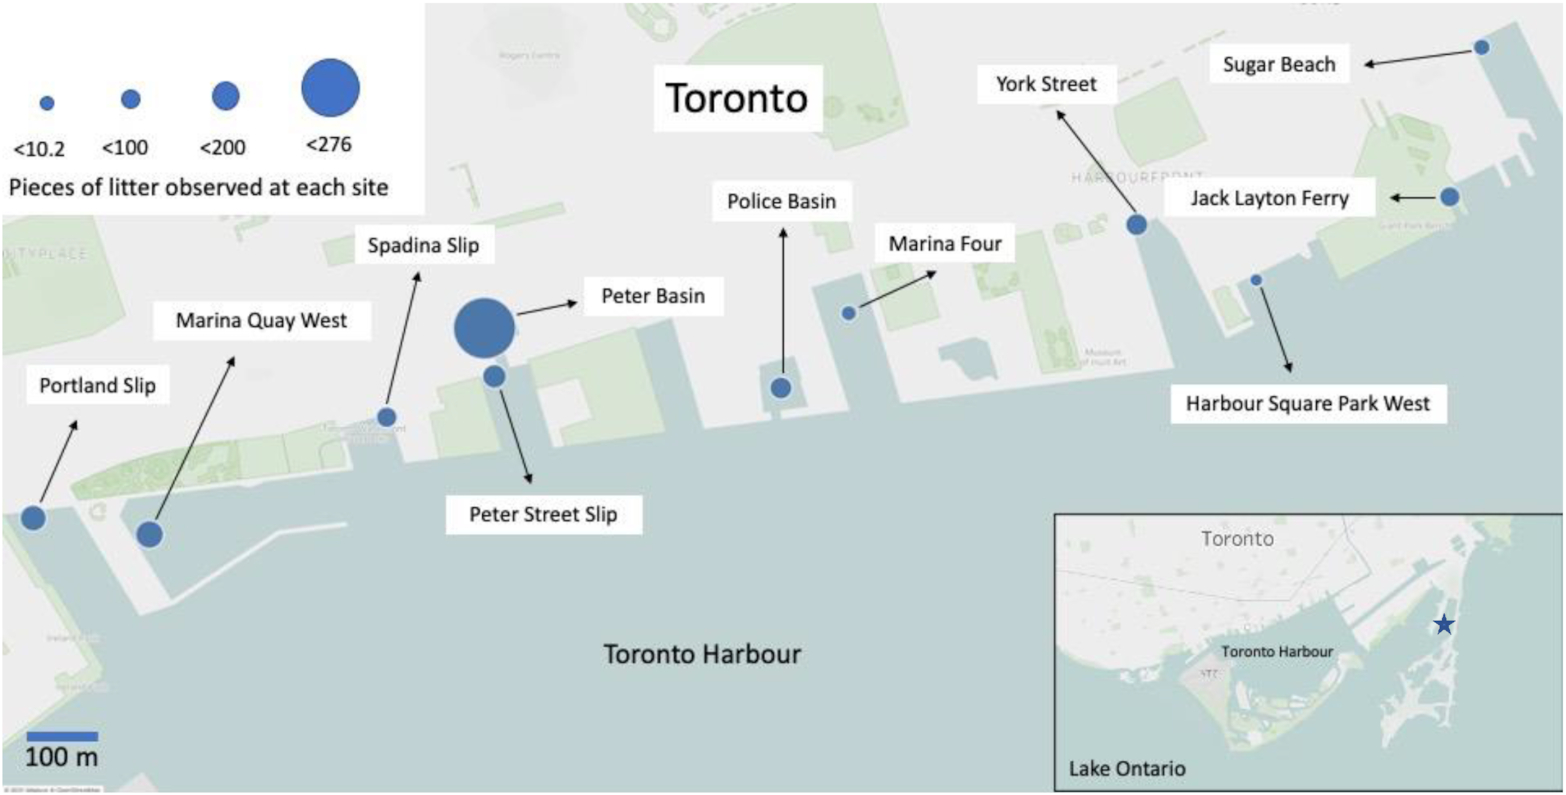
For our visual audit, 12 sites (see Fig. 1) were selected based on accessibility and previous reports published by a local non-profit organization. These reports identified areas along the Toronto Waterfront (Fig. 1) with high litter accumulation (Swim Drink Fish 2018). The visual audit covered nearly all the Central Toronto Waterfront from approximately The Waterfront Neighbourhood Centre (43°38′08.4″N, 79°23′49.0″W) to Sugar Beach (43°38′33.8″N, 79°22′02.1″W) (Fig. 1). Each site labelled on Fig. 1 was audited by walking the entire perimeter of each slip, identifying any anthropogenic debris as described below.
Fig. 1.
Our visual audit entails recording the type and amount of large anthropogenic debris (defined as anything larger than a bottle cap) visually identified. A semiquantitative estimate of small anthropogenic debris is also recorded (defined as anything smaller than a bottle cap). We also record general information on the weather and water conditions, which provide insight into temporal patterns of litter accumulation depending on local conditions. Specifically, we recorded wind, cloud coverage, swell, and whether a wet event occurred in the past 24 h (defined as precipitation over 10 mm). We aimed to conduct audits weekly between May and October (n = 2–8 audits per site) to coincide with a typical season for a TCD in Toronto. However, due to COVID-19, the audits only took place from August to October.
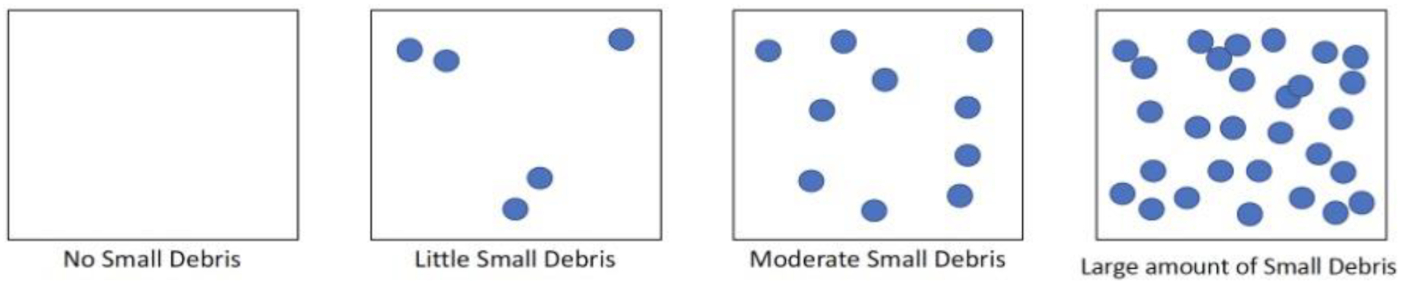
The audit is conducted by walking along a specified route (based on the entire perimeter of the chosen site) near the edge of the water to get the best possible view of the floating anthropogenic debris. To standardize collection among sites and across weeks, anthropogenic debris (which included plastic debris and non-plastic debris) was quantified by counting the plastic litter floating and characterized from a standing position and not bent over. If a piece of anthropogenic debris of interest needed to be closely examined, we would bend down to get a closer look but would not characterize or quantify any other debris while doing so. At each site, we first quantified and characterized debris by product type (i.e., plastic straw, single-use plastic bottle, takeout container) that was larger than a bottle cap. If we encountered a large accumulation of floating debris that was impractical to count (i.e., >50 pieces), a picture was taken, and the location of the photo was recorded on the datasheet with a mark on the map. Each photo was then analyzed later. The photos were examined from left to right and from top to bottom. Each item in the image was quantified and characterized, and if some items could not be identified, they were recorded as unidentifiable. These data were then added to the tally taken visually in situ. If anything unusual or noteworthy was identified during the audit, such as a large accumulation of organic matter or biota, this was recorded in the notes section of the datasheet. To semiquantitatively assess the amount of small anthropogenic debris at each site, four images were used as a guide to match which image best represents what is observed in the environment (Fig. 2). For the full protocol and datasheets, visit our website (https://oceanconservancy.org/wp-content/uploads/2021/03/Visual-Audit-Protocol.pdf; link is also given in Supplementary material).
Fig. 2.
Trapping trash: methods to quantify and characterize anthropogenic debris collected
Three Seabins were installed in the Outer Harbour Marina in Toronto in 2020 (43°38′34.6″N, 79°19′30.8″W) (Fig. 1). The location of these Seabins were chosen as a pilot to develop the methodology described below and to gauge the amount of maintenance needed to run a Seabin prior to choosing locations across the Toronto Waterfront. Two different methodologies were developed to quantify and characterize litter trapped by TCDs, using Seabins as a case study. The first is a “simple waste characterization,” intended to collect daily data in a simple and accessible manner that can be carried out by anyone maintaining the TCD. The second is a “detailed waste characterization” to collect data 5–10 times per year (aiming to capture variability by spreading out the data collection throughout each TCD season or year), where the content of each Seabin is meticulously sorted and characterized by material type. A season can be defined as that that the TCD is deployed annually. In Toronto, our TCD season typically occurs between May and October, which coincides with the ice-free season. Combined, these two methodologies provide a quantitative measure of the weight and count of anthropogenic debris diverted and information regarding what is collected to inform source-reduction upstream.
Simple waste characterization
As regular maintenance and emptying will likely be carried out by a marina operator or municipal staff, the simple method was designed to be fast and accessible while accurately measuring the quantity of anthropogenic litter diverted from the local aquatic environment.
This protocol provides a direct measure of the mass of anthropogenic and organic material collected. To facilitate data collection, we designed a free application: Data Trapper. The Data Trapper app is available for iOS and Android devices (links can be found in Supplementary material). It allows data to be collected on a local and global scale and is currently being used for several TCDs across North America. Metadata collected for each TCD include the type of TCD, location, weather conditions, date, time, amount of time the TCD was deployed, and whether a wet event occurred since the TCD was last emptied. The following example is for a Seabin, generally emptied daily, but has also been tested on a few other types of TCDs. After metadata are recorded, the catch bag of the Seabin is removed, the full bin is weighed using a luggage scale, and a picture of its contents in the catch bag is taken. The image is uploaded into the app, and the user provides the weight of the full catch bag and a qualitative estimate of how full the catch bag is. As we know the mass of an empty catch bag, we can calculate the mass of the diverted debris alone (see a video tutorial of the procedure in the Supplementary material). The catch bag is placed back into the Seabin, and the protocol will be repeated every 24 h. This process takes roughly 5 min per bin. If needed, paper datasheets are also available for download from our website with the full protocol (https://oceanconservancy.org/trash-free-seas/international-coastal-cleanup/trash-trap-network/; link is also given in Supplementary material).
This protocol was designed to create a harmonized procedure to characterize and quantify anthropogenic debris collected in TCDs across space and time. Until our app is updated, data for this protocol are to be collected on a datasheet that can be found through the link below or in the Supplementary material.
Detailed waste characterization
During each detailed characterization, basic metadata are collected: type of TCD, location, weather conditions, date, time, amount of time the TCD was deployed, and whether a wet event (defined as precipitation over 10 mm) occurred since the TCD was last emptied. Like the simple protocol, the full catch bag is weighed using a luggage scale. The wet weight is recorded along with the qualitative measure of how full the catch bag is, meaning whether the catch bag is empty, quarter full, half full, or full. The contents of the bag are then placed on a tarp to be quantified and characterized.
Once placed on the tarp, the large anthropogenic debris (defined as >3 cm) is sorted first. To begin, any large anthropogenic debris is first separated from the organic material (e.g., macrophytes, woody debris). Next, each piece of large anthropogenic debris extracted is tallied and characterized to product type (e.g., plastic bag, cigarette butt, plastic wrapper). The large material is then weighed using a small battery-powered kitchen scale.
In addition to the large debris, we characterize the small anthropogenic debris (defined as anything >2 mm and less than 3 cm). In our study, much of the small anthropogenic debris is entangled in organic material. As such, we first need to extract small particles from the organic material. For this, two handfuls of plant material are placed into a 5gal bucket and rinsed with a hose at high pressure until the bucket is ¾ full. The bucket is then left to sit for roughly one minute to allow the small anthropogenic pieces to resurface. If large pieces of debris appear at the surface, they are removed and added to the tally of large anthropogenic pieces extracted previously. Next, a circular sieve that has a mesh size of ½in. is placed into the bucket and pushed down towards the bottom to separate the organic material from the small floating anthropogenic pieces. We call this the “French press technique.” While holding the sieve in the bucket, the contents of the bucket are poured into a 2 mm sieve. The extracted material consists of the small anthropogenic debris with some small pieces of organic material. This extraction step is then repeated twice, and the floating material is combined on the 2 mm sieve. This entire process is then repeated for the remaining plant material on the tarp. The organic material that remains at the bottom of the bucket after having gone through the French press technique should be disposed properly. In Toronto, we put this material in the garbage bin because it still contains some plastic debris and mostly comprised invasive plant species.
Next, the contents on the 2 mm sieve are examined. If there are less than 50–100 small pieces, then everything present on the sieve is quantified, weighed, and characterized to type (e.g., hard fragment, foam, pellets, film, and other; Table S1). If there appears to be more than 50–100 pieces of small anthropogenic debris present, the contents can be subsampled. For subsampling, all the debris on the sieve is scraped into one pile and then further split into four equal piles. Then, one pile is randomly picked for quantification and characterization. The counts and weight from this pile are then multiplied by four to estimate the small debris across the whole sample. The accuracy of the subsampling method was measured and is described below. The full protocol and datasheets are available on our website (https://oceanconservancy.org/trash-free-seas/international-coastal-cleanup/trash-trap-network/), and a video tutorial of how to carry out the protocol can be found in the Supplementary material and on our website.
To test these methods and validate it on the field, we quantified and categorized debris from three individual Seabins from July to October 2020. In total, we characterized 27 samples, which equate to 10 from Seabin 1, 10 from Seabin 2, and 7 from Seabin 3.
Method validation
To test the effectiveness of our washing/extraction method, the organic material was kept to the side after having been rinsed three times and was sorted through after the initial analysis. We quantified and categorized all small anthropogenic debris in the washed leftover organic material. To test our subsampling technique, we quantified the three remaining piles left on the 2 mm sieve to compare their totals against the extrapolated totals from the original subsampled pile.
Statistical analysis
To determine whether there were significant differences in the amount of litter among each of the 12 visual audit sites, we ran a permutational multivariate analysis of variance (ANOVA) (PERMANOVA; adonis function in vegan R package, version 3.5.0, 999 permutations) due to unequal sample sizes. To determine the relationship between the mass of organic material and the mass of anthropogenic litter and quantity of small anthropogenic litter in the Seabins, we ran simple linear regressions. Regressions included the weight of the full Seabin on the x-axis and either the total weight of anthropogenic debris, total count of anthropogenic debris, and total weight of small anthropogenic debris or the total count of small anthropogenic debris on the y-axis. To explore the relationship between organic material and small plastic litter, we ran a linear regression with the weight of the plant material on the x-axis and the count of small anthropogenic debris on the y-axis. All analyses were performed with R (version 3.5.0) or Microsoft Excel (version 16.54). Statistical significance was considered at p < 0.05.
Results
Below we share results from our case study in the Toronto Harbour, creating and testing methodologies to audit potential locations for TCDs and characterize litter diverted by devices. We also share results relevant to the validation of our methodology and how the methods can be used together to estimate total mass, count, and type of anthropogenic litter diverted.
Tracking trash: identifying litter hotspots to inform the location of TCDs
Twelve potential sites along the harbour were audited from May to October of 2020 between two and eight times. In future years, we suggest auditing each site the same number of times, which proved difficult for us during COVID-19. Each site had variable amounts of floating litter—with average accumulations of 10–276 anthropogenic litter items per site (Table S2; Fig. 1). The smallest average accumulation was observed at Harbour Square West Park and the highest at Peter Street Basin.
Overall, a PERMANOVA showed a significant difference among sites (PERMANOVA, p = 0.001). The sites on the west end of the waterfront tended to accumulate more anthropogenic debris, while sites to the east were all below 200 pieces. This difference appears to be mainly driven by the high counts of litter found at the Peter Street Basin. Across all sites and visits, more than 100 different types of anthropogenic debris were observed and recorded. The most common type of anthropogenic debris was a plastic bottle cap, and all types within the top 10 are identified as single-use plastics (Table 1).
Table 1.
| Visual audit | Seabins | |||
|---|---|---|---|---|
| Ranking | Type of anthropogenic debris | Total sum of observed anthropogenic debris across all locations | Type of anthropogenic debris | Total sum of observed anthropogenic debris across all locations |
| 1 | Bottle caps | 837 | Film | 391 |
| 2 | Cigarette butts | 415 | Large plastic fragment | 121 |
| 3 | Large plastic fragments | 391 | Cigarette butts | 41 |
| 4 | Straws | 322 | Food wrapper | 32 |
| 5 | Food wrappers | 291 | Paper | 20 |
| 6 | Foam | 250 | Dog waste bags | 14 |
| 7 | Clear wrappers | 210 | Straws | 13 |
| 8 | Plastic bottles | 190 | Bottle caps | 12 |
| 9 | Plastic bags | 181 | Foam | 11 |
| 10 | Plastic wrappers | 125 | Cigar tips | 11 |
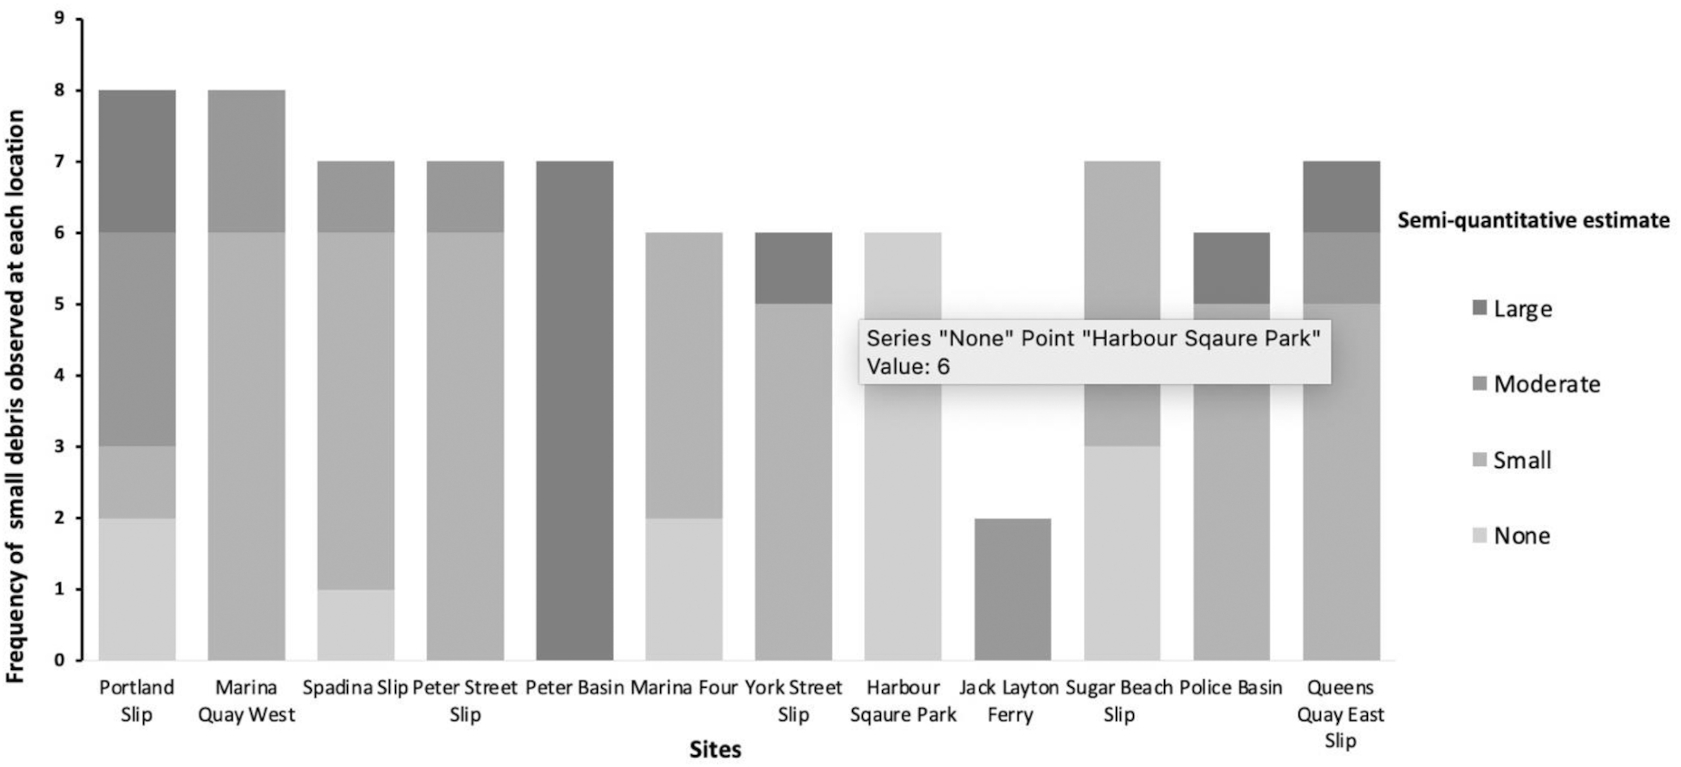
Our semiquantitative assessment of the small debris concluded that 75% of sites had “little” small debris (Fig. 3). In contrast, we observed “no,” “moderate,” and “large” amounts of small debris at relatively the same frequency of occurrence across all sites. “No” small debris was mainly reported at Harbour Square Park West, and “large” small debris was reported most frequently at Peter Street Basin (Fig. 3).
Fig. 3.
While conducting the audits, part of the metadata collected was wind direction and conditions and whether a rain event had occurred in the past 24 h (>10 mm of rain). Anecdotally, we observed that an easterly wind was most common, and no trends were detected when accounting for precipitation. Collecting data at least once per week throughout an entire TCD season is recommended to capture more representative data. See Supplementary data for a detailed dataset.
Trapping trash: methods to quantify and characterize anthropogenic debris collected
Simple waste characterization protocol
Throughout the 19-week period that the Seabins were deployed, each device captured and diverted an average of 4.2 kg of debris per 24 h. The mass of debris diverted ranged from 0.18 to 6.67 kg per 24 h period throughout our identified TCD season. This value includes all material that floated into the bin, meaning organic material and anthropogenic debris. See Supplementary data for a detailed dataset.
Detailed waste characterization protocol
The average count of large anthropogenic litter items in each bin ranged from 25 to 28 pieces and the average weight from 0.02 to 0.05 kg (Table S3). Overall, we characterized 36 different categories of large anthropogenic debris, 96% of which was defined as plastic litter (Table 1). The other 4% was composed of other anthropogenic items such as chopsticks, foil, and unknown anthropogenic items. Most plastic pieces were broken down bits of larger items, categorized as film and fragments. In total, we quantified 723 pieces of large anthropogenic debris weighing 0.79 kg from 27 bin samples across all three bins over a 19-week period.
Small anthropogenic debris was characterized into five categories: hard fragments, pellets, foam, film, and other. Across all 27 samples, we collected 5742 pieces of small debris in total. More specifically, this included 3028 hard fragments, 1598 films, 774 pellets, 422 foams, and 70 others. More than half of the samples, 54%, were subsampled and extrapolated to an entire sample by multiplying each value by four. The total mass of collected small debris was 0.029 kg. Although Seabins are manufactured to target macroplastics (e.g., single-use plastic bottles, cutlery, takeout containers, and plastic bags), 88% of the debris captured and characterized in our samples was small debris (Fig. S1). On average, each Seabin collected between 197 and 302 pieces per 0.003–0.006 kg of small anthropogenic debris per day (Table S3).
Overall, we found no patterns suggesting any relationship between average mass of anthropogenic debris and wet events. See Supplementary data for a detailed dataset.
Validation of the extraction or “French press technique”
Based on the number of small anthropogenic debris in the sieve compared to the number of small anthropogenic debris remaining in the organic material after three rinses, we found our French press technique has a recovery of >50%. Across the three Seabins, the extraction method captured 59.4% of the small anthropogenic debris from Seabin 1, 80.2% from Seabin 2, and 50.1% from Seabin 3 (Figs. 4A, S2, and S3). Hard fragments, film, and pellets were most likely to remain in the plant material. On average, the small anthropogenic debris recovery from each sample was 60.6%.
Fig. 4.
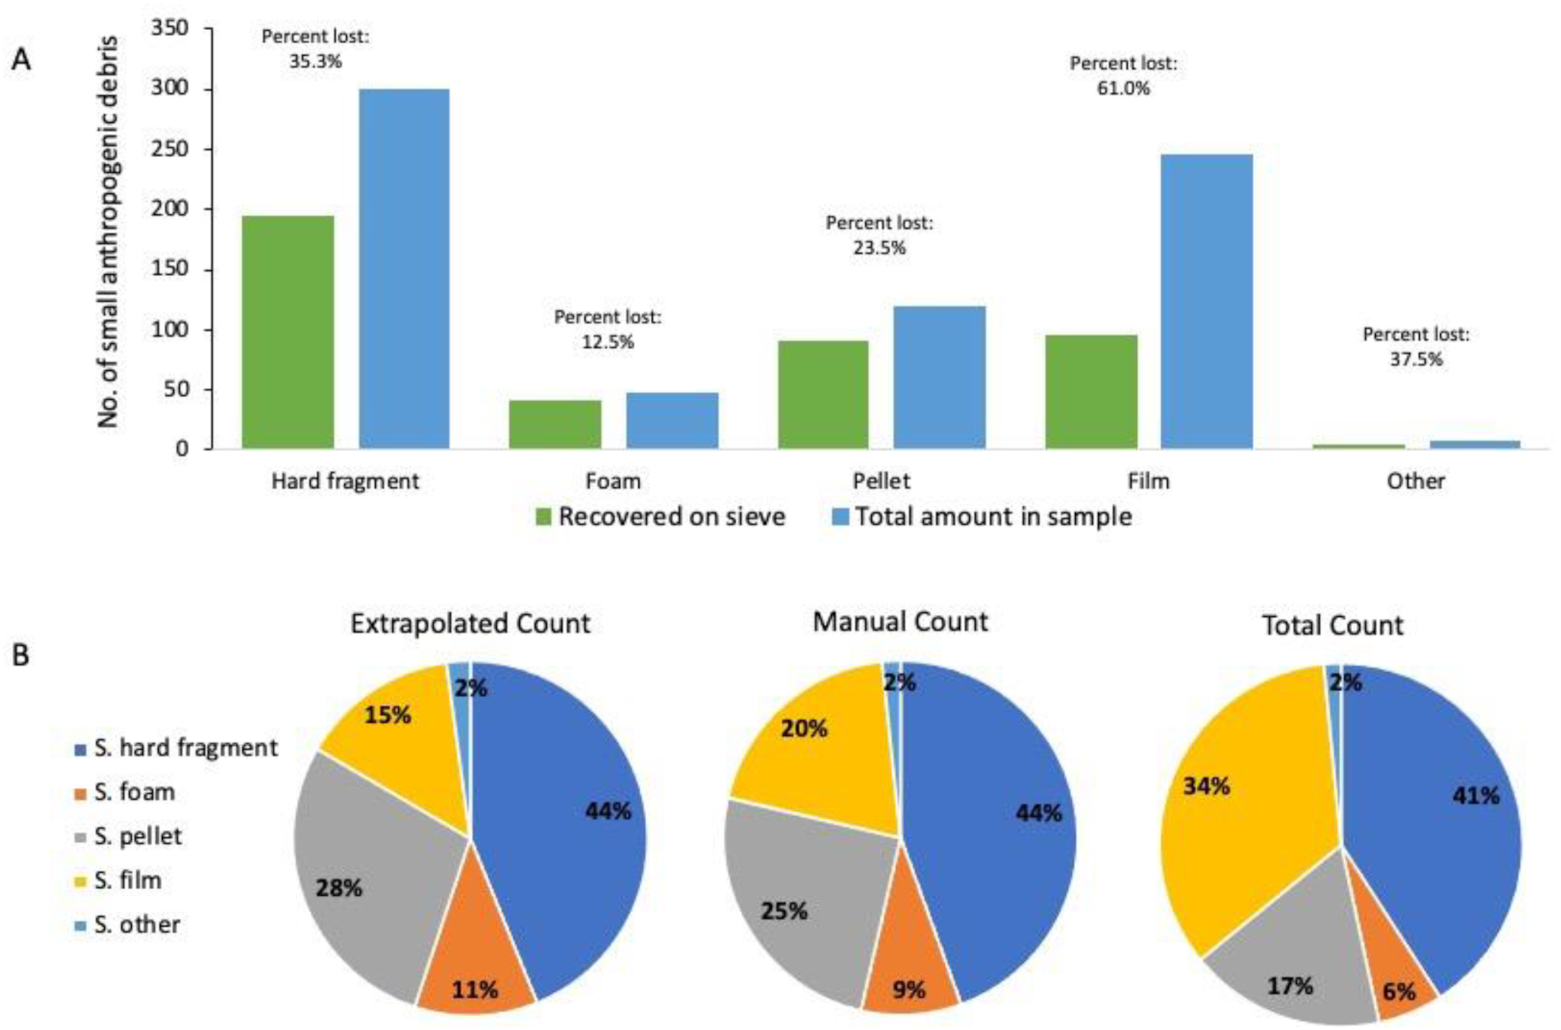
Although the average recovery of small anthropogenic debris is ∼60%, the diversity of small anthropogenic debris extracted and counted in a subsample is representative of the entire extracted sample and the whole sample. This methodology does not exclude any category of anthropogenic debris, and the subsampling methodology is representative of what is collected by the Seabin (Fig. 4B).
Validation of subsampling methodology
To test the accuracy of our subsampling methodology, used to determine the total count of small anthropogenic debris from the Seabin, the average number of extrapolated small anthropogenic debris was compared to the total count of anthropogenic debris collected in the sieve from three different Seabins. Based on the difference calculated between the extrapolated number and the manual count, we have a 6.9% average error rate across all samples (Table S4; Fig. S4). Moreover, between the extrapolated and manual average counts, we observe a relatively equal amount of variability, even when variability is large (Fig. S4). Finally, as noted above, the diversity of material is consistent between the extrapolated and manual counts (Fig. 4B).
Relationship between the mass of the full bin and anthropogenic debris
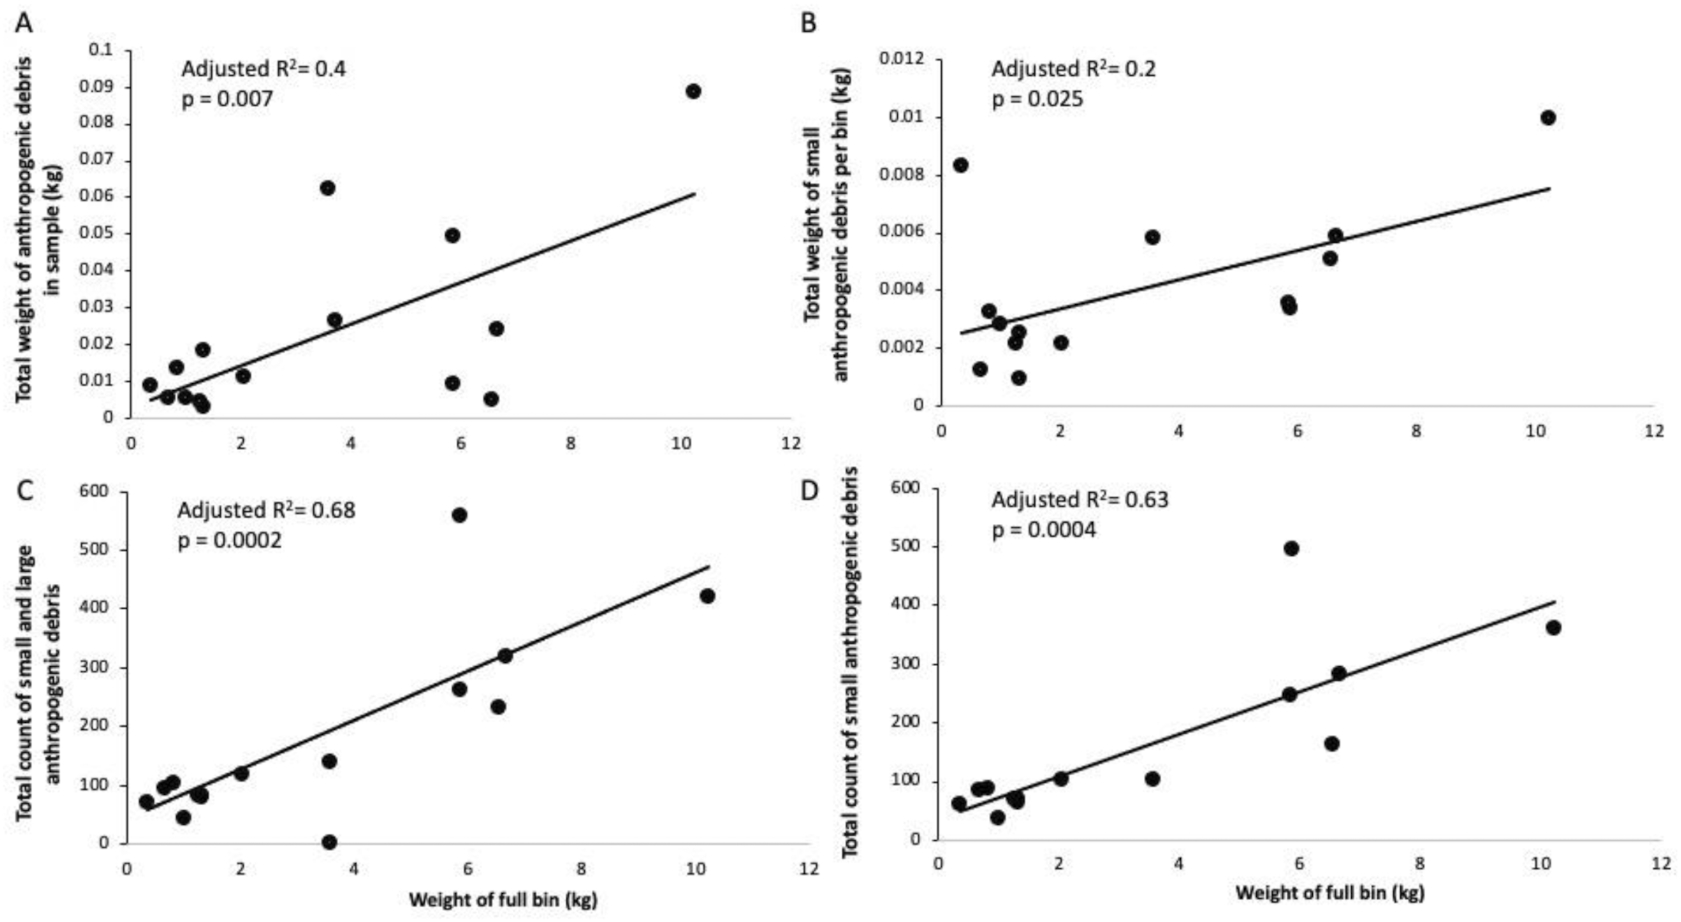
The mass of the full catch bag (with organic and anthropogenic debris) was compared to two different metrics of anthropogenic debris: the count and the mass (kg). We found a significant positive relationship between the total mass of the contents within the bin and the total mass of anthropogenic debris extracted from the bin (large and small) (adjusted R2 = 0.4; p = 0.007, 95% CI [0.002, 0.009 per kg of anthropogenic debris]); Fig. 5A). When looking just at the small size fraction, the relationship was still significant (adjusted R2 = 0.2; p = 0.025; 95% CI [0.00007, 0.0009 per kg of anthropogenic debris] Fig. 5B), although the relationship was not as strong. In addition, we found a significant positive relationship between the total mass of the bin and the total count of anthropogenic debris (adjusted R2 = 0.68; p = 0.0002; 95% CI [24.8, 58,7]; Fig. 5C), with the pattern driven by the count of small debris (adjusted R2 = 0.63; p = 0.0004; 95% CI [19.8, 110]; Fig. 5D). To explore this further and assess what might be driving this pattern, we compared the mass of the organic material (aquatic macrophytes) to the total number of small debris in the Seabin. We found a similar, and significant, positive relationship between the mass of the plants and the count of small debris (adjusted R2 = 0.68, p = 0.0002; 95% CI [20.9, 49.1]; Fig. S5).
Fig. 5.
Total amount of litter captured in our Seabins using our methodologies
Using the regression models (Fig. 5), we were able to estimate the total mass and count of anthropogenic debris diverted using the information from the simple protocol (i.e., mass of Seabin). Over the season, we estimate that we diverted a total of 13.1 kg (95% CI [0.002, 0.009 per kg]) of anthropogenic debris. This equates to about 4.35 kg of anthropogenic debris per bin. For large debris, this is an estimated 11.7 kg diverted in total or 3.9 kg per bin. For small debris, we estimate that we diverted 84 854 pieces, with an average of 28 284 pieces per bin.
Discussion
Tracking trash—a visual audit informs future trash capture devices
Prior to selecting a TCD for a body of water, it is important to assess the area. The visual audit was created to be an effective tool for determining whether a TCD would be useful and have the most impact. Our visual audit aligns with a framework proposed by Helinski et al. (2021) to aid in choosing an appropriate location and type of TCD. Our protocol is meant to inform locations that enable effective plastic debris capture, that are accessible, and that do not present risks to the ecosystem. In our case study, it is clear that anthropogenic debris tends to accumulate more in specific sites (Fig. 1), providing valuable information on where devices should be placed to remove debris from our harbour and prevent it from travelling further into Lake Ontario. For example, if we could only place one TCD in our region, we would place it at Peter Street Basin according to our results. Visual audits can also be used to assess any potential adverse ecological impacts. If a visual audit determines there is not a lot of plastic litter and the costs of the device and program will outweigh the benefits, or that there is potential for ecological impact, a TCD should not be deployed.
A visual audit also allows for the identification of the type of device that will be most effective and suitable for their area of interest, preventing wasted time and resources that might result from purchasing the wrong device. Again, this recommendation aligns with the proposed framework by Helinski et al. (2021), which is to examine the type of site where anthropogenic debris tends to accumulate. For example, high amounts of debris in our region were found in slips—making types of TCDs that can be deployed on docks most effective.
Trapping trash—using Seabins as a case study to inform data collection
Through this case study, we were able to design two protocols that are easy to use and accessible. Our goal is for them to be harmonized across a global network of local stakeholders effectively, diverting plastic debris from our environment with diverse types of TCDs. Our simple protocol uses low-cost and accessible materials, takes very little time to implement, and uses a free data collection app. The detailed protocol provides data on the amount of different types of debris to inform upstream solutions. This protocol takes more time (1–3 h, depending on the quantity of litter) but uses accessible materials (that can be purchased from a local hardware store) and is easy to follow. To make this protocol more accessible, we only recommend groups use it 5–10 times per year. See protocols for the list of materials and instructions on how to put together your supply kit.
Our data collection methods also inform the effectiveness of TCDs. The top three items collected by the Seabins were small anthropogenic debris categories: hard fragments, film, and pellets. This finding is interesting, as most TCDs, including the Seabin, were not designed to target microplastics (Schmaltz et al. 2020). Schmaltz et al. 2020 report that 81.5% of plastic pollution collection technologies focus only on macroplastics. Our findings suggest that existing TCDs can be a valuable mitigation strategy for microplastics, which is important as researchers have shown the negative effects of microplastics on freshwater organisms (Alimba and Faggio 2019; De Felice et al. 2019; Guimarães et al. 2021). However, it should also be noted that with the ability to capture microplastics, there is also the risk to capture and unintentionally trap biota (Falk-Andersson et al. 2020). During our TCD season, we experienced the unintentional collection of some biota such as juvenile fish, phytoplankton, and a juvenile turtle (the turtle was alive and safely released). In our case, these occurrences were rare. But, whenever biota is seen in a TCD, we suggest noting down what was found and the quantity. These records can be used to inform future strategies to reduce effects, such as moving TCDs to other locations or taking them out during certain times of year when risk is high.
Moreover, data collection can inform upstream solutions. Over the 19-week period, our Seabins diverted approximately 11 000 pre-production pellets, suggesting a focus on the industrial emission of pellets. This finding supports previous research suggesting upstream industrial facilities as a source of plastic contamination in the region (Corcoran et al. 2015; Ballent et al. 2016). Combined, this indicates a need for policies to prevent pellet loss at production sites and during storage and transport. TCDs can be a best management practice at the point of manufacturing to facilitate reduced pellet loss to the environment.
In addition to pellets, our Seabins collected over 40 different categories of anthropogenic debris, both large and small. Large films were one of the top 10 items collected (Table 1) and are often associated with degraded food packaging or agriculture mulch films (Ocean Conservancy 2020; Huang et al. 2020). This suggests local littering of food packaging and a potential need for more local garbage bins, educational campaigns, or bans on single-use plastic items. Cigarette butts were another top 10 items collected and are a major source of litter in many urban areas (Araujo and Costa 2019; Ocean Conservancy 2020). Research has shown that although many citizens recognize cigarette butts as litter, over 75% of smokers litter them after use (Patel et al. 2012; Rath et al. 2012). Educational campaigns, increased amounts of ash trays for proper disposal, and degradable filters could be upstream solutions. Here, we show that data can inform upstream solutions—allowing TCDs to be effective for both cleanup and prevention.
Trapping trash: assessing our Seabin methodology
Our assessments suggest we have developed effective and efficient protocols to quantify and characterize the litter found in TCDs. Previous discussions with other groups who had a TCD suggested they were taking 6–7 h to characterize their catch. Our methodology speeds up the process with a simple extraction and subsampling. Of course, because we subsample, we may miss some of the detail of what is captured in a device. However, through validating our extraction methodology, we found it has a decent recovery rate of 60.6%, and that the data are representative to the diversity of debris collected. In addition, the subsampling method has a very low error rate when compared to the manual count. Our protocol provides enough accuracy and is time-efficient, which lessens the risk of community scientists losing motivation (Rambonnet et al. 2019).
Because small debris gets entangled in aquatic plants and algae, our extraction procedure did not capture all pieces of debris. The anthropogenic debris most unaccounted for were small anthropogenic debris: film and hard fragments. This may be due to the transparency of film as it is often hard to see when present on the plant material. Moreover, the morphology of some of the hard fragments and film may make them more adherent to the plant material and more likely to avoid separation even with the force of a high-pressured hose. Although this may present itself as a limitation, it brings light to the relationship between microplastics and aquatic macrophytes, which has been understudied yet stated to have an important role in the behaviour and fate of microplastics in aquatic systems (Kalcikova 2020).
To further explore this relationship, we ran regressions with the mass of plant material and count of small anthropogenic debris. The strong positive and significant correlation (adjusted R2 = 0.68, p = 0.0002, Fig. S5) we observed suggests that aquatic macrophytes are a natural aggregator of anthropogenic debris, specifically microplastics that may otherwise be lost by TCDs due to a larger mesh size or other mechanisms for trapping trash that excludes small particles. The mechanism of aggregation by the plant material is unknown, but research suggests it may be driven by electrostatic interactions between plant cells and microplastics, leaf morphology, and the presence of periphyton (Kalcikova 2020). The interactions between microplastics and seagrass have been studied and shown to be potential vectors of microplastics through encrusting microplastics via epibionts. This allows them to naturally trap plastics when they create balls made of natural aggregates of vegetal fibres (Goss et al. 2018; Sanchez-Vidal et al. 2021). This highlights the importance for further work to understand the potential of aquatic macrophytes and their mechanisms acting as a natural TCD. Seasonality may be a significant variable in aiding the amount of plastics and microplastics caught by a TCD, as the density of plant material changes seasonally.
Finally, our regression models can be used to extrapolate the mass and count of anthropogenic debris collected over a 24 h period. The models include total mass of both large and small anthropogenic debris (kg) and count of small anthropogenic debris. Users can choose how to report their data, but we suggest reporting the counts of the small anthropogenic debris as mass does not convey the magnitude of debris being removed from the devices. We acknowledge the variability of our regressions; however, with the expansion of reporting through our network, we believe this will increase the predictability and accuracy of the models. Reporting both measurements also allows for diversified uses of the data. For example, mass is necessary when computing plastic flows and budgets, while monitoring plastics in various environments is reported by the number observed (Smith and Turrell 2021). Lastly, as Seabins are targeted to marinas that are usually located in coastal harbours or shallow embayment with similar vegetation, we recognize our model is likely less applicable to other traps and locations and plan to collect more diverse data in the coming years to strengthen the model.
Worldwide application of the protocols: the International Trash Trap Network
To prevent the business-as-usual scenario for plastic pollution in 2030 predicted by Borelle et al. (2020), diverse initiatives must be implemented quickly. Along with reduced plastic production, better waste management, and beach cleanups, TCDs should be included as an additional solution. TCDs directly remove litter from our waterways 24 h a day and 7 days a week—robots never sleep.
To put TCDs to the task on a larger scale, we, the University of Toronto Trash Team (https://uofttrashteam.ca/), have created the International Trash Trap Network (ITTN; trashtrapnetwork.org) in collaboration with Ocean Conservancy. The goal of this network is to bring together independent stakeholder groups using any type of trash capture technology for global data collection, litter diversion, and impact. Within the network, our goal is that each group follow the simple data protocol and the detailed protocol to ensure standardized data collection. Eventually, these data can be collected using the CleanSwell app and linked to the open-access International Coastal Cleanup database.
At present, our protocols have only been tested with the Seabin and LittaTrap. We aim to collaborate and test our protocols with different devices and locations to ensure our subsampling is still representative of what is caught by each device. We intend to adapt our protocols for different devices as the network grows, and as new devices are developed. We also plan to increase the data that goes into our modeling so it is more globally representative.
The importance and necessity of open-access global databases have been highlighted at international plastic pollution conferences and in the peer-reviewed literature (Jambeck and Johnsen 2015; Kandziora et al. 2019). Various applications for data collection relevant to plastic pollution exist and allow people to collect and share cleanup and litter data, such as through Clean Swell, Marine Debris Tracker, and OpenLitterMap. Data from these global databases can inform policy, e.g., data from the Clean Swell app helped inform US adoption of the International Convention for the Prevention of Pollution from Ships (MARPOL 73/78Annex V) and the passage of the Microbead-Free Waters Act of 2015 (Ocean Conservancy 2011, 2016). By collecting data, we can also quantify the global impact of cleanup, inform source-reduction, and better understand baseline levels of contamination and how contamination changes over time.
Conclusion
Here, we introduce a framework for how groups can initiate and design their own trash-trapping project and create a network to connect all those motivated to reduce the plastic waste in their local aquatic systems. Our visual audit is a method to survey your watershed to inform where a TCD may be placed and what type of TCD is recommended. We also created two quantification and characterization protocols to measure the impact of local trash-trapping devices. We have also created tools for data collection, such as the custom-made app Data Trapper. These tools are free and available to the public to facilitate cleanup and community research. We envision our protocols and tools being used across the world for global scale cleanup and the data being shared in a public global database established by the ICC to quantify global impact and inform policy.
Acknowledgements
Funding for this study was provided by Environment and Climate Change Canada, National Geographic, and PortsToronto. We thank the team at PortsToronto and those at the Outer Harbour Marina for supporting us in the field and their guidance with the Seabin. We would like to thank Madeleine Milne and Anusha Srinivasan for conducting the visual audits with us; Alice Zhu, Su’aad Juman-Yassin, and Alishba Afaq for helping collect Seabin samples; and Susan Debreceni for providing tools and resources for outreach and communication.
References
Alimba C.G., Faggio C. 2019. Microplastics in the marine environment: current trends in environmental pollution and mechanisms of toxicological profile. Environmental Toxicology and Pharmacology, 68: 61–74.
Allen S., Allen D., Phoenix V.R., Le Roux G., Durántez Jiménez P., Simonneau A., et al. 2019. Atmospheric transport and deposition of microplastics in a remote mountain catchment. Nature Geoscience, 12(5): 339–344.
Araújo M.C., Costa M.F. 2019. A critical review of the issue of cigarette butt pollution in coastal environments. Environmental Research, 172: 137–149.
Ballent A., Corcoran P.L., Madden O., Helm P.A., Longstaffe F.J. 2016. Sources and sinks of microplastics in Canadian Lake Ontario nearshore, tributary and Beach sediments. Marine Pollution Bulletin, 110(1): 383–395.
Barnes D.K., Galgani F., Thompson R.C., Barlaz M. 2009. Accumulation and fragmentation of plastic debris in global environments. Philosophical Transactions of the Royal Society B: Biological Sciences, 364(1526): 1985–1998.
Borrelle S.B., Ringma J., Law K.L., Monnahan C.C., Lebreton L., McGivern A., et al. 2020. Predicted growth in plastic waste exceeds efforts to mitigate plastic pollution. Science, 369(6510): 1515–1518.
Borrelle S.B., Rochman C.M., Liboiron M., Bond A.L., Lusher A., Bradshaw H., Provencher J.F. 2017. Opinion: why we need an international agreement on marine plastic pollution. Proceedings of the National Academy of Sciences, 114(38): 9994–9997.
Bucci K., Tulio M., Rochman C.M. 2020. What is known and unknown about the effects of plastic pollution: a meta-analysis and systematic review. Ecological Applications, 30(2).
Corcoran P.L., Norris T., Ceccanese T., Walzak M.J., Helm P.A., Marvin C.H. 2015. Hidden plastics of Lake Ontario, Canada and their potential preservation in the sediment record. Environmental Pollution, 204: 17–25.
De Felice B., Sabatini V., Antenucci S., Gattoni G., Santo N., Bacchetta R., et al. 2019. Polystyrene microplastics ingestion induced behavioral effects to the Cladoceran Daphnia magna. Chemosphere, 231: 423–431.
Elhacham E., Ben-Uri L., Grozovski J., Bar-On Y.M., Milo R. 2020. Global human-made mass exceeds all living biomass. Nature, 588(7838): 442–444.
Emmerik T., Schwarz A. 2019. Plastic debris in rivers. WIREs Water, 7(1).
Eriksen M., Mason S., Wilson S., Box C., Zellers A., Edwards W., et al. 2013. Microplastic pollution in the surface waters of the Laurentian Great Lakes. Marine Pollution Bulletin, 77(1–2): 177–182.
Everaert G., De Rijcke M., Lonneville B., Janssen C.R., Backhaus T., Mees J., et al. 2020. Risks of floating microplastic in the global ocean. Environmental Pollution, 267: 115499.
Falk-Andersson J., Haarr M.L., Havas V. 2020. Basic principles for development and implementation of plastic clean-up technologies: what can we learn from fisheries management? Science of The Total Environment, 745: 141117.
Gall S.C., Thompson R.C. 2015. The impact of debris on marine life. Marine Pollution Bulletin, 92(1–2): 170–179.
Garcia B., Fang M.M., Lin J. 2019. All hands on deck: addressing the global marine plastics pollution crisis in Asia. SSRN Electronic Journal.
Gontard N., Guilbert S. 1994. Bio-packaging: technology and properties of edible and/or biodegradable material of agricultural origin. Food Packaging and Preservation, 159–181.
Goss H., Jaskiel J., Rotjan R. 2018. Thalassia testudinum as a potential vector for incorporating microplastics into benthic marine food webs. Marine Pollution Bulletin, 135: 1085–1089.
Grbić J., Helm P., Athey S., Rochman C.M. 2020. Microplastics entering Northwestern Lake Ontario are diverse and linked to urban sources. Water Research, 174: 115623.
Guimarães A.T., de Lima Rodrigues A.S., Pereira P.S., Silva F.G., Malafaia G. 2021. Toxicity of polystyrene nanoplastics in dragonfly larvae: an insight on how these pollutants can affect bentonic macroinvertebrates. Science of the Total Environment, 752: 141936.
Helinski O.K., Poor C.J., Wolfand J.M. 2021. Ridding our rivers of plastic: a framework for plastic pollution capture device selection. Marine Pollution Bulletin, 165: 112095.
Huang Y., Liu Q., Jia W., Yan C., Wang J. 2020. Agricultural plastic mulching as a source of microplastics in the terrestrial environment. Environmental Pollution, 260: 114096.
Jambeck J.R., Johnsen K. 2015. Citizen-based litter and marine debris data collection and mapping. Computing in Science & Engineering, 17: 20–26.
Kalčíková G. 2020. Aquatic vascular plants—a forgotten piece of nature in Microplastic Research. Environmental Pollution, 262: 114354.
Kandziora J.H., van Toulon N., Sobral P., Taylor H.L., Ribbink A.J., Jambeck J.R., Werner S. 2019. The important role of marine debris networks to prevent and reduce ocean plastic pollution. Marine Pollution Bulletin, 141: 657–662. Available from https://www.sciencedirect.com/science/article/pii/S0025326X19300499.
Leone G., Catarino A.I., Pauwels I., Mani T., Tishler M., Egger M., et al. 2022. Integrating Bayesian belief networks in a toolbox for decision support on plastic clean-up technologies in rivers and estuaries.Environmental Pollution, 296: 118721.
Munno K., Helm P.A., Rochman C.M., George T., Jackson D.A. 2021. Microplastic contamination in Great Lakes fish. Conservation Biology, 36: e13794.
Ocean Conservancy 2020. Trash Information and Data for Education and Solutions (TIDES). Available from: https://www.coastalcleanupdata.org/.
Ocean Conservancy. 2016. 30th anniversary international coastal cleanup. Washington, DC, USA. Available from https://oceanconservancy.org/wp-content/uploads/2017/04/2016-Ocean-Conservancy-ICC-Report.pdf.
Ocean Conservancy. 2011. Tracking trash 25 years of action for the ocean, international coastal cleanup. Washington, DC, USA. Available from https://oceanconservancy.org/wp-content/uploads/2017/04/2011-Ocean-Conservancy-ICC-Report.pdf [accessed 2 November 2022].
Patel V., Thomson G.W., Wilson N. 2012. Cigarette butt littering in city streets: a new methodology for studying and results: table 1. Tobacco Control, 22(1): 59–62.
Rambonnet L., Vink S.C., Land-Zandstra A.M., Bosker T. 2019. Making citizen science count: best practices and challenges of citizen science projects on plastics in aquatic environments. Marine Pollution Bulletin, 145: 271–277.
Rath J.M., Rubenstein R.A., Curry L.E., Shank S.E., Cartwright J.C. 2012. Cigarette litter: smokers’ attitudes and behaviors.International Journal of Environmental Research and Public Health, 9(6): 2189–2203.
Sanchez-Vidal A., Canals M., de Haan W.P., Romero J., Veny M. 2021. Seagrasses provide a novel ecosystem service by trapping marine plastics. Scientific Reports, 11(1).
Schmaltz E., Melvin E.C., Diana Z., Gunady E.F., Rittschof D., Somarelli J.A., et al. 2020. Plastic pollution solutions: emerging technologies to prevent and collect marine plastic pollution. Environment International, 144: 106067.
Smith L., Turrell W.R. 2021. Monitoring plastic beach litter by number or by weight: the implications of fragmentation. Frontiers in Marine Science, 8.
Swim Drink Fish. 2018. Lake Ontario waterkeeper’s Toronto Harbour monitoring. Report 3.0. Swim Drink Fish, Toronto.
Wang W., Ge J., Yu X., Li H. 2020. Environmental fate and impacts of microplastics in soil ecosystems: progress and perspective. Science of The Total Environment, 708: 134841.
Wright S.L., Thompson R.C., Galloway T.S. 2013. The physical impacts of microplastics on marine organisms: a review. Environmental Pollution, 178: 483–492.
Supplementary material
Supplementary Material 1 (DOCX / 1.60 MB).
- Download
- 1.61 MB
Supplementary Material 2 (XLSX / 63.2 MB).
- Download
- 63.25 KB
Information & Authors
Information
Published In

FACETS
Volume 8 • January 2023
Pages: 1 - 12
Editor: Dawn Kellett
History
Received: 10 February 2022
Accepted: 16 January 2023
Version of record online: 29 May 2023
Copyright
© 2023 The Author(s). This work is licensed under a Creative Commons Attribution 4.0 International License (CC BY 4.0), which permits unrestricted use, distribution, and reproduction in any medium, provided the original author(s) and source are credited.
Data Availability Statement
The primary data are available within the Supporting Materials.
Key Words
Sections
Subjects
Plain Language Summary
Increasing our community cleanup and data collection efforts through Trash Capture Devices
Authors
Author Contributions
Conceptualization: CS, RFG, MD, CMR
Data curation: CS, RFG
Formal analysis: CS
Funding acquisition: MD, CMR
Methodology: CS, RFG, MD, CMR
Project administration: CMR
Supervision: CMR
Visualization: CS
Writing – original draft: CS
Writing – review & editing: CS, RFG, MD, CMR
Competing Interests
The authors declare there are no competing interests.
Metrics & Citations
Metrics
Other Metrics
Citations
Cite As
Cassandra Sherlock, Rafaela F. Gutierrez, Michael David, and Chelsea M. Rochman. 2023. A methodology for quantifying and characterizing litter from trash capture devices (TCDs) to measure impact and inform upstream solutions. FACETS.
8(): 1-12. https://doi.org/10.1139/facets-2022-0034
Export Citations
If you have the appropriate software installed, you can download article citation data to the citation manager of your choice. Simply select your manager software from the list below and click Download.
There are no citations for this item