Assessing the representation of species included within the Canadian Living Planet Index
Abstract
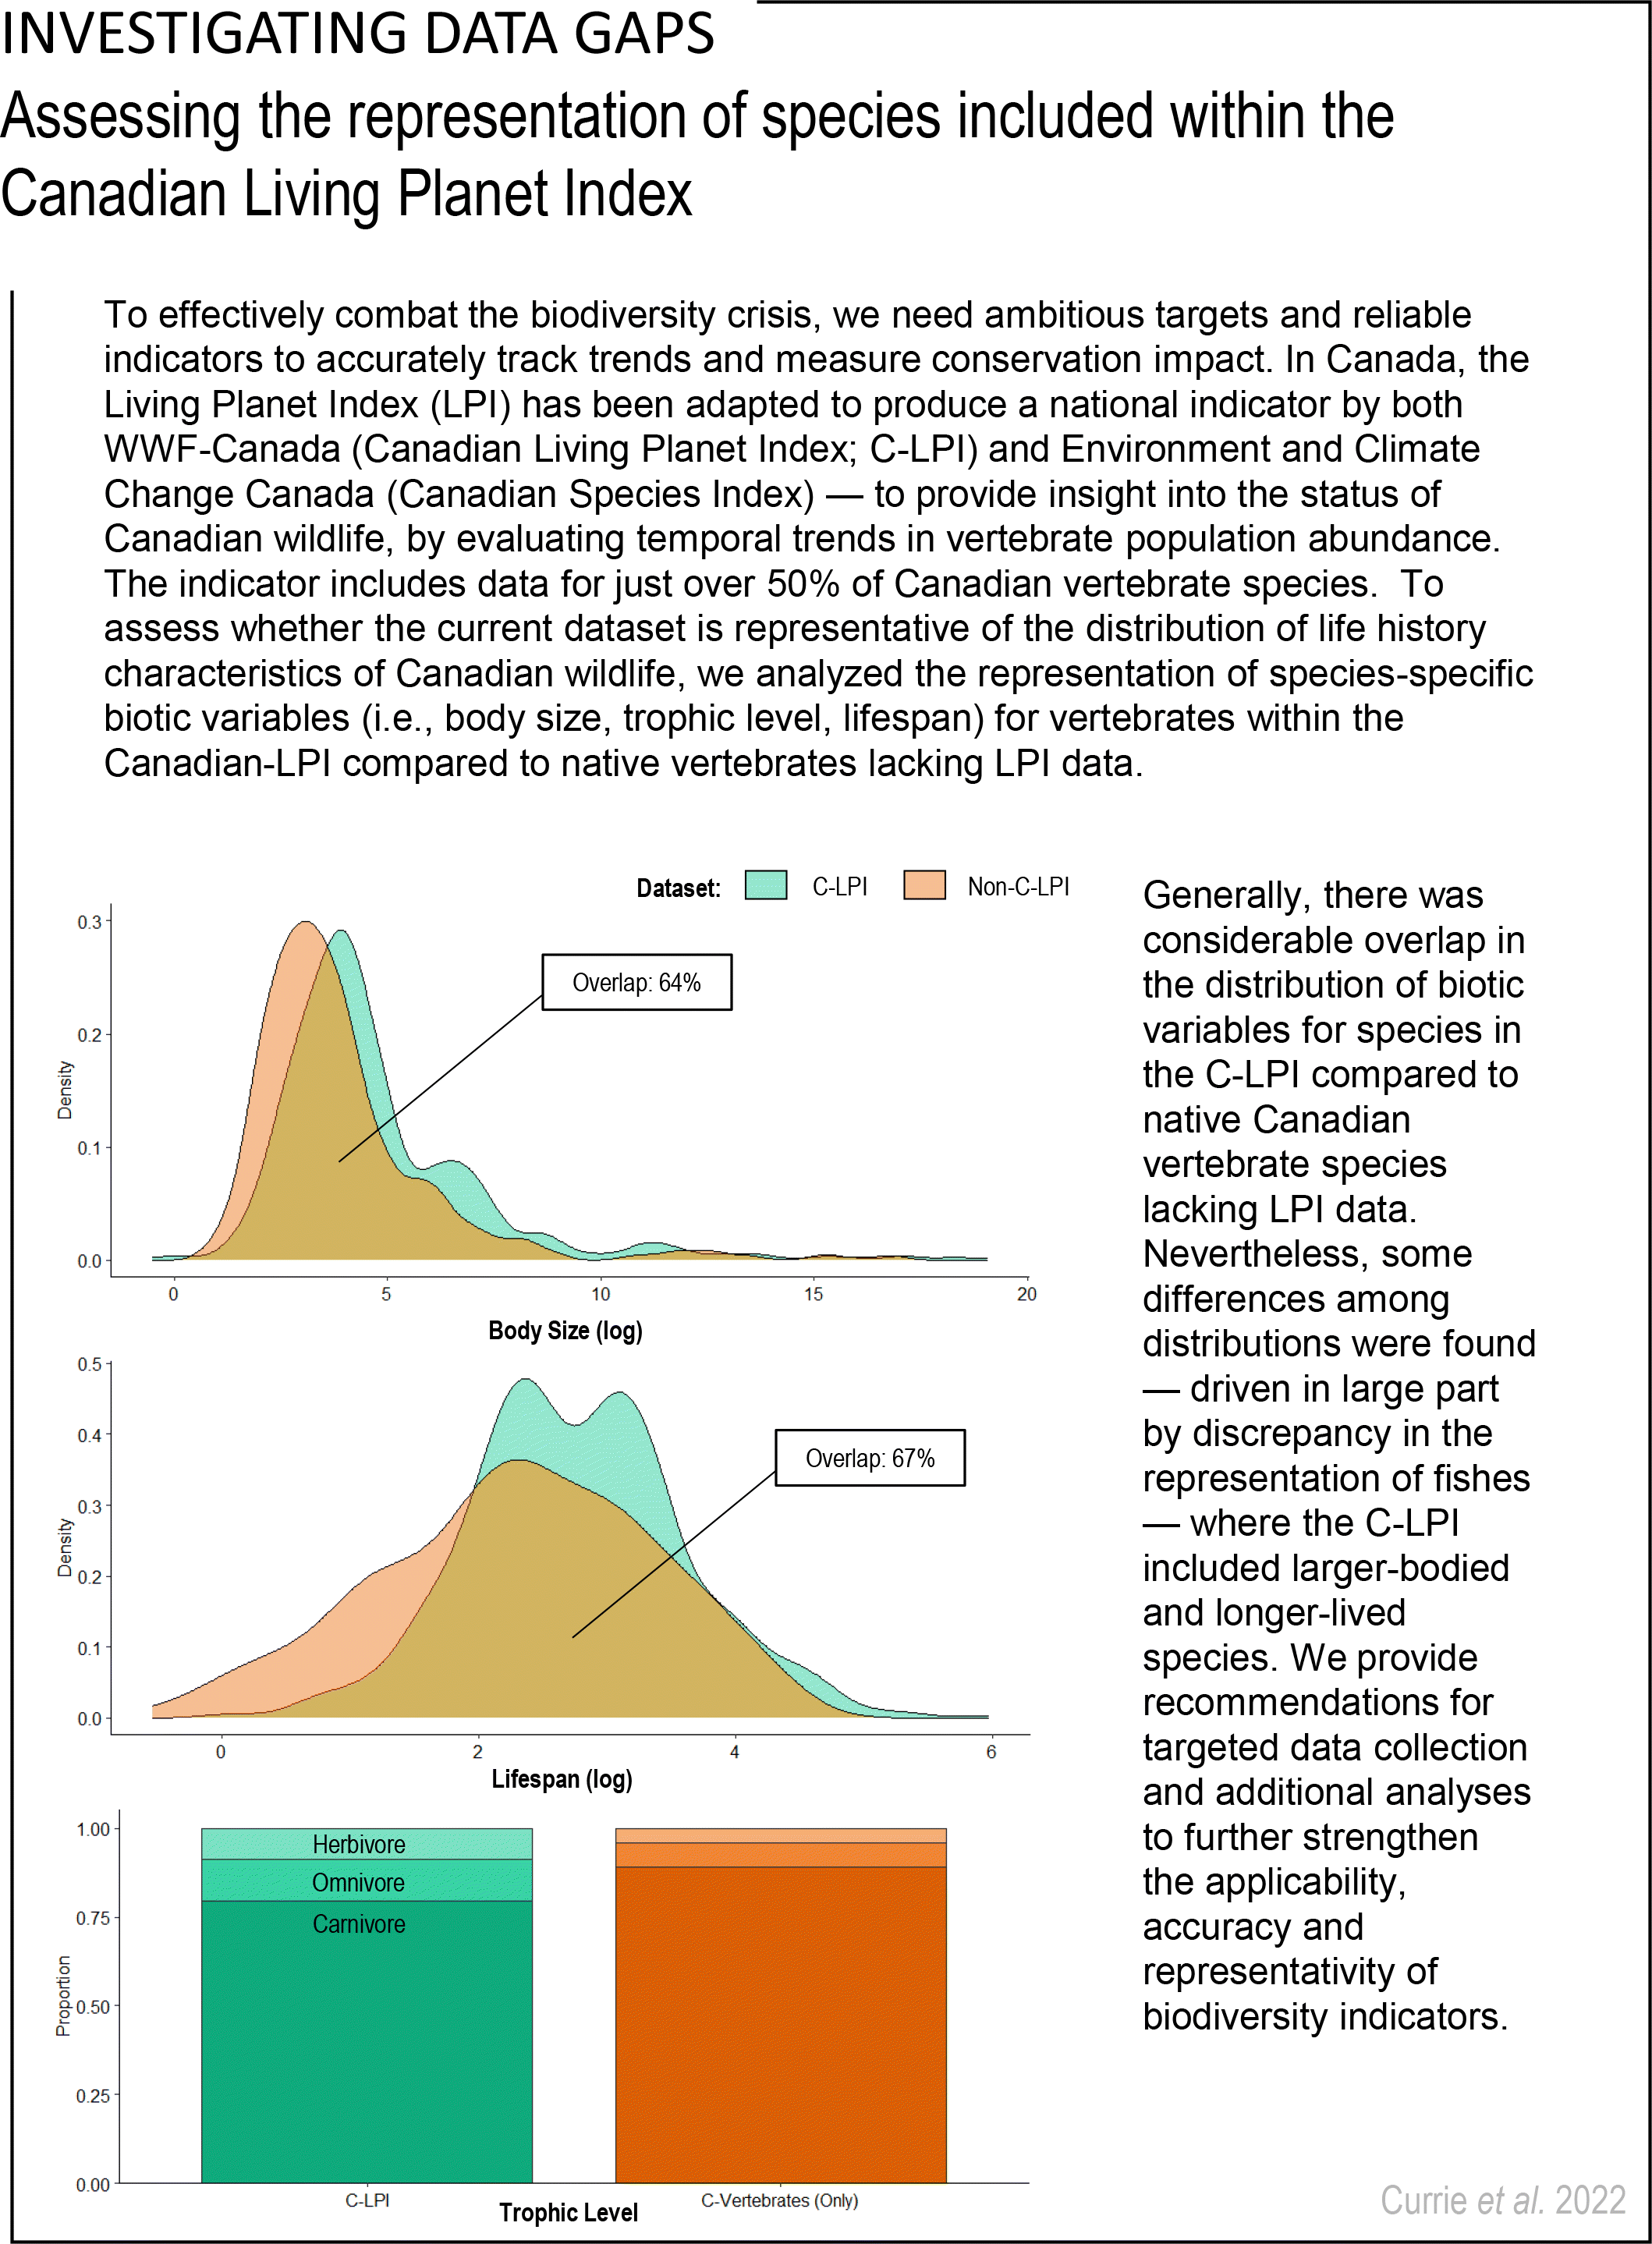
To effectively combat the biodiversity crisis, we need ambitious targets and reliable indicators to accurately track trends and measure conservation impact. In Canada, the Living Planet Index (LPI) has been adapted to produce a national indicator by both World Wildlife Fund-Canada (Canadian Living Planet Index; C-LPI) and Environment and Climate Change Canada (Canadian Species Index) to provide insight into the status of Canadian wildlife, by evaluating temporal trends in vertebrate population abundance. The indicator includes data for just over 50% of Canadian vertebrate species. To assess whether the current dataset is representative of the distribution of life history characteristics of Canadian wildlife, we analyzed the representation of species-specific biotic variables (i.e., body size, trophic level, lifespan) for vertebrates within the C-LPI compared to native vertebrates lacking LPI data. Generally, there was considerable overlap in the distribution of biotic variables for species in the C-LPI compared to native Canadian vertebrate species lacking LPI data. Nevertheless, some differences among distributions were found, driven in large part by discrepancy in the representation of fishes—where the C-LPI included larger-bodied and longer-lived species. We provide recommendations for targeted data collection and additional analyses to further strengthen the applicability, accuracy, and representativity of biodiversity indicators.
Graphical Abstract
Introduction
Combatting the biodiversity crisis requires ambitious targets, widespread action, and reliable indicators to accurately track the impact of conservation intervention and progress towards national (e.g., Canada’s Federal Sustainable Development plan) and international (e.g., Convention on Biological Diversity) goals. The Living Planet Index (LPI)—conceived nearly 25 years ago—is a biodiversity indicator used to evaluate the state of wildlife by assessing temporal trends in vertebrate population abundance. The indicator has been applied at global (WWF 2020), regional (see for example McRae et al. 2012), and national (Bayraktarov et al. 2020, Marconi et al. 2021) geographic scales and used as a public engagement and advocacy tool to motivate wildlife conservation (Ledger et al. 2021; in preparation).
Recently the discourse in the literature in relation to the LPI has been heightened, with papers exploring biases pertaining to the underlying data and calculation of aggregate measures (Leung et al. 2020; Buschke et al. 2021; Leung et al. 2022a; Leung et al. 2022b; Leung et al. 2022c; Loreau et al. 2022; Murali et al. 2022; Puurtinen et al. 2022). For instance, random population fluctuations (Buschke et al. 2021) and extreme population trends, particularly declines, (i.e., outliers; Leung et al. 2020) introduce biases that can exaggerate declines in the global LPI. Despite these biases, the effect of random population fluctuations does not detract from global LPI messaging of substantial declines in average vertebrate population abundance (Buschke et al. 2021). Similarly, recent research has also noted that the removal of extreme population declines and increases (i.e., removing outliers from both tails of the distribution) has little effect on the overall LPI (Murali et al. 2022). Consequently, while biases can exist, the utility of the LPI and the messaging remains clear—nature is deteriorating (IPBES 2019; WWF 2020). Nevertheless, these nuances around interpreting the LPI are also accompanied by calls for greater monitoring to address data gaps and ensure adequate representation of global biodiversity (Leung et al. 2022b; Murali et al. 2022).
In Canada, the LPI methodology has been adapted to produce a biodiversity indicator within a national context by both World Wildlife Fund-Canada (Canadian Living Planet Index; C-LPI) (WWF-Canada 2020) and Environment and Climate Change Canada (Canadian Species Index; CSI) (ECCC 2019). These indicators reveal near-stable trends of vertebrate population abundance since 1970, on average (+6% (C-LPI) and −4% (CSI), owing to differences among data selection). The dataset underlying the C-LPI, largely publicly available via the LPI database (livingplanetindex.org) and continuously augmented, now incorporates thousands of time series from more than 900 vertebrate species, representing 50.9% of native vertebrate species in Canada (CESCC 2016). Marconi et al. (2021) analyzed the taxonomic and spatial representation of the dataset behind the indicator and showed that Canadian birds are better represented in comparison to other taxonomic groups. However, it is also important to know whether species currently included in the C-LPI database are representative of the distributions of biological and ecological traits observed in the broader set of vertebrate species that occur in Canada.
The biases in available data broadly reflect the biases in biodiversity research more generally (Donaldson et al. 2016, Troudet et al. 2017). Monitoring is important (Tittensor et al. 2014), and additional data collection is key to establishing accurate trends in currently monitored species. However, it seems unlikely that there will be sufficient data to provide us with an unbiased picture of biodiversity trends overall, at least in the short-term, despite calls to address data gaps (e.g., Leung et al. 2022b; Murali et al. 2022). In the meantime, intrinsic (biological) and extrinsic (ecological) traits may provide information on species’ vulnerability to anthropogenic threats and therefore on their predicted population trends and risk of extinction (see Chichorro et al. 2019 for a comprehensive review). Without insight into some of the characteristics of the species that are not currently monitored (i.e., insight into data gaps), however, we may be wrongly estimating the direction and magnitude of temporal trends in population abundance.
Here we analyze the representation of species-specific biotic variables for vertebrates within the C-LPI compared to native vertebrate species lacking LPI data to assess whether the current dataset is representative of the distribution of life history characteristics of Canadian wildlife. Importantly, the alignment of biotic traits for vertebrates within the C-LPI, compared to those lacking LPI data, will help to identify biases in the underlying data that may affect the utility of the C-LPI at a national level, particularly as an ecological indicator to track progress towards biodiversity goals. In addition to assessing the distribution of common biotic variables among taxa, we collated data for a variety of supplementary biotic variables that we are making publicly available for future analyses.
Methods
Species list
Canadian Living Planet Index
We used the data underlying the C-LPI (WWF-Canada 2020). These data are also included within the global LPI Data Portal (livingplanetindex.org/data_portal; except records that were provided to the LPI team under the agreement they would be kept confidential, e.g., data for sensitive populations or at-risk species), a repository that contains thousands of records depicting temporal changes in vertebrate abundance. The data have been collated from a variety of sources, including peer-reviewed publications, government databases, and grey literature. The criteria for inclusion within the dataset are as follows: (i) the data have been collected using comparable methods for at least two years for the same population (aligns with the global LPI and CSI methodology, the C-LPI methodology has recently been improved to limit inclusion to populations that have at least three years of data collection); (ii) data are specific to units of population size, either a direct measure such as population counts, densities, or indices, or a reliable proxy such as breeding pairs, nests, tracks, capture per unit effort or measures of biomass for a single species; and (iii) the source is referenced and traceable (Collen et al. 2009). Species classified as “presumed extirpated”, “probably extirpated” or “not applicable” by the Wild Species Report (CESCC 2016) have been excluded from the dataset. The latter category includes exotic species, hybrids, or species occurring infrequently and unpredictably in Canada. Non-native species are excluded from the dataset. These criteria resulted in a final subset of 906 vertebrate species that commonly occur in Canada.
Native Canadian vertebrates
Species listed within the 2015 Wild Species Reports (CESCC 2016) were compiled into a complementary dataset to compare traits of species within the C-LPI (dataset: C-LPI), to the broader group of native vertebrates found in Canada (dataset: C-Vertebrates) and those lacking LPI data (dataset: C-Vertebrates Only). Species were sorted according to binomial scientific name. We included native Canadian species with applicable conservation status (i.e., exotic species, hybrids, and accidental species under the NatureServe rank of “not applicable” were excluded). Discrepancies in nomenclature between the C-LPI taxonomic authorities and Wild Species Reports (CESCC 2016) necessitated evaluation of 58 species, which were resolved for comparison using the taxize R package (Chamberlain et al. 2020). For some species, we matched those that had synonymous binomial scientific names; others were resolved to address discrepancies between North American (greater species specificity) and global (where species are sometimes lumped together) nomenclature. In total, there are 1,779 extant, native vertebrate species in Canada—more than half of which (n = 906) have population trend data within the broader C-LPI dataset.
Biotic variables
Abiotic and biotic species trait data (i.e., life history characteristics, habitats and threats) were extracted from a variety of publicly accessible online databases for birds (Table S1; Myhrvold et al. 2015; Sheard et al. 2020), fishes (Table S2; Froese and Pauly 2016), mammals (Table S3; Wilman et al. 2014; Myhrvold et al. 2015), and amphibians and reptiles (Table S4; Myhrvold et al. 2015; Oliveira et al. 2017; Santini et al. 2018; Grubler 2020). Data extraction was conducted separately for each taxon, given differences among ideal databases, common variables, and units reported across taxonomic groups. For instance, length was typically recorded for fishes and herpetofauna (Froese and Pauly 2016, Santini et al. 2018), while mass was more commonly reported for birds and mammals (Myhrvold et al. 2015). For each taxonomic group, variables with sufficient data were mapped onto species from the C-LPI according to binomial scientific name using the traitdata (RS-eco 2021; birds, mammals, herpetofauna), squamata (Grubler 2020; herpetofauna), and fishbase (Boettiger et al. 2012; fishes) R packages—creating multi-variable datasets that are now publicly available for future analyses. The code and extracted data for Canadian vertebrates can be found online (Currie et al. 2022). Note that only body size, lifespan, and trophic level were included in our analysis as they had broad taxonomic coverage, but additional traits with sufficient species coverage were also extracted for public interest and use. Moreover, the available code can be adapted to extract additional traits of interest from the available databases. Details on data extraction for biotic variables with sufficient species coverage, by taxon, are found below.
Birds
Five biotic variables were selected for inclusion within the C-LPI Bird Trait database (Table S1), based upon data availability. Using the R package traitdata (RS-eco 2021), adult body mass, lifespan (maximum longevity), and mean longevity were extracted from the Amniote database (Myhrvold et al. 2015). Data on body mass were also available from the EltonTraits database (Wilman et al. 2014), but the Amniote database (Myhrvold et al. 2015) was selected as the primary source given the quality of its metadata (i.e., more extensive). Average values per species were calculated for each biotic variable. In addition, hand-wing index (i.e., a measure of wing aspect ratio and a proxy for dispersal ability) and dietary guild were extracted from the Global Hand-Wing Index repository (Sheard et al. 2020). Dietary guild categories were aligned to trophic level categorization (carnivore, omnivore, and herbivore). One species (turkey vulture, Cathartes aura) was assigned to the carnivore category as it almost exclusively feeds on carrion.
Fishes
Data were extracted from FishBase (Froese and Pauly 2016) using the R package rfishbase (Boettiger et al. 2012). Fourteen biotic variables were selected for inclusion within the C-LPI Fishes Trait database (Table S2), including length, weight, and lifespan. Average values per species were calculated for each biotic variable.
Mammals
Gestation period and lifespan (maximum longevity) were retrieved from the Amniote database (Myhrvold et al. 2015) using the R package traitdata (RS-eco 2021), while body size and diet were extracted from EltonTraits (Wilman et al. 2014). In total, four biotic variables were selected for inclusion within the C-LPI Mammal Trait database, including body mass, trophic level, gestation period, and lifespan (Table S3). Mammal trophic level was calculated using diet composition, where herbivore was defined as species associated with an entirely vegetarian diet (e.g., plants, seeds, nectar, and fruit), carnivores were classified as species that consume other animals, and omnivores included species with mixed diets.
iv. Amphibians & Reptiles
Seven biotic variables were selected for inclusion within the C-LPI Amphibian and Reptile Trait database (Table S4), including variables related to body size, diet, and reproduction. Data were extracted from AmphiBIO (Oliveira et al. 2017), the Amniote database (Myhrvold et al. 2015, Meiri 2018; Santini et al. 2018, Atwood et al. 2020), and SquamataBase (Grubler 2020) using traitdata (RS-eco 2021) and squamatabase (Grubler 2020) R packages. Trait data that were comparable across datasets (e.g., body mass) were hierarchically extracted. For example, body mass was first extracted from AmphiBIO (Oliveira et al. 2017), then from the amniote life history database (Myhrvold et al. 2015) for species that lacked data in AmphiBIO. Because multiple entries were available per species within the amphibian allometry database (Santini et al. 2018), values with the highest sample sizes were selected for inclusion. Amphibians and reptiles were grouped together as herpetofauna to improve sample size for analysis.
We also endeavored to extract of abiotic variables for this analysis—including species’ geographic ranges and average topographic and climate variables within those ranges. However, due to a lack of data coverage, we did not include these variables within our analysis. Nevertheless, the code and associated data can be found online.
Analyzing the representation of biotic variables
Three biotic variables with sufficient cross-taxa information were selected from the taxon-specific datasets to create a more fulsome cross-taxa database. The selection of traits was dependent upon a combination of (i) data availability within and across taxa and (ii) considerations on the available evidence of relationships between a trait and population declines and (or) extinction risk. For instance, call frequency and positioning are traits used to evaluate amphibian tolerance to anthropogenic pressures (e.g., Liu et al. 2021) but are not applicable biotic traits for fishes.
Furthermore, biodiversity loss is not random (Dirzo et al. 2014) and functional traits, specifically, covary with patterns in biodiversity trends (Munstermann et al. 2021; Dirzo et al. 2014; Lee and Jetz 2010). Trait diversity can therefore result in a biased impact on ecosystem functioning (Diaz et al. 2006). For instance, body size is often a predictor of species loss, with large-bodied species particularly vulnerable (e.g., Dirzo et al. 2014; Seguin et al. 2014; Cardillo et al. 2005; Solan et al. 2004; Bennett and Owens 1997), though there has been mixed evidence dependent on taxonomic group (e.g., Chichorro et al. 2019; Kopf et al. 2016). Etard et al. (2020) found that while traits for mammals and birds are generally well-studied, there are gaps in information associated with reptiles and amphibians, making cross-taxa analyses more difficult. Moreover, a recent meta-analysis evaluating species traits and extinction risk identified body size as the most studied biotic trait, followed by fecundity and diet (Chichorro et al. 2019). Yet, while fecundity was often investigated, it was infrequently linked to patterns in biodiversity trends. Alternatively, longevity was less frequently studied, but had the second-highest biotic variable significance (following body size). Lifespan was also found to be an important predictor of extinction risk for freshwater megafauna (He et al. 2020). Likewise, we selected body size, longevity, and trophic level (i.e., diet) for our analysis based on the availability of information within and across taxonomic groups, as well as the evidence pertaining to relationship among these traits and biodiversity trends. While continuous traits are preferred for evaluating functional diversity (Laureto et al. 2015), the categorical trait of trophic level was applied to assess trends across taxonomic groups, based on the taxon-specific databases available.
Continuous variables of body size and lifespan were log-transformed, while trophic level included three categorical levels (herbivore, omnivore, carnivore). The overarching cross-taxa C-LPI Trait Database included 836 species, while the broader C-Vertebrate Trait Database included 1679 species.
Shapiro–Wilk tests were used to assess assumptions of normality for the continuous variables of body size and lifespan for species included within the C-LPI trait database and for other native Canadian vertebrate species lacking LPI data (C-Vertebrates Only) (Fig. S1). Given that the data generally exhibited skewed distributions, we applied two-sample nonparametric Kolmogorov–Smirnov (KS) tests to evaluate differences between the distribution of traits for species in the C-LPI Trait database and the C-Vertebrate (Only) Trait database. The widely used, asymptotic KS test measures distributional differences between two samples and has previously been applied to compare relationships among biotic variables (e.g., Adjeroud et al. 2007; Langlois et al. 2012; Cornwell et al. 2014). Importantly, we also assessed the percent overlap among distributions for continuous variables to evaluate the degree of differences in the distributions. These statistical tests were accompanied by a resampling approach to estimate differences in trait distributions between species in the C-LPI and C-Vertebrates (Only) datasets (see more below). We assessed the difference in categorical distribution of trophic level using Pearson’s χ2 tests. Fisher’s exact test was used to validate small-sized samples that ran into computational errors during the application of Pearson’s χ2 test (Kim 2017). All tests were performed for each biotic variable at the taxonomic level (i.e., birds, mammals, fish, amphibians and reptiles), and with all species combined.
Completeness of variables in our dataset ranged between 35.0% and 87.8%. Consequently, we also reran the analysis with a more complete dataset, imputing missing biotic trait values via nonparametric imputation using the Random Forest approach (Stekhoven and Buehlmann 2012) and an algorithm known as missForest (Stekhoven 2013). This approach helped to identify important predictors of body size, lifespan, and trophic level using the additional biotic trait information that was extracted for each taxonomic group. The Random Forest approach permits biotic trait data imputation (i.e., estimation of missing data with complex relationships among multiple variables; e.g., Debastiani et al. 2021) and can deal with both continuous and categorical data to develop a more complete dataset for analysis (Stekhoven and Buehlmann 2012).
To supplement our analysis of the two continuous traits (body size and lifespan), we applied a nonparametric bootstrapping approach to generate 95% compatibility intervals (95% CIs) on the median difference between datasets (i.e., the effect size; Cohen 1994; Ho et al. 2019). Bootstrapping was done via randomized resampling with replacement (n = 5000 iterations) of the C-LPI and C-Vertebrate (Only) subsets of species-specific trait values to generate resamples equal in size to the original subsets. In addition, bootstrapping was performed twice: once using an unstratified approach in which all species were treated as a single sample without consideration for taxonomic representation and once using taxon-specific resampling in which data were sampled proportionally for each of the four vertebrate groups under consideration. We include the median and corresponding 95% CI on the difference between subsets for each of trait comparisons as a data-centered complement, and present Gardner–Altman estimation plots of these effects in the Supplementary Material.
Analyses and visualization were conducted using R statistical software (v. 4.1.1; R Core Team 2021), making use of the missforest (Stekhoven 2013), tidyverse (Wickham et al. 2019), dabestr (Ho et al. 2019), ggpubr (Kassambara 2020), effectsize (Ben-Schachar et al. 2020), data.table (Dowle and Srinivasan 2021), and traitdata (RS-eco 2021) packages.
All compiled trait data and associated code for this analysis are available through a Figshare repository (Currie et al. 2022).
Results
Dataset description
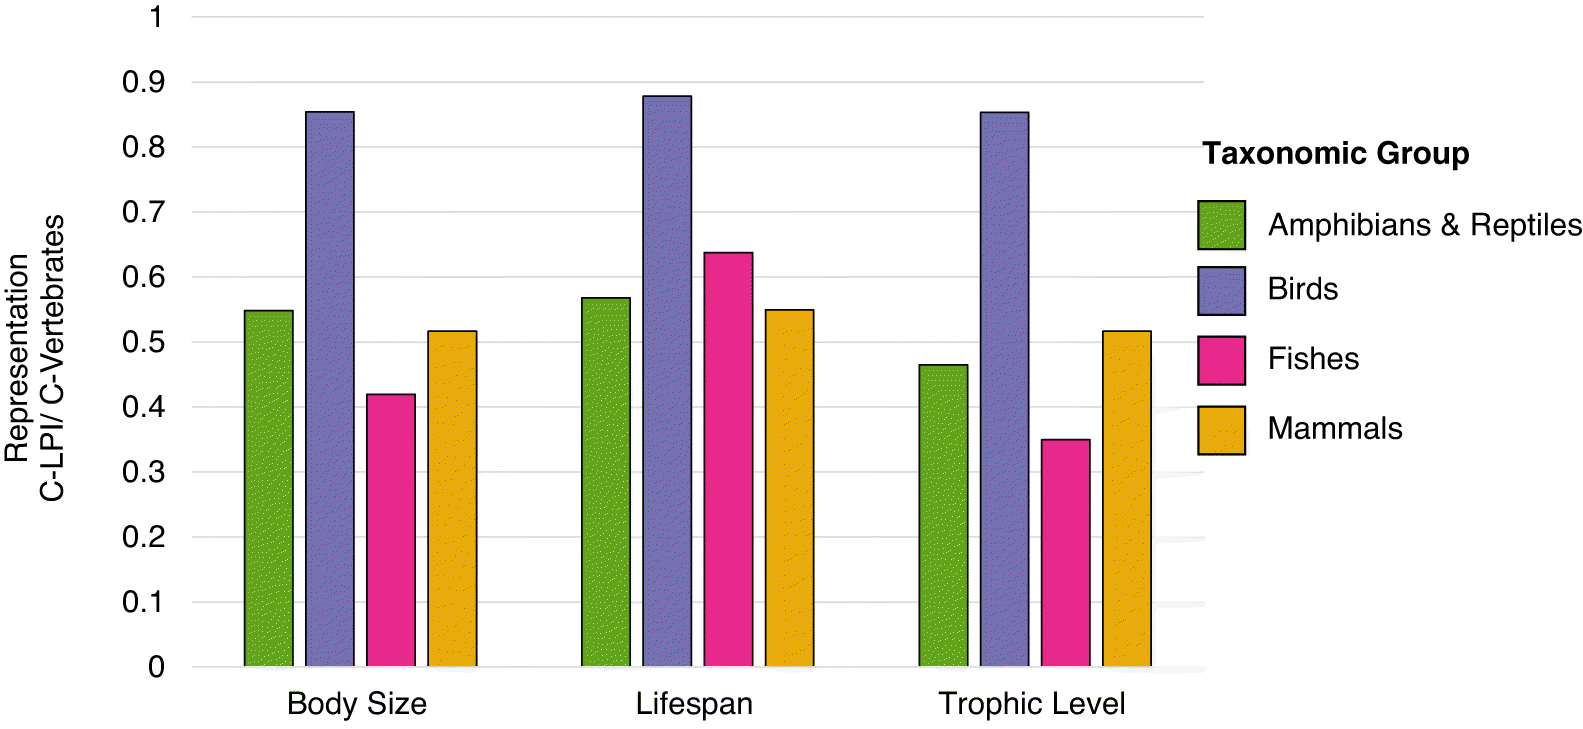
While the C-LPI contains data for 50.9% (906/1779) of native vertebrate species in Canada, not all of these species had available trait data (Table 1). In total, 49.8% (836/1679) of Canadian vertebrates with data for at least one biotic variable were included within the C-LPI Trait database, resulting in a trait database covering 92.3% of species (836 of 906) included in the C-LPI. Overall, birds tended to have the best data coverage in terms of both population time series and traits, with over 85% of species with trait data included within the C-LPI Trait database (Fig. 1). Birds were the best represented, while the representation of fish trait data was more variable; only 35.0% (352/1007) of fishes with available trait information were included within the C-LPI Trait database relative to the broader C-Vertebrates Trait database. In total, 629 species within the C-LPI Trait database, and 883 native Canadian vertebrate species lacking LPI data (C-Vertebrates Only) had trait data for all three biotic variables. Impressively, 94.4% (1679/1779) of native Canadian vertebrates were included in the analysis.
Table 1.
| Data Availability | Birds | Fish | Herps | Mammals | All |
|---|---|---|---|---|---|
| C-LPI (Representation in C-LPI, %) | 388 (42.8) | 370 (40.8) | 47 (5.2) | 101 (11.1) | 906 |
| C-Vertebrates (Representation in C-Vertebrates, %) | 453 (25.5) | 1044 (58.7) | 88 (4.9) | 194 (10.9) | 1779 |
| Species representation (%) | 85.7 | 35.4 | 53.4 | 52.1 | 50.9 |
| C-LPI Trait Database (Representation in C-LPI Trait Database, %) | 344 (41.1) | 352 (42.1) | 46 (5.5) | 94 (11.2) | 836 |
| C-Vertebrates Trait Database (Representation in C-Vertebrates Trait Database, %) | 404 (24.1) | 1007 (60.0 ) | 86 (5.1 ) | 182 (10.8) | 1679 |
| Species trait representation (%) | 85.1 | 35.0 | 53.5 | 51.6 | 49.8 |
| C-Vertebrates Only Trait Database (Representation in C-Vertebrates Only Trait Database, %) | 60 (7.1) | 655 (77.7) | 40 (4.7) | 88 (10.4) | 843 |
Fig. 1.
Representation of biotic variables
The distribution of body size, lifespan, and trophic level for species within the C-LPI were largely overlapping (> 64%) with the distribution of biotic variables for native Canadian vertebrate species lacking LPI data (C-Vertebrates Only) (Fig. 2; Table S5) and the broader vertebrate subphylum (>82%) nationally (i.e., including LPI species) (Table S6; Fig. S7). Despite the broad overlap, differences between distributions were found for body size (KS test statistic D: 0.23, p: < 2.2 × 10⁻¹⁶), lifespan (KS test statistic D: 0.20, p: 3.1 × 10⁻⁷), and trophic level (χ2: 28.96, df:2, p: 5.1 × 10⁻⁷), largely due to differences among fish distributions (Table S5)—the taxonomic group that contributed the most data yet had the poorest overlap in distributions (< 54%). Overall, there were a greater number of fishes with large body sizes (Fig. 3; average log body size: 3.93; average body size: 50.91) and long lifespans (Fig. 4; average log lifespan: 2.93; average lifespan: 18.73) compared to species lacking LPI data (average log body size: 3.56; average body size: 35.12; average log lifespan: 2.58; average lifespan: 13.20). Amphibians and reptiles exhibited the largest overlap in distributions for body size and lifespan among datasets (>67%), while fishes exhibited the poorest overlap (<54%). Although differences among trophic levels were detected when taxonomic groups were combined (Table S5; Fig. 2), there were fewer differences among datasets within each taxonomic group (Fig. 5). In addition, relationships among biotic variables were similar for species within the C-LPI and those lacking LPI data (C-Vertebrates Only) and appeared to be correlated (Fig. S2).
Fig. 2.
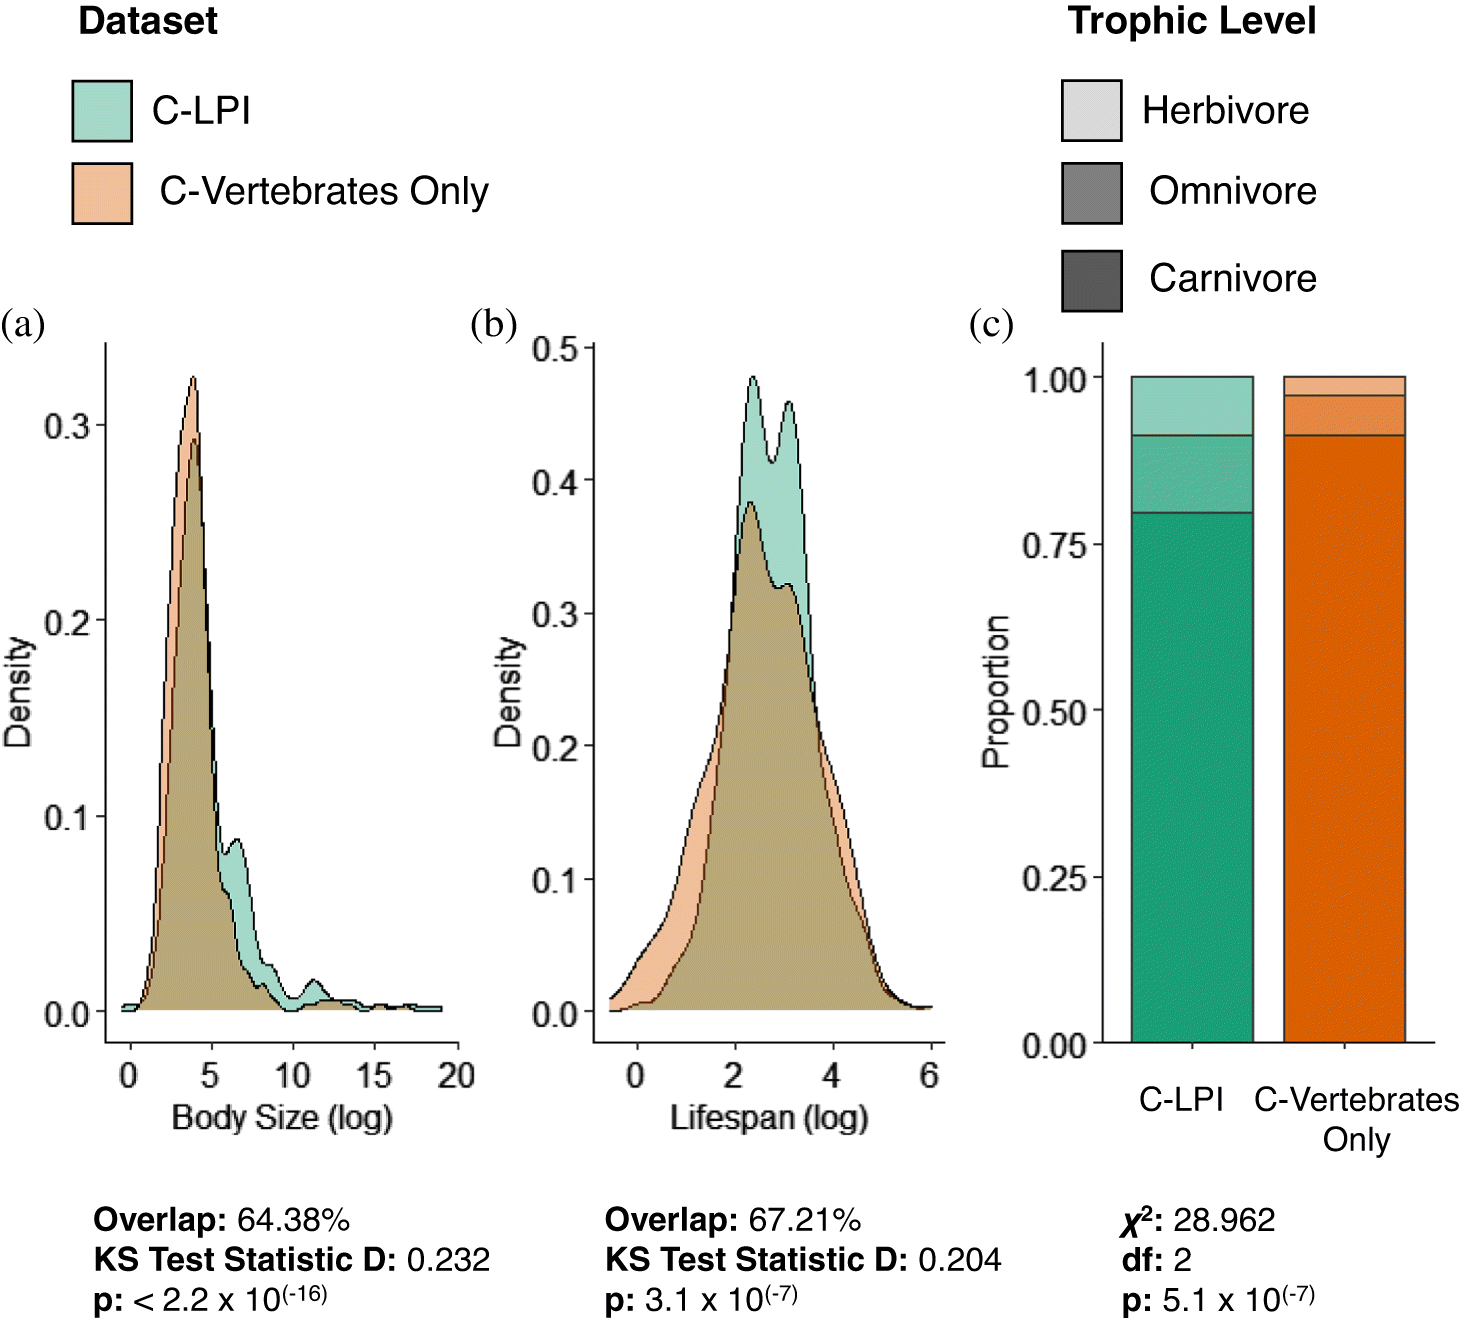
Fig. 3.
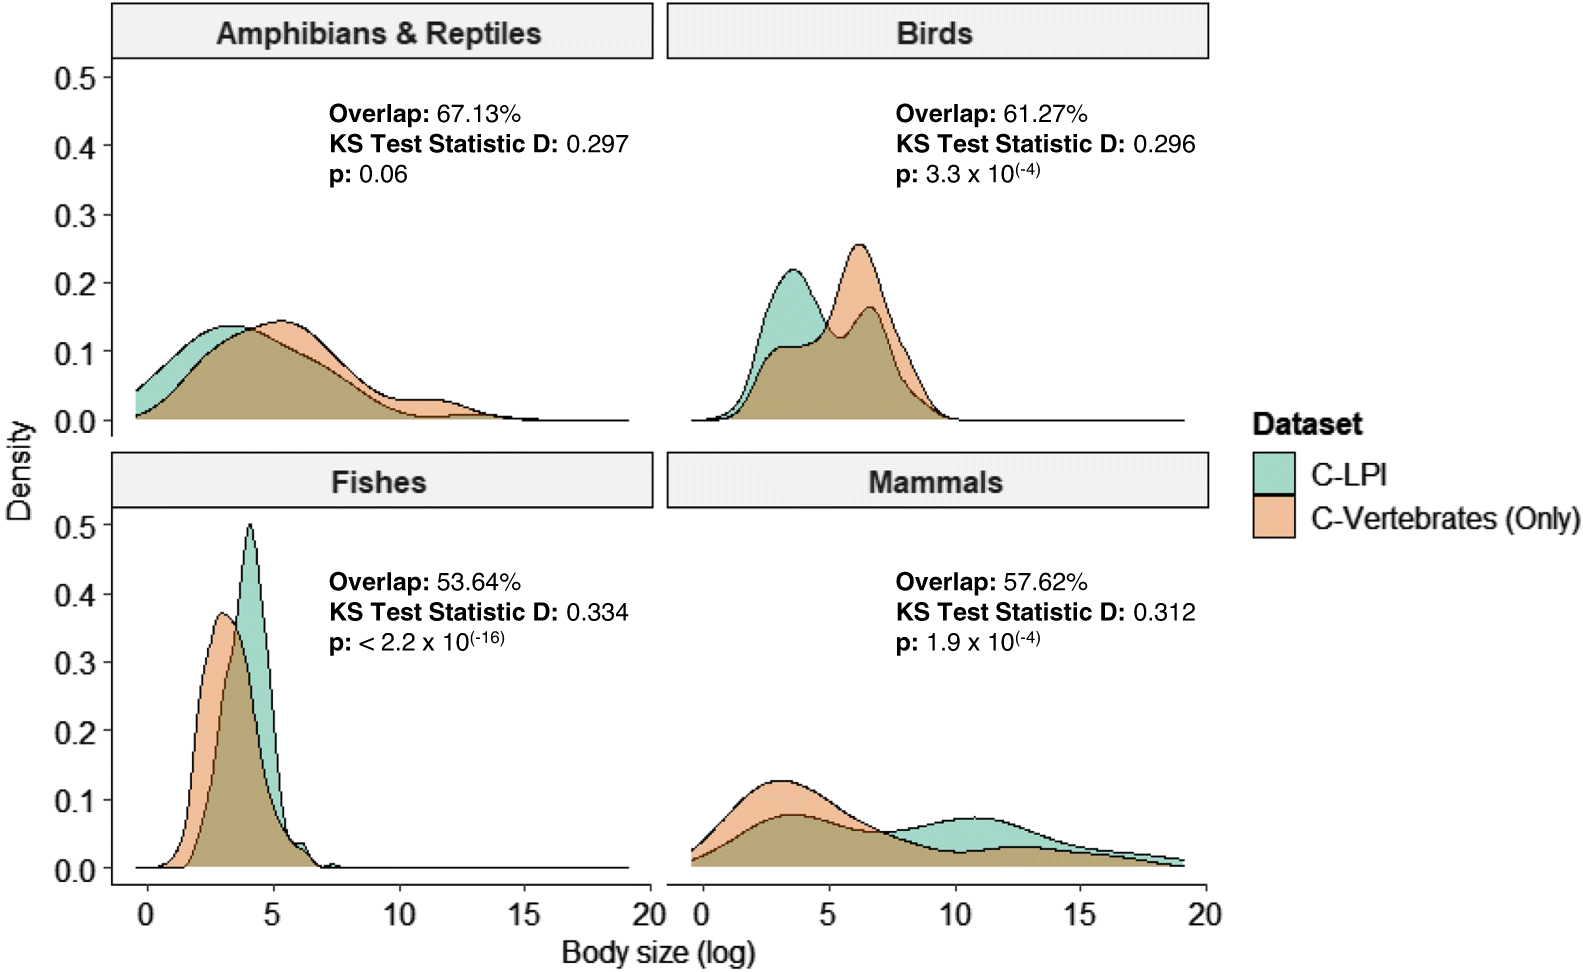
Fig. 4.
Fig. 5.
Although the distribution of biotic variables for species within the C-LPI generally overlapped with species lacking LPI data (C-Vertebrates Only), we were able to pinpoint traits within taxonomic groups that may help to improve coverage across Canada. For instance, the C-LPI should work to incorporate temporal population estimates data for large birds and small fishes (Fig. 3)—which correlate to long-lived birds and fishes with short lifespans (Fig. 4)—in addition to carnivorous amphibians and reptiles (Fig. 5). These results are reinforced through a bootstrapping approach (i.e., repeated resampling with replacement to generate samples of the same size as the reference) that depicted considerable overlap between the bootstrapped datasets, yet small differences among distributions were detected when assessing all species combined for body size (median difference between groups = −0.72, 95% CI = −0.87, −0.56; Fig. S3) and lifespan (median difference between groups = −0.45, 95% CI = −0.64, −0.27; Fig. S4). Likewise, some differences among distributions were also apparent when evaluating individual taxonomic groups, particularly for fishes (Fig. S5 and Fig. S6).
Fishes also had the poorest overlap in biotic traits when comparing the C-LPI to the broader vertebrate subphylum nationally (Table S6). Conversely, the overlap in body size (Fig. S8) and lifespan (Fig. S9) for birds improved largely due to bird data representation (i.e., sample size among datasets). Interestingly, trophic level representation among species in the C-LPI relative to the broader vertebrate subphylum nationally was nearly identical for birds, fishes and mammals (Fig. S10).
When imputing values to increase dataset coverage (and minimize biases resulting from the removal of species due to a lack of biotic trait data), the number of species in the C-LPI trait database grew from 836 to 850 species, while the number of species in the C-Vertebrates Only database grew from 843 to 852 species. Consequently, only a handful of additional species were added to the analysis, but the data coverage for biotic variables increased dramatically, particularly for fishes (Fig. S11). When using imputed data to enhance coverage of biotic variables, the distribution of body size, lifespan, and trophic level for species within the C-LPI exhibited slightly less overlap (>56% using imputed data compared to >64% for the original database) with the distribution of biotic variables for native Canadian vertebrate species lacking LPI data (C-Vertebrates Only) (Fig. 6). When imputing data, greater differences among distributions were found for all three biotic variables and despite improved data coverage, fishes still exhibited the smallest overlap in distributions relative to other taxonomic groups.
Fig. 6.
Discussion
Dataset description
The analysis presented here included at least some data for over 95% of native Canadian vertebrates, boasting impressive data coverage. However, data coverage for individual traits varied. In these instances, taxonomic biases known to exist within published biodiversity data may have been inherited within the compiled datasets for this analysis—including, for example, threatened species (Donaldson et al. 2016) or those with public appeal (e.g., charismatic species; Troudet et al. 2017). Birds were the best represented taxonomic group for each of the three biotic variables considered, largely attributable to the high representation of this taxonomic group within the dataset itself (Marconi et al. 2021). By contrast, the representation of trait data was more variable for fishes, where species with publicly available trait data ranged from 322 (of 1044 native species) for lifespan, to 792 for body size, and to 1018 for trophic level. The availability of this information for Canadian species is consistent with data availability for other studies using Fishbase, which found fewer entries of lifespan and mortality, yet more data for growth parameters (Thorson et al. 2014). Importantly, while there now exists a plethora of publicly available information regarding species-specific life history characteristics on a global scale (e.g., Myhrvold et al. 2015; Froese and Pauly 2016), the information is not always accurate or precise (Thorson et al. 2014), and thus any subsequent analyses, such as the one presented here, would inherit the biases within the datasets used, including biases related to representation—the very component that we endeavored to assess. Similarly, while the imputed dataset helped to enhance biotic trait coverage, the overlap in distributions declined compared to the nonimputed dataset, and it’s possible that biases were introduced, consequently affecting the results of the analysis.
Representation of biotic variables
Effective evidence-based wildlife management requires that conclusions and conservation decisions are informed by analyses of representative datasets and, where the data are not fully representative, recognition that such underlying biases may impact conservation approaches. Consequently, the interpretation of indicators is inherently tied to considerations of data representation. In the context of the C-LPI, the species and population time series underlying the index must be representative of the diversity of Canadian vertebrates to be an effective biodiversity indicator. Yet, despite boasting some of the best representation of species included within a national-scale abundance indicator, trends for approximately half of native Canadian vertebrates are lacking within the current dataset (Marconi et al. 2021). By evaluating and integrating the distribution of biotic traits for species within the C-LPI, compared to native Canadian vertebrate species lacking LPI data, we can target data gaps and recognize underlying data biases for more informed reporting of average trends in population abundance nationwide.
While the distributions of biotic variables from species within the C-LPI overlap with the distributions of those for native Canadian vertebrate species lacking LPI data, reinforcing the utility of the C-LPI at a national level, some notable discrepancies—and potential biases—nevertheless exist. For instance, the body size of fishes within the C-LPI skewed larger relative to the broader group of fishes in Canada. Most temporal population trend data for fishes were derived from marine Research Vessel Trawl Surveys conducted by Fisheries and Oceans (DFO) Canada (e.g., DFO 2020a, 2020b, 2020c), resulting in a bias towards marine over freshwater species and towards commercially important species. Although DFO trawl data date back to the 1940s, stratified random sampling for temporal evaluation of biological information was introduced in the 1970s, resulting in substantial temporal data coverage within Canada’s Exclusive Economic Zone (Smith and Somerton 1981). Annual Research Vessel surveys on both Pacific and Atlantic coasts are conducted using trawls (i.e., standardized equipment for comparison), that are more tailored to sampling groundfishes, which include the greatest number and highest proportion of stocks classified as critical (ECCC 2021). Moreover, the primary purpose of these trawls is to gain species-specific information as a key component for science-based stock assessments for proper management of marine fisheries—often targeting larger fishes (Pauly et al. 2002). Consequently, this bias noted within the C-LPI is not particularly surprising. In fact, it is in many ways important that the data in body size skews towards large-bodied marine fishes compared to small-bodied species, as Canadian fishes are frequently threatened with overexploitation (Currie and Marconi 2020), less likely to receive legal protections under the Species at Risk Act (Mooers et al. 2007; Findlay et al. 2009), and large fishes are under greater threat of global extinction (Olden et al. 2007).
While there was large overlap in biotic traits between datasets, our results indicate that monitoring and data collection should target temporal abundance trends for small fishes and mammals and large birds, which are correlated with short and long lifespans, respectively. In addition, efforts should be made to enhance the representation of carnivorous herpetofauna, particularly reptiles, which represent 70% of carnivorous herpetofauna not included within the C-LPI. Globally, abundance studies for reptiles are comparatively scarce (Saha et al. 2018). This additional data collection would further enhance the representation of biotic traits within the C-LPI, ensuring that it is as representative as possible, while recognizing that temporal population trend data likely does not exist for all vertebrate species in Canada. The number of species within the C-LPI doubled over the decade between the first national Living Planet Report Canada in 2007 (WWF-Canada et al. 2007) and the landmark update in 2017 (WWF-Canada 2017), owing to dedicated data collection efforts in recent years (Marconi et al. 2021). However, despite concerted efforts since, few additional species with publicly available temporal abundance data have been added to the C-LPI database (WWF-Canada 2020). Thus, targeted monitoring programs may be required for missing species and specific biotic traits to further enhance representation in the absence of publicly available abundance data.
This work builds upon the taxonomic and spatial representation of the dataset analyzed in Marconi et al. (2021), which has been used to assess threats to at-risk vertebrates in Canada and potential management actions for their recovery (Currie and Marconi 2020). Moreover, variations on the approach outlined in this analysis could be useful for evaluating a representative sample of vertebrates needed for calculating an LPI at national and (or) regional scales beyond Canada—a frequent question that has yet to be remedied, though studies are underway (Pata et al., A sampled approach to the Living Planet Index; in preparation).
Moving forward
The broad alignment of biotic traits uncovered through the analysis helps to reinforce the value of the C-LPI at a national level—including its use as an ecological indicator to track progress towards biodiversity goals, and as a tool for communication and policy. The C-LPI database is sufficiently representative of the biotic traits of Canadian vertebrates to produce representative indicators. Nevertheless, there are a variety of additional considerations, analyses, and data collection needed to further strengthen the applicability, accuracy, and precision of the indicator. We support calls for greater monitoring to address data gaps and ensure adequate representation of biodiversity within indicators (Leung et al. 2022b; Murali et al. 2022). Based on our analysis, data monitoring and collection in Canada could be targeted towards small fishes and mammals and large birds (correlating to short and long lifespans, respectively), in addition to carnivorous reptiles. The LPI (and derived indicators such as the C-LPI and CSI) are meant to reveal high-level, long-term trends in biodiversity. While full species representation may not be possible, targeted data monitoring and collection may serve to strengthen the indicator and its use for policy and communication.
From an indicator perspective, the C-LPI (and CSI) and current analysis are specific to native vertebrate species, which represent a small proportion of the 80 000 known species in Canada (CESCC 2016); thus, a more fulsome account of biodiversity trends may be needed to detect changes at multiple taxonomic and temporal levels, particularly as there is concern regarding population declines of invertebrates (Sánchez-Bayo and Wyckhuys 2019). Yet, despite recognition of the importance of monitoring vertebrate and invertebrate abundance as part of the Post-2020 Global Biodiversity Framework (Williams et al. 2020), data and capacity deficiencies for the diverse assemblage of invertebrates, plants, and fungi remain—so resourcing and monitoring should be prioritized accordingly (Hochkirch et al. 2020). Similarly, while enhanced representation of species strengthens the accuracy of the indicator, improving the geographic coverage of data collection to ensure that population trends wholly reflect patterns at a national scale will be critical in addressing geographic biases. Buschke et al. (2021) highlighted the usefulness of randomization null models for improving accuracy and presenting uncertainty around the LPI, which may be useful for overcoming random population fluctuations that can bias quantitative estimates. Leung et al. (2020) proposed investigating clusters of extreme decline or increase from the LPI to inform decision-makers and prioritize conservation efforts, as averages tend to mask important trends. Yet moving beyond the use of the LPI as a biodiversity indicator to action, bending the curve of biodiversity loss (Mace et al. 2018) requires an integrated strategy underpinned by immediate effort and unprecedented ambition (Leclère et al. 2020).
Acknowledgements
We are grateful to the Living Data Project, led by Professor Diane Srivastava (UBC), for financially supporting our working group. We also thank Dr. Gracielle Higino for her help in organizing and facilitating the working group, and Francis Banville for his participation. We are grateful to Dr. Sally Otto and Dr. Xavier Harrison for their statistical expertise and guidance in strengthening the manuscript. The data used in our analyses have been collected by countless researchers and field technicians, so we thank them for sharing their hard-earned data and making this work possible. We acknowledge that Canada is colonized land; data have been collected on the traditional, ancestral, treaty, and unceded territories of many Indigenous Peoples, often without consultation or consent. Reconciliation requires that we progress in a way that respects Indigenous connections to these lands, with a shared sense of responsibility for the wildlife that call them home.
Competing interest statement
The authors declare there are no competing interests.
References
Adjeroud M, Pratchett MS, Kospartov MC, Lejeusne C, and Penin L. 2007. Small-scale variability in the size structure of scleractinian corals around Moorea, French Polynesia: patterns across depths and locations. Hydrobiologia, 589: 117–126.
Atwood TB, Valentine SA, Hammill E, McCauley DJ, Madin EMP, Beard KH, et al. 2020. Herbivores at the highest risk of extinction among mammals, birds and reptiles. Science Advances, 6(32).
Bayraktarov E, Ehmke G, Tulloch AIT, Chauvenet AL, Avery-Gomm S, et al. 2020. A threatened species index for Australian birds. Conservation Science and Practice, 3(2): e322.
Bennett PM, and Owens IPF. 1997. Variation in extinction risk among birds: chance or evolutionary predisposition? Proceedings of the Royal Society B, 264(1380): 401–408.
Ben-Shachar MS, Lüdecke D, and Makowski D. 2020. effectsize: estimation of effect size indices and standardizedpParameters. Journal of Open Source Software, 5(56): 2815.
Boettiger C, Lang D, and Wainwright PC. 2012. rfishbase: exploring, manipulating and visualizing FishBase data from R. Journal of Fish Biology, 81(6): 2030–2039.
Buschke FT, Hagan JG, Santini L, and Coetzee BWT. 2021. Random population fluctuations bias the Living Planet Index. Nature Ecology & Evolution, 5: 1145–1152.
Cardillo M, Mace GM, Jones KE, Bielby J, Bininda-Emonds ORP, Schrest W, et al. 2005. Multiple causes of high extinction risk in large mammal species. Science, 309(5738): 1239–1241.
CESCC. 2016. Wild Species 2015: the General Status of Species in Canada. Canadian Endangered Species Conservation Council. N.G.S.W. Group. [online]: Available from wildspecies.ca/reports.
Chamberlain S, Szoecs E, Foster Z, Arendsee Z, Boettiger C, Ram K, et al. 2020. Taxize: Taxonomic information from around the web. R package version 0.9.98.
Chichorro F, Juslén A, and Cardoso P. 2019. A review of the relation between species traits and extinction risk. Biological Conservation, 237: 220–229.
Cohen J. 1994. The earth is round (p <. 05). American Psychologist, 49(12): 997–1003.
Collen B, Loh J, Whitmee S, McRae L, Amin R, and Baillie JEM. 2009. Monitoring change in vertebrate abundance: the Living Planet Index. Conservation Biology, 23(2): 317–327.
Cornwell WK, Westoby M, Falster DS, Fitzjohn RG, O’Meara BC, Pennell MW, et al. 2014. Functional distinctiveness of major plant lineages. Journal of Ecology, 102(2): 345–356.
Currie J, Burant JB, Marconi V, Blain SA, Emry S, Hébert K, et al. 2022. Assessing the representation of species included within the Canadian Living Planet Index. figshare. [online]: Available from figshare.com/collections/Canadian_Living_Planet_Index/5901434.
Currie J, and Marconi V. 2020. An analysis of threats and factors that predict trends in Canadian vertebrates designated as at-risk. FACETS, 5(1): 49–66.
Debastiani VJ, Bastazini VAG and Pillar VD. 2021. Using phylogenetic information to impute missing functional trait values in ecological databases. Ecological Informatics, 63: 101315.
DFO. 2020a. Maritimes spring research vessel survey. Fisheries and Oceans Canada. [online]: Available from open.canada.ca/data/en/dataset/fecf045a-95a2-4b69-8a40-818649a62716.
DFO. 2020b. NAFO Division 4T groundfish research vessel trawl survey (September Survey) dataset. Fisheries and Oceans Canada. [online]: Available from open.canada.ca/data/en/dataset/fecf045a-95a2-4b69-8a40-818649a62716.
DFO. 2020c. Strait of Georgia Synoptic Bottom Trawl Survey. Fisheries and Oceans Canada. [online]: Available from open.canada.ca/data/en/dataset/fecf045a-95a2-4b69-8a40-818649a62716.
Diaz S, Fargione J, Chapin FS, III, and Tilman D. 2006. Biodiversity loss threatens human well-being. PLoS Biology, 4(8): e277.
Dirzo R, Young HS, Galetti M, Ceballos G, Isaac NJB, Collen B. 2014. Defaunation in the anthropocene. Science, 345(6195): 401–406.
Donaldson MR, Burnett NL, Braun DC, Suski CD, Hinch SG, Cooke SJ, et al. 2016. Taxonomic bias and international biodiversity conservation research. FACETS, 1: 105–113.
Dowle M, and Srinivasan A. 2021. data.table: Extension of `data.frame`. R package version 1.14.2. [online]: Available from CRAN.R-project.org/package=data.table.
ECCC. 2019. Canadian Environmental Sustainability Indicators: Canadian species index. Environment and Climate Change Canada. Gatineau, Quebec. [online]: Available from canada.ca/en/environment-climate-change/services/environmental-indicators/canadian-species-index.html.
ECCC. 2021. Canadian Environmental Sustainability Indicators: Status of major fish stocks. Environment and Climate Change Canada. Gatineau, Quebec. [online]: Available from canada.ca/content/dam/eccc/documents/pdf/cesindicators/status-major-fish-stocks/2021/status_major_fish_stock.pdf.
Etard A, Morrill S and Newbold T. 2020. Global gaps in trait data for terrestiral vertebrates. Global Ecology and Biogeography, 29(12): 2143–2158.
Findlay CS, Elgie S, Giles B, and Burr L. 2009. Species listing under Canada’s Species at Risk Act. Conservation Biology, 23(6): 1609–1617.
Froese R, and Pauly D. 2016. FishBase [online]: Available from fishbase.org.
Grubler MC. 2020. SquamataBase: a natural history database and R package for comparative biology of snake feeding habits. Biodiversity Data Journal, 8: e49943.
He F, Langhans SD, Zarfl C, Wanke R, Tockner K, and Jähnig SC. 2020. Combined effects of life-history traits and human impact on extinction risk of freshwater megafauna. Conservation Biology, 35(2): 643–653.
Ho J, Tumkaya T, Aryal S, Choi H, and Claridge-Chang A. 2019. Moving beyond P values: data analysis with estimation graphics. Nature Methods, 16: 565–566.
Hochkirch A, Samways MJ, Gerlach J, Böhm M, Williams P, Cardoso P, et al. 2020. A strategy for the next decade to address data deficiency in neglected biodiversity. Conservation Biology, 35(2): 502–509.
IPBES. 2019. Summary for policymakers of the global assessment report on biodiversity and ecosystem services of the Intergovernmental Science-Policy Platform on Biodiversity and Ecosystem Services. S Díaz, J Settele, ES Brondízio, HT Ngo, M Guèze, J Agard et al. Intergovernmental Science-Policy Platform on Biodiversity and Ecosystem Services Bonn, Germany.
Kassambara A. 2020. ggpubr: 'ggplot2' based publication ready plots. R package version 0.4.0. [online]: Available from CRAN.R-project.org/package=ggpubr.
Kim H-Y. 2017. Statistical notes for clinical researchers: Chi-squared test and Fisher’s exact test. Restorative Dentistry and Endodontics, 42(2): 152–155.
Kopf RK, Shaw C, Humphries P. 2016. Trait-based prediction of extinction risk of small-bodied freshwater fishes. Conservation Biology. 31(3): 581–591.
Langlois TJ, Fitzpatrick BR, Fairclough DV, Wakefield CB, Hesp SA, McLean DL, et al. 2012. Similarities between line fishing and baited stereo-video estimations of length-frequency: Novel application of kernel density estimates. PLoS ONE, 7(11): e45973.
Laureto LMO, Cianciaruso MV, and Samia DSM. 2015. Functional diversity: an overview of its history and applicability. Natureza and Conservção. 13(2): 112–116.
Leclère D, Obersteiner M, Barrett M, Butchart SHM, Chaudhary A, de Palma A, et al. 2020. Bending the curve of terrestrial biodiversity needs an integrated strategy. Nature, 585: 551–556.
Ledger S, McRae L, Loh J, Almon R, Böhm M, Clements C, et al. 2021. Past, present and future of the Living Planet Index; in preparation.
Lee TM, and Jetz W. 2010. Unravelling the structure of species extinction risk for predictive conservation science. Proceedings of the Royal Society B, 278(1710).
Leung B, Hargreaves AL, Greenberg DA, McGill B, Dornelas M, and Freeman R. 2020. Clustered versus catastrophic global vertebrate declines. Nature, 267–271.
Leung B, Hargreaves AL, Greenberg DA, McGill B, Dornelas M and Freeman R. 2022a. Reply to: do not downplay biodiversity loss. Nature, 601: E29–E31.
Leung B, Hargreaves AL, Greenberg DA, McGill B, Dornelas M and Freeman R. 2022b. Reply to: emphasizing declining populations in the Living Planet Report. Nature, 601: E25–E26.
Leung B, Hargreaves AL, Greenberg DA, McGill B, Dornelas M and Freeman R. 2022c. Reply to: the Living Planet Index does not measure abundance. Nature, 601: E16.
Liu G, Rowley JJL, Kingsford RT, Callaghan CT. 2021. Species’ traits drive amphibian tolerance to anthropogenic habitat modification. Global Change Biology, 27(13): 3120–3132.
Loreau M, Cardinale BJ, Isbell F, Newbold T, O’Connor MI and de Mazancourt C. 2022. Do not downplay biodiversity loss. Nature, 601: E27–E28.
Mace GM, Barrett M, Burgess ND, Cornell SE, Freeman R, Grooten M, et al. 2018. Aiming higher to bend the curve of biodiversity loss. Nature Sustainability, 1: 448–451.
Marconi V, McRae L, Müller H, Currie J, Whitmee S, Gadallah F, et al. 2021. Population declines among Canadian vertebrates: but data of different quality show diverging trends. Ecological Indicators, 130, 108022.
McRae L, Böhm M, Deinet S, Gill M,and Collen B. 2012. The Arctic Species Trend Index: using vertebrate population trends to monitor the health of a rapidly changing ecosystem. Biodiversity, 13:144–156.
Meiri S. 2018. Traits of lizards of the world: Variation around a successful evolutionary design. Global Ecology and Biogeography, 27(10): 1168–1172.
Mooers AØ, Prugh LR, Festa-Bianchet M, and Hutchings JA. 2007. Biases in legal listing under Canadian Endangered species legislation. Conservation Biology, 21(3): 572–575.
Munstermann MJ, Heim NA, McCauley DJ, Payne JL, Upham NS, Wang SC, et al. 2021. A global ecological signal of extinction risk in terrestrial vertebrates. Conservation Biology.
Murali G, de Oliveira Caetano GH, Barki G, Meiri S, and Roll U. 2022. Nature, 601: E20–E24.
Myhrvold NP, Baldridge E, Chan B, Sivam D, Freeman DL, and Ernest SKM. 2015. An amniote life history database to perform comparative analyses with birds, mammals, and reptiles. Ecology, 96(11): 3109.
Olden JD, Hogan ZS, and Vander Zanden MJ. 2007. Small fish, big fish, red fish, blue fish: size-biased extinction risk of the world’s freshwater and marine fishes. Global Ecology and Biogeography, 16(6): 694–701.
Oliveira BF, São-Pedro VA, Santos-Barrera G, Penone C, and Costa GC. 2017. AmphiBIO, a global database for amphibian ecological traits. Scientific Data, 4: 170123.
Pauly D, Christensen V, Guénette S, Pitcher TJ, Sumaila UR, Walters CJ, et al. 2002. Towards sustainability in world fisheries. Nature, 418: 689–695.
Puurtinen M, Elo M, and Kotiaho JS. 2022. The Living Planet Index does not measure abundance. Nature, 601: E14–E15.
RS-eco. 2021. traitdata: Easy access to various ecological trait data. R package version 0.0.1. [online]: Available from github.com/RS-eco/traitdata.
Saha A, McRae L, Dodd CK, Gadsden H, Hare KM, Lukoschek V, et al. 2018. Tracking global population trends: Population time series data and a Living Planet Index for reptiles. Journal of Herpetology, 52(3): 259–268.
Sánchez-Bayo F, and Wyckhuys KAG. 2019. Worldwide decline of the entomofauna: A review of its drivers. Biological Conservation, 232: 8–27.
Santini L, Benítez-López A, Ficetola GF, and Huijbregts MAJ. 2018. Length-mass allometries in amphibians. Integrative Zoology, 13: 36–45.
Séguin A, Harvey É, Archambault P, Nozais C, and Gravel D. 2014. Body size as a predictor of species loss effect on ecosystem functioning. Scientific Reports, 4(4616).
Sheard C, Neate-Clegg MHC, Alioravainen N, Jones SEI, Vincent C, MacGregor HEA, et al. 2020. Ecological drivers of global gradients in avian dispersal inferred from wing morphology. Nature Communications, 11(2463): 2463.
Smith SJ, and Somerton GD. 1981. STRAP: A user-oriented computer analysis system for groundfish research trawl survey data. Canadian Technical Report of Fisheries and Aquatic Sciences, 1030(4): 1–66. [online]: Available from publications.gc.ca/collections/collection_2013/mpo-dfo/Fs97-6-1030-eng.pdf.
Solan M, Cardinale BJ, Downing AL, Engelhardt KAM, Ruesink JL, and Srivastava DS. 2004. Extinction and ecosystem function in the marine benthos. Science, 306(5699): 1177–1180.
Stekhoven DJ. 2013. missForest: Nonparametric missing value imputation using random forest. R package version 1.4.
Stekhoven DJ, and Buehlmann P. 2012. MissForest – non-parametric missing value imputation for mixed-type data. Bioinformatics, 28(1): 112–118.
Tittensor DP, Walpole M, Hill SLL, Boyce DG, Britten GL, Burgess ND, et al. 2014. A mid-term analysis of progress toward international biodiversity targets. Science, 346(6206): 241–244.
Thorson JT, Cope JM, and Patrick WS. 2014. Assessing the quality of life history information in publicly available databases. Ecological Applications, 24(1): 217–226.
Troudet J, Grandcolas P, Blin A, Vignes-Lebbe R, and Legendre F. 2017. Taxonomic bias in biodiversity data and societal preferences. Scientific Reports, 7: 9132.
Wickham H, Averick M, Bryan J, Chang W, D’Agostino McGowan L, François R, et al. 2019. Welcome to the tidyverse. Journal of Open Source Software, 4(43): 1686.
Williams BA, Watson JEM, Butchart SHM, Ward M, Brooks TM, Butt N, et al. 2020. A robust goal is needed for species in the Post-2020 Global Biodiversity Framework. Conservation Letters, 14(3): e12778.
Wilman H, Belmaker J, Simpson J, de la Rosa C, Rivadeneira MM, and Jetz W. 2014. EltonTraits 1.0: Species-level foraging attributes of the world’s birds and mammals. Ecology, 95(7): 2027–2027.
WWF. 2020. Living Planet Report 2020 - Bending the curve of biodiversity loss. Edited by Almond REA. Grooten M. Petersen T. World Wildlife Fund. Gland, Switzerland.
WWF-Canada, ZSL and GFN. 2007. Canadian living planet report 2007. World Wildlife Fund Canada, Zoological Society of London and Global Footprint Network. Toronto, Canada. [online]: Available from footprintnetwork.org/content/documents/2007_Canadian_Living_Planet_Report.pdf.
WWF-Canada. 2017. Living planet report Canada: A national look at wildlife loss. Edited by Currie J, Giles E, and Snider J. World Wildlife Fund Canada. Toronto, Canada.
WWF-Canada. 2020. Living Planet Report Canada: Wildlife at risk. Edited by J Currie, J Snider, and E Giles. World Wildlife Fund Canada. Toronto, Canada.
Supplementary material
Supplementary Material 1
- Download
- 1.31 MB
Information & Authors
Information
Published In
FACETS
Volume 7 • Number 1 • January 2022
Pages: 1121 - 1141
Editor: David Lesbarrères
History
Received: 17 March 2022
Accepted: 9 June 2022
Version of record online: 11 August 2022
Copyright
© 2022 Currie et al. This work is licensed under a Creative Commons Attribution 4.0 International License (CC BY 4.0), which permits unrestricted use, distribution, and reproduction in any medium, provided the original author(s) and source are credited.
Data Availability Statement
All compiled trait data and associated code for this analysis are available from figshare at: https://doi.org/10.6084/m9.figshare.c.5901434.v3.
Key Words
Sections
Subjects
Authors
Author Contributions
All conceived and designed the study.
JC, JBB, VM, SAB, SE, KH, GX, NAM, XW, and RF performed the experiments/collected the data.
JC, JBB, VM, SAB, SE, KH, GX, NAM, XW, and RF analyzed and interpreted the data.
JC, JBB, VM, SAB, SE, KH, GX, NAM, XW, LM, and RF contributed resources.
All drafted or revised the manuscript.
Funding Information
This manuscript is a product of virtual working group supported by the Living Data Project (LDP), an initiative of the Canadian Institute of Ecology and Evolution. The LDP is funded by a Collaborative Research and Training Experience (CREATE) grant from the Natural Science and Engineering Research Council of Canada. We thank WWF-Canada and Environment and Climate Change Canada for enabling the creation of the dataset used in this manuscript over the years.
Metrics & Citations
Metrics
Other Metrics
Citations
Cite As
Jessica Currie, Joseph B. Burant, Valentina Marconi, Stephanie A. Blain, Sandra Emry, Katherine Hébert, Garland Xie, Nikki A. Moore, Xueqi Wang, Andrea Brown, Lara Grevstad, Louise McRae, Stefano Mezzini, Patrick Pata, and Robin Freeman. 2022. Assessing the representation of species included within the Canadian Living Planet Index. FACETS.
7(): 1121-1141. https://doi.org/10.1139/facets-2022-0063
Export Citations
If you have the appropriate software installed, you can download article citation data to the citation manager of your choice. Simply select your manager software from the list below and click Download.
There are no citations for this item