Climate change, species thermal emergence, and conservation design: a case study in the Canadian Northwest Atlantic
Abstract
Marine Protected Areas (MPAs) are conservation tools that promote biodiversity by regulating human impacts. However, because MPAs are fixed in space and, by design, difficult to change, climate change may challenge their long-term effectiveness. It is therefore imperative to consider anticipated ecological changes in their design. We predict the time of emergence (ToE: year when temperatures will exceed a species’ tolerance) of 30 fish and invertebrate species in the Scotian Shelf-Bay of Fundy draft network of conservation areas based on climate projections under two contrasting emission scenarios (RCP 2.6 and RCP 8.5). We demonstrate a strong Southwest-to-Northeast gradient of change under both scenarios. Cold water-associated species had earlier ToEs, particularly in southwesterly areas. Under low emissions, 20.0% of habitat and 12.6% of species emerged from the network as a whole by 2100. Under high emissions, 51% of habitat and 42% of species emerged. These impacts are expected within the next 30–50 years in some southwestern areas. The magnitude and velocity of change will be tempered by reduced emissions. Our identification of high- and low-risk areas for species of direct and indirect conservation interest can support decisions regarding site and network design (and designation scheduling), promoting climate resilience.
1. Introduction
The impacts of climate change on marine ecosystems are pervasive. Direct changes to the physical environment include changes in sea surface temperature (SST; Cheung et al. 2009), acidification, and oxygen depletion (Lotterhos et al. 2021). Indirect effects on ecological systems responding to these physical changes (Weiskopf et al. 2020) include changes in productivity (Sydeman et al. 2021), biodiversity (Manes et al. 2021; Worm and Lotze 2021; Penn and Deutsch 2022), and altered ecosystem function (Free et al. 2019), all of which are foundational elements of the marine environment. Mitigating and adapting to climate change will be integral to maintaining the health of our oceans and the continued provision of ecosystem services. Simultaneously, protecting marine ecosystems from other anthropogenic stressors, including overfishing and pollution, can enhance their resilience, potentially reducing the negative impacts of climate change (Hughes et al. 2005; Bryndum-Buchholz et al. 2022).
Following international commitments to the U.N. Sustainable Development Goals and the Convention on Biological Diversity, Canada has committed to protecting 30% of its coastal/marine areas by 2030. This will be achieved through the implementation of Marine Protected Areas (MPAs) and other effective area-based conservation measures (OECMs) (DFO 2021a). Fisheries and Oceans Canada (DFO) is the primary government body leading the development of marine conservation areas and is the agency that administers formal Oceans Act “Marine Protected Areas” and Fisheries Act “Marine Refuges” (a form of OECM), which collectively comprise the majority of the Canadian Marine Conservation Network by area (∼80%; Bryndum-Buchholz et al. 2022). MPAs in Canada are areas of the ocean that are legally protected from anthropogenic activities to help ensure the conservation of marine ecosystems and species. They may be designated due to the presence of special natural features (e.g., unique and productive habitats or diversity hotspots), concentrations of species at risk (e.g., endangered or threatened species under the Canadian Species at Risk Act), and/or environmental, cultural, or socioeconomic importance (DFO 2018). Their boundaries are determined by the priorities of various ocean stakeholders (i.e., fisheries, aboriginal communities/organizations, ocean industries, federal and provincial government, conservation groups, coastal communities, etc.). Marine Refuges have been established to help to protect focal species or functional groups and their respective habitats (including corals and sponges) through closures of certain fisheries (Schram et al. 2019; DFO 2020) and in Canada are targeted for benthic habitats. The overarching goal of the Canadian Marine Conservation Network (a collection of MPAs and OECMs across the nation's marine bioregions) is to “provide long-term protection of marine biodiversity, ecosystem function and special natural features” with specific objectives developed according to the unique physical, ecological, and biological attributes of each area (Government of Canada 2011). However, the dynamic impacts of climate change on marine ecosystems threaten the long-term effectiveness of these MPAs and OECMs, which are typically implemented as long-term fixed measures (Tittensor et al. 2019). Climate-driven shifts in species geographic distributions (Pinsky et al. 2013), timing of life history events (Fuentes-Yaco et al. 2007), productivity (Bryndum-Buchholz et al. 2020), and ecosystem structure (Boyce et al. 2015) may necessitate changes to site-level management, boundaries, or the configuration of the conservation network. For this reason, there has been a recent movement to include climate change considerations in marine conservation planning in Canada, with workshops convened on the topic, recent publications outlining pertinent advice on how to ensure Canada's conservation network is climate resilient (e.g., Wilson et al. 2020; Bryndum-Buchholz et al. 2022), and a new mandate to bring climate resilient conservation planning into the Canadian MPA Program (Minister of Fisheries, Oceans and the Canadian Coast Guard Mandate Letter (pm.gc.ca)).
Prevailing advice advocates using climate change vulnerability/risk assessments to promote climate resiliency within the design and management of conservation networks. Foundational to these assessments is understanding how species distributions will shift in response to changing environmental conditions (e.g., Shackell et al. 2014; Stortini et al. 2015). The distribution of a species is, for the most part, constrained by the physical and environmental conditions (e.g., temperature and depth) required for survival (e.g., Guisan and Zimmermann 2000; Sillero et al. 2021). When an organism is living at its upper or lower temperature limit, oxygen demand increases, often exceeding the organism's ability to maintain it, causing reduced performance in ventilation and circulation (Pörtner 2001). In some cases, and over evolutionary time scales, adaptation to novel environmental conditions is possible. However, evidence suggests that the rapid environmental changes associated with climate change are already causing geographic shifts in distribution that track shifting distributions of their thermal niches (Pinsky et al. 2013; Crozier and Hutchings 2014; Pinsky et al. 2021). In general, the magnitude of global surface warming will be a primary determinant of species extirpations from their historic habitats (Penn and Deutsch 2022).
How a species interacts with its thermal environment plays a prominent role in determining its response to climate change, including geographic range shifts. For this reason, the thermal niche of the species is often used in vulnerability and risk assessments to assess the timing, location, and magnitude of climate impacts on that species (Pacifici et al. 2015; Stortini et al. 2015; Stuart-Smith et al. 2015; Foden et al. 2019; Greenan et al. 2019; Pinsky et al. 2019; Boyce et al. 2022). The timing of a distributional response of a species is the product of its thermal niche and the chronology of environmental change (e.g., rate of warming). The “time of emergence” (ToE) or more specifically “time of thermal emergence” has been used to designate the expected timing of a biological response (e.g., increased stress, distributional shifts, or declining fitness) to temperature change, defined as the year in which SST exceeds the upper thermal tolerance of a species in a particular area of interest (Henson et al. 2017; Trisos et al. 2020). As species shift towards higher latitudes and into deeper, cooler waters (Pinsky et al. 2021), species of conservation concern may eventually emerge from their thermal niche within MPAs that were initially designated for their protection. This emigration of a species from MPAs could co-occur with the immigration of new species from adjacent areas, potentially leading to new community compositional states not previously observed (Lurgi et al. 2012).
The regional network of MPAs and OECMs proposed for the Scotian Shelf, off Canada's eastern coast (Fig. 1), was designed without explicit consideration for the impacts of climate change (DFO 2018), and thus it remains unknown as to how climate change may impact this network’s efficacy, over the long term. The aim of this study was to estimate the ToE of 30 fish and invertebrate species of interest within each of the existing and proposed MPA/OECM site boundaries in the draft conservation network design for the Scotian Shelf-Bay of Fundy bioregion (Fig. 1; Table 1) under ensemble projections of future SST (two emission scenarios and three climate models). The ToE will vary by species and location, depending on the thermal niche of a species and the rate and magnitude of SST change at each site across the geographic range of the species (Table S1; Fig. S1). In general, species with more restricted thermal niches are more likely to experience habitat shifts and for those shifts to happen sooner.
Fig. 1.
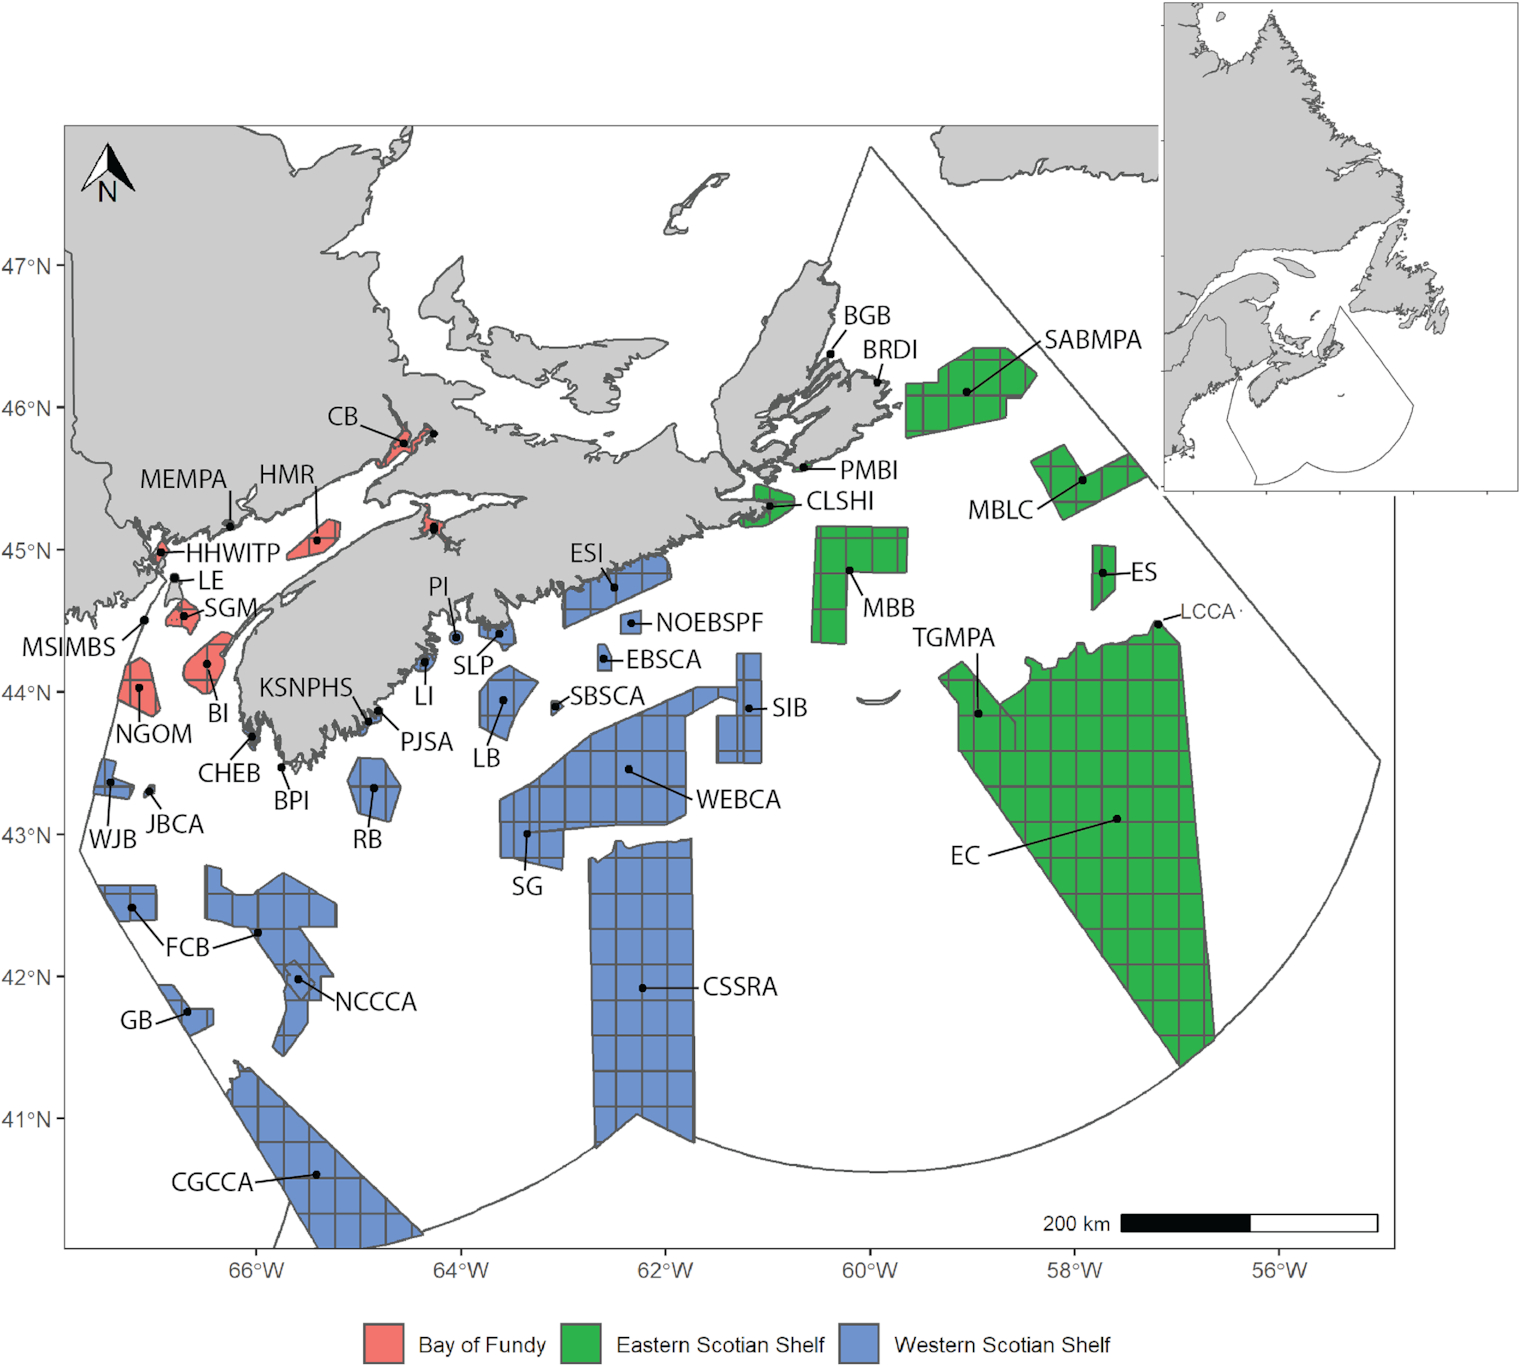
Table 1.
| Site | Abbreviation | Species (out of 29) | Inshore/offshore | Region | Area |
|---|---|---|---|---|---|
| Northern Gulf of Maine | NGOM | 25 | O | BoF | 975.9 |
| Machias Seal Island Migratory Bird Sanctuary | MSIMBS | 21 | O | BoF | 25.3 |
| Head Harbour, West Isles and The Passages | HHWITP | 23 | I | BoF | 103.7 |
| Long Eddy | LE | 24 | I | BoF | 34.5 |
| South Grand Manan | SGM | 25 | I | BoF | 413.9 |
| Brier Island | BI | 25 | I | BoF | 999.2 |
| Musquash Estuary Marine Protected Area | MEMPA | 3 | I | BoF | 7.4 |
| Horse Mussel Reefs | HMR | 21 | O | BoF | 625.9 |
| Chignecto Bay | CB | 2 | I | BoF | 408.2 |
| Boot Island National Wildlife Area | BINWA | 1 | I | BoF | 0.9 |
| Southern Bight | SB | 5 | I | BoF | 217.6 |
| Canso Ledges—Sugar Harbour Islands | CLSHI | 20 | I | ESS | 655.1 |
| Point Michaud and Basque Islands | PMBI | 3 | I | ESS | 54.3 |
| Bird Islands | BRDI | 4 | I | ESS | 11.2 |
| Middle Bank-Canso Bank | MBB | 23 | O | ESS | 3937.6 |
| St. Anns Bank Marine Protected Area | SABMPA | 22 | O | ESS | 4374.0 |
| The Gully Marine Protected Area | TGMPA | 26 | O | ESS | 2363.9 |
| Misaine Bank and Laurentian Channel | MBLC | 20 | O | ESS | 2452.6 |
| Eastern Shoal | ES | 19 | O | ESS | 731.7 |
| Eastern Canyons | EC | 25 | O | ESS | 36 365.7 |
| Lophelia Coral Conservation Area | LCCA | 13 | O | ESS | 14.7 |
| Western Jordan Basin | WJB | 22 | O | WSS | 558.5 |
| Jordan Basin Conservation Area | JBCA | 21 | O | WSS | 48.8 |
| Georges Bank | GB | 24 | O | WSS | 717.4 |
| Chebogue | CHEB | 5 | I | WSS | 111.3 |
| Fundian Channel-Browns Bank | FCB | 27 | O | WSS | 7252.8 |
| Bon Portage Island | BPI | 2 | I | WSS | 14.0 |
| Northeast Channel Coral Conservation Area | NCCCA | 21 | O | WSS | 390.9 |
| Corsair/Georges Canyons Conservation Area | CGCCA | 15 | O | WSS | 8825.1 |
| Port Joli and Surrounding Areas | PJSA | 7 | I | WSS | 145.3 |
| Roseway Bank | RB | 23 | O | WSS | 1496.1 |
| Kejimkujik Seaside National Park and Historic Site | KSNPHS | 2 | I | WSS | 1.3 |
| LaHave Islands | LI | 9 | I | WSS | 142.6 |
| Pearl Island | PI | 8 | I | WSS | 82.3 |
| Sambro Ledges—Prospect | SLP | 21 | I | WSS | 369.7 |
| LaHave Basin | LB | 22 | O | WSS | 1564.5 |
| Scotian Gulf | SG | 25 | O | WSS | 1952.5 |
| Sambro Bank Sponge Conservation Area | SBSCA | 19 | O | WSS | 62.5 |
| Emerald Basin Sponge Conservation Area | EBSCA | 19 | O | WSS | 197.1 |
| Eastern Shore Islands | ESI | 21 | I | WSS | 2135.4 |
| Western Emerald Bank Conservation Area | WEBCA | 27 | O | WSS | 10 231.8 |
| North of Emerald Basin Sea Pen Field | NOEBSPF | 19 | O | WSS | 260.5 |
| Central Scotian Slope, Rise and Abyss | CSSRA | 15 | O | WSS | 18 201.1 |
| Sable Island Bank | SIB | 25 | O | WSS | 1648.0 |
Note: Sites without species observations not included.
The application of species-based estimated time(s) of emergence in the planning of MPA networks is novel and can be used to predict how the future effectiveness of MPAs and MPA network design configurations could change as species distributions and ecosystems shift in response to climate change. This information may help MPA managers to prioritize sites for immediate designation and to identify sites that may require more adaptive management strategies due to predicted shifts in priority species distributions.
2. Methods
2.1. Species selection
A subset of species from major marine taxa (e.g., piscivores, decapods, benthivores, plankton, etc.) was selected to represent a cross-section of conservation interests (i.e., depleted species, species at risk, important prey species, and commercially important species) and potential responses to climate change from species with varying life-history traits. Species from these groupings were prioritized/selected based on their vulnerability status (e.g., species identified as endangered, threatened, or special concern under the Species at Risk Act), commercial usage (e.g., fishing industry; Rozalska and Coffen-Smout 2020), and/or ecological importance (e.g., primary food source for vulnerable or commercial species). Species selection was informed by regional reports that conducted similar prioritization exercises (Stortini et al. 2015; DFO 2018; Shackell et al. 2021; see Table S1 for complete list and selection criteria).
2.2. Species thermal and depth niche characterization
Temperature niches of species were assigned based on their observed range of thermal distribution, whereby the range was identified as the 10th and 90th percentiles of SSTs in which the species has been observed, globally, extracted from the online global database, Aquamaps (Aquamaps 2021). Several temperature ranges of the species were further refined based on similar exercises conducted at the regional scale (Shackell et al. 2013), including American lobster (Homarus americanus), American plaice (Hippoglossoides platessoides), Atlantic cod (Gadus morhua), Atlantic halibut (Hippoglossus hippoglossus), Haddock (Melanogrammus aeglefinus), Northern shrimp (Pandalus borealis), Redfish sp. (Sebastes fasciatus), and Snow crab (Chionoecetes opilio). Temperature ranges from Aquamaps and Shackell et al. (2013) were combined (Table S1) to capture the broadest thermal limits based on annually averaged SST.
The depth niches of the species were similarly defined given the 10th and 90th percentiles of depths within their global distribution (derived from Aquamaps 2021) and refined given the 10th and 90th percentiles of depths within their regional (Northwest Atlantic) distribution (derived from observations obtained from the Ocean Biodiversity Information System (OBIS); OBIS 2021) (Fig. 1; Table S1).
2.3. Niche-adjusted network
The study area of this project is the Scotian Shelf-Bay of Fundy bioregion (a region bounded by natural features rather than man-made divisions), for which a network of existing and potential MPAs and OECMs has been identified (Fig. 1). Polygons for each MPA/OECM in the draft network were developed through an objective-driven systematic conservation planning exercise using MARXAN (a conservation planning software: Software | Marxan (marxansolutions.org)) and stakeholder consultation (DFO 2018). For each species, a niche-adjusted network was derived from this draft network design based on expected residency and depth niche. The residency of each species was determined by querying OBIS for any observations within a 25 km buffer inclusive of the site since 2000. Where residency was expected, site geometry was further constrained to only the area within the depth range of a species, based on an overlay of the General Bathymetric Chart of the Oceans (GEBCO 2021). For each species, these niche-adjusted/constrained networks formed the basis for the remaining analyses.
The geographic polygons representing each niche-adjusted site were overlaid on 0.25-degree gridded temperature projection data (CMIP6 monthly averages), obtained from the World Climate Research Program (WCRP 2021) (see Fig. 1 for illustration of the overlay). The percentage of grid cells within each species niche-adjusted network sites was compared between the present day and projected future years. The year of thermal emergence was assessed for each grid cell within each site of each species niche-adjusted network.
2.4. Climate projections and time of thermal emergence (ToE)
Average annual temperature projections for the period 2015–2100 were obtained at a 0.25-degree resolution from the World Climate Research Program's CMIP6 model outputs (WCRP 2021) for three global climate models: Alfred Wegener Institute (AWI) (Semmler et al. 2020), Hadley Centre Atmospheric (HAD) (Pope et al. 2000), and Institut Pierre-Simon Laplace (IPSL) (Jiang et al. 2021), under two socioeconomic and emissions-based future climate scenarios (IPCC 2000): SSP1 RCP2.6 (“best-case scenario” where carbon emissions start declining now) and SSP5 RCP8.5 (“worst-case scenario” where carbon emissions continue increasing), hereafter referred to as low (RCP 2.6) and high (RCP 8.5) emission scenarios, respectively. ToE was estimated as the year in which the projected annual mean temperature exceeded the upper thermal tolerance limit of a species (as defined in Section 2.2), and this exceedance continued for at least two consecutive years thereafter (method adapted from Boyce et al. 2022). We interpreted this as the year in which the habitat has transitioned to an environmental state where it is likely that the species is either lost or under increased thermal stress. While we refer to this emergence as “loss” throughout, we acknowledge that a species may not necessarily be lost entirely from a site; rather, the ToE indicates that the thermal suitability of that habitat has crossed a threshold into that of high stress and high uncertainty.
The ToE was estimated for each grid cell within each species niche-adjusted network for a time series of average annual temperature (2015–2100), that was averaged across the three climate models (i.e., an ensemble approach) for each of the two climate scenarios. The SST projections were ensemble averaged rather than averaging the model-specific ToE outputs to account for the uncertainty associated with ToEs > 2100 (SST projections were not available beyond 2100). Within each niche-adjusted network site, the year in which a species reached its ToE in 100% of the grid cells was recorded as the site-level ToE for that species. For each site, the proportion of species lost was calculated for two benchmark years representing near future (2050) and distant future (2100) periods. For each species, the proportion of grid cells, approximating areal coverage, lost across the entire network was also calculated for both benchmark years.
All geographic and statistical analyses were computed in R version 4.1.2 (R Core Team 2021) primarily using the sf, R.Matlab, ggplot2, and dplyr packages (Wickham 2016; Bengtsson 2018; Pebesma 2018; and Wickham et al. 2022, respectively).
3. Results
3.1. Climate projections
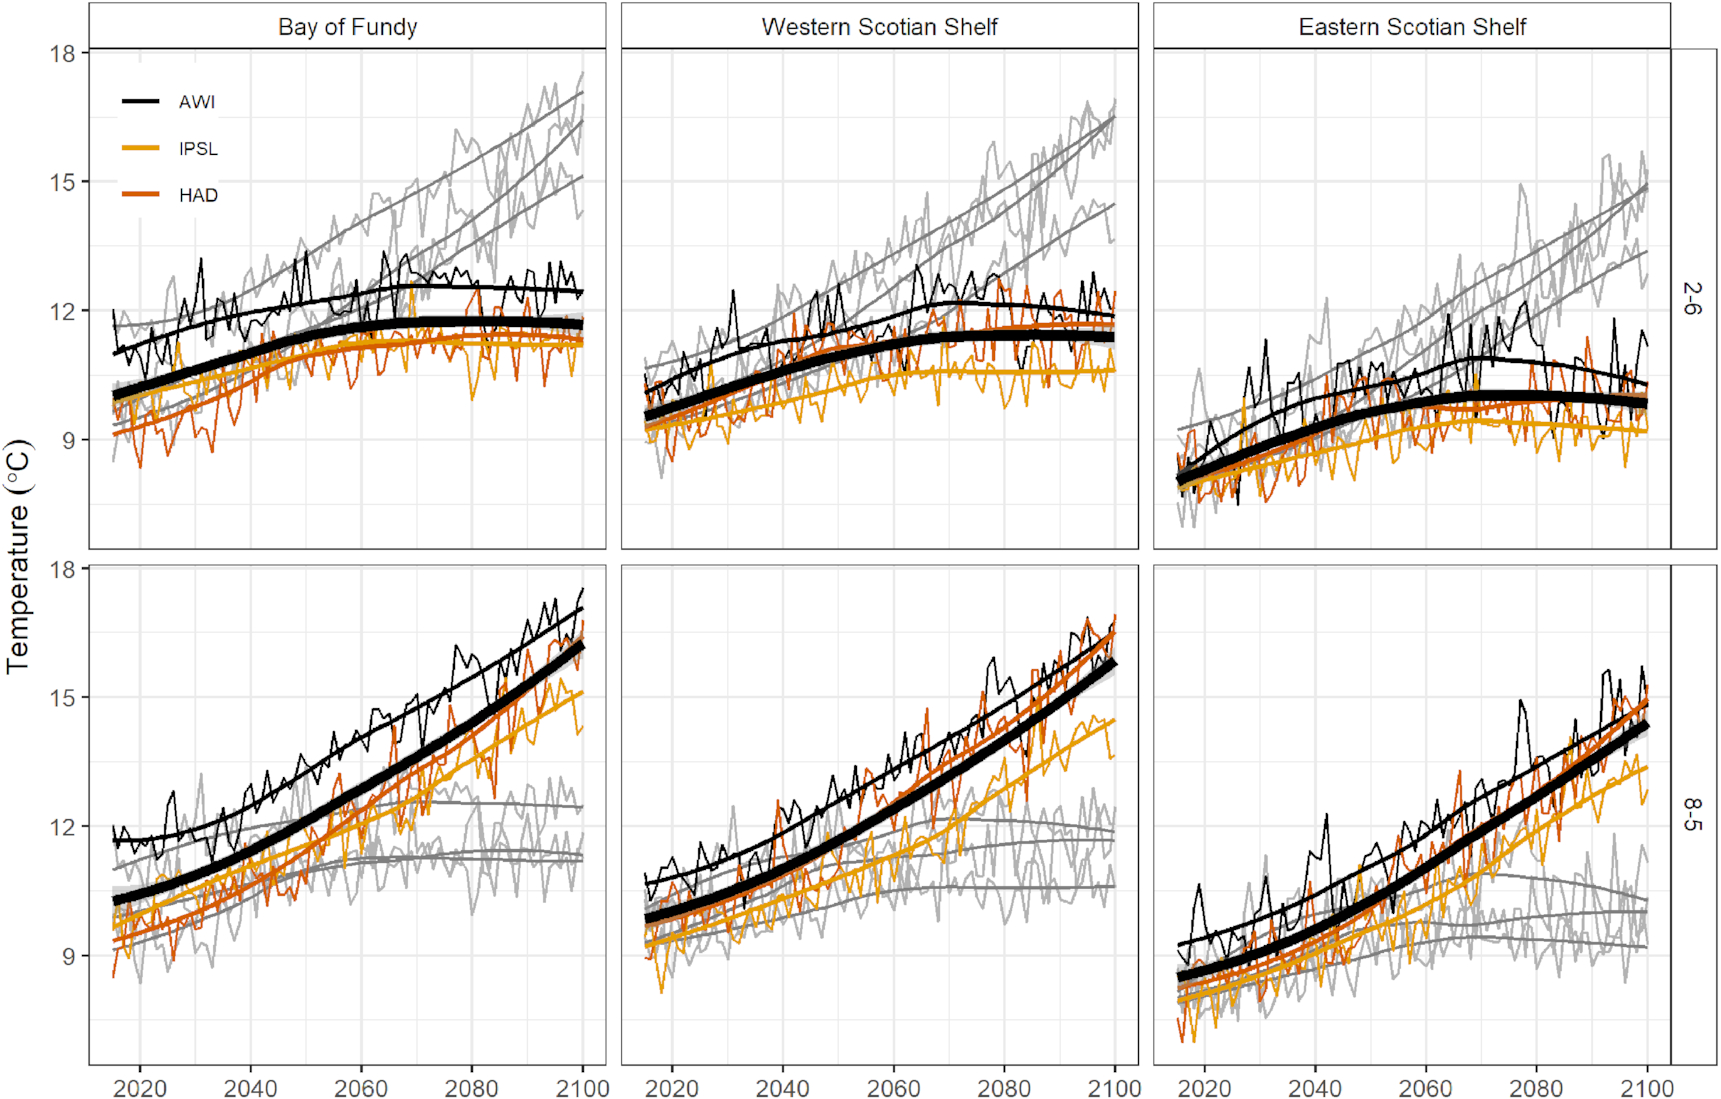
Under both climate scenarios, all three models predicted warming trends throughout the study period (2015–2100). However, the rate and trajectory of change varied considerably between scenarios. Throughout the Scotian Shelf-Bay of Fundy bioregion, under low emissions (RCP 2.6) time series of average annual temperature showed a small gradual increase in temperature until the year 2070, after which the rate of warming began to level off (Fig. 2). The high emissions scenario (RCP 8.5) showed a different future, with monotonic increases in average annual temperature throughout the time series and no apparent decrease in the rate of warming (Fig. 2). These trends were nearly identical across the bioregion, but the present day (i.e., the y-intercept) and forecasted future (2100; i.e., the asymptote in low emission (RCP 2.6) projections) temperatures were highest in the Bay of Fundy, and lowest in the Eastern Scotian Shelf (ESS) (Fig. 2).
Fig. 2.
3.2. Thermal stress across the conservation network
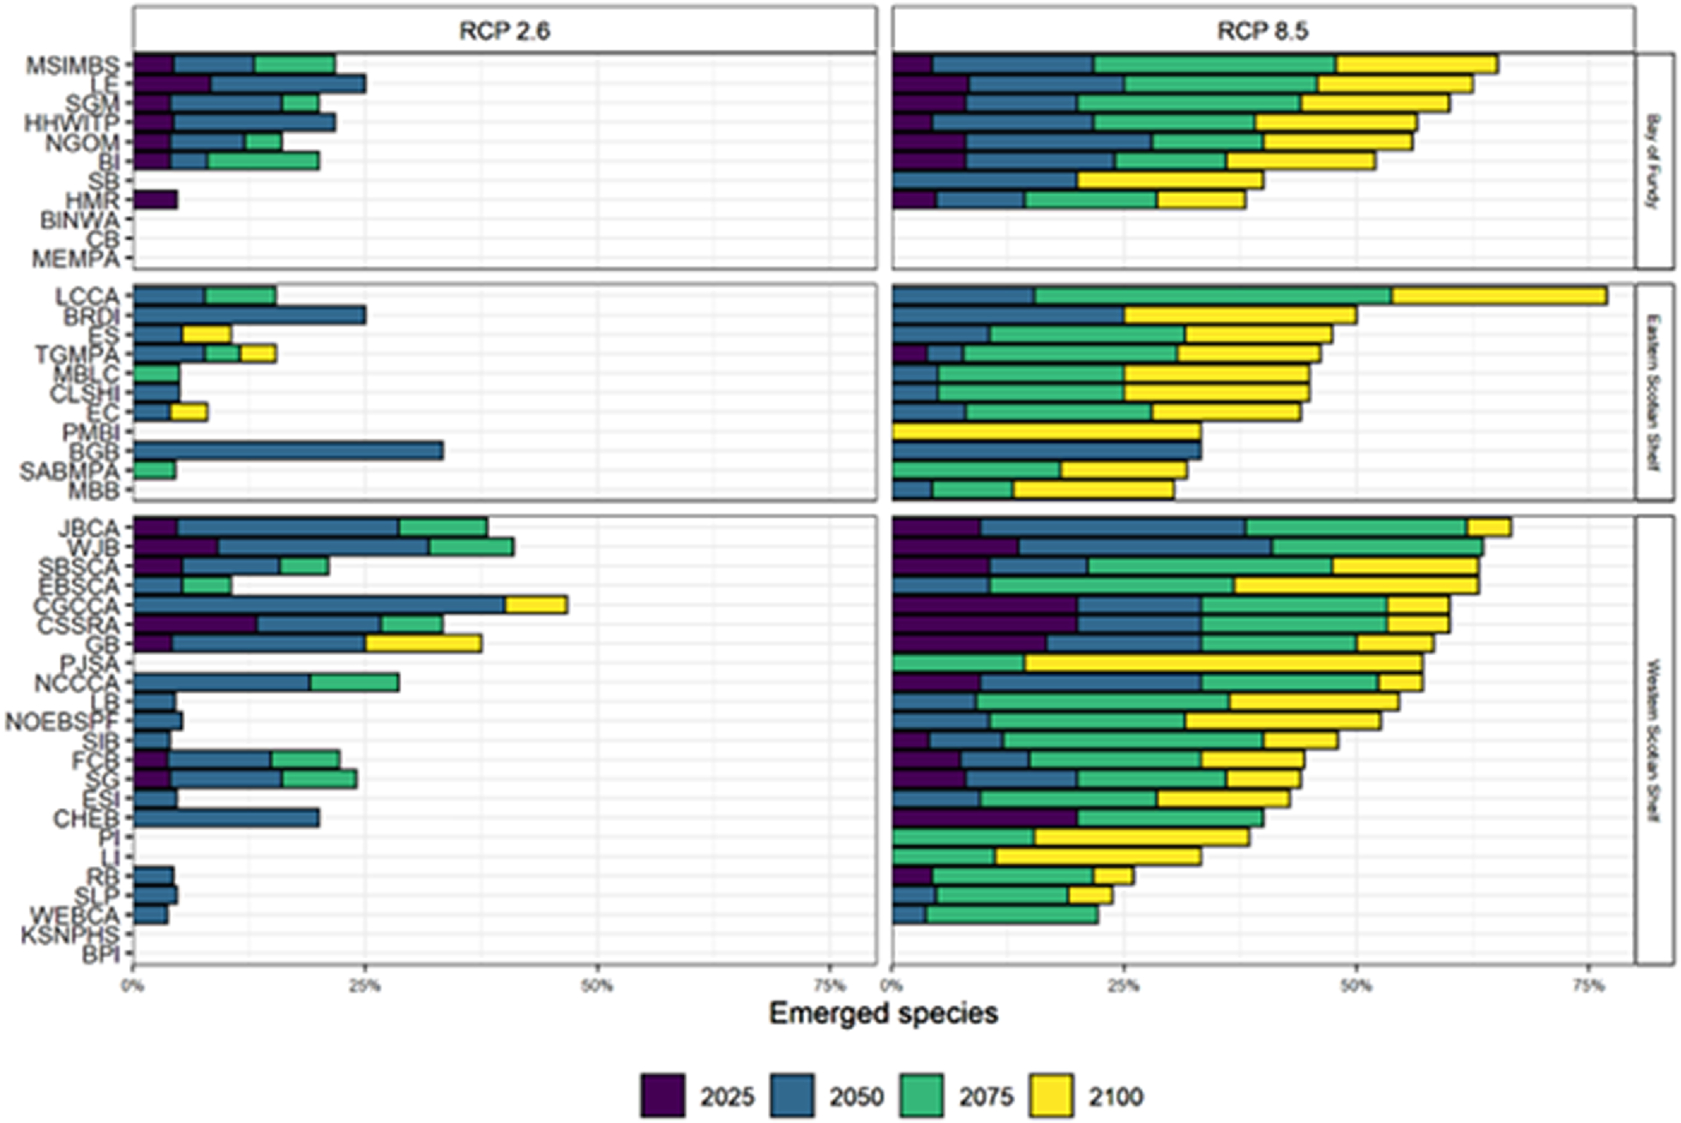
Given model-averaged time series of projected SST, several trends appeared when comparing emerging species between climate scenarios and draft network sites. First, there was a southwest-to-northeast gradient of species emergence (i.e., the proportion of species associated with each site experiencing temperatures outside their thermal niche by the end of the analysis period, 2100), particularly under the low emissions scenario (RCP 2.6). The mean % of emerged species was 15.2% for the low emissions scenario and 44.0% for the high emissions scenario (RCP 8.5) for Western Scotian Shelf (WSS) sites, 10.7% for the low emissions scenario and 43.6% for the high emissions scenario for ESS sites, and 11.8% for the low emissions scenario and 38.6% for the high emissions scenario for Bay of Fundy sites (Fig. 3). In general, ToEs were earlier along the edge of the Shelf, in the Bay of Fundy (BoF) region, and in the southwestern sites of the bioregion compared with the ESS (Fig. 3).
Fig. 3.
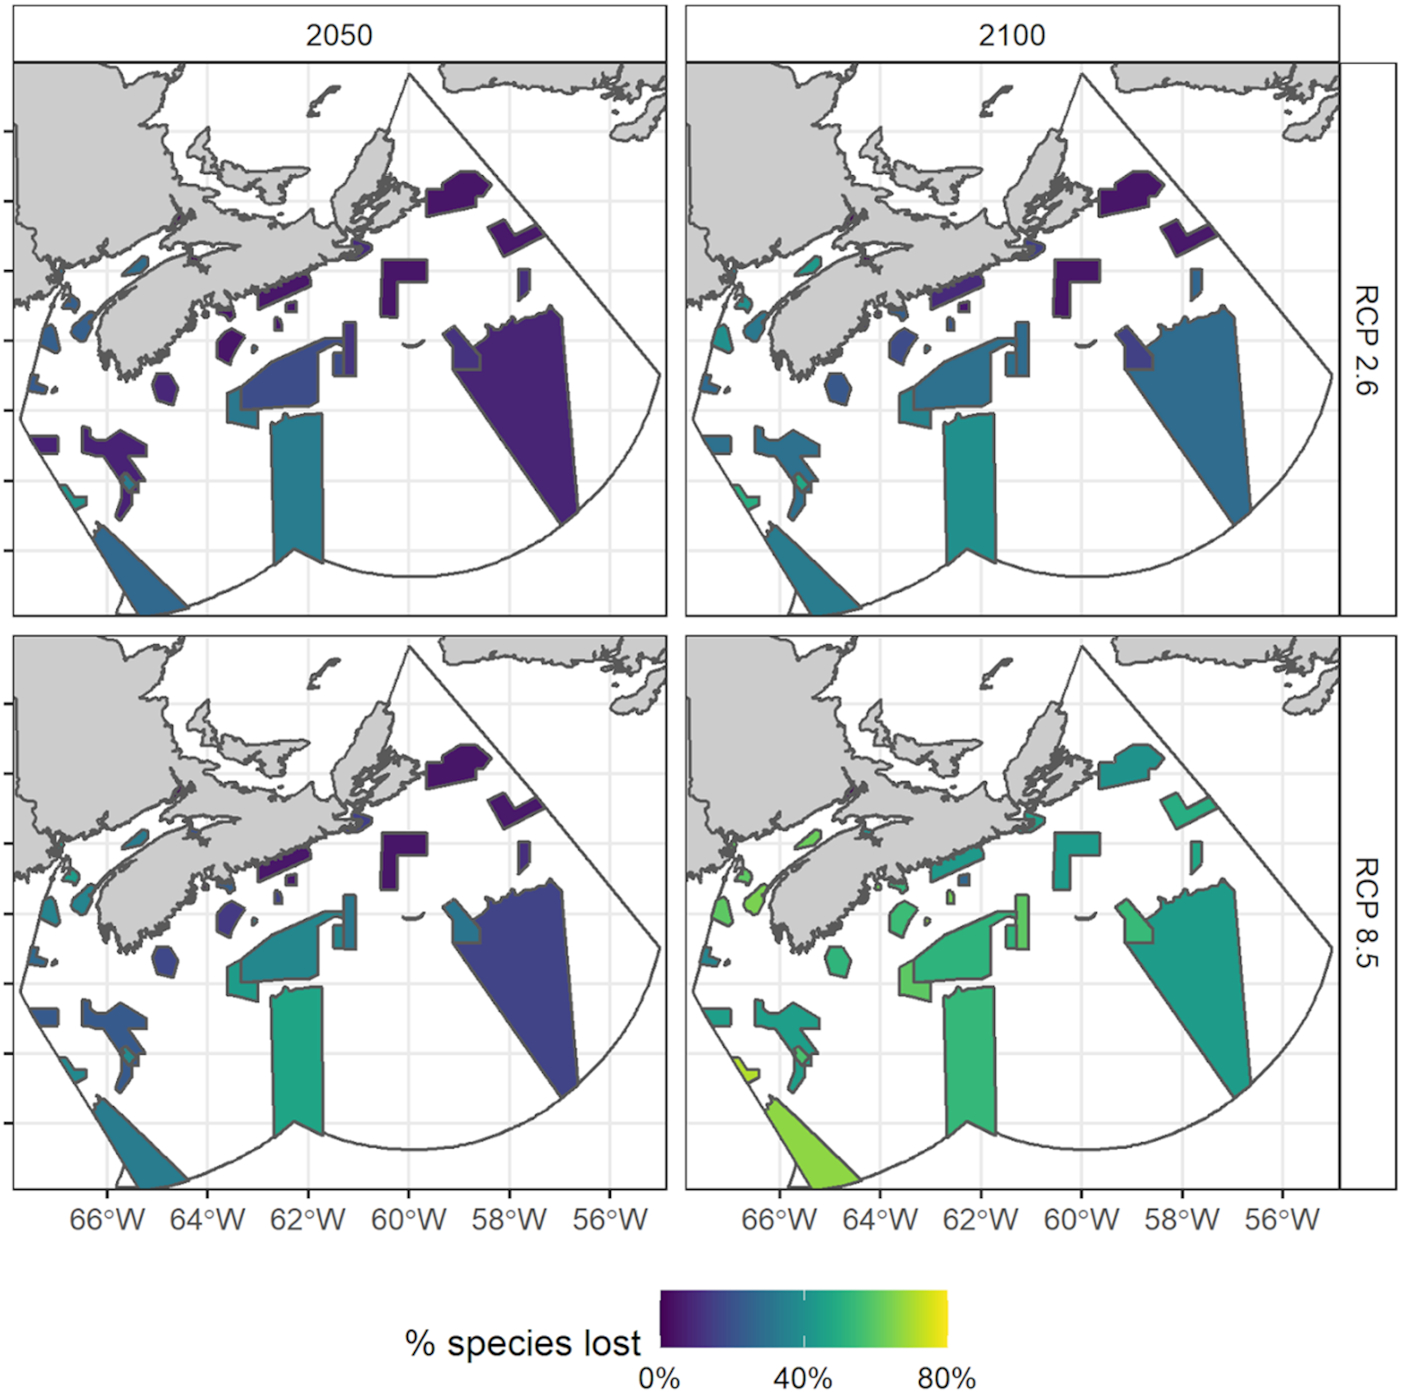
By 2100, 11/23 (47.8%) of WSS and 6/11 (54.6%) of BoF sites were projected to have more than 50% of resident species emerge under the high emissions scenario (Fig. 4). Comparatively, only 2 of 11 of the ESS sites were projected to have more than 50% of species emerge by 2100 under the high emissions scenario (Fig. 4), corresponding to the southwest-to-northeast gradient in the warming (Fig. 2). Under the low emissions scenario, this variation between regions was maintained, however, no sites within the network had >50% of species emerge by 2100 (Fig. 4). The most vulnerable sites in the near term, losing 25% or more of species by 2050, were in the offshore and deep waters of the WSS (e.g., Georges Bank, Corsair Canyons, Western Jordan Basin) and nearshore areas in the ESS (Big Glace Bay, Bird Islands) and Bay of Fundy (Long Eddy) under both future climate scenarios (Fig. 4). The least vulnerable sites of the bioregion, having 0% of species emerge by 2100, even under the high emissions scenario, were all small coastal sites located in the coastal zone of the WSS (Kejimkujik Seaside National Park and Bon Portage Islands—KSNPHS and BPI) and in the Bay of Fundy (Boot Island National Wildlife Area, Chignecto Bay, and Musquash Marine Protected Area—BINWA, C.B., and MEMPA), all of which having few species (<3; Table 1) that were not projected to reach their thermal limits by 2100 (e.g., American lobster (Homarus americanus) and Porbeagle shark (Lamna nasus)) (Fig. 4).
Fig. 4.
Collectively these results highlight the potential return from strong emissions mitigation (reductions of species-specific habitat losses by 10%–90% for RCP 2.6 relative to 8.5), agreeing with a growing body of literature predicting how biodiversity and ultimately ecosystem function will be impacted by climate change (e.g., Hensen et al. 2017; Bianchi et al. 2021). However, these changes also emphasize that even with strong mitigation, marine ecosystems, including those within conservation areas, are expected to be exposed to environmental conditions that will likely manifest biological change (e.g., distributional shifts, species turnover, declining fitness). In our study region, ∼30% of species examined are expected to experience thermal emergence of >50% of their habitat by 2100, even with strong emission reductions.
3.3. Thermal stress of species
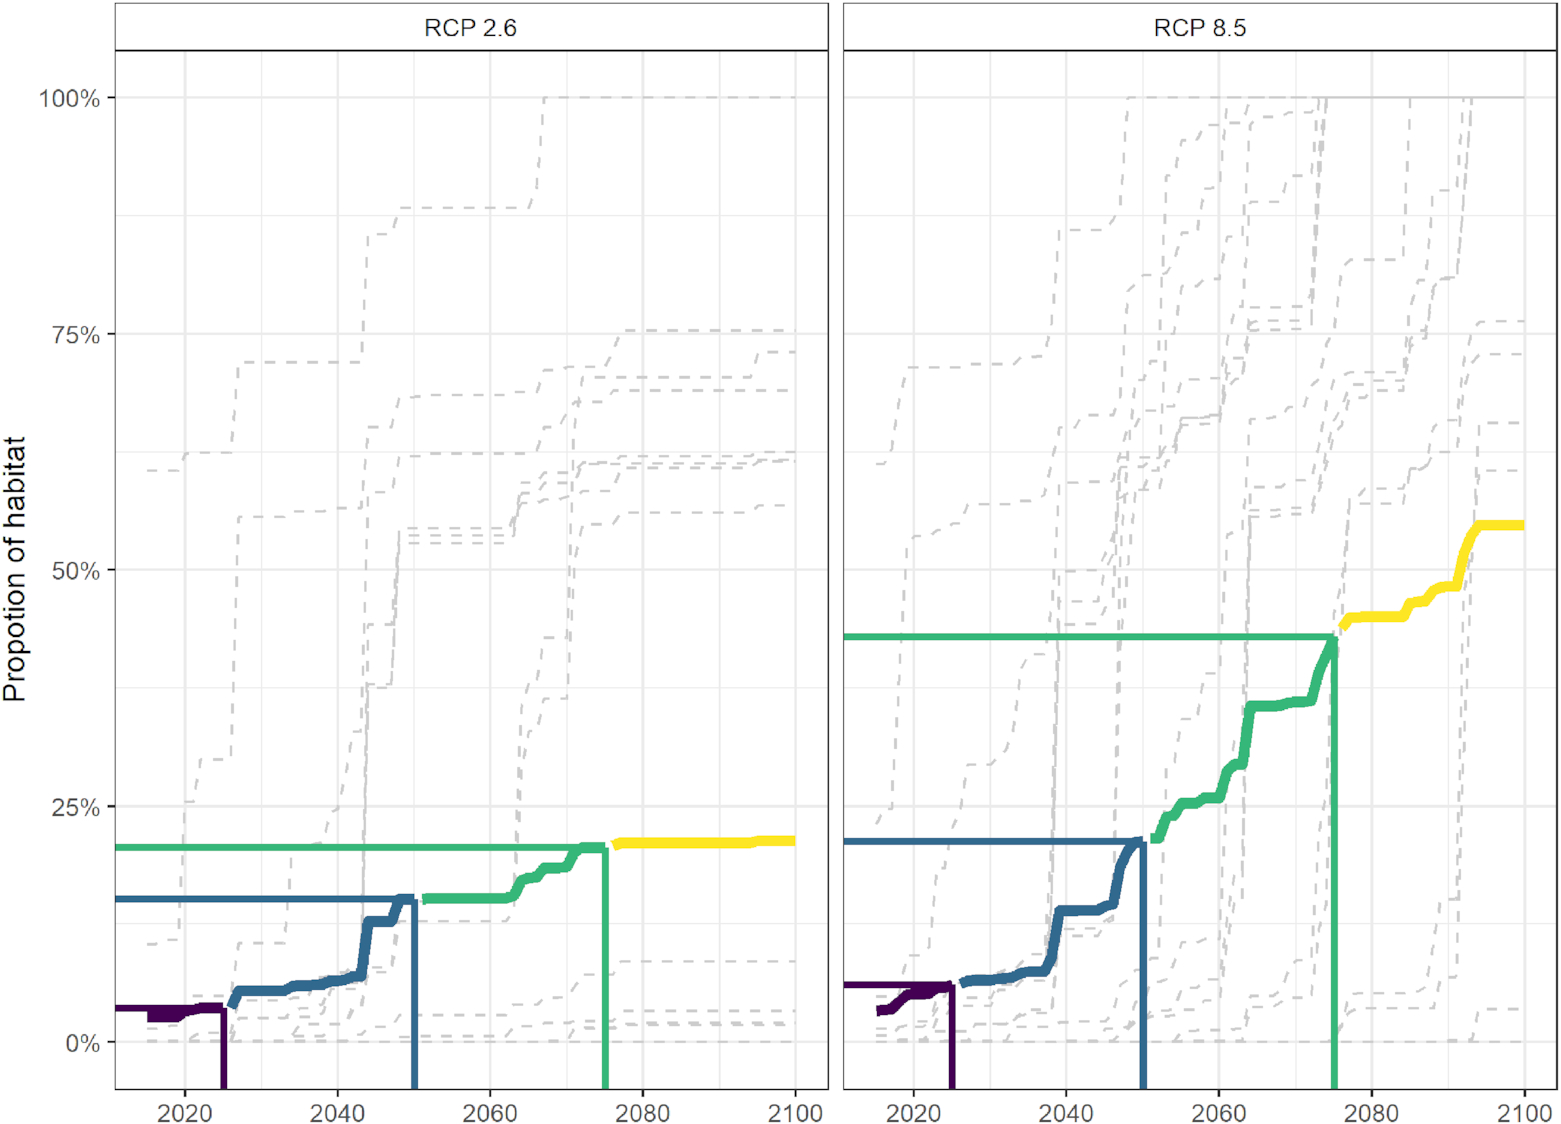
Our results indicated higher and more rapidly increasing thermal stress (a greater proportion of total habitat lost across the network) for species under the high emissions scenario compared with the low emissions scenario (Fig. 5). Under the low emissions scenario, the average habitat loss per species plateaued just under 20% by 2075 (Fig. 5), suggesting that, on average, the majority of the network would still offer suitable habitat for many species up to 60–80 years from now. Under the high emissions scenario, the average habitat loss showed a steady increase from the present day to 2100 (Fig. 5). The substantial difference between the low emissions scenario and high emissions scenario % habitat loss projections can be seen when comparing the years after 2050 (following trends in temperature, Fig. 2); both future climate scenarios had a similar percentage of average habitat loss (15% under the low emissions scenario and 23% under the high emissions scenario) by 2050, but by 2100, the high emissions scenario projected average habitat loss across all species and sites was 32% higher (55% loss) than the low emissions scenario projected habitat loss (23% loss) (Fig. 5), corresponding to the continued warming observed under the high emissions scenario (Fig. 2).
Fig. 5.
On average, species with narrower thermal niches are more thermally stressed than those with a wider range in temperature tolerance. In particular, benthic fish (which have temperature tolerance ranges ∼12 °C narrower than marine mammals on average) were projected to lose ∼39% more habitat to thermal stress across the entire network under both scenarios by 2100 compared with all other species (Fig. 6). The most vulnerable species in terms of near-term % habitat loss by area were seven benthic fish species: Atlantic wolffish (Anarhichas lupus, 81% habitat loss projected by 2050), Cusk (Brosme brosme, 59% habitat loss projected by 2050), American plaice (Hippoglossoides platessoides, 61% habitat loss projected by 2050), Atlantic halibut (Hippoglossus hippoglossus, 67% habitat loss projected by 2050), Smooth skate (Malacoraja senta, 62% habitat loss projected by 2050), Thorny skate (Amblyraja radiata, 70% habitat loss projected by 2050), and Acadian redfish (Sebastes fasciatus, 65% habitat loss projected by 2050); and one benthic invertebrate species: Snow crab (Chionoecetes opilio, 100% habitat loss projected by 2050) under the high emissions scenario (Fig. 6).
Fig. 6.
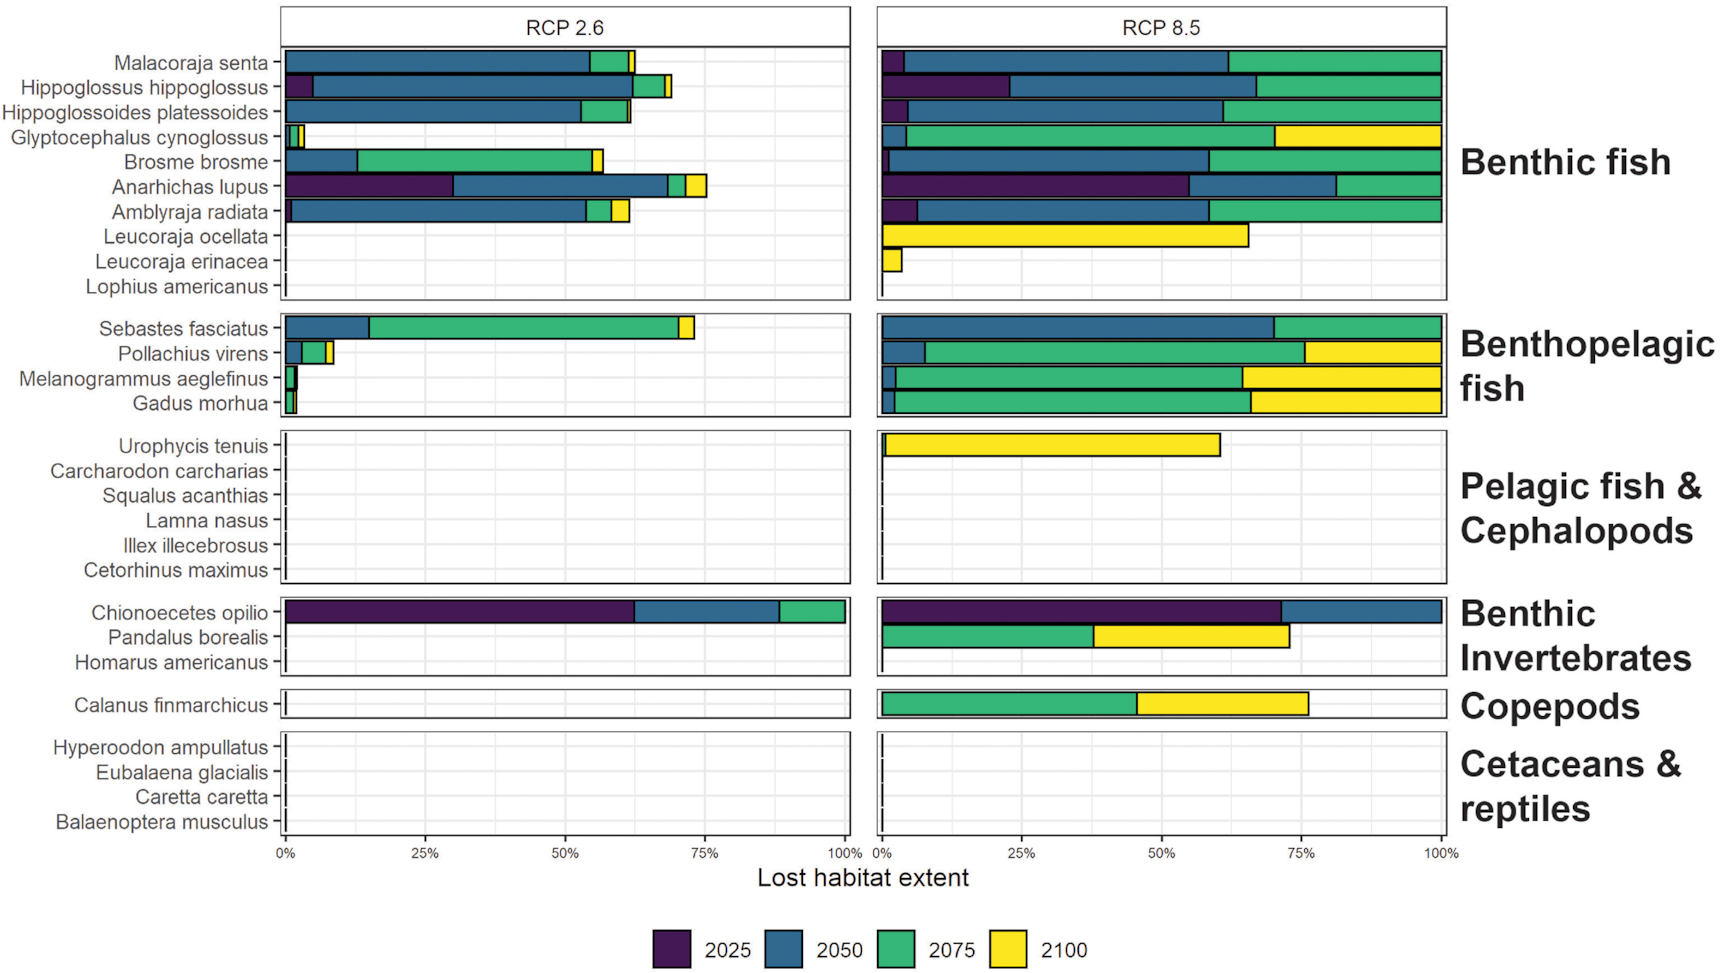
Species projected to experience the least thermal stress across the network over the next 80 years (all having a predicted habitat loss of 0% by 2100), even under the high emissions scenario, include one benthic fish species: Monkfish (Lophius americanus); four broadly distributed large benthopelagic fish species: White shark (Carcharodon carcharias), Spiny dogfish (Squalus acanthias), Porbeagle shark (Lamna nasus), Basking shark (Cetorhinus maximus); a squid species: Common shortfin squid (Illex illecebrosus); one benthic invertebrate: American lobster (Homarus americanus); three broadly distributed, migratory cetaceans: North Atlantic Right whale (Eubalanena glacialis), Northern Bottlenose whale (Hyperoodon ampullatus), Blue whale (Balaenoptera musculus); and one broadly distributed, migratory reptile: Loggerhead turtle (Caretta caretta). Important food sources for cetaceans (i.e., the temperate copepod, Calanus finmarchicus) and groundfish (i.e., Northern shrimp, Pandalus borealis) had little habitat loss projected under the low emissions scenario, but, under the high emissions scenario, these species were projected to lose more than 70% of their current habitat within the conservation network sites by 2100, due to thermal stress (Fig. 5). In the majority of sites (63.2%), Snow crab (Chionoecetes opilio) was the first species projected to experience temperatures outside of its thermal niche, particularly in ESS and WSS regions. Where Snow crab was not the first species projected to become extirpated from a site, Atlantic wolffish (18.4%), Atlantic cod (Gadus morhua, 2.6%), Atlantic halibut (Hippoglossus hippoglossus, 5.3%), Pollock (Pollachius virens, 2.6%), and Thorny skate (Amblyraja radiata, 7.8%) were the first. Under the high emissions scenario, 0% of ESS sites, 75% of BoF sites, and 31.8% of WSS sites lost (or became thermally stressful for) at least one species by 2015.
4. Discussion
This study examined the ToE of 30 marine species within the MPA/OECM sites included in the Scotian Shelf-Bay of Fundy bioregion draft conservation network design. Under low emissions (RCP 2.6), the majority (>50%) of species are retained within the boundaries of the draft conservation network until at least the year 2100 (Fig. 4). Conversely, under high emissions (RCP 8.5), 19 of 40 sites within this draft conservation network are predicted to lose more than 50% of the species considered in this study (Fig. 4). This result is consistent with the IPCC's 2021 report and with several other studies indicating muted distribution shifts under low compared with high emissions (Höhne et al. 2021; IPCC 2021; Lima et al. 2022; Pielke et al. 2022), suggesting that, if targets for emissions reductions are met, the Scotian Shelf-Bay of Fundy bioregional conservation network, as it is currently designed, will be more effective in achieving its conservation goals and targets over the long term. However, recent studies have shown that global emissions are currently more comparable to that of the high emissions scenario (Höhne et al. 2021). Under the high emissions scenario, species lost 32% more thermal habitat from the network by 2100 than under the low emissions scenario (Fig. 5), indicating that the ability of the draft conservation network to achieve its conservation goals/targets over the mid- to long term may be impacted and should be continually evaluated.
Under both emission scenarios, results indicated a clear southwest-to-northeast gradient in species times of emergence, with many species emerging from their thermal niche earlier in the southwest compared with the northeast (Fig. 3). This gradient was most pronounced under high emissions near the end of the time series (Fig. 3). Besides the Lophelia Coral Conservation Area (LCCA), which is a very small (14.7 km2) Marine Refuge at the northeastern edge of the Scotian Shelf with only 13 of our species of interest present, the most vulnerable sites (predicted to have temperatures outside the tolerance limits of more than 25% of the species assessed here by 2025 under both emission scenarios) were all located in the southwestern part of the bioregion. These sites included Central Scotian Slope, Rise and Abyss (CSSRA), Horse Mussel Reef (HMR), and Long eddy (LE) (Fig. 4). CSSRA is positioned where warm waters derived from the Gulf Stream flow into the Gulf of Maine (Brickman et al. 2018, 2021), and both HMR and LE are located in the Bay of Fundy, which is presently the warmest part of the bioregion and predicted to warm the most rapidly due to its connection with the Gulf of Maine (Brickman et al. 2018, 2021). This result is consistent with many studies documenting the steep temperature gradient, and consequent gradient in genetic structure and species assemblages, that characterize the Scotian Shelf-Bay of Fundy bioregion (Stanley et al. 2018; Stortini et al. 2021; O'Brien et al. 2022). This is also consistent with studies that have indicated the southern range limit of many of the Scotian Shelf's resident species occurs around the southwestern reaches of the bioregion, such that northward distribution shifts lead to extirpation from this end of the region first (Shackell et al. 2014; Brennan et al. 2016).
The anticipation of rapid (as early as 2025) emergence of resident species from southwestern conservation areas should not be justification for the deprioritization of sites that were designed to capture representative examples of habitat features (DFO 2018). Rather, these sites will provide safe havens for new emerging ecological communities, such that the biodiversity of the area may be protected from other anthropogenic influences as inevitable climate-driven ecological shifts occur (e.g., Matthews and Wynes 2022). In these cases, particular care should be taken to monitor climate-related changes and re-evaluate conservation priorities where the greatest changes are predicted to occur. On the other hand, areas designed to protect particular species or species groups may require re-evaluation if the species of interest are predicted to become severely thermally stressed in the near term (e.g., ToE ≤ 2050). Results identifying rapidly emerging/shifting species will also have implications for fisheries; such species will require enhanced monitoring, the inclusion of climate change considerations in stock assessment processes, and adaptation of the industry to new species or occupations.
Our results indicate that Snow crab (Chionoecetes opilio), a highly valuable commercially harvested invertebrate species (DFO 2021b), is most rapidly emerging from the Scotian Shelf-Bay of Fundy bioregion. Snow crab was often the first species to become extirpated from network sites, with site-level ToEs as early as 2015 in some sites, indicating that, although this species has previously been observed, it is unlikely that it currently occupies any southwestern sites in any significant abundance. It was also projected to lose 100% of its preferred habitat from the entire draft conservation network in this region by 2050 under the high emissions future climate scenario (and 100% by 2075 under the low emissions scenario; Fig. 5). This species has the smallest thermal range of the selected invertebrates and is already occupying the southern-most extreme of its spatial distribution in the northwest Atlantic (DFO 2021b). Snow crab supports the third most profitable fishery in Nova Scotia (NS Department of Fisheries and Aquaculture 2014). Recent studies indicate decreases in the amount of Snow crab landings in the western portion of the study region and marked rapid responses to warming events (Zisserson et al. 2018). As an important scavenger and predator species (Boudreau and Worm 2012), the extirpation of Snow crab will likely have implications for the structure of benthic invertebrate communities throughout the bioregion as well. Reduced predator presence has been documented to lead to either compensation by other predators (Shackell and Frank 2007) or prey release resulting in reduced body size diversity, increased beta diversity (Ellingsen et al. 2015; Stortini et al. 2018), and increases in both spatial and temporal community turnover (Alonso et al. 2015; Stortini et al. 2021). Reduction in Snow crab abundance within the benthic invertebrate communities of the ESS (the Snow crab's current last stronghold in the bioregion) over the next 30–50 years (Fig. 5) will likely result in some of these community-level responses, which could have implications for the conservation sites in this part of the bioregion. Monitoring and the potential for adaptive management will be imperative to ensure these sites continue to meet their ecological conservation objectives.
The only species not predicted to experience habitat loss in the region were either large migratory species with global distribution ranges or species with a known preference for warmer water (Fig. 6). These species are in the minority, but these results imply that they may gain suitable habitat along a latitudinal gradient (southwest to northeast) as warming trajectory continues. The focus of our study was to identify areas and timelines for change relative to the baseline on which the network was developed. We limited our examination to area lost instead of the potential for gain within the conservation network due to the assumptions that would have to be made about species dispersal processes and species interactions that underpin expansion, but there have already been cases where warming has manifested spatially variant responses by species (gains and losses). For example, American lobster (Homarus americanus) has boomed as a result of warming in the Gulf of Maine with continued increases in suitable habitat anticipated (Tanaka et al. 2019), and this species is predicted to benefit from increases in the extent of suitable habitat throughout the WSS (Greenan et al. 2019). Spiny dogfish (Squalus acanthias) are typically found only on the WSS and known to expand northeastward only when temperatures warm (e.g., Shepherd et al. 2002; Shackell and Frank 2007), suggesting this species may become more prevalent on the ESS as waters warm. However, increased prevalence of diseases (Castro et al. 2006; Glenn and Pugh 2006; Wahle et al. 2009), increased frequency of extreme heat waves (Oliver et al. 2018), and shifts in prey species distributions (Carloni et al. 2018) have been noted as potential indirect impacts of climate change that may negatively impact even those species not predicted to lose thermal habitat (Greenan et al. 2019).
Our results indicate that key species at the base of the food chain (Calanus finmarchicus and Pandalus borealis) may lose substantial amounts (>50%) of habitat throughout the draft network design over the next 80 years under the high emissions scenario. This result is consistent with other studies that have predicted substantial loss of Calanus finmarchicus from the Gulf of Maine and Scotian Shelf regions over the next 50–80 years (Reygondeau and Beaugrand 2011; Grieve et al. 2017) and a continued trajectory of reduced productivity resulting from losses and shifting size composition at low trophic levels (Boyce and Worm 2015; Boyce et al. 2015; Britten et al. 2016; Bernier et al. 2018; Bryndum-Buchholz et al. 2020). Decreased prey availability may lead to further loss of priority species, even those with wider temperature tolerance ranges (e.g., North Atlantic Right whale; Pendleton et al. 2012; Meyer-Gutbrod et al. 2015). These changes will likely lead to shifts in the composition of marine communities throughout the region, particularly as species losses will inevitably coincide with, be followed by, or be preceded by a northeastward progression of invasions (or northward expansion) of new, warm water-tolerant species (Cheung et al. 2009; Brennan et al. 2016) or warm-adapted populations (Stanley et al. 2018). In fact, recent studies have suggested that the expansion of warm-water species distributions towards the poles may outpace the shift of cold-water species, leading to shifts in ecosystem structure (Pound et al. 2020) and changes to ecosystem functions (e.g., Bianchi et al. 2021). In other words, the Scotian Shelf-Bay of Fundy ecosystem may undergo “deborealization” and “tropicalization” simultaneously over time, starting within the next 50 years (Vergés et al. 2014; McLean et al. 2021; Osland et al. 2021). Evidence suggests that some key warm water species have already begun invading the Scotian Shelf-Bay of Fundy bioregion, such as Cory's Shearwaters (Gjerdrum et al. 2018). Novel communities that emerge could prompt the re-evaluation of conservation priorities and the spatial arrangement of sites. The network must therefore be monitored regularly to ensure ecological conservation objectives are being met (Edgar et al. 2014).
4.1. Implications for conservation network design and management
To ensure the long-term effectiveness of the Maritimes Region conservation network in terms of its ability to safeguard biodiversity, southwestern and Bay-of-Fundy sites predicted in this study to experience rapid change in species composition (e.g., CSSRA, HMR, and LE; Fig. 1; Table 1) should be evaluated to determine whether their contributions to species-specific conservation objectives are key to the network design (i.e., are they key areas for species-based targets). If species-based targets in the design are covered by these sites currently, then network design modifications might be required. Alternatively, the prospective conservation priorities for these sites should be refocused to features that are not anticipated to degrade over time (e.g., the prioritization of representative habitat types in the initial design of the Maritimes Region conservation network; DFO 2018). Prioritization of monitoring effort in these sites should also be applied to ensure conservation priorities are re-evaluated periodically, so that, for example, incoming vulnerable species may be appropriately protected from human activities.
It should also be noted that invading nonlocal species can also have a direct negative impact on fragile ecosystems found within the bioregional conservation network sites through competitive, predatory, or parasitic species dynamics (Beal and Kraus 2002; Carver et al. 2003), or habitat destruction (e.g., green crab; Howard et al. 2019; Bricknell et al. 2020; Lyons et al. 2020; Wilson and Garbary 2020; Richards and Hunter 2021). Sites containing a high proportion of species with early emergence may be particularly vulnerable to the establishment of invasive species (Chaffin et al. 2016). This is because, where species are predicted to emerge from their thermal niche, small populations may still be present, but at higher risk to other stressors including invasive species, habitat destruction, and fishing due to physiological stress (Sylvester 1972; Pörtner 2001; Dulvy et al. 2003; Pörtner and Farrell 2008; Whiteley and Mackenzie 2016). Long-term protection of biodiversity and native species will require regular monitoring of these high-change/early emergence sites for the presence of harmful invasive species, and, when detected, prompt action.
Further, as remnant, less resilient individuals are left behind in “emerged” sites, other individuals will be shifting in distribution (e.g., Stanley et al. 2018; Cote et al. 2021), avoiding thermally stressful environments and encountering new, potentially suboptimal environments (due to the presence of other stressors and new ecosystem structures) along the way. It is for this reason that implementing a portfolio of conservation efforts (i.e., ecosystem-based approaches for fisheries management (EBFM); Link et al. 2011), in addition to static conservation network sites (MPAs), is imperative to ensure healthy populations and ecosystems are maintained through periods of transition. Even with strong emission mitigation projected changes in temperature will drive ecosystem responses at various spatial and temporal scales. It is therefore imperative that conservation planning pre-emptively considers how the desired conservation objectives can be best achieved through conservation measures, planning for this change as opposed to trying to design around it.
4.2. Caveats
It is important to note that, while we evaluated climate impacts on species via temperature changes, additional factors may also influence the fitness and distribution of the species assessed here. Ocean acidification can also have a substantial negative impact on a species, especially crustaceans and other invertebrates that require calcium carbonate to make their shells or tests (Whiteley 2011; Kroeker et al. 2013; Jones et al. 2017). Climate-driven changes in ocean circulation have been implicated as a factor influencing larval dispersal capacity in fish (Raventos et al. 2021) and invertebrates (Quinn 2017), which in turn can influence recruitment patterns and gene flow. Recent evidence also suggests that intensifying low-oxygen events may have a more severe impact on marine species fitness and distributions than warming (Sampaio et al. 2021). These additional factors could lead to earlier ToEs of some of the resident species evaluated here, particularly those with shells or tests (e.g., American lobster; Keppel et al. 2012; Niemisto et al. 2021) and those with a preference for deep, hypoxifying basins (e.g., Atlantic wolffish; Bianucci et al. 2016). For this reason, further study of additional and interconnected components of the impacts of climate change could be modelled to expand upon the results found here. However, temperature change is primarily the first environmental factor contributing to species distribution shifts (Pinsky et al. 2013). Therefore, our results should be considered as warnings of potential initial responses to climate change within the bioregional conservation network in the coming decades.
5. Conclusions
MPAs and conservation networks are tremendously important tools with which to safeguard marine biodiversity and ecosystems, and the numerous functions and services they provide. MPAs, particularly those with strong protections put in place (“highly protected areas”), have a strong potential to complement tools put in place for climate mitigation, helping to safeguard biodiversity and associated ecosystem function (Jacquemont et al. 2022). However, the influence of climate change will be pervasive, irrespective of whether an area is spatially managed for biodiversity conservation. We demonstrate how climate change will have a variable influence on the effectiveness of a draft network of conservation sites in protecting 40 species of direct and indirect conservation importance, depending on location and our societal approach to emissions reduction. Our results indicate that, within the southwestern portion of the Scotian Shelf-Bay of Fundy region, conservation planners should consider implementing climate change adaptations within network design, management, and monitoring programs, particularly under a scenario of very limited emissions reduction. These adaptations can include setting conservation goals and objectives that can be adapted as necessary, prioritizing enduring features such as habitat features over rapidly shifting species (to support biodiversity, regardless of community composition), supplementing area-based conservation with other management efforts outside of MPA boundaries (i.e., EBFM; Link et al. 2011), performing climate vulnerability or risk assessments (to evaluate how the sites could be further impacted by climate change in the future), including sites that capture projected future habitat for the high-risk species identified here, implementing strong protective measures within new and existing sites (sensu Jacquemont et al. 2022), and/or prioritized monitoring for anticipated changes (to identify new threats such as invasive species, or any needs for re-evaluation of conservation priorities and associated activity restrictions).
As Canada continues towards the conservation objective of 30% by 2030 (30by30 initiative—Global Ocean Alliance 2022) under the U.N. Convention on Biological Diversity (15th Conference of the Parties, 2021), the time is now to build climate change directly to the design and monitoring of MPAs networks (O'Regan et al. 2021; Bryndum-Buchholz et al. 2022). Sites projected to experience a rapid change in species composition could benefit from such a flexible approach to boundary design, or the design of the network itself may need to change to reflect that efficacy based on the contemporary distribution of conservation priority species will not translate into the efficacy in the long term (Tittensor et al. 2019). Implementing predictions of how climate change may influence priority species within the Scotian Shelf-Bay of Fundy bioregion can help to improve the design and ultimately help “future-proof” the network design as best as possible; however, as our results corroborate, the success of conservation efforts may ultimately be predicated on the ability to implement strong climate action through reduced emissions (Penn and Deutsch 2022).
Acknowledgements
We would like to thank Marty King from Fisheries and Oceans Canada's Marine Planning and Conservation Section for providing shape files and help in identifying conservation priority species for the Scotian Shelf-Bay of Fundy bioregion. We also thank Nick Jeffery and Ellen Kenchington for their constructive and helpful review of an earlier version of this manuscript.
References
Alonso D., Pinyol-Gallemí A., Alcoverro T., Arthur R. 2015. Fish community reassembly after a coral mass mortality: higher trophic groups are subject to increased rates of extinction. Ecology Letters, 18(5): 451–461.
Aquamaps. 2021. https://www.aquamaps.org/.
Beal B.F., Kraus MG. 2002. Interactive effects of initial size, stocking density, and type of predator deterrent netting on survival and growth of cultured juveniles of the soft-shell clam, Mya arenaria L., in eastern Maine. Aquaculture, 208: 81–111.
Bengtsson H. 2018. R.matlab: read and write MAT files and call MATLAB from within R. R package version 3.6.2.
Bernier R.Y., Jamieson R.E., Moore A.M. 2018. State of the Atlantic Ocean synthesis report. Canadian Technical Report of Fisheries and Aquatic Sciences 3167, Fisheries and Oceans Canada. pp. 1–149.
Bianchi T.S., Aller R.C., Atwood T.B., Brown C.J., Buatois L.A., Levin L.A., et al. 2021. What global biogeochemical consequences will marine animal–sediment interactions have during climate change? Elementa: Science of the Anthropocene, 9(1): 00180.
Bianucci L., Fennel K., Chabot D., Shackell N., Lavoie D. 2016. Ocean biogeochemical models as management tools: a case study for Atlantic wolffish and declining oxygen. ICES Journal of Marine Science, 73(2): 263–274.
Boudreau S.A., Worm B. 2012. Ecological role of large benthic decapods in marine ecosystems: a review. Marine Ecology Progress Series, 469: 195–213.
Boyce D.G., Worm B. 2015. Patterns and ecological implications of historical marine phytoplankton change. Marine Ecology Progress Series, 534: 251–272.
Boyce D.G., Frank K.T., Worm B., Leggett WC. 2015. Spatial patterns and predictors of trophic control in marine ecosystems. Ecology Letters, 18(10): 1001–1011.
Boyce D.G., Tittensor D.P., Fuller S., Henson S., Kaschner K., Reygondeau G., et al. 2022. Operationalizing climate risk in a global warming hotspot. BioRxiv.
Brennan C.E., Blanchard H., Fennel K. 2016. Putting temperature and oxygen thresholds of marine animals in context of environmental change: a regional perspective for the Scotian Shelf and Gulf of St. Lawrence. PLoS ONE, 11(12).
Brickman D., Alexander M.A., Pershing A., Scott J.D., Wang Z. 2021. Projections of physical conditions in the Gulf of Maine in 2050. Elementa: Science of the Anthropocene, 9(1).
Brickman D., Hebert D., Wang Z. 2018. Mechanism for the recent ocean warming events on the Scotian Shelf of Eastern Canada. Continental Shelf Research, 156: 11–22.
Bricknell I.R., Birkel S.D., Brawley S.H., Van Kirk T., Hamlin H.J., Capistrant-Fossa K., et al. 2020. Resilience of cold water aquaculture: a review of likely scenarios as climate changes in the Gulf of Maine. Reviews in Aquaculture, 13(1): 460–503.
Britten G.L., Dowd M., Worm B. 2016. Changing recruitment capacity in global fish stocks. Proceedings of the National Academy of Sciences of the United States of America, 113: 134–139.
Bryndum-Buchholz A., Boerder K., Stanley R.R.E., Hurley I., Boyce D.G., Dunmall K.M., Tittensor DP. 2022. A climate-resilient marine conservation network for Canada. FACETS, 7(1): 571–590.
Bryndum-Buchholz A., Prentice F., Tittensor D.P., Blanchard J.L., Cheung W.W.L., Christensen V., et al. 2020. Differing marine animal biomass shifts under 21st century climate change between Canada's three oceans. FACETS, 5(1): 105–122.
Carloni J.T., Wahle R., Geoghegan P., Bjorkstedt E. 2018. Bridging the spawner-recruit disconnect: trends in American lobster recruitment linked to the pelagic food web. Bulletin of Marine Science, 94(3): 719–735.
Carver C.E., Chisholm A., Mallet AL. 2003. Strategies to mitigate the impact of Ciona intestinalis (L.) biofouling on shellfish production. Journal of Shellfish Research, 22: 621–631.
Castro K.M., Factor J.R., Angell T., Landers D.F. Jr. 2006. The conceptual approach to lobster shell disease revisited. Journal of Crustacean Biology, 26(4): 646–660.
Chaffin B.C., Garmestani A.S., Angeler D.G., Herrmann D.L., Stow C.A., Nyström M., et al., 2016. Biological invasions, ecological resilience and adaptive governance. Journal of Environmental Management, 183: 399–407.
Cheung W.W., Lam V.W., Sarmiento J.L., Kearney K., Watson R., Pauly D. 2009. Projecting global marine biodiversity impacts under climate change scenarios. Fish and Fisheries, 10(3): 235–251.
Cote D., Konecny C.A., Seiden J., Hauser T., Kristiansen T., Laurel B.J., 2021. Forecasted shifts in thermal habitat for cod species in the northwest Atlantic and eastern Canadian Arctic. Frontiers in Marine Science, 1683.
Crozier L.G., Hutchings JA. 2014. Plastic and evolutionary responses to climate change in fish. Evolutionary Applications, 7: 68–87.
DFO. 2018. Design strategies for a network of Marine Protected Areas in the Scotian Shelf bioregion. DFO Canadian Science Advisory Secretariat Science Advisory Report 2018/006.
DFO. 2020. Operational guidance for identifying ‘other effective area-based conservation measures’ in Canada's marine environment. Fisheries and Oceans Canada. Operational Guidance for Identifying ‘Other Effective Area-Based Conservation Measures’ in Canada's Marine Environment (dfo-mpo.gc.ca).
DFO. 2021a. Canada's Marine conservation targets program. Available from https://www.dfo-mpo.gc.ca/oceans/conservation/index-eng.html.
DFO. 2021b. Stock status update of Scotian Shelf Snow crab (Chionoecetes opilio, O. fabricius). Canadian Science Advisory Secretariat Science Response 2021/033.
Dulvy N.K., Sadovy Y., Reynolds J.D. 2003. Extinction vulnerability in marine populations. Fish and Fisheries, 4(1): 25–64.
Edgar G.J., Stuart-Smith R.D., Willis T.J., Kininmonth S., Baker S.C., Banks S., et al. 2014. Global conservation outcomes depend on marine protected areas with five key features. Nature, 506(7487): 216–220.
Ellingsen K.E., Anderson M.J., Shackell N.L., Tveraa T., Yoccoz N.G., Frank K.T. 2015. The role of a dominant predator in shaping biodiversity over space and time in a marine ecosystem. Journal of Animal Ecology, 84(5): 1242–1252.
Foden W.B., Young B.E., Akçakaya H.R., Garcia R.A., Hoffmann A.A., Stein B.A., Huntley B. 2019. Climate change vulnerability assessment of species. Wiley Interdisciplinary Reviews: Climate Change, 10(1): e551.
Free C.M., Thorson J.T., Pinsky M.L., Oken K.L., Wiedenmann J., Jensen OP. 2019. Impacts of historical warming on marine fisheries production. Science, 363(6430): 979–983.
Fuentes-Yaco C., Koeller P.A., Sathyendranath S., Platt T. 2007. Shrimp (Pandalus borealis) growth and timing of the spring phytoplankton bloom on the Newfoundland & Labrador shelf. Fisheries Oceanography, 16(2): 116–129.
GEBCO. 2021. General bathymetric chart of the ocean gridded bathymetry data. Available from https://www.gebco.net/data_and_products/gridded_bathymetry_data/.
Gjerdrum C., Loch J., Fifield D.A. 2018. The recent invasion of Cory's shearwaters into Atlantic Canada. Northeastern Naturalist, 25(4): 532–544.
Glenn R.P., Pugh TL. 2006. Epizootic shell disease in American lobster (Homarus americanus) in Massachusetts coastal waters: interactions of temperature, maturity, and intermolt duration. Journal of Crustacean Biology, 26: 639–645.
Government of Canada. 2011. National framework for Canada's network of Marine Protected Areas. Fisheries and Oceans Canada, Ottawa. p. 31.
Greenan B.J., Shackell N.L., Ferguson K., Greyson P., Cogswell A., Brickman D., Saba V.S. 2019. Climate change vulnerability of American lobster fishing communities in Atlantic Canada. Frontiers in Marine Science, 579.
Grieve B.D., Hare J.A., Saba V.S. 2017. Projecting the effects of climate change on Calanus finmarchicus distribution within the US Northeast Continental Shelf. Scientific Reports, 7(1): 1–12.
Guisan A., Zimmermann N.E., 2000. Predictive habitat distribution models in ecology. Ecological Modelling, 135(2–3): 147–186.
Henson S.A., Beaulieu C., Ilyina T., John J.G., Long M., Séférian R., et al. 2017. Rapid emergence of climate change in environmental drivers of marine ecosystems. Nature Communications, 8(1).
Höhne N., Gidden M., Elzen M., Hans F., Fyson C., Geiges A., et al. 2021. Wave of net zero greenhouse gas emission targets opens window on meeting the Paris Agreement.
Howard B.R., Francis F.T., Côté I.M., Therriault TW. 2019. Habitat alteration by invasive European green crab (Carcinus maenas) causes eelgrass loss in British Columbia, Canada. Biological Invasions, 21(12): 3607–3618.
Hughes T., Bellwood D., Folke C., Steneck R., Wilson J. 2005. New paradigms for supporting the resilience of Marine Ecosystems. Trends in Ecology & Evolution, 20(7): 380–386.
IPCC. 2000. Emissions scenarios. Cambridge University Press, Cambridge, UK. p. 570. https://www.ipcc.ch/report/emissions-scenarios/.
IPCC. 2021. Climate change 2021: the physical science basis. Contribution of Working Group I to the Sixth Assessment Report of the Intergovernmental Panel on Climate Change. Cambridge University Press. In Press.
Jacquemont J., Blasiak R., Le Cam C., Le Gouellec M., Claudet J. 2022. Ocean conservation boosts climate change mitigation and adaptation. One Earth, 5, 1126–1138.
Jiang W., Gastineau G., Codron F. 2021. Atlantic multi-centennial variability in IPSL-CM6A-LR climate model. EGU General Assembly.
Jones E.M., Fenton M., Meredith M.P., Clargo N.M., Ossebaar S., Ducklow H.W., et al. 2017. Ocean acidification and calcium carbonate saturation states in the coastal zone of the West Antarctic Peninsula. Deep Sea Research Part II: Topical Studies in Oceanography, 139: 181–194.
Keppel E.A., Scrosati R.A., Courtenay S.C. 2012. Ocean acidification decreases growth and development in American lobster (Homarus americanus) larvae. Journal of Northwest Atlantic Fishery Science, 44: 61–66.
Kroeker K.J., Kordas R.L., Crim R., Hendriks I.E., Ramajo L., Singh G.S., Gattuso J.P. 2013. Impacts of ocean acidification on marine organisms: quantifying sensitivities and interaction with warming. Global Change Biology, 19(6): 1884–1896.
Lima A.R.A., Baltazar-Soares M., Garrido S., Riveiro I., Carrera P., Piecho-Santos A.M., et al. 2022. Forecasting shifts in habitat suitability across the distribution range of a temperate small pelagic fish under different scenarios of climate change. Science of The Total Environment, 804: 150167.
Link J.S., Bundy A., Overholtz W.J., Shackell N., Manderson J., Duplisea D., et al. 2011. Ecosystem-based fisheries management in the Northwest Atlantic. Fish and Fisheries, 12(2): 152–170.
Lotterhos K.E., Láruson Á.J., Jiang L-Q. 2021. Novel and disappearing climates in the global surface ocean from 1800 to 2100. Scientific Reports, 11(1).
Lurgi M., López B.C., Montoya JM. 2012. Novel communities from climate change. Philosophical Transactions of the Royal Society B: Biological Sciences, 367(1605): 2913–2922.
Lyons D.A., Lowen J.B., Therriault T.W., Brickman D., Guo L., Moore A.M., et al. 2020. Identifying marine invasion hotspots using stacked species distribution models. Biological Invasions, 22(11): 3403–3423.
Manes S., Costello M.J., Beckett H., Debnath A., Devenish-Nelson E., Grey K.A., Vale M.M. 2021. Endemism increases species' climate change risk in areas of global biodiversity importance. Biological Conservation, 257: 109070.
Matthews H.D., Wynes S. 2022. Current global efforts are insufficient to limit warming to 1.5°C. Science 376: 1404–1409.
McLean M., Mouillot D., Maureaud A.A., Hattab T., MacNeil M.A., Goberville E., Auber A. 2021. Disentangling tropicalization and deborealization in marine ecosystems under climate change. Current Biology, 31(21): 4817–4823.
Meyer-Gutbrod E.L., Greene C.H., Sullivan P.J., Pershing AJ. 2015. Climate-associated changes in prey availability drive reproductive dynamics of the North Atlantic right whale population. Marine Ecology Progress Series, 535: 243–258.
Niemisto M., Fields D.M., Clark K.F., Waller J.D., Greenwood S.J., Wahle RA. 2021. American lobster postlarvae alter gene regulation in response to ocean warming and acidification. Ecology and Evolution, 11(2): 806–819.
NS Department of Fisheries & Aquaculture. 2014. Commercial fisheries, industry overview. Retrieved May 5, 2022 Industry Overview - Government of Nova Scotia, Canada.
O'Brien J.M., Stanley R.R., Jeffery N.W., Heaslip S.G., DiBacco C., Wang Z. 2022. Modeling demersal fish and benthic invertebrate assemblages in support of marine conservation planning. Ecological Applications, e2546.
O'Regan S.M., Archer S.K., Friesen S.K., Hunter KL. 2021. A global assessment of climate change adaptation in marine protected area management plans. Frontiers in Marine Science, 8: 711085.
OBIS. 2021. The Ocean Biodiversity Information System. Available from https://obis.org/.
Oliver E.C., Donat M.G., Burrows M.T., Moore P.J., Smale D.A., Alexander L.V., Wernberg T. 2018. Longer and more frequent marine heatwaves over the past century. Nature Communications, 9(1): 1–12.
Osland M.J., Stevens P.W., Lamont M.M., Brusca R.C., Hart K.M., Waddle J.H., Seminoff JA. 2021. Tropicalization of temperate ecosystems in North America: the northward range expansion of tropical organisms in response to warming winter temperatures. Global Change Biology, 27(13): 3009–3034.
Pacifici M., Foden W.B., Visconti P., Watson J.E., Butchart S.H., Kovacs K.M., et al. 2015. Assessing species vulnerability to climate change. Nature Climate Change, 5(3): 215–224.
Pebesma E. 2018. Simple features for R: standardized suppor for spatial vector data. R Journal, 10(1): 439–446.
Pendleton D.E., Sullivan P.J., Brown M.W., Cole T.V., Good C.P., Mayo C.A., et al. 2012. Weekly predictions of North Atlantic right whale Eubalaena glacialis habitat reveal influence of prey abundance and seasonality of habitat preferences. Endangered Species Research, 18(2): 147–161.
Penn J.L., Deutsch C. 2022. Avoiding ocean mass extinction from climate warming. Science, 376(6592): 524–526.
Pielke R. Jr, Burgess M.G., Ritchie J. 2022. Plausible 2005–2050 emissions scenarios project between 2 °C and 3 °C of warming by 2100. 2022. Environmental Research Letters, 17(2): 024027.
Pinsky M.L., Eikeset A.M., McCauley D.J., Payne J.L., Sunday J.M. 2019. Greater vulnerability to warming of marine versus terrestrial ectotherms. Nature, 569(7754): 108–111.
Pinsky M.L., Fenichel E., Fogarty M., Levin S., Mccay B., Martin K.S., et al. 2021. Fish and fisheries in hot water: what is happening and how do we adapt? Population Ecology, 63(1): 17–26.
Pinsky M.L., Worm B., Fogarty M.J., Sarmiento J.L., Levin S.A. 2013. Marine taxa track local climate velocities. Science, 341(6151): 1239–1242.
Pope V.D., Gallani M.L., Rowntree P.R., Stratton RA. 2000. The impact of new physical parametrizations in the Hadley Centre climate model: HadAM3. Climate Dynamics, 16(2–3): 123–146.
Pörtner H.O., Farrell AP. 2008. Physiology and climate change. Science, 322: 690–692.
Pörtner HO. 2001. Climate change and temperature-dependent biogeography: oxygen limitation of thermal tolerance in animals. Naturwissenschaften, 88(4): 137–146.
Pound K.L., Larson C.A., Passy SI. 2020. Current distributions and future climate-driven changes in diatoms, insects and fish in U.S. streams. Global Ecology and Biogeography, 30(1): 63–78.
Quinn BK. 2017. Threshold temperatures for performance and survival of American lobster larvae: a review of current knowledge and implications to modeling impacts of climate change. Fisheries Research, 186: 383–396.
Raventos N., Torrado H., Arthur R., Alcoverro T., Macpherson E. 2021. Temperature reduces fish dispersal as larvae grow faster to their settlement size. Journal of Animal Ecology, 90(6): 1419–1432.
Reygondeau G., Beaugrand G. 2011. Future climate-driven shifts in distribution of Calanus finmarchicus. Global Change Biology, 17(2): 756–766.
Richards R.A., Hunter M. 2021. Northern shrimp Pandalus borealis population collapse linked to climate-driven shifts in predator distribution. PLoS ONE, 16(7).
Rozalska K., Coffen-Smout S. 2020. Maritimes region Fisheries atlas: catch weight landings mapping (2014–2018) on a hexagon grid. Canadian Technical Report of Fisheries and Aquatic Sciences, 3373: vi + 68.
RStudio Team. 2021. RStudio: integrated development environment for R. RStudio, PBC, Boston, MA. http://www.rstudio.com/.
Sampaio E., Santos C., Rosa I.C., Ferreira V., Pörtner H.O., Duarte C.M., et al. 2021. Impacts of hypoxic events surpass those of future ocean warming and acidification. Nature Ecology & Evolution, 5(3): 311–321.
Schram C., Ladell K., Mitchell J., Chute C. 2019. From one to ten: Canada's approach to achieving marine conservation targets. Aquatic Conservation: Marine and Freshwater Ecosystems, 29: 170–180.
Semmler T., Danilov S., Gierz P., Goessling H.F., Hegewald J., Hinrichs C., et al. 2020. Simulations for CMIP6 with the AWI Climate Model AWI-CM-1-1. Journal of Advances in Modeling Earth Systems, 12(9).
Shackell N., Greenan B., Pepin P., Chabot D., Warburton A. 2013. Climate change impacts, vulnerabilities and opportunities analysis of the Marine Atlantic Basin. Canadian Manuscript Report of Fisheries and Aquatic Sciences 3012, Fisheries and Oceans Canada.
Shackell N.L., Frank K.T. 2007. Compensation in exploited marine fish communities on the Scotian Shelf, Canada. Marine Ecology Progress Series, 336: 235–247.
Shackell N.L., Keith D.M., Lotze HK. 2021. Challenges of gauging the impact of area-based fishery closures and OECMs: a case study using long-standing Canadian groundfish closures. Frontiers in Marine Science, 8.
Shackell N.L., Ricard D., Stortini C. 2014. Thermal habitat index of many Northwest Atlantic temperate species stays neutral under warming projected for 2030 but changes radically by 2060. PLoS One, 9(3): e90662.
Shepherd T., Page F., Macdonald B. 2002. Length and sex-specific associations between spiny dogfish (Squalus acanthias) and hydrographic variables in the Bay of Fundy and Scotian Shelf. Fisheries Oceanography, 11(2): 78–89.
Sillero N., Arenas-Castro S., Enriquez-Urzelai U., Vale C.G., Sousa-Guedes D., Martínez-Freiría F., et al. 2021. Want to model a species niche? A step-by-step guideline on correlative ecological niche modelling. Ecological Modelling, 456: 109671.
Stanley R.R., DiBacco C., Lowen B., Beiko R.G., Jeffery N.W., Van Wyngaarden M., et al. 2018. A climate-associated multispecies cryptic cline in the northwest Atlantic. Science Advances, 4(3): eaaq0929.
Stortini C.H., Frank K.T., Leggett W.C., Shackell N.L., Boyce D.G. 2018. Support for the trophic theory of island biogeography across submarine banks in a predator-depleted large marine ecosystem. Marine Ecology Progress Series, 607: 155–169.
Stortini C.H., Frank K.T., Ontiveros V.J., Leggett W.C., Shackell NL. 2021. Maintenance of long-term equilibrium in a perturbed metacommunity of sub-arctic marine fishes. Marine Ecology Progress Series, 675: 81–96.
Stortini C.H., Shackell N.L., Tyedmers P., Beazley K. 2015. Assessing marine species vulnerability to projected warming on the Scotian Shelf, Canada. ICES Journal of Marine Science, 72(6): 1731–1743.
Stuart-Smith R.D., Edgar G.J., Barrett N.S., Kininmonth S.J., Bates AE. 2015. Thermal biases and vulnerability to warming in the world's marine fauna. Nature, 528(7580): 88–92.
Sydeman W.J., Schoeman D.S., Thompson S.A., Hoover B.A., García-Reyes M., Daunt F., et al. 2021. Hemispheric asymmetry in ocean change and the productivity of ecosystem sentinels. Science, 372(6545): 980–983.
Sylvester JR. 1972. Possible effects of thermal effluents on fish: a review. Environmental Pollution (1970), 3(3): 205–215.
Tanaka K.R., Chang J., Xue Y., Li Z., Jacobson L., Chen Y. 2019. Mesoscale climatic impacts on the distribution of Homarus americanus in the US inshore Gulf of Maine. Canadian Journal of Fisheries and Aquatic Sciences, 76: 608–625.
Tittensor D.P., Beger M., Boerder K., Boyce D.G., Cavanagh R.D., Cosandey-Godin A., et al. 2019. Integrating climate adaptation and biodiversity conservation in the global ocean. Science Advances, 5(11).
Trisos C.H., Merow C., Pigot AL. 2020. The projected timing of abrupt ecological disruption from climate change. Nature, 580(7804): 496–501.
Vergés A., Steinberg P.D., Hay M.E., Poore A.G., Campbell A.H., Ballesteros E., et al. 2014. The tropicalization of temperate marine ecosystems: climate-mediated changes in herbivory and community phase shifts. Proceedings of the Royal Society B: Biological Sciences, 281(1789): 20140846.
Wahle R.A., Gibson M., Fogarty M. 2009. Distinguishing disease impacts from larval supply effects in a lobster fishery collapse. Marine Ecological Progress Series, 376: 185–192.
WCRP. 2021. World Climate Research Program coupled model intercomparison project (Phase 6). Available from https://esgf-node.llnl.gov/projects/cmip6/.
Weiskopf S.R., Rubenstein M.A., Crozier L.G., Gaichas S., Griffis R., Halofsky J.E., et al. 2020. Climate change effects on biodiversity, ecosystems, ecosystem services, and Natural Resource Management in the United States. Science of the Total Environment, 733: 137782.
Whiteley N., Mackenzie C. 2016. Physiological responses of marine invertebrates to thermal stress. In Stressors in the marine environment: physiological and ecological responses; societal implications. Edited by M. Solan, N. Whiteley. Oxford University Press. pp. 56–72.
Whiteley N.M. 2011. Physiological and ecological responses of crustaceans to ocean acidification. Marine Ecology Progress Series, 430: 257–271.
Wickham H., François R., Henry L., Müller K. 2022. dplyr: a grammar of data manipulation. R package version 1.0.9.
Wickham. 2016. ggplot2: elegant graphics for data analysis. Springer-verlag, New York, NY.
Wilson E., Garbary DJ. 2020. Absence of recovery in a degraded eelgrass (Zostera marina) bed in Nova Scotia, Canada: results from a transplant study. Proceedings of the Nova Scotian Institute of Science (NSIS), 50(2): 251.
Wilson K.L., Tittensor D.P., Worm B., Lotze HK. 2020. Incorporating climate change adaptation into marine protected area planning. Global Change Biology, 26(6): 3251–3267.
Worm B., Lotze HK. 2021. Marine biodiversity and climate change. In Climate change. pp. 445–464. Elsevier.
Zisserson B.M., Cameron B.J., Glass A.C., Choi J.S., Canadian Science Advisory Secretariat. 2018. Assessment of Scotian Shelf snow crab in 2018. Fisheries and Oceans Canada, Canadian Science Advisory Secretariat. Research Document, 1919–5044: 2021/048.
Supplementary material
Supplementary Material 1 (DOCX / 425 KB).
- Download
- 425.23 KB
Information & Authors
Information
Published In

FACETS
Volume 8 • January 2023
Pages: 1 - 16
Editor: Irene Gregory-Eaves
History
Received: 31 August 2022
Accepted: 9 January 2023
Version of record online: 25 May 2023
Notes
This paper is part of a collection titled “Climate change and the Canadian marine conservation framework”.
Copyright
© 2023 Author Lewis and The Crown. This work is licensed under a Creative Commons Attribution 4.0 International License (CC BY 4.0), which permits unrestricted use, distribution, and reproduction in any medium, provided the original author(s) and source are credited.
Data Availability Statement
All data and code used and created in this study can be found here: rystanley/MAR_thermal_emerg: Analysis of thermal emergence for the Scotian Shelf-Bay of Fundy bioregion (github.com).
Key Words
Sections
Subjects
Plain Language Summary
Predicting the loss of preferred thermal habitats of fish and invertebrates to support future decisions regarding Marine Protected Areas: a case study
Authors
Author Contributions
Conceptualization: SAL, CHS, RRES
Data curation: SAL, CHS, RRES
Formal analysis: SAL, CHS, RRES
Funding acquisition: SAL, CHS, RRES
Investigation: SAL, CHS, RRES
Methodology: SAL, CHS, RRES
Project administration: SAL, CHS, RRES
Resources: CHS, DGB, RRES
Software: CHS, RRES
Supervision: CHS, RRES
Validation: CHS, DGB, RRES
Visualization: SAL, CHS, RRES
Writing – original draft: SAL, CHS, RRES
Writing – review & editing: SAL, CHS, DGB, RRES
Competing Interests
The authors declare that there are no competing interests.
Metrics & Citations
Metrics
Other Metrics
Citations
Cite As
Shaylyn A. Lewis, Christine H. Stortini, Daniel G. Boyce, and Ryan R.E. Stanley. 2023. Climate change, species thermal emergence, and conservation design: a case study in the Canadian Northwest Atlantic. FACETS.
8(): 1-16. https://doi.org/10.1139/facets-2022-0191
Export Citations
If you have the appropriate software installed, you can download article citation data to the citation manager of your choice. Simply select your manager software from the list below and click Download.
There are no citations for this item