Among domestic animals, cats (
Felis catus) are unique as they have retained many of the behavioural and physical traits of their ancestors. They are able to survive and reproduce without human intervention and have co-evolved alongside humans, becoming in essence “wild companions” that maintain their roles as pest controllers and companion animals (
Crowley et al. 2020). Cats thrive in urban environments, where their populations are dynamic, complex, and strongly influenced by people's behaviour and values, making managing urban cat populations challenging (
Flockhart and Coe 2018). It is no coincidence that some of the most difficult human management challenges are frequently described as “herding cats”. In some parts of the world, such as North America, most domestic cats live within their owner's homes and only experience time outdoors under supervision or restraint (
Nature Canada 2017;
Tan et al. 2020;
Foreman-Worsley et al. 2021), but many cats are allowed to wander outdoors unsupervised by their owners (i.e., indoor–outdoor cats), and some cats do not have owners (i.e., are unowned, stray, or feral) and are able to survive without direct human influence (
Crowley et al. 2020). It can be challenging to identify unowned from owned cats visually; thus, cats that are outdoors unsupervised are often referred to as free-roaming or free-ranging. In this paper, we will use the new term “wandering” cats to refer to any cat that is outdoors unsupervised or unconstrained. This aligns with some of the common language used in municipal animal-focused bylaws in Canada and with focus-group research findings (unpublished as part of background research for Nature Canada's Cats and Birds Campaign) suggesting to avoid the terminology of “free” or the concept of “freedom” because it evokes various biases.
Wandering cat management is complicated in part due to the sometimes deep divides among members of the public and stakeholders (such as cat owners, veterinarians, shelters/rescues, animal rights organizations, welfare advocates, and conservationists). This complexity is partly driven by a number of scientific uncertainties surrounding the welfare and environmental impacts of wandering cats (
Marra and Santella 2016;
Wald and Peterson 2020). These uncertainties and the conflict stemming from them often originate from a lack of experimental research on the positive and negative consequences of allowing cats to wander (
Wald and Peterson 2020). Arguments for allowing cats to wander mainly focus on the benefits cats gain from engaging in natural behaviours such as scratching, climbing, breeding, running, exploring, and hunting (
Tan et al. 2020). Arguments regarding the negative costs of allowing cats to wander include the increased welfare risks or death to the cats themselves, including being crushed by vehicles (
Tan et al. 2020), hybridization with wild felids (
Fredriksen 2016), and harming wildlife through predation (
Blancher 2013;
Dickman and Newsome 2015;
Doherty et al. 2016;
Piontek et al. 2021). Domestic cats also transmit diseases to other cats and animals and may pose public health risks (
Gerhold and Jessup 2013;
Day 2016;
Salinas-Ramos et al. 2021).
Issues and controversies surrounding cats date back centuries (
Marra and Santella 2016), but have only more recently been acknowledged within the public domain (
Gow et al. 2022). The consequences of allowing cats to wander may seem small or negligible at the level of an individual cat, but at the scale of an entire city, where cats can often occur at exceptionally high densities relative to other mammals, their impacts are exponentially higher (
Kays et al. 2020). A starting point to address the numerous complex issues and uncertainties surrounding wandering cats and the many associated social and ecological dimensions is to identify the magnitude of the problem (e.g., the abundance or number of wandering cats in a given location). Doing so provides a greater understanding of cat population dynamics (
Flockhart and Coe 2018) and identifies where and what areas of a city may be facing the most challenges from high populations of wandering cats. This helps to direct and target limited resources to be targeted towards specific management actions, such as educational campaigns or other programs.
Identifying both human and environmentally based factors affecting cat abundance is important to provide information for stakeholders. This information, especially when based on the best available science from research conducted locally, can then be used to inform management strategies or interventions to reduce the number of wandering cats in a community or municipality. Previous studies have shown there are numerous factors influencing cat abundances, including human-ownership patterns (
Sims et al. 2008), time of year (
Clyde et al. 2022), food availability (
Calhoon and Haspel 1989;
Mirmovitch 1995), the availability of veterinary care (
Finkler et al. 2011), the presence of other predators such as coyotes (
Canis latrans;
Crooks and Soulé 1999;
Kays et al. 2015;
Clyde et al. 2022), breeding opportunities (
Finkler et al. 2011), various habitat or socio-economic characteristics (
Aguilar and Farnworth 2012,
2013;
Flockhart et al. 2016;
Clyde et al. 2022;
Cove et al. 2022), and local shelter intakes and outtakes (
Flockhart and Coe 2018). Overall, abundance patterns of cats within a city may be mediated by a range of factors that are context-specific. Drawing conclusions about what influences wandering cat abundance can be challenging due to a lack of replication within and between similar structured environments or geographic locations. Every city is unique; therefore, cat abundances and patterns of those abundances found within one city may not be applicable or transferrable across other cities. This emphasizes the benefit to interested parties of conducting research that is city- and context-specific.
There are many things to consider when selecting a method to estimate the abundance of wandering cats. First, humans have varying levels of control over wandering cats and their food provisioning, reproduction, and movement based on their category of ownership (e.g., owned, indoor–outdoor, unowned), which can influence cat behaviours (
Crowley et al. 2019). Cat activity patterns and home ranges may vary with the type of cat, the natural behaviour of cats, and the landscape (
Clancy et al. 2003;
Schmidt et al. 2007;
Horn et al. 2011;
Kays et al. 2020). Second, people (i.e., owners or people caring for cats) can influence when a cat is outside, meaning that some cats may only be available for detection during some parts of the day or night (
Clancy et al. 2003). Cats may have different diurnal and nocturnal activity levels and may move out of cover and to sheltered places under the cover of darkness (
Horn et al. 2011;
Kays et al. 2015), making them harder to detect during the day even though they are present. Finally, the mosaic of buildings, streets, yards, and green spaces in urban areas creates a plethora of places that cats can wander and explore, making it challenging to locate a cat within its home range at any given time. Using trail cameras can mitigate some of these challenges, as they allow cats to be detected at any time of the day, and individual cats can be identified and easily counted. Not all cats within a region need to be identified and captured on photos to acquire abundance estimates (
Elizondo and Loss 2017;
Clyde et al. 2022). Using trail cameras presents several additional logistical and financial challenges (discussed in
Clyde et al. 2022), including the need for various levels of stakeholder and community engagement, the potential high costs of purchasing numerous trail cameras, and the challenge of uploading, viewing, and sorting sometimes thousands to millions of images. Statistical modelling also requires advanced skills in coding and statistics, which may not be available to all stakeholders interested in estimating cat abundance.
We developed an approach that can be led by interested parties and generates meaningful scientifically driven information, including estimates of local abundance, population sizes and densities, and habitat associations of wandering cats. This approach uses minimal equipment and is low-cost. Here, we present the approaches, methodology, and findings of a study we conducted in a medium-sized city, Gatineau, Québec, Canada, to estimate cat local abundances. We had three primary objectives: (1) develop a methodology to monitor and assess local cat abundance and habitat associations that could be adopted and led by organizations or individuals in other communities across Canada (or elsewhere in the world); (2) produce local abundance estimates, population size estimates, and maps that could be used by decision-makers to target neighbourhoods with cat management strategies and test the effectiveness of animal control policies or approaches; and (3) test hypotheses (
Table 1) to explain variation in cat local abundance that could further contribute to identifying where cats are most abundant.
Methods
Study site and trail cameras
We conducted this study in the municipality of Gatineau, PQ, Canada (45.4772°N, 75.7016°W) and the southern portion of Gatineau Park. Gatineau is located on the unceded territory of the Algonquin First Nation. The City of Gatineau is located on the northern bank of the Ottawa River, has a population of 291,041 in 2021, and covers 341.84 km
2 with a population density of 851.4 people per km
2 (
Statistics Canada 2022). Gatineau is like many other Canadian cities, with most areas dominated by single- or multi-family homes with small yards, wide roads mainly used for cars, and several public parks or green spaces. Gatineau differs from many cities in Canada in that it has extensive, large areas of green space, much of which is parkland, within the city boundaries. Gatineau Park and other lands owned by the National Capital Commission of Canada or the City of Gatineau are the largest features. Some neighbourhoods have approximately 50% canopy cover, whereas others are more impoverished in their tree cover (
National Capital Commission 2019). There are also extensive bands of forested habitat along the Ottawa River and sections of the Gatineau River.
In 2020, we conducted field research to estimate wandering cat local abundance using photos taken at 55 sites. This was done by using a total of six trail cameras that were individually moved between sites every 2 weeks. Urban landscapes have been defined as those in the urban matrix (pavement, buildings, and green space around buildings) and urban habitat patches (transportation corridors, river banks, and parks;
Swanwick et al. 2003). Including both of these urban landscapes is important for assessing populations and the occurrence of mammalian species in urban areas (
Herrera et al. 2021). Each camera site consisted of a single-camera setup on two classes of land: private lands within the urban matrix (e.g., in yards) within the City of Gatineau (
n = 33; hereafter referred to as urban sites), or within a large, forested urban habitat patches on public lands (including Gatineau Park, the River Corridor, and other large forest patches;
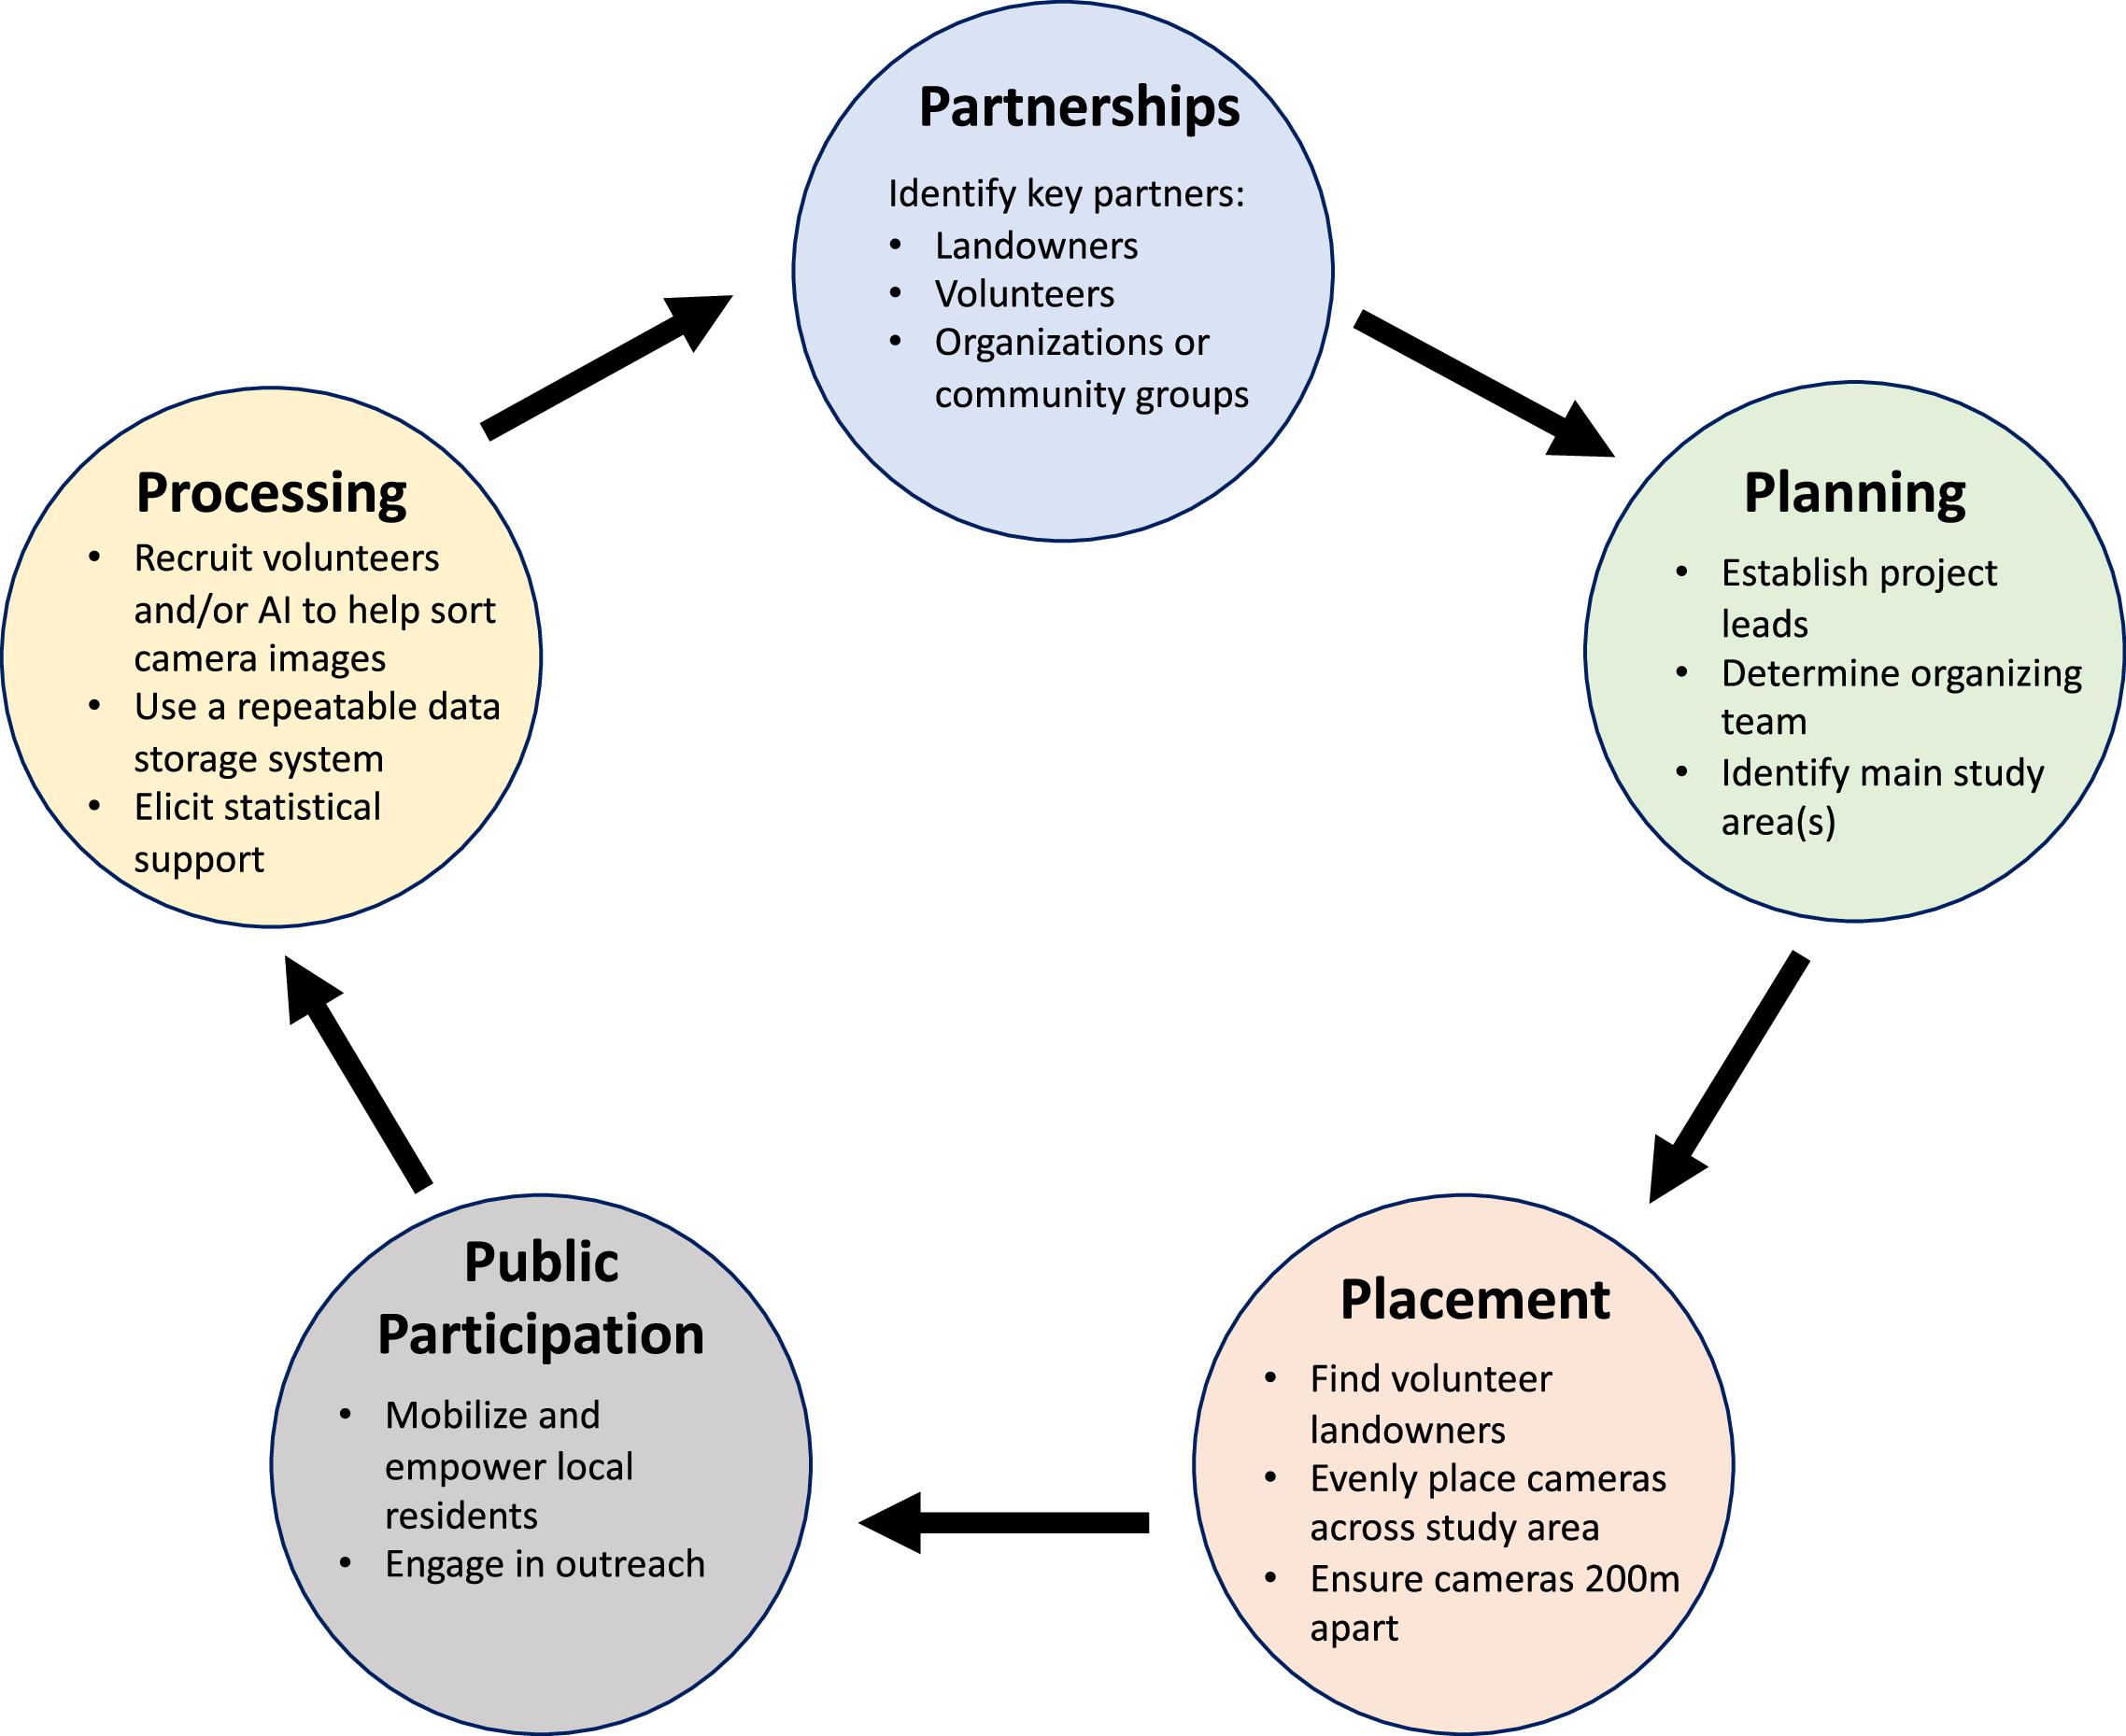
n = 22; hereafter referred to as parkland sites). We present this research with reference to the Five P's of urban ecology: partnerships, planning, placements, public participation, and processing (
Herrera et al. 2021). We present a summary of these methods and this approach in
Fig. 1.
Partnerships
For cameras set up on urban sites, partnerships were developed between landowners and study volunteers. We recruited volunteer landowners from personal networks and from members of a local naturalists’ club (i.e., Club des Ornithologues de l'Outaouais), and by speaking or engaging with local organizations or community groups. We limited the distribution of cameras to the Hull and Aylmer Sectors of Gatineau. No cameras were placed in the Gatineau Sector or further to the east. Many of the landowner volunteers also helped with camera deployment, as well as memory card and data management. This further increased their interest and engagement. Landowners also helped with identifying suitable trail camera locations within their yards, including attaching the cameras to trees, poles, fence posts, or other structures. The specific location of each camera was based on the characteristics of the property or area. We obtained a research permit before placing trail cameras on National Capital Commission lands, including Gatineau Park. We also acquired landowner permission before deploying trail cameras at urban sites (i.e., on private property).
Planning
The planning of this research involved members of a non-profit organization, a public local naturalist club, and scientists specializing in animal ecology. The research was established and led by staff within Nature Canada and associated university undergraduate students (some of whom are co-authors on this manuscript) in partnership with the Club des Ornithologues de l'Outaouais (COO). A small team of directors from the COO participated in project planning, recruiting volunteers, informing their members of the project, managing cameras, and helping with image sorting and data management. The scientific team, along with the project leads, oversaw the study design as well as the data management and analyses.
Placement
The characteristics of the urban and parkland landscapes required slightly different
placement methods for selecting camera sites (the locations of each camera). Ideally, deploying camera sites on urban sites would be randomly determined, but this was not always possible due to challenges with recruiting private landowners and conducting this research during a global pandemic where going door-to-door to recruit volunteers was illegal. In this region, emergency public-health authorities created restrictions on the movement and interaction of humans for over a year (April 2020–July 2021) in efforts to reduce the transmission and spread of Covid-19. Instead, we aimed to deploy trail cameras on urban sites located on private property that evenly spanned the majority of the city and captured different land uses and socio-economic conditions. We only selected private properties at which the owner either did not have a cat, or, if they did, did not allow their own cat(s) outside. The trail cameras we used were Strike Force Pro X infrared trail cameras made by Browning Trail Cameras (Birmingham, AL, USA), with a 1/3 s picture trigger and an eight photo burst at 1 min intervals. We attempted to increase detection by positioning cameras at cat height of 30–60 cm from the ground, and pointing (where possible) towards animal corridors, such as along fence lines or pathways. All camera sites on urban and parklands were at least 200 m apart, which is above the 100 m distance that reduced detection of duplicate cats (see
Clyde et al. 2022).
Public participation
Public engagement (
public participation) was an important dimension of this work, and the political/social context informed our approach and rationale for this research. Much of Nature Canada's work with network partners involves a process called engagement organizing (
Price 2017) to foster social change. The process involves mobilizing and empowering local residents to use their power as citizens to change the socio-political conditions in ways that are more favourable to conserving and restoring biodiversity, often within the context of social justice. Gatineau has a bylaw (No. 183-2005) indicating that all domestic animals should be kept on their keeper's property and must be under constant constraint or supervision, which prohibits cat owners from allowing their cats to wander off their property (
City of Gatineau 2005). Cat owners are also required to licence their cats. Many Gatineau residents and bird advocates from the COO have expressed concern about the number of outdoor cats in Gatineau, the ecological consequences of their behaviours, and the general lack of knowledge amongst residents of the bylaw or the socio-ecological, cat welfare, and human and animal health-related challenges of allowing cats to wander. Prior to starting this study, a study commissioned by Nature Canada involved surveying the population of Gatineau through both a randomized phone survey conducted by a survey company and an online survey distributed to members and supporters of either the SPCA of Gatineau or the COO to understand their views on cats roaming unsupervised outdoors (
Nature Canada 2017). The results were consistent with other surveys Nature Canada has completed elsewhere in Canada. Most cat owners in Gatineau (75%) keep their cats from wandering at large (a slightly higher percentage than the national average of 72%;
Canadian Federation of Humane Societies 2017). Slightly over half (55%) of residents believe that cats should not wander at large. About half (48%) of cat owners are aware of the bylaw prohibiting cats from wandering off of an owner's property (
Nature Canada 2017).
We engaged in a number of outreach activities. We undertook specific outreach within the membership of the COO, including conducting a presentation for COO members on the project and the issue and also publishing a blog post describing the study on Nature Canada's website (
Nature Canada 2020). We also sought the support of the local Society for the Prevention of Cruelty to Animals (SPCA), the SPCA de l'Outaouais, by meeting with their Executive Director and key staff. We presented our work to staff in the City of Gatineau, the National Capital Commission, and a committee of Gatineau municipal councillors.
Processing
A substantial amount of effort was used in each phase as well as in the processing time. With only six cameras being deployed, one of which was stolen part way through the study, cameras had to be consistently moved between camera locations every 2 weeks. Overall, 43,759 photos were generated. Nine volunteers collectively spent a total of ∼200 h sorting and reviewing camera images to determine the following: the number of cats in each image, whether the same cat was observed at different times and at different locations, and the species of wildlife observed at each camera location (as part of the outreach to community members).
We ensured this research was conducted ethically by taking a number of steps. First, we presented and discussed this research with the National Capital Commission staff, who have a strict protocol for research on their lands, including deleting and not sharing any human images (i.e., all images of humans were separated, removed, and deleted). Second, we ensured each landowner volunteer received written and verbal information about the study and the specific protocols. Once a landowner chose to participate, they were invited to virtual information sessions about the project, given tutorials and instructional guidance about using trail cameras in the language of their choice (French or English), and informed of how and when someone may be visiting their property to install or remove the camera. In addition, since one of our objectives was to develop protocols that groups elsewhere could use to assess local cat abundances, we also solicited feedback from volunteers about their involvement, which led to some modifications in instruction and information sessions. Finally, all locations of trail cameras on urban sites are not disclosed to ensure landowner identity remains private.
We assessed local cat abundances and whether they were associated with different habitat or social characteristics (see
Table 1 and statistical analyses) by deploying each trail camera for two weeks between 15 April and 1 November 2020, when weather was generally favourable (e.g., temperatures above zero, and there was no snow). We expected and assumed cat detection and abundance to be relatively consistent over this time. The six trail cameras were moved among the 55 camera sites by volunteers every 14–16 days. In some cases, landowner volunteers had restrictions on when a camera could be set up on their property, so while efforts were made to deploy cameras at locations randomly rather than sequentially moving to the next closest camera, this was not always possible. For parkland sites, the timing of camera location deployments was in a random order.
We identified cats based on their coat patterns and colour, as well as their body size and shape. In at least one case, multiple cat images at a camera site looked identical. In this instance, we only counted cats as different if multiple identical cats occurred in a single photo (as in
Elizondo and Loss (2017) and
Clyde et al. (2022)).
Statistical analysis
We followed the analysis methods in
Clyde et al. (2022), which involved estimating local cat abundance using hierarchical N-mixture models (function
pcount) from the
unmarked package (
Fiske and Chandler 2011) in R version 4.0.3 (
R Core Team 2020). This approach allowed us to relate and predict local cat abundances in relation to a variety of habitat features by using the count of individuals/camera site during a 24 h sampling occasion while accounting for overdispersion and non-perfect detection (
Kéry and Royle 2015). This ensured that local abundance estimation was not over- or underestimated due to variation between sampling occasions. We used fourteen 24 h sampling occasions per camera in our analyses. The data used in this manuscript are publicly available on the Figshare open access repository 10.6084/m9.figshare.23564496 (
Gow et al. 2023).
Hierarchical N-mixture models
For objectives 2 and 3, we estimated the local abundance of cats using hierarchical N-mixture modelling, which included two sub-models. Using a negative binomial distribution, we first modelled detection probability (i.e., the probability that cats may not be detected if they were present), and then abundance probability. We estimated abundance using the equation Ni ∼ Negative Binomial(λi, α), and detection probability using the equation γij|Ni ∼ Binomial(Niρj), where Ni is abundance and λi is the mean local abundance cats at site i, α is the dispersion parameter, γij is the detection or non-detection of an individual cat at site i during the jth survey, and ρj is the detection probability of an individual cat during the jth survey (Kéry and Royle 2015).
We modelled detection probability using variables that may affect cat or cat owner behaviour (
Table 1). We included time of year (Julian date) to account for the possibility that cats may be more active or more likely to be allowed outside during certain times of the year. We also included mean daily temperature (degrees Celsius) and total precipitation (mm) because cats have been found to be less active during extreme temperatures and avoid heavy rains (
Churcher and Lawton 1987;
Hall et al. 2000;
Harper 2007;
Goszczyński et al. 2009). We obtained the temperature and precipitation data from Environment and Climate Change Canada from the Ottawa CDA RCS weather station (45°23′00N, 75°43′00″W) (
Environment and Climate Change Canada 2021). We standardized all continuous variables prior to analysis.
We tested hypotheses relating to whether habitat and social factors affected local cat abundance by assessing six site covariates (
Table 1) in our analysis. However, building density was correlated to the proportion of forest in the 100 m buffer (
R2 = 0.64) and landuse type (urban or parkland;
R2 = 0.74); therefore, we only used building density in our analysis (Supplementary materials Fig S1). We obtained the following GIS layers from various online databases: tree canopy as polygons (
ArcGIS Online database 2017), building density as point locations (
Ville de Gatineau 2023), socioeconomic subdivision as polygons (
Statistics Canada 2016a) with median income added to each subdivision using median income data (
Observatoire du développement de l'Outaouais 2019), and major roads (
Statistics Canada 2016b) and water cover as polygon shapes (
Statistics Canada 2016a) with waterbody polygons not included in the data file being manually created. In ArcGIS 10.8.1 (
ESRI 2011), we added 100 m buffers around each camera site using the
Create Buffers tool and then extracted the variable information within the buffer using the
Intersect tool. All continuous variables were standardized before analysis. Additional information on the distribution of camera sites across site covariates is in Supplementary materials Fig. S2.
Collinearity, model selection, and relative importance
Before model selection, we assessed the multicollinearity and overdispersion of each global model (i.e., full model including all site and detection variables, a full model with only detection variables, and a full model with all site variables and the variable(s) from the top detection model). The full model consisted of temperature, precipitation, and time of year as detection variables. Site variables included building density, the presence of major roads, median income, and the proportion of water. We used the variance inflation model (VIF) to assess multicollinearity and tested fit using chi-squared goodness-of-fit tests for
N-mixture models (function Nmix.gof.test) from the AICcmodavg package (
Mazerolle 2019) in R 4.0.3 (
R Core Team 2020). All variables within global models had VIF values between 0 and 1.2, suggesting there was none or very little multicollinearity between covariates (
Murray and Sandercock 2020), and thus no variables were removed from the analysis. The full model with all site and detection variables and a negative binomial distribution had a c-hat of 1.39, suggesting that there is some overdispersion.
After ensuring there was little to no multicollinearity and assessing overdispersion in our global models, we then used the Quasi Akaike Information Criterion (QAIC;
Burnham and Anderson 2002;
Burnham et al. 2011) to help account for the overdispersion. The c-hat value used to calculate QAIC was taken from the corresponding global model (i.e., detection-only or abundance-only models). Once we determined the top detection probability model using the
dredge function, we then used the variables from the top model and fixed them in the global local abundance model and then compared models using a balanced design. We assessed the relative importance of each variable using the summed Akaike weights of each model that contained the variable of interest, which varies between 0 and 1, with higher values signifying a greater relative importance compared to the other variables in the model (
MacKenzie et al. 2018).
Mapping predicted cat local abundance across Gatineau
For objective 2, we created predictive maps of local cat abundance across the study area of the City of Gatineau using the predictive abundance values obtained from our models (see above). We first created a fishnet grid over the shapefiles in ArcGIS containing each variable, with each grid cell being 200 m x 200 m, recorded the coordinates of the centre of each grid using the “Summarize Within” tool, and followed the same methods as used for extracting co-variate information from buffers for each cell. After the co-variate information was obtained for the grid cells over the entire study area, we then calculated the predicted abundance over a range of values (minimum to maximum) for each of the top co-variates (i.e., number of buildings, median income; see results below) using the model with the highest QAIC
c for each co-variate. If other co-variates were in the model, they were set to their mean, or 1 in the case of the covariate “major roads”. Due to the binary nature of “major roads”, we did not create a predictive layer for the presence/absence of major roads. Summary maps showing predicted local cat abundance were created using the packages ggmap (
Kahle and Wickham 2013) and ggplot2 (
Wickham 2016) in R 4.0.3 (
R Core Team 2020).
Predicting total cat abundance across Gatineau
We assumed that our model generated local abundance estimates that represented the approximate number of cats within a 200 m × 200 m grid cell. We made this assumption because cat home ranges are often relatively small in urban areas (∼0.036 km
2;
Kays et al. 2020), averaging around 1–2 city blocks, and trail cameras were placed in areas within yards or greenspaces that were likely to detect cats that visited a yard or at least be predicted by our models. We summed the predicted abundance values generated for each grid cell to calculate an approximate estimated population size of domestic cats within the City of Gatineau.
We compared our estimated population size of wandering cats to the estimated number of outdoor cats (cats allowed outside by owners) based on owner survey results from across Canada and within Gatineau. We also subtracted the estimated number of owned cats from the surveys from the number of wandering cats based on our models to estimate the number of unowned cats. We obtained the number of households based on the number of private dwellings in Gatineau from the 2021 Census (
N = 126,480). Averages across Canada indicate that 36.9% of households have at least one cat, with an average of 1.64 cats per household, and 28% of those households put their cats outside (
Canadian Federation of Humane Societies 2017). In Gatineau, 23% of households owned cats, with an average of 2.3 cats per household, and 25% of households allowed their cats to wander (
Nature Canada 2017). As a comparison, we used both the Gatineau and the national averages in our calculations.
Results
Sixty-two percent (N = 34) of the 55 camera sites photographed at least one cat. Of the 33 cameras located in urban areas, only 24% (N = 8) did not record a single cat over the 2-week sampling period. Cats were rarely seen in parkland sites, with 68% of the 22 cameras (N = 15) not photographing a single cat. The highest number of cats observed was 9 at a single camera site, and 130 individually identifiable cats were photographed, averaging 2.36 cats per camera site, or 3.82 cats per camera site where at least one cat was observed.
Detection probability
We examined if weather and time of year influenced how likely cats present in an area were detected by the cameras. The global model for detection probability included average temperature, daily precipitation, and the Julian date of camera deployment. Based on VIF values, none of the variables showed signs of multicollinearity. The top model contained no co-variates and had a model weight of 0.36, while the second (delta QAIC
c = 1.33, weight = 0.19) and third (delta QAIC
c = 1.92, weight = 0.14) best models had some support and contained only a single variable, temperature or date, respectively (
Table 2). Given that none of the detection variables showed strong support, our global local abundance model did not contain any detection variables, indicating that temperature, precipitation, and time of year did not influence how likely a cat present in the area was detected. The detection probability was constant at 0.16 ± 0.04 SE (lower CI: 0.09, upper CI: 0.25).
Local cat abundance
We identified what habitat or socio-economic factors (co-variates) influenced the local abundance of cats at a camera site using hierarchical
N-mixture models. The global model for abundance included the co-variates of building density, the presence/absence of a major road, median income, the proportion of water within a 100 m buffer around the trail camera, and a constant detection probability. None of the co-variates showed signs of multicollinearity. There were four models for local cat abundance showing some support (i.e., delta QAIC
c < 2;
Table 2). The top model contained the co-variates of building density, the presence/absence of major roads, and median income. Building density occurred in all four of the top models, while major roads and median income occurred in two of the top four models, suggesting they likely all influenced cat abundance, with building density (sum of weights = 0.8) and major roads (sum of weights = 0.61) having the biggest effects. Given the correlation between building density and proportion of forest, this means there were also few cats in areas with high amounts of forest. Cats were more abundant at camera sites surrounded by a higher density of buildings (
Figs. 2A,
2B, and
3A), lower income areas (
Figs. 2C,
2D, and
3B), away from major roads (
Fig. 3C), and in less forested areas (
Fig. 3D).
The predicted local abundance values varied considerably across camera sites. Based on the top model, the highest predicted number of cats at a camera site was 16.7 ± 10.5, and the lowest predicted number of cats at a camera site was 0.34 ± 0.22. On average, 3.66 ± 3.47 cats (median = 2.79) were estimated per camera site. Unsurprisingly, cats were 3× more abundant in urban than parkland sites (
t-test:
t = −5.28, df = 38.26,
P < 0.0001), with a predicted mean of 5.09 ± 3.8 SD (median = 4.05, range: 0.36–16.7) cats in urban sites and 1.49 ± 0.94 SD (median = 1.1, range: 0.34–3.57) cats in parkland sites (
Fig. 3D).
Estimated wandering, indoor–outdoor, and unowned cat population sizes
We estimated the wandering cat population size for the City of Gatineau using predicted averages of cat abundances in relation to buildings and income. Summing predicted values across grid cells using local abundances from our model containing buildings led to a total city population estimate of a mean of 18,847 cats (
Table 3). Similarly, using the model containing median income as a co-variate, we estimated a mean of 23,749 cats (
Table 3) across the City of Gatineau. This indicates the average number of cats in the City of Gatineau based on our extrapolated predicted local abundances is 21,298 (range: 8905 to 48,419) wandering cats with an average density of 62.24 cats/km
2 (range: 25.97–141.64;
Table 3) or the equivalent of 5.02 cats per 124 m × 124 m city block (range: 2.09–11.42).
We estimated indoor–outdoor cat (i.e., cats owned and allowed to wander unsupervised) abundances using Canada-wide and Gatineau household survey-generated estimates of cat ownership and the percentage of homes that allow their cat(s) to wander. We then compared these estimates to the predicted model-based wandering cat population sizes to estimate the number of unowned wandering cats. Based on Canada-wide survey numbers, we estimated there are 46,671 households in Gatineau that own at least one cat, with 21,431 cats being indoor–outdoor cats that are allowed to wander outside (
Table 3). Using estimates from the Gatineau-specific survey results, we estimated there are fewer households, with 29,090 owning at least one cat, which resulted in 15,387 cats being allowed outside (
Table 3). Based on the estimated number of indoor–outdoor cats in Gatineau (Gatineau-based survey) there is an estimated average of 5911 (range 0–33,032) unowned wandering cats in Gatineau (
Table 3).
Discussion
We show that estimating local cat abundances and cat habitat associations can be accomplished with minimal field effort, a team of project leads, and community involvement and participation. We developed a framework that can be replicated and led by other municipalities or communities across Canada (or abroad). Using Gatineau as a case study of this approach, we identified there were more wandering cats in areas with more buildings, lower median incomes, far from major roads, and less forested areas. We then used averaged co-variate estimates to predict wandering cat population size, showing Gatineau has a maximum of 48,419 (mean 21,298) wandering cats, with upward of 33,032 (mean 5911) of these cats being unowned.
Our second and third objectives aimed to identify the habitats and social factors affecting the local abundance of wandering cats. Cats were found throughout the majority of the Hull and Aylmer sectors of the City of Gatineau, Québec, with the fewest cats in parklands and the most cats occurring in low-income neighbourhoods of below median incomes of approximately $75,000 CD, which is well below the city's median income of $93,000 CD (
Government of Canada 2022). Higher abundances of cats in low-income neighbourhoods also occurred in another Canadian city, Guelph, ON (
Flockhart et al. 2016). Socio-economic level does not necessarily influence how many cats are owned and how many of those cats are allowed to wander (
Murray et al. 2010), although more research across more communities is likely needed. Instead, social or cultural factors may be co-related to income level, including factors such as ethnocultural composition, which has been shown to influence the rate of surrender or potential abandonment of cats (
Ly et al. 2021). The rate of sterilization of owned cats is also higher in more affluent neighbourhoods, which could influence the number of cats reproducing without human influence outdoors (
Chu et al. 2009;
Finkler et al. 2011). Taken together, it is likely cat abundances in Gatineau are influenced by a myriad of human-related social factors, including allowing cats outdoors, the availability of inexpensive spay-neutering, and accessible and easy ways to surrender pets, all of which could contribute to the population dynamics of cats in urban areas (
Flockhart and Coe 2018). Regardless, the high abundance of cats indicates that the potential ecological impacts of cats are widespread and may be generally high across residential areas.
Cat abundances were lowest near areas that may act as barriers or sources of mortality, including major roads and greenspace. The lower abundances of cats near major roads and parkland may suggest top-down limitations on wandering cats (
Crooks and Soulé 1999;
Kays et al. 2015;
Flockhart et al. 2016;
Clyde et al. 2022). This could occur if predators such as coyotes or fishers (
Pekania pennati) or other human sources of mortality (e.g., cars) reduce the number of cats in these regions. Alternatively, cats may avoid these areas due to the presence of predators or a lack of hiding places, as is the case for greenspaces (e.g.,
Clyde et al. 2022). Alternatively, this pattern may be partly due to the distribution of major roads within a study system. In Wellington County, ON, high local abundances of cats occurred near major roads, but this finding was likely due to the combination of urban (closer to major roads) and rural sites (farther from major roads) that influenced this pattern (
Clyde et al. 2022). The abundance of cats was low within the large parkland area in Gatineau, but it is unclear whether low abundances are problematic or not for wildlife and would depend on the cat(s). For instance, if some cats kill zero animals, while a single cat can kill several animals a week and some cats may kill more than one bird per day (
Loyd et al. 2013) this could amount to a large number of wild animals killed per cat/year within urban parklands, or very few, if any. It is also possible that our estimates of cats in parklands are an underestimate due to the lower potential of detecting cats from reduced numbers of natural delineations (e.g., roads, fences, etc.) for cats to use in these spaces compared to urban areas.
Our calculation of predicted population size based on our models takes into account unowned wandering cats as well as owned indoor–outdoor cats, showing a total population estimate for cats that wander freely. Using estimates from household surveys and the model-predicted estimates, we were able to generate estimates for the number of unowned cats, showing that it is likely that a large portion (18%–73%) of wandering cats are unowned. As a comparison, the wandering cat population in Guelph, ON, a city 2.3× smaller in human population than Gatineau, had an estimated average abundance of 7662 cats based on distance-based walking transacts (
Flockhart et al. 2016). This is slightly fewer cats per population size than our estimates from Gatineau. In another Canadian city, Windsor, ON (human population of 217,188), the number of wandering cats without collars (i.e., cats considered to be potentially unowned) was estimated to be 1858 using walking transact surveys (
Hand 2019). This is likely a low estimate of the total number of wandering cats due to many of the cats not being counted in this study, such as those that appeared close to buildings or people (
Hand 2019). In Stillwater, OK, USA (human population of 46,000), local wandering cat abundance based on mark–resight analysis and trail camera images was estimated at 3.1 cats/camera site (
Elizondo and Loss 2017) and had a non-statistically significant but slight reduction to 2.3 cats per camera site after a sterilization program (
Coe et al. 2021). These local abundance estimates are lower than the 5.09 cats/site, we observed in urban areas in this study, suggesting that Gatineau's wandering cat population may be higher than other municipalities where research has been conducted.
Recommendations for communities interested in estimating cat abundance:
We have a number of recommended practices for undertaking and leading a project estimating the local abundance of wandering cats using trail cameras. First, the project team requires a variety of skillsets and people, including project leads to manage people and data, people experienced in statistics and GIS, and a team of willing and engaged volunteers. Second, engaging landowners to be excited about this research helps in finding people that may be able to help with trail camera management and viewing some photos, as many people are genuinely interested in seeing what animals are in their yards or on their property. However, some eager volunteers may not have strong computational skills, so they may need additional support and education on some of the technological components of viewing and sorting images on computers. Third, although we viewed and sorted photos manually and stored photos online, we did not use any online software to help organize or sort through photos due to technology limitations at the time of photo processing that suited this study's needs. An online repository/image sorting technology for trail camera images may help with viewing trail camera images and creating encounter histories. Finally, we conducted this research using only six trail cameras. This limited the number of sites that could be monitored over a study period and at the same time. As a result, we were unable to use some other statistical methods for analyzing cat abundances and populations, such as mark–resight–analysis (
Elizondo and Loss 2017;
Coe et al. 2021) or a random thinning spatial–capture recapture model (
Cove et al. 2022). We think the methods we used in this study provide useful information about local cat abundances that can be used by municipalities or local organizations to target limited resources towards reducing wandering cat populations that go beyond household survey results that exclude unowned cats. Despite the many challenges of conducting research on cat abundances, such research could provide a valuable benchmark for reducing wandering cat populations in municipalities.
Studies should be longitudinal (e.g., repeated multiple times), and all data should be retained for comparisons between study periods and following interventions (e.g., education campaigns, spay/neutering programs). Such study designs could be used to assess whether actions taken to reduce wandering cat populations are effective. We recommend all data from studies be retained in a database. Encounter histories, images, and other associated data should be kept separately from personal information such as the location of trail cameras and the names and addresses of landowners to respect ethical obligations and the privacy of landowners. Keeping data available in a database could enable repeated measures studies. A repeated-methods study would allow organizations or groups interested in assessing whether actions taken to reduce wandering cat populations (e.g., educational campaigns, low-cost spay-neutering, by-laws, or lethal or non-lethal population reduction strategies) are effective and meet the desired outcomes and goals.
Management recommendations and considerations
Cats were found throughout the City of Gatineau in the Hull and Aylmer sectors, but many neighbourhoods have higher numbers of wandering cats than others, which provides some initial guidance on where limited resources could be best spent to reduce wandering cat populations. In Gatineau, socio-economic factors (i.e., low-income neighbourhoods) were associated with the highest local cat abundances. These findings provide a location for targeting management where initial resources and efforts may be best directed to these communities. The specifics on who leads any management actions, what actions are taken, and how the actions are implemented, conducted, and then assessed for the desired effectiveness require additional thought and consideration. For instance, animal shelters may take a strong lead in conducting the management actions as they run a variety of spay-neutering, rehoming, and lethal strategies. But much of the work by shelters often has limited scientific backing for their success while also requiring extensive resources to undertake successfully (
Hurley and Levy 2022). Identifying what actions should be taken may be best done by identifying (e.g., through social science-based approaches) the barriers that people face in keeping their cats indoors and the factors that may lead to overpopulation of cats within communities. Low-cost spay-neuter programs for owned cats may be effective at increasing the total number of cats that are spayed/neutered (
Frank and Carlisle-Frank 2007). But such cost-intensive programs should be considered carefully, as they may reduce shelter intake levels for cats in some contexts (
White et al. 2010). Given the complexity of cat population dynamics in urban areas (
Flockhart and Coe 2018), it is unclear how these spay-neuter programs, or similar ones, may impact wandering cat abundance while also mitigating the negative environmental impacts of wandering cats.
In conclusion, findings from research on the abundance of wandering cats, such as this study, can provide a guide to where wandering cat abundances may be highest and an estimate of the number of cats in an area. It does not specifically create a road map for management actions or approaches; it only provides a general location of where cats are, the factors associated with wandering cat abundances, and the magnitude of wandering cat numbers. Any management or policy decisions should be made through careful thought and consideration of existing scientific (including social science) literature and cat population dynamics, along with recognizing and incorporating stakeholder (including community members) capacities, values, and interests.
Acknowledgements
We would like to acknowledge the support from the National Capital Commission in providing access to some of their lands in Gatineau, where we were able to place cameras. EAG was funded through a Liber Ero Fellowship and Environment and Climate Change Canada. Additional funding was provided by Nature Canada. We especially thank the Club des Ornithologues de l'Outaouais for their participation and support for this project, including involvement of members of their Board of Directors. Hannah Clyde provided insight on study design and analysis. Finally, we acknowledge many volunteers, including the camera managers, the home and business owners who offered their properties for the deployment of a camera, and others who contributed their time to this project in different ways.