Impact of plastic pollution on atmospheric carbon dioxide
Abstract
Since the beginning of its large-scale production in the early 20th century, plastics have remained an important material in widespread use throughout modern society. Nevertheless, despite possessing many benefits, plastics are resistant to degradation and instead accumulate in the ocean and terrestrial sediments, thereby potentially affecting marine and terrestrial ecosystems. Plastics release CO2 throughout their entire lifecycle; during the extraction of materials used in their production, through plastic–carbon leaching in the marine and terrestrial environment, and during their different end-of-life scenarios, which include recycling, landfill, and incineration. Here, we use the University of Victoria earth system climate model to quantity the effects on atmospheric CO2 and the ocean carbon cycle by using upper-bound estimates of carbon emissions from marine plastic–carbon leaching or land-based incineration. Despite the suggestions of some, our results indicate that it has only a very minor influence and an insignificant effect on the earth's global climate system. This holds even if plastic contamination increases well beyond current levels. On the other hand, carbon emissions associated with plastic production and incineration have a greater impact on climate while still dwarfed by emissions associated with the combustion of fossil fuels (coal, oil, and natural gas) and other anthropogenic sources. Our results have important policy implications for ongoing United Nations Environment Programme Intergovernmental Negotiating Committee on Plastic Pollution negotiations.
Introduction
From 29 May to 2 June 2023, the United Nations Environment Programme Intergovernmental Negotiating Committee on Plastic Pollution (INCPP) held its second negotiating session advancing its goal of crafting an international and legally binding agreement targeting marine and terrestrial plastic pollution. On the agenda are the core obligations, voluntary approaches, control and implementation measures, as well as their means of implementation (UNEP/PP/INC.1/14 2022). Facing the INCPP are difficult decisions and complex negotiations over the management of all aspects of plastics, including their production, their transport and consumption, and their post-consumer fate. It is anticipated that both upstream (pre-consumer) and downstream (post-consumer) control measures will eventually be codified into the resulting agreement. As plastics are an energy-intensive, carbon-based product, such measures also have relevance to the regulation of fossil fuels and the mitigation of climate warming (Bauer et al. 2022).
Although first thought to be the beginning of a “brighter and cleaner” world (Yarsley and Couzens 1941), plastic is polluting earth's natural environments. With its strength, durability, lightweight, and low cost, plastic is one of the world's most versatile materials and is used across numerous industries (Law 2017). These properties are what drove the large-scale plastic production in the early 20th century that continues to the present (GESAMP 2016). In addition to its increased production and usage, insufficient waste management systems and resistance to degradation are causing plastic to accumulate in terrestrial and aquatic ecosystems. Plastics account for ∼80% of all debris found in the ocean (Morales-Caselles et al. 2021). Of the 9.2 billion tonnes of global cumulative production of plastics (Geyer 2020), it is estimated that 75–199 million tonnes are present in the ocean (McGlade et al. 2021). If the current production path continues, estimates are that annual plastic production will rise to 1.1 billion tonnes per year by 2050 (Geyer 2020).
How plastic pollution might be contributing to climate change, another pressing environmental issue that is fundamentally affecting humans has become a point of concern in recent years (e.g., Royer et al. 2018; Shen et al. 2020a, 2020b). Alarms have been raised, and repeated about the possible disruption of biological carbon pumping and ocean carbon sequestration if marine organisms are negatively impacted by widespread pollution (Galloway et al. 2017; Shen et al. 2020a; Macleod et al. 2021; Shen et al. 2023). The concern likely stems from an overestimated role of the biological carbon export flux in moderating changes in atmospheric CO2 (Courtene-Jones 2022; Kvale et al. 2023). However, there also exist vague concerns that plastics are a novel source of organic carbon in ecosystems that could rival natural ones and therefore disrupt the ocean carbon cycle (e.g., Romera-Castillo et al. 2018; Rillig et al. 2021; Stubbins et al. 2021; Adyel and Macreadie 2022). Climate impacts from such direct inputs have not been estimated.
The combustion of coal, oil, natural gas, and other fossil fuels, along with the production of cement as well as changes in land use are well-established contributors to increasing atmospheric carbon dioxide levels (IPCC 2021). To better understand how plastics contribute to overall total carbon dioxide emissions, it is important to consider their entire lifecycle from production to end-of-life. Emissions are released during production processes, which involve the extraction and transport of feedstock for plastic production, methane leakage and flaring, fuel combustion when drilling for oil or gas, and land use changes, and were recently estimated at 1085 million tonnes of CO2-equivalent (CO2e—Hamilton and Feit 2019; Zheng and Suh 2019). Processes involved during the refining and manufacturing stage of plastic production include cracking (whereby hydrocarbons are broken down into smaller, lighter hydrocarbons) and the polymerization and plasticization of these hydrocarbons into plastic resins (Hamilton and Feit 2019); this releases an estimated 535 million tonnes of CO2e per year (Zheng and Suh 2019). Plastics also leach dissolved organic carbon (DOC) into the marine environment (Romera-Castillo et al. 2018), which effectively contributes to the inorganic carbon pool via microbial degradation (Hansell 2013). Estimates suggest that plastics could annually leach up to 23 600 metric tonnes of DOC into the marine environment and contribute to 10% of the DOC in the surface microlayer of subtropical gyres (Romera-Castillo et al. 2018). Finally, end-of-life scenarios, which include recycling, landfill, and incineration (through processes, including pyrolysis and gasification), contribute approximately 161 million tonnes of CO2e per year, with incineration contributing the most (Zheng and Suh 2019).
It is important to thoroughly analyze all anthropogenic activities that contribute to atmospheric CO2 emissions to better manage and mitigate the contributions from plastics. The short timeframe of the ongoing INCPP negotiations, set to conclude in 2024 (UNEP/EA.5/Res.14 2022), elevates the urgency of exploring the climatic consequences of upstream and downstream plastics pollution, as well as control measures. After the discovery that marine plastic pollution is leaching carbon into the ocean, researchers expressed the need to better understand the impact that this additional source may be having on oceanic ecosystems. In particular, Adyel and Macreadie (2022) expressed concern that the uptake of anthropogenic atmospheric CO2 within blue carbon ecosystems could be affected by carbon leaching from plastics.
Methods
The results presented in this study were obtained from experiments using version 2.9 of the University of Victoria earth system climate model (UVic ESCM; Weaver et al. 2001), including the comprehensive carbon cycle component described in Eby et al. (2009).
Version 2.9 of UVic earth system model
The UVic ESCM includes a two-dimensional atmospheric energy–moisture balance model (Fanning and Weaver 1996), a three-dimensional ocean general circulation model (Pacanowski 1995), a dynamic–thermodynamic sea ice model (Bitz et al. 2001) with elastic visco-plastic rheology (Hunke and Dukowicz 1997), and a land surface and dynamic-vegetation model based on the Hadley Centre Met Office Surface Exchange Scheme coupled to the top-down representation of interactive foliage and flora with five plant functional types (Cox 2001; Meissner et al. 2003). All components of this model exhibit a spherical grid resolution of 3.6° (in the zonal direction) and 1.8° (in the meridional direction), and the ocean component includes 19 vertical levels, with thickness varying from 50 m near the surface to 500 m in the deep ocean. Radiative forcings, which are associated with changes in atmospheric CO2 concentrations, are included as changes in outgoing planetary longwave radiation. Surface wind stress and atmospheric winds are specified from 40 year climatologic reanalysis data from the National Centers for Environmental Prediction project (Kalnay et al. 1996). An oxic-only ocean sediment model has been added to the UVic ESCM, whereby simulations of CaCO3 preservation in deep-sea sediments are represented (Archer 1996), in addition to a nutrient–phytoplankton–zooplankton–detritus marine ecosystem model component (Schmittner et al. 2008).
Experimental design
We examined the effect of upper-bound estimates of marine plastic–carbon leaching and incineration emissions on the global climate system via five experiments in which various fluxes of carbon, based on projected marine plastic–carbon leaching and projected plastic incineration emissions, are added to the climate system (Table 1).
Table 1.
| Scenario acronym | Scenario description | Fossil fuel combustion emissions | Plastic–carbon leaching (kg m−2 year−1) | Incineration emissions (kg m−2 year−1) | Plastic–carbon (Gt year−1) |
|---|---|---|---|---|---|
| Control | — | — | — | — | |
| Global warming | RCP 8.5 | — | — | — | |
| Global warming + plastic leaching | RCP 8.5 | 7.9 × 10⁻⁵ | — | 2.9 × 10⁻² | |
| Plastic leaching | — | 7.9 × 10⁻⁵ | — | — | |
| Incineration of projected plastic | — | — | 1.7 × 10⁻³ | 0.87 | |
| Incineration of projected marine plastic | — | — | 5.7 × 10⁻⁵ | 2.9 × 10⁻² |
Note: Description of the five experiments that include emissions from projected plastic–carbon leaching and incineration as well as the respective flux values (kg m−2 year−1 and gigatonnes of C year−1). Column 3 specifies whether anthropogenic fossil fuel emissions were included past the year 2000 and what emissions pathway was followed.
The model was initialized with a 10 000 year spin up at the year 850. From 850 to the year 2005, historical forcing (land cover change, solar, volcanic, aerosol, and other GHGs) was used to force the model. In addition, over the period 2005–2100, changing CO2, land surface, aerosol, and other greenhouse gas (GHG) forcing followed representative concentration pathway (RCP) 8.5 (Moss et al. 2008). From 2000–2100, the equivalent CO2 emissions were diagnosed (Zickfeld et al. 2013) and then used in subsequent sensitivity experiments (GW, GWPL—see Table 1). This was done to ensure that our plastic–carbon leaching and incineration experiments allowed atmospheric CO2 to freely evolve away from prescribed RCP 8.5 values. The experiments listed in Table 1 all started from the year 2000 initial state. This initial condition was used to be consistent with the RCPs developed as part of the Intergovernmental Panel on Climate Change (IPCC) 5th assessment whose emissions trajectories all start from the same base year (year 2000). Our conclusions are insensitive to this initial starting date.
In the Control scenario (Table 1), emissions of anthropogenic CO2 were ceased after the year 2000, thereby providing an estimate of the committed atmospheric CO2 adjustment to historical forcing. The Global Warming (GW) scenario includes fossil fuel emissions (diagnosed from RCP 8.5) throughout the entirety of the 100 year integration period (to year 2100). This scenario represents a continuing increase in our dependence on fossil fuels throughout the 21st century, including their use in the manufacturing of plastics. The Global Warming + Plastic Leaching (GWPL) scenario is the same as GW but with the addition of plastic–carbon leaching (see Table 1). It is designed to estimate the additional climatic impact of a lurking and previously not considered source of fossil carbon (plastics) in the ocean in an already dramatically altering climate state.
The plastic–carbon flux was derived from marine plastic debris values projected for the year 2040 (29 million metric tonnes per year; Lau et al. 2020). Although research has determined an ∼90% carbon content in plastics (Zhu et al. 2020), we assumed a 100% conversion to test the upper-bound effect of this leaching. As noted in the introduction, plastics leach DOC into the marine environment contributing to the inorganic carbon pool via microbial degradation (Hansell 2013). In fact, the majority of DOC is labile, meaning that it can be rapidly broken down (within hours or days) by microbes and bacteria for biomass production and respiration, ultimately producing dissolved inorganic carbon (DIC). The small fraction of DOC that is resistant to microbial degradation and breaks down on time scales of thousands to tens of thousands of years is known as recalcitrant DOC. Through the process of respiration or decomposition, DOC is broken down into DIC, which is composed of HCO3−, CO2, and CO32−, with HCO3− making up the largest fraction of DIC. Given the rapid breakdown of DOC into DIC in ambient seawater, we assume that all carbon being leached from the plastic debris is in the form of DIC. This is an acceptable substitute, as natural labile DOC breaks down rapidly and contributes to the ocean DIC pool rather than the organic carbon pool (Hansell et al. 2009). By assuming the complete conversion from DOC to DIC, we can estimate the upper-bound effects of plastic-derived carbon leaching on the global climate system. This plastic–carbon leaching flux was added to the global ocean surface at a constant rate throughout the 100 year time period, beginning in the year 2000.
The PL scenario assumes the cessation of anthropogenic fossil fuel combustion in the year 2000 and only includes emissions from marine plastic–carbon leaching beginning in 2000. This scenario represents a global shift to carbon neutrality that fails to address ocean plastic pollution. The plastic–carbon flux value is the same as in GWPL. The Incineration of Projected Plastic (IPP) scenario assumes the cessation of anthropogenic fossil fuel emissions in the year 2000, and zero marine plastic–carbon leaching. Instead, this experiment uses an estimate of global plastic production in 2050 (1.1 billion metric tonnes; Geyer 2020) and assumes, as an upper-bound case, that this amount of plastic is produced and incinerated each year from 2000 to 2100. The resulting emissions are added directly to the atmosphere. In this scenario, a carbon-neutral world has widely adopted incineration through waste-to-energy systems, into their new, circular economy. Incineration produces greater emissions than recycling (Zheng and Suh 2019; Stegmann et al. 2022); therefore, this scenario represents a high-end potential emission estimate resulting from continuing plastics gasification and pyrolysis in an otherwise carbon-neutral world. These incineration emissions were calculated based on the conversion of 1 kg of low-density polyethylene (LDPE) to 2.9 kg of CO2e (Benavides et al. 2020) and were added at a constant rate throughout the 100 year time period, beginning in the year 2000.
The Incineration of Projected Marine Plastic (IPMP) scenario also assumes the cessation of anthropogenic fossil fuel emissions in the year 2000. Instead of adding the carbon flux (from plastic–carbon leaching) into the ocean surface, it is assumed that all marine plastic would be removed and incinerated through gasification and pyrolysis, and the subsequent CO2 emissions would therefore enter the atmosphere directly. In other words, the same amount of carbon that was added to the ocean throughout the PL scenario is now being added directly into the atmosphere to compare the relative effects of plastic–carbon injection in the surface ocean versus the atmosphere. Note that the incineration carbon flux is lower in IPMP relative to PL only because the earth's surface area (5.10 × 10⁸ km2) is greater than the ocean's surface area (3.57 × 10⁸ km2).
In the GWPL and PL experiments, the calculated carbon flux was evenly distributed as a surface flux throughout the global ocean. This allowed for the focus to be on the effect of plastic–carbon on climate, without the need for incorporating the leaching process from plastic to seawater in the model. The projected plastic–carbon leaching value was calculated from the annual rate reported by Lau et al. (2020) (29 million metric tonnes), the molar mass of carbon (12.022 g mol−1), and the surface area of the ocean in the model (3.57 × 10⁸ km2). The IPP emission value was calculated from the projected annual production of plastic (1.1 billion tonnes per year by 2050; Geyer 2020), the conversion of 1 kg of LDPE to 2.9 kg of CO2e (Benavides et al. 2020), the 12:44 ratio between C and CO2, and the earth's surface area (5.10 × 10⁸ km2). The calculation of emissions for IPMP was based on the carbon emissions from plastic–carbon leaching in GW and GWPL, but instead of dividing these emissions by the surface area of the ocean, they were divided by the earth's surface area. All fluxes and additional emissions were added into the ocean or atmosphere at a constant rate from 2000–2100, and all model output was annually averaged.
A series of other experiments (not shown) were also conducted wherein all global emissions from marine plastic–carbon leaching were released exclusively into either the North Pacific, North Atlantic, South Pacific, or South Atlantic subtropical gyre (where surface convergence tends to concentrate marine plastics) as well as evenly along all global coastlines (where the majority of plastic enters the marine environment). Our analysis and conclusions below are insensitive to this regional distribution of marine plastic–carbon leaching.
Results
All six experiments shown in Table 1 were initialized from a transient run of the UVic ESCM that started in 850 AD and was integrated forward in time under historical emissions until year 2000 (Eby et al. 2013). The future anthropogenic emissions for Control, PL, IPP, and IPMP were then set to zero from year 2000 to 2100; GW and GWPL continued with historical emissions until 2005, at which point diagnosed RCP 8.5 anthropogenic fossil emissions were used until 2100 (Moss et al. 2008).
Despite anthropogenic emissions being turned off at year 2000, the control integration revealed a very minor increase in overall atmospheric CO2 as the system adjusted to the transient historical forcing and abrupt elimination of additional radiative forcing post 2000. Nevertheless, this increase was smaller than in all other scenario integrations (Fig. 1c). As expected, the greatest increase in atmospheric CO2 (by ∼542 ppm) occurred in the integration, which included both fossil fuel emissions and the addition of the plastic–carbon flux into the global ocean (GWPL; Fig. 1a). This was followed by GW, where the addition of anthropogenic fossil fuel emissions increased atmospheric CO2 concentrations by ∼541 ppm (Fig. 1a). The difference between the GW and GWPL curves at the year 2100 was 1.11 ppm (Fig. 1b). The addition of the plastic–carbon flux alone (PL) increased atmospheric CO2 concentrations by only 0.665 ppm when compared to the control integration. There was a greater increase (by 0.442 ppm) when the plastic–carbon leaching flux was combined with anthropogenic fossil fuel emissions versus being added into the ocean alone.
Fig. 1.
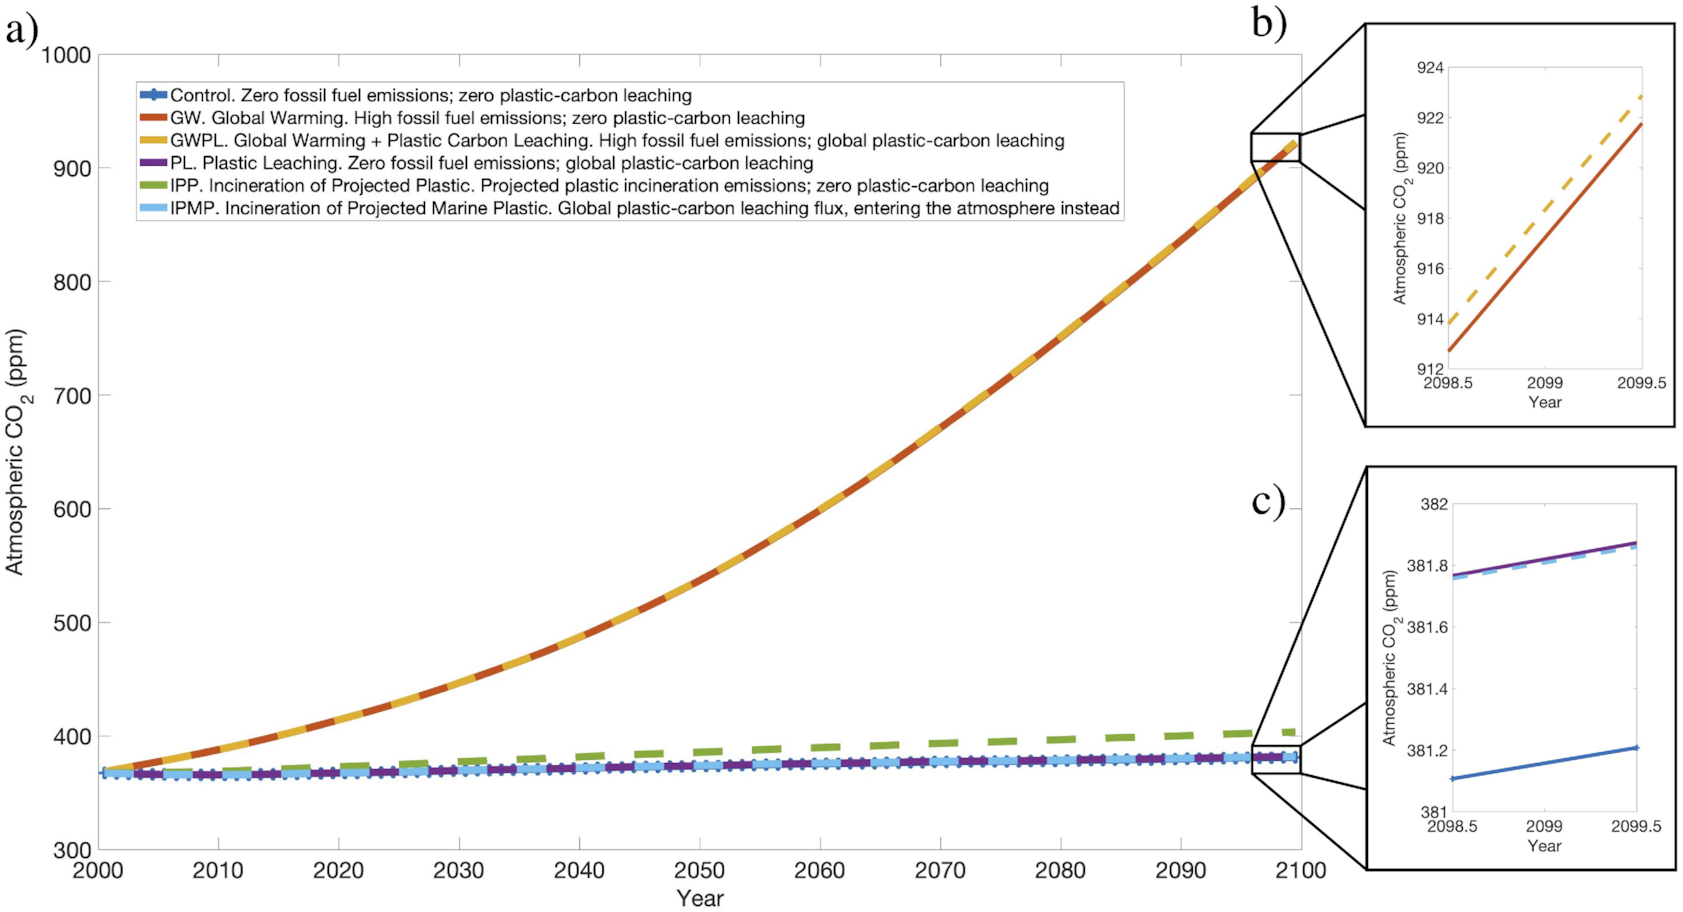
The results of this sensitivity analysis also show that emissions from plastic–carbon leaching and incineration resulted in increases in atmospheric CO2 concentrations throughout the 100 year time period; however, these were very minor. When considering scenarios with the cessation of anthropogenic fossil fuel CO2 emissions in 2000 (PL, IPP, and IPMP), the greatest increase in atmospheric CO2 concentration (22 ppm) occurred in IPP, where we prescribed future plastic incineration emissions to the atmosphere. For most of the integration, the atmospheric CO2 concentration with the plastic–carbon flux added to the atmosphere (IPMP) was slightly greater than when the flux was added to the ocean (PL), except for the last 5 years, where it was slightly less. Overall, there was almost no difference in atmospheric CO2 between the PL and IPMP scenarios, as seen in Fig. 1. When we compare the increase resulting from projected plastic incineration (IPP) to the increase resulting from plastic–carbon leaching in the ocean (PL), IPP increases atmospheric CO2 concentrations by 21.7 ppm (Fig. 1c).
Discussion and conclusions
Anthropogenic activities currently produce about 36.2 Gt of CO2e emissions per year (Yue and Gao 2018) leading to an annual increase of the atmospheric CO2 concentration by about 2.4 ppm (Friedlingstein et al. 2022). As expected, our results indicate that the rise in atmospheric CO2 due to plastic pollution-related emissions is very minor when compared to the rise associated with fossil fuel combustion. This is consistent with evidence that shows that the carbon footprint of plastics reached 2 Gt of CO2e in 2015, accounting for only 4.5% of global GHG emissions (Cabernard et al. 2022).
Projected plastic incineration-related emissions result in greater increases in atmospheric CO2 than those from projected plastic–carbon leaching (added either into the ocean or atmosphere). Nevertheless, plastic incineration emissions still resulted in very minor increases in atmospheric CO2 concentrations and are less concerning than those from other anthropogenic activities involving the combustion of fossil fuels. End-of-life emissions, including recycling, incineration, and landfills, account for a minor fraction of the total carbon footprint from plastics, whereas 96% of these emissions originate from plastic production (Cabernard et al. 2022). 1.7 Gt of CO2e was released in 2015 as a result of fossil fuel combustion for the global production of plastics and twice as much fossil carbon was combusted as fuel for plastic production than is contained within the plastics (Cabernard et al. 2022).
The emissions from plastic–carbon leaching added directly into the atmosphere through incineration resulted in greater atmospheric CO2 than when these emissions were added into the ocean (in the form of DIC) for most of the integration period. These results are expected, given that when the flux is added to the ocean, the ocean is more likely to retain some carbon, which will then slowly enter the atmosphere through outgassing. Although recent research has placed an emphasis on the negative effects that plastic–carbon leaching in the marine environment may have on ecosystems and its biota, our results indicate that it has only very minor and insignificant effects on earth's global climate system, and this is expected to hold even if plastic contamination increases beyond current levels.
The greatest threat to earth's climate continues to be the rise in atmospheric CO2 from the combustion of fossil fuel emissions. There are simply insignificant emissions being released from plastic–carbon leaching when compared to those produced by incineration and the production of plastics, and more so, from other fossil fuel-combusting anthropogenic activities. Although plastic pollution threatens the livelihood of many organisms and the ecosystems in which they reside, an issue that deserves further exploration and may carry significant nutrient and oxygen consequences for the global ocean (Kvale et al. 2021; Kvale and Oschlies 2022); the results of our study conclude that emissions from plastic–carbon leaching are not a major concern in relation to climate change. From a climate perspective, where greater focus is needed is on the prevention of plastic incineration and plastic production emissions, but most importantly, those from fossil fuel combustion. As the INCPP consider both upstream and downstream control measures for mitigating plastic pollution, we suggest that options that reduce the production of plastics and prevent the expansion of incineration will best support the already agreed to the United Nations climate target limiting warming to 1.5 °C (UNFCCC, 2015).
Acknowledgements
ME and AJW are grateful for support from NSERC and the Federal Climate Action and Awareness Fund. KK acknowledges support from the New Zealand Ministry of Business, Innovation and Employment (MBIE) within the Antarctic Science Platform, grant ANTA1801. KK also acknowledges support from the New Zealand MBIE through the Global Change through Time programme (Strategic Science Investment Fund, contract C05X1702). We are grateful to two anonymous reviewers for their helpful comments.
References
Adyel T.M., Macreadie P.I. 2022. Plastics in blue carbon ecosystems: a call for global cooperation on climate change goals. The Lancet Planetary Health, 6(1): e2–e3.
Archer D.E. 1996. An atlas of the distribution of calcium carbonate in sediments of the deep sea. Global Biogeochemical Cycles, 10(1): 159–174.
Bauer F., Nielsen T.D., Nilsson L.J., Palm P., Ericsson K., Fråne A., Cullen J. 2022. Plastics and climate change—breaking carbon lock-ins through three mitigation pathways. One Earth, 5(4): 361–376.
Benavides P.T., Lee U., Zarè-Mehrjerdi O. 2020. Life cycle greenhouse gas emissions and energy use of polylactic acid, bio-derived polyethylene, and fossil-derived polyethylene. Journal of Cleaner Production, 277: 124010.
Bitz C.M., Holland M.M., Weaver A.J., Eby M. 2001. Simulating the ice-thickness distribution in a coupled climate model. Journal of Geophysical Research, 106(C2): 2441–2463.
Cabernard L., Pfister S., Oberschelp C., Hellweg S. 2022. Growing environmental footprint of plastics driven by coal combustion. Nature Sustainability, 5(2): 139–148.
Courtene-Jones K. 2022. Implications of plastic pollution on global marine carbon cycling and climate. Emerging Topics in Life Sciences, 6(4): 359–369.
Cox P.M. 2001. Description of TRIFFID dynamic global vegetation model. In Hadley Cell Technical Note 24. pp. 1–16.
Eby M., Weaver A.J., Alexander K., Zickfeld K., Abe-Ouchi A., Cimatoribus A.A., et al. 2013. Historical and idealized climate model experiments: an intercomparison of Earth system models of intermediate complexity. Climate of the Past, 9(3): 1111–1140.
Eby M., Zickfeld K., Montenegro A., Archer D., Meissner K.J., Weaver AJ. 2009. Lifetime of anthropogenic climate change: millennial time scales of potential CO2 and surface temperature perturbations. Journal of Climate, 22(10): 2501–2511.
Fanning A.F., Weaver A.J., 1996. An atmospheric energy–moisture balance model: climatology, interpentadal climate change, and coupling to an ocean general circulation model. Journal of Geophysical Research, 101(D10): 15111–15128.
Friedlingstein P., O'sullivan M., Jones M.W., Andrew R.M., Gregor L., Hauck J., et al. 2022. Global carbon budget 2022. Earth System Science Data, 14(11): 4811–4900.
Galloway T., Cole M., Lewis C. 2017. Interactions of microplastic debris throughout the marine ecosystem. Nature Ecology & Evolution, 1: 0116.
GESAMP G. 2016. Sources, fate and effects of microplastics in the marine environment: part two of a global assessment. In IMO/FAO/UNESCO-IOC/UNIDO/WMO/IAEA/UN/UNEP/UNDP Joint Group of Experts on the Scientific Aspects of Marine Environmental Protection. Reports and Studies GESAMP No. 93. Edited by P.J. Kershaw, C.M. Rochman. p. 220.
Geyer R. 2020. Production, use, and fate of synthetic polymers. In Plastic waste and recycling. Edited by TM Letcher. Academic Press. pp. 13–32.
Hamilton L.A., Feit S. 2019. Plastic and climate: the hidden costs of a plastic planet. In CIEL. Switzerland. Available from https://policycommons.net/artifacts/2485040/untitled/3507468/on [accessed 8 April 2023]. CID: 20.500.12592/qctxbd.
Hansell D.A. 2013. Recalcitrant dissolved organic carbon fractions. Annual Review of Marine Science, 5: 421–445.
Hansell D.A., Carlson C.A., Repeta D.J., Schlitzer R. 2009. Dissolved organic matter in the ocean: a controversy stimulates new insights. Oceanography, 22(4): 202–211.
Hunke E.C., Dukowicz J.K. 1997. An elastic–viscous–plastic model for sea ice dynamics. Journal of Physical Oceanography, 27(9): 1849–1867.
IPCC. 2021. Climate Change 2021: the physical science basis. Contribution of Working Group I to the Sixth Assessment Report of the Intergovernmental Panel on Climate Change. Edited by V Masson-Delmotte, P Zhai, A Pirani, SL Connors, C Péan, S Berger et al., et al., Cambridge University Press, Cambridge, UK and New York, NY.
Kalnay E., Kanamitsu M., Kistler R., Collins W., Deaven D., Gandin L., et al. 1996. The NCEP/NCAR 40-year reanalysis project. Bulletin of the American Meteorological Society, 77(3): 437–472.
Kvale K., Oschlies A. 2022. Recovery from microplastic-induced marine deoxygenation may take centuries. Nature Geoscience, 16: 10–12.
Kvale K., Hunt C., James A., Koeve W. 2023. Regionally disparate ecological responses to microplastic slowing of faecal pellets yields coherent carbon cycle response. Frontiers in Marine Science, 10.
Kvale K., Prowe A.E.F., Chien C.-T., Landolfi A., Oschlies A. 2021. Zooplankton grazing of microplastic can accelerate global loss of ocean oxygen. Nature Communications, 12: 2358.
Lau W.W.Y., Shiran Y., Bailey R.M., Cook E., Stuchtey M.R., Koskella J., et al. 2020. Evaluating scenarios toward zero plastic pollution. Science, 369(6510): 1455–1461.
Law K.L. 2017. Plastics in the marine environment. Annual Review of Marine Science, 9(1): 205–229.
MacLeod M., Arp H.P.H., Tekman M.B., Jahnke A. 2021. The global threat from plastic pollution. Science, 373(6550): 61–65.
McGlade J., Fahim I.S., Green D.S., Landrigan P., Andrady A., Costa M. et al. 2021. From pollution to solution: a global assessment of marine litter and plastic pollution.
Meissner K.J., Weaver A.J., Matthews H.D., Cox P.M. 2003. The role of land surface dynamics in glacial inception: a study with the UVic Earth system climate model. Climate Dynamics, 21, 515.
Morales-Caselles C., Viejo J., Martí E., González-Fernández D., Pragnell-Raasch H., González-Gordillo J. Ignacio, et al. 2021. An inshore–offshore sorting system revealed from global classification of ocean litter. Nature Sustainability, 4(6): 484–493.
Moss R., Babiker M., Brinkman S., Calvo E., Carter T., Edmonds J., et al. 2008. Towards new scenarios for analysis of emissions, climate change, impacts, and response strategies. In Intergovernmental Panel on Climate Change, Geneva. p. 132.
Pacanowski R.C. 1995. MOM 2 documentation, user's guide and reference manual. Tech Rep. 3. GFDL Ocean Group, Geophysical Fluid Dynamics Laboratory, Princeton, NJ.
Rillig M.C., Leifheit E., Lehmann J. 2021. Microplastic effects on carbon cycling processes in soils. PLoS Biology, 19(3): e3001130.
Romera-Castillo C., Pinto M., Langer T.M., Xosé Antón X., Álvarez-Salgado X.A., Herndl G.J. 2018. Dissolved organic carbon leaching from plastics stimulates microbial activity in the ocean. Nature Communications, 9: 1430.
Royer S.J., Ferrón S., Wilson S.T., Karl D.M. 2018. Production of methane and ethylene from plastic in the environment. PLoS ONE, 13(8): e0200574.
Schmittner A., Oschlies A., Matthews H.D., Galbraith E.D. 2008. Future changes in climate, ocean circulation, ecosystems and biogeochemical cycling simulated for a business-as-usual CO2 emission scenario until year 4000 AD. Global Biogeochemical Cycles, 22: GB1013.
Shen M., Huang W., Chen M., Song B., Zeng G., Zhang Y. 2020b. (Micro)plastic crisis: un-ignorable contribution to global greenhouse gas emissions and climate change. Journal of Cleaner Production, 254: 120138.
Shen M., Liu S., Hu T., Zheng K., Wang Y., Long H. 2023. Recent advances in the research on effects of micro/nanoplastics on carbon conversion and carbon cycle: a review. Journal of Environmental Management, 334: 117529.
Shen M., Ye S., Zeng G., Zhang Y., Xing L., Tang W., et al. 2020a. Can microplastics pose a threat to ocean carbon sequestration? Marine Pollution Bulletin, 150: 110712.
Stegmann P., Daioglou V., Londo M., van Vuuren D.P., Junginger M. 2022. Plastic futures and their CO2 emissions. Nature, 612(7939): 272–276.
Stubbins A., Law K.L., Muñoz S.E., Bianchi T.S., Zhu L. 2021. Plastics in the Earth system. Science, 373(6550): 51–55.
UNEP/EA.5/Res.14. 2022. Resolution adopted by the United Nations Environment Assembly on 2 March 2022. United Nations Environment Programme. Available from https://wedocs.unep.org/xmlui/bitstream/handle/20.500.11822/39764/END%20PLASTIC%20POLLUTION%20%20TOWARDS%20AN%20INTERNATIONAL%20LEGALLY%20BINDING%20INSTRUMENT%20-%20English.pdf?sequence=1&isAllowed=y [accessed 20 September 2023].
UNEP/PP/INC.1/14. 2022. Report of the intergovernmental negotiating committee to develop an international legally binding instrument on plastic pollution, including in the marine environment, on the work of its first session. United Nations Environment Programme. Available from https://wedocs.unep.org/bitstream/handle/20.500.11822/41841/UNEPINC.114Reportupdated.pdf?sequence=1&isAllowed=y%20%20https://www.unep.org/events/conference/inter-governmental-negotiating-committee-meeting-inc-1 [accessed 20 September 2023].
UNFCCC/CP/2015/L.9/Rev.1. 2015. Adoption of the Paris Agreement. United Nations Environment Programme. Available from https://unfccc.int/resource/docs/2015/cop21/eng/109r01.pdf [accessed 20 September 2023].
Weaver A.J., Eby M., Wiebe E.C., Bitz C.M., Duffy P.B., Ewen T.L., et al. 2001. The UVic earth system climate model: model description, climatology, and applications to past, present and future climates. Atmosphere-Ocean, 39(4): 361–428.
Yarsley V.E., Couzens E.G. 1941. Plastics Middlesex. Allen Lane, Penguin Books, Harmondsworth, England. p. 160.
Yue X.-L., Gao Q.-X. 2018. Contributions of natural systems and human activity to greenhouse gas emissions. Advances in Climate Change Research, 9(4): 243–252.
Zheng J., Suh S. 2019. Strategies to reduce the global carbon footprint of plastics. Nature Climate Change, 9(5): 374–378.
Zhu L., Zhao S., Bittar T.B., Stubbins A., Li D. 2020. Photochemical dissolution of buoyant microplastics to dissolved organic carbon: rates and microbial impacts. Journal of Hazardous Materials, 383: 121065.
Zickfeld K., Eby M., Weaver A.J., Alexander K., Crespin E., Edwards N.R., et al. 2013: Long-term climate change commitment and reversibility: an EMIC intercomparison. Journal of Climate, 16, 5782–5809.
Information & Authors
Information
Published In

FACETS
Volume 8 • January 2023
Pages: 1 - 7
Editor: Neil Cameron Swart
History
Received: 8 April 2023
Accepted: 5 June 2023
Version of record online: 19 October 2023
Copyright
© 2023 The Author(s). This work is licensed under a Creative Commons Attribution 4.0 International License (CC BY 4.0), which permits unrestricted use, distribution, and reproduction in any medium, provided the original author(s) and source are credited.
Data Availability Statement
The model output is available upon request. The UVic ESCM is available at http://terra.seos.uvic.ca/model/.
Key Words
Sections
Subjects
Authors
Author Contributions
Conceptualization: NSG, KK, ME, AJW
Data curation: NSG, ME, AJW
Formal analysis: NSG, ME, AJW
Funding acquisition: ME, AJW
Investigation: NSG, ME, AJW
Methodology: NSG, KK, ME, AJW
Project administration: AJW
Resources: ME, AJW
Software: ME, AJW
Supervision: KK, ME, AJW
Validation: ME, AJW
Visualization: ME, AJW
Writing – original draft: NSG, AJW
Writing – review & editing: NSG, KK, ME, AJW
Competing Interests
The authors declare there are no competing interests.
Funding Information
Natural Sciences and Engineering Research Council of Canada: Discovery Grant
Climate Action and Awareness Fund
Metrics & Citations
Metrics
Other Metrics
Citations
Cite As
Natalia S. Gurgacz, Karin Kvale, Michael Eby, and Andrew J. Weaver. 2023. Impact of plastic pollution on atmospheric carbon dioxide. FACETS.
8(): 1-7. https://doi.org/10.1139/facets-2023-0061
Export Citations
If you have the appropriate software installed, you can download article citation data to the citation manager of your choice. Simply select your manager software from the list below and click Download.
There are no citations for this item