Impacts of hypoxia on estuarine macroinvertebrate assemblages across a regional nutrient gradient
Abstract
Introduction
Methods
Study area
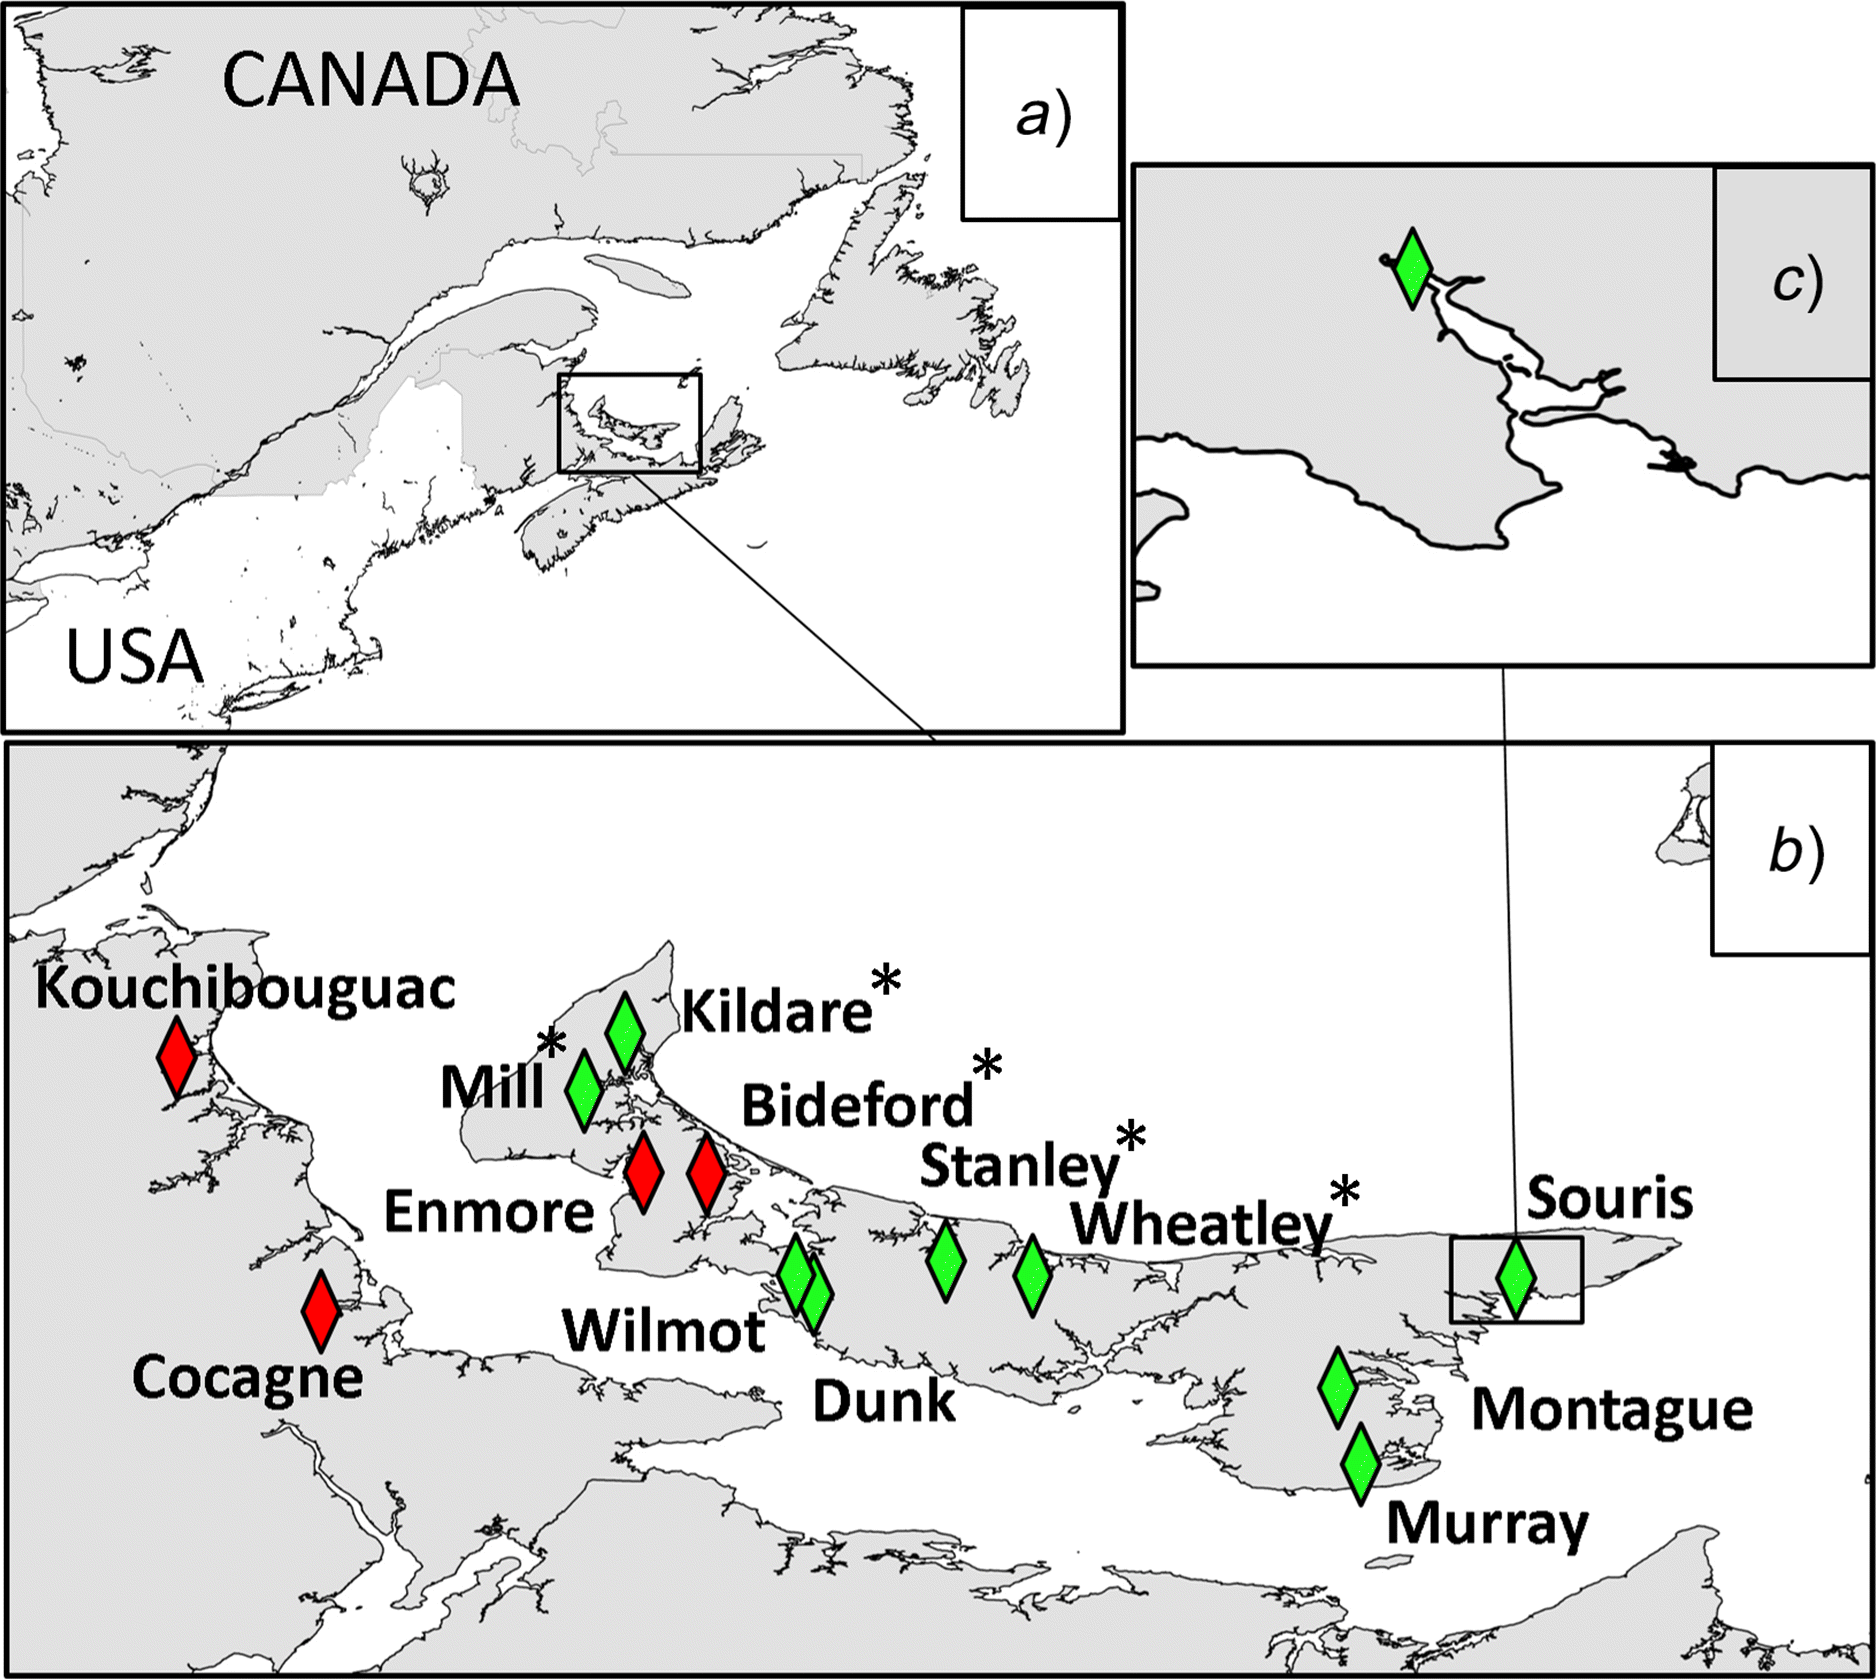
| Site | Substrate grain size (D50) (μm) | Substrate organic content % (±0.02) | Salinity (PSU) | pH (±0.1) | Average depth (m) | Tidal amplitude (m) | Temperature (°C) | Nitrate-N (kg/d) | Residence time | Chlorophyll a (μg/L) | Dissolved oxygen (mg/L) | Hours below 6 mg/L oxygen | Hours above 10 mg/L oxygen |
|---|---|---|---|---|---|---|---|---|---|---|---|---|---|
| Kouchibouguac | 42.7 ± 6.2 | 12.2 | 17.7 ± 3.7 | 7.6 | 1.22 | 0.85 | 17.4 ± 0.4 | 31 | 1.72 | 1.4 ± 0.2 | 9.3 | 0 | 0.28 |
| Cocagne | 36.3 ± 4.8 | 11.8 | 17.9 ± 3.3 | 7.5 | 1.13 | 1.10 | 21.1 ± 1.7 | 2 | 1.19 | 7.6 ± 1.8 | 7.6 | 0.07 | 0.02 |
| Kildare | 30.5 ± 3.1 | 15.4 | 23.4 ± 0.6 | 7.5 | 1.67 | 0.68 | 21.8 ± 1.4 | 38 | 3.72 | 13.2 ± 1.1 | 7.8 | 0.33 | 0.51 |
| Mill | 36.2 ± 1.4 | 14.6 | 23.6 ± 0.5 | 7.5 | 1.16 | 0.97 | 20.8 ± 1.5 | 189 | 2.74 | 19.0 ± 5.4 | 8.7 | 0.38 | 0.45 |
| Enmore | 89.2 ± 18.1 | 8.6 | 18.2 ± 1.9 | 7.5 | 1.57 | 1.10 | 22.6 ± 1.1 | 2 | 0.78 | 6.9 ± 2.0 | 7.8 | 0.15 | 0.09 |
| Bideford | 69.3 ± 6.2 | 17.0 | 26.8 ± 0.4 | 7.5 | 1.05 | 1.13 | 21.1 ± 1.0 | 1 | 2.13 | 9.8 ± 2.3 | 10.6 | 0.01 | 0.57 |
| Wilmot | 154.4 ± 5.0 | 3.0 | 21.1 ± 1.1 | 7.6 | 1.18 | 1.85 | 21.3 ± 1.4 | 421 | 0.83 | 10.2 ± 3.9 | 10.0 | 0.04 | 0.40 |
| Dunk | 239.9 ± 3.1 | 3.4 | 21.8 ± 2.2 | 7.6 | 1.19 | 1.93 | 20.9 ± 1.5 | 721 | 0.78 | 23.3 ± 1.5 | 8.6 | 0.21 | 0.30 |
| Stanley | 24.7 ± 2.3 | 17.8 | 25.6 ± 0.7 | 7.6 | 1.43 | 0.91 | 21.8 ± 0.8 | 34 | 3.93 | 21.5 ± 4.2 | 6.0 | 0.60 | 0.35 |
| Wheatley | 22.0 ± 1.9 | 20.7 | 25.4 ± 0.6 | 7.6 | 1.62 | 1.07 | 21.7 ± 0.6 | 119 | 3.80 | 14.6 ± 5.5 | 9.9 | 0.26 | 0.56 |
| Murray | 33.2 ± 1.9 | 16.1 | 26.7 ± 0.2 | 7.5 | 2.05 | 1.80 | 19.2 ± 1.1 | 53 | 2.40 | 22.3 ± 2.3 | N/A | N/A | N/A |
| Montague | 189.2 ± 73.5 | 8.1 | 25.0 ± 1.6 | 7.5 | 1.34 | 1.81 | 17.3 ± 0.8 | 374 | 2.85 | 7.4 ± 2.5 | 6.6 | 0.41 | 0.08 |
| Souris | 66.3 ± 3.3 | 9.8 | 23.8 ± 1.6 | 7.6 | 0.63 | 1.64 | 19.3 ± 1.8 | 57 | 2.30 | 12.3 ± 6.5 | 14.0 | 0 | 0.71 |
Note: N-loading is courtesy of the Prince Edward Island provincial government, based on 2010 land-use layers, and work conducted by Grizard (2013) and Jiang et al. (2015). Pressure loggers were deployed in summer 2015 at the same locations as the dissolved oxygen loggers. Residence time is the proportion of water remaining after the minimum low tide relative to mean tide (the overall average is presented here). Dissolved oxygen threshold values represent the average percentage of hours meeting the criteria across all sampling times. Variability is presented as ±1 SE, for n = 3 in all cases.
Water chemistry and dissolved oxygen
Water residence time and nutrient loading
Sediment organic content and particle size analysis
Invertebrate sampling
Data analysis
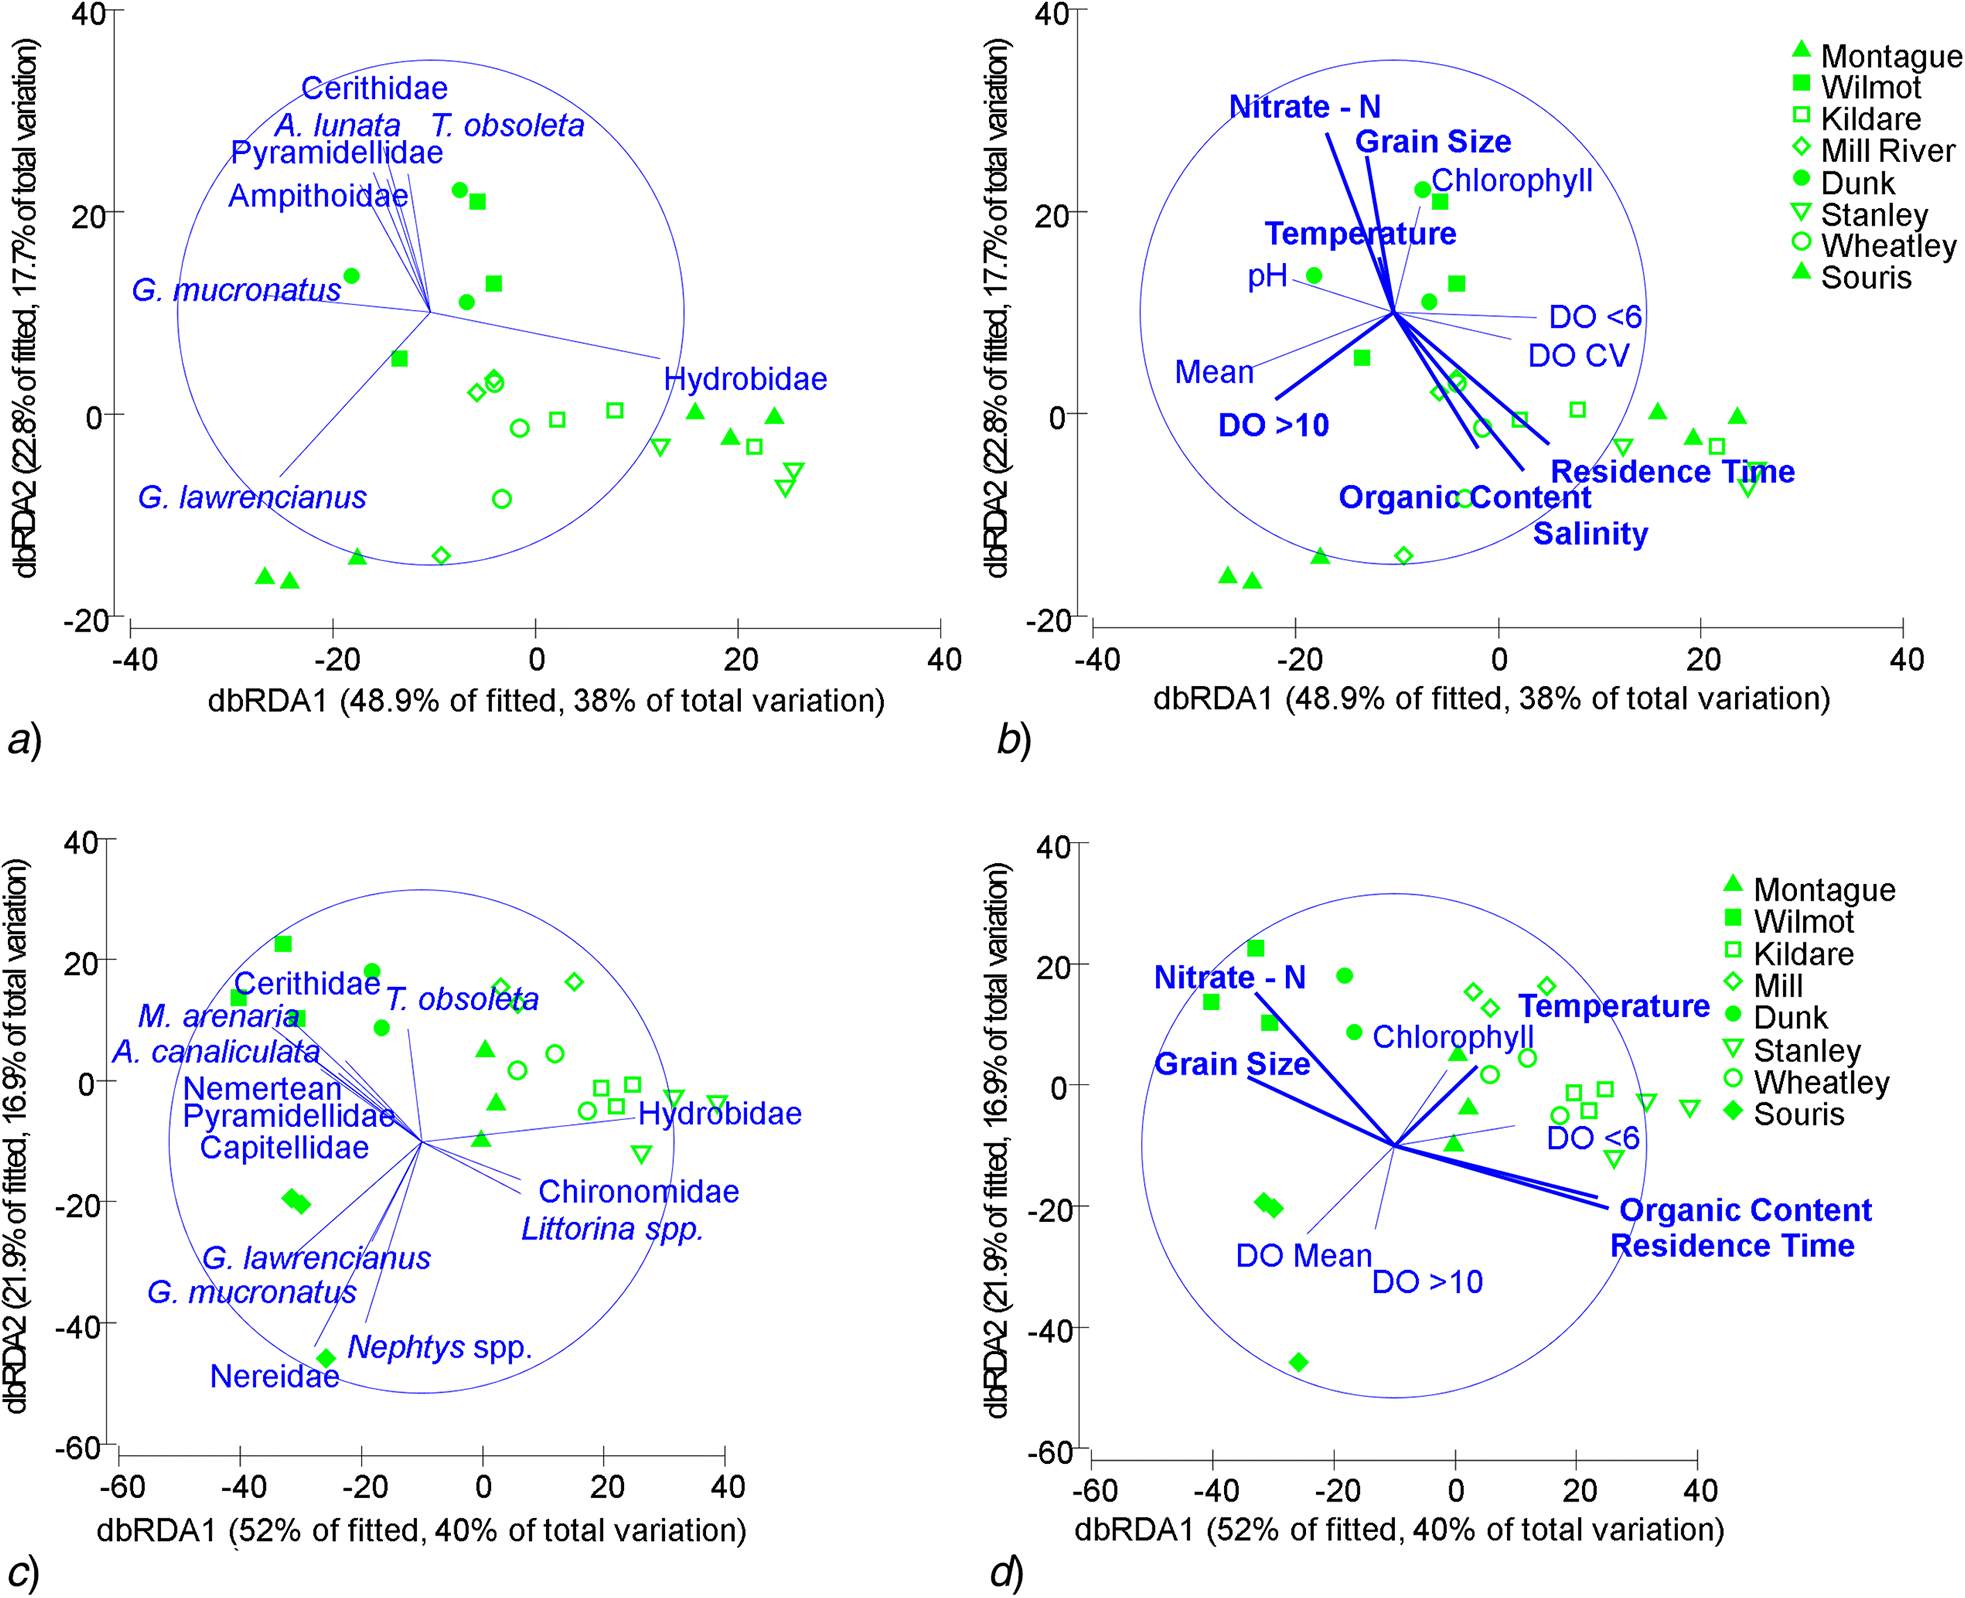
Results
Site and plant habitat differences
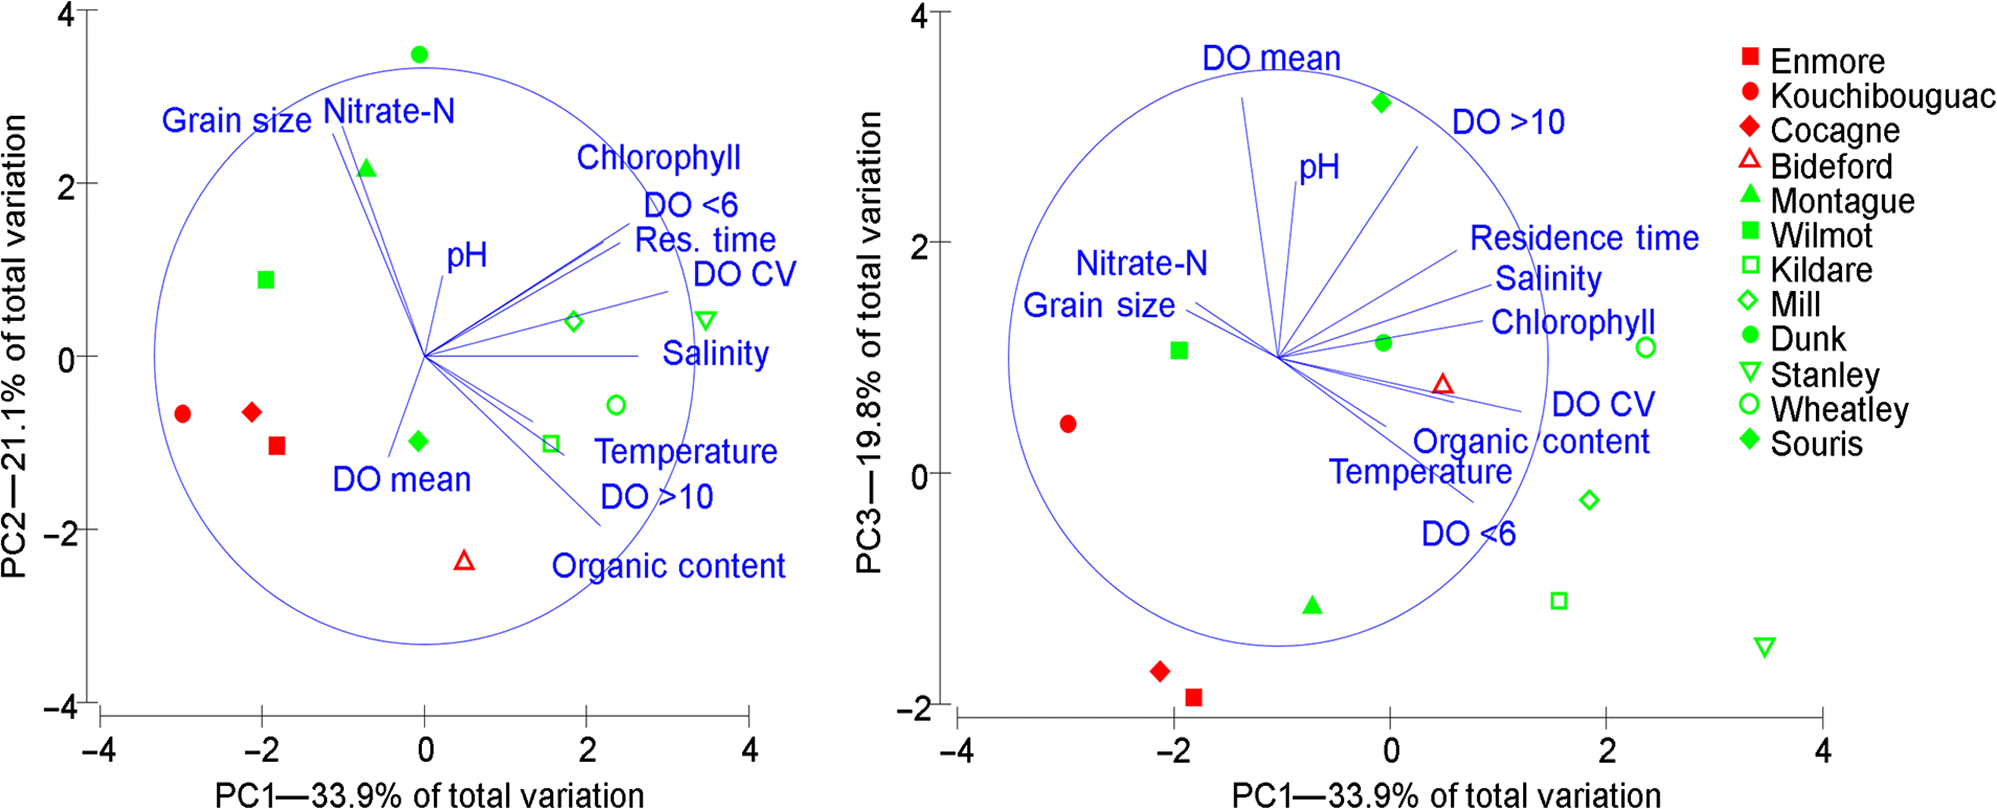
| Variable | PC1—33.9% | PC2—21.1% | PC3—19.8% |
|---|---|---|---|
| <6 mg/L DO | −0.359 | −0.246 | 0.325 |
| >10 mg/L DO | −0.257 | 0.216 | −0.475 |
| DO mean | 0.067 | 0.220 | −0.586 |
| DO CV | −0.447 | −0.141 | 0.122 |
| Grain size (D50) | 0.169 | −0.486 | −0.170 |
| Organic content | −0.323 | 0.371 | 0.100 |
| Salinity | −0.393 | 0.000 | −0.165 |
| pH | −0.033 | −0.176 | −0.396 |
| Temperature | −0.199 | 0.144 | 0.156 |
| Nitrate-N | 0.152 | −0.503 | −0.125 |
| Residence time | −0.328 | −0.249 | −0.241 |
| Chlorophyll | −0.377 | −0.290 | −0.084 |
Note: Values >0.300 or <−0.300 are bolded to highlight their relative contribution to the model. DO, dissolved oxygen; CV, coefficient of variation.
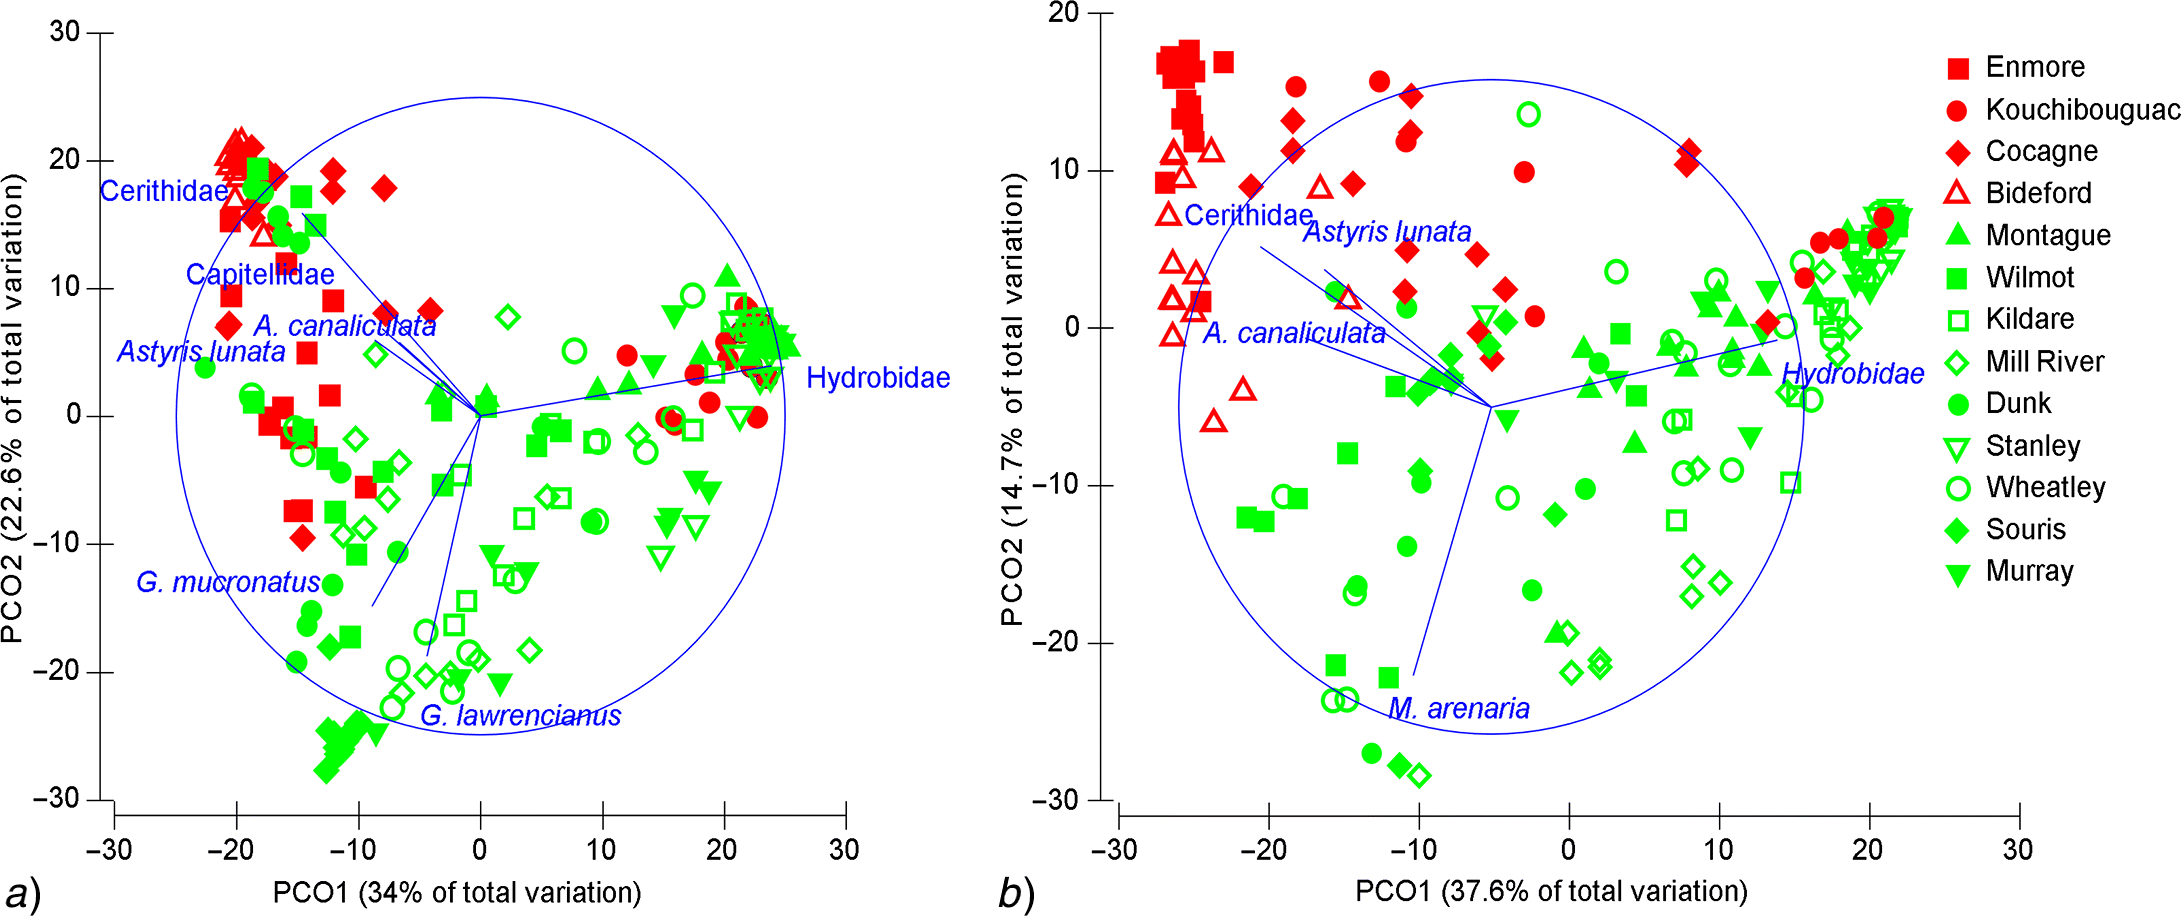
| Taxon | Average relative abundance | Average dissimilarity | Contrasting taxa (contribution %) | |
|---|---|---|---|---|
| Z. marina | Ulva | |||
| Epifauna | ||||
| Hydrobidae | 0.19 | 0.34 | 17.49 | 21.83 |
| Cerithidae | 0.27 | 0.06 | 13.48 | 16.82 |
| Gammarus mucronatus | 0.08 | 0.16 | 8.18 | 10.20 |
| G. lawrencianus | 0.01 | 0.15 | 7.47 | 9.31 |
| Capitellidae | 0.10 | 0.00 | 4.85 | 6.05 |
| Mya arenaria | 0.05 | 0.04 | 3.43 | 4.28 |
| Corophidae | 0.02 | 0.05 | 2.77 | 3.46 |
| Littorina spp. | 0.01 | 0.04 | 2.54 | 3.16 |
| Nereidae | 0.04 | 0.01 | 2.44 | 3.04 |
| Astyris lunata | 0.03 | 0.02 | 2.29 | 2.86 |
| Acetocina canaliculata | 0.04 | 0.00 | 2.04 | 2.55 |
| Tritia obsoleta | 0.01 | 0.04 | 2.04 | 2.54 |
| Chironomidae | 0.03 | 0.01 | 1.80 | 2.25 |
| Infauna | ||||
| Hydrobidae | 0.15 | 0.43 | 19.64 | 23.92 |
| Cerithidae | 0.35 | 0.02 | 16.99 | 20.69 |
| M. arenaria | 0.06 | 0.15 | 8.12 | 9.89 |
| Capitellidae | 0.10 | 0.07 | 6.50 | 7.91 |
| A. canaliculata | 0.09 | 0.01 | 4.56 | 5.56 |
| Nereidae | 0.04 | 0.05 | 4.15 | 5.05 |
| G. mucronatus | 0.03 | 0.05 | 3.89 | 4.73 |
| L. obtusata | 0.01 | 0.07 | 3.55 | 4.33 |
| A. lunata | 0.07 | 0.00 | 3.39 | 4.14 |
| N. obsoletus | 0.00 | 0.04 | 2.14 | 2.60 |
| Chironimidae | 0.02 | 0.02 | 2.03 | 2.47 |
Note: The similarity cut off threshold was 2% for both epifauna and infauna.
| Enmore | Kouchibouguac | Cocagne | Bideford | Murray | Montague | Wilmot | Kildare | Mill River | Dunk | Stanley | Wheatley | Souris | |
|---|---|---|---|---|---|---|---|---|---|---|---|---|---|
| Gastropods | |||||||||||||
| Tritia obsoleta | Z | — | Z | Z | U | U | U | U | U | U | U | U | — |
| Hydrobidae | Z | Z | Z | — | U | U | U | U | U | U | U | U | U |
| Cerithidae | Z | — | Z | Z | — | U | U | U | U | U | U | U | — |
| Pyramidellidae | Z | Z | Z | Z | U | U | U | U | U | U | — | U | — |
| Acteocina canaliculata | Z | — | Z | Z | U | U | U | U | U | U | U | U | — |
| Littorina spp. | Z | Z | Z | Z | U | U | U | U | U | — | — | U | — |
| Astyris lunata | Z | — | Z | Z | — | — | U | — | U | U | — | — | — |
| Bivalves | |||||||||||||
| Mya arenaria | Z | — | Z | Z | U | U | U | U | U | U | U | U | U |
| Gemma gemma | Z | Z | — | Z | — | U | U | U | U | — | U | U | U |
| Cerastoderma pinnulatum | — | — | — | Z | — | — | — | — | — | — | — | — | — |
| Macoma calcarea | — | Z | — | — | — | — | — | — | — | — | — | — | — |
| Mytilidae | Z | — | Z | Z | U | U | — | U | U | — | U | — | U |
| Crassostrea virginica | Z | — | — | Z | — | — | — | — | U | U | — | — | — |
| Crustacea: Amphipod–Tanaid–Isopod–Decapod | |||||||||||||
| Gammarus mucronatus | Z | Z | Z | Z | U | U | U | U | U | U | U | U | U |
| G. lawrencianus | Z | Z | — | Z | U | U | U | U | U | U | U | U | U |
| G. oceanicus | — | — | Z | — | U | U | U | — | U | — | — | U | — |
| G. tigrinus | — | Z | — | — | — | — | — | — | — | — | — | — | — |
| Ampithoidae | Z | Z | — | Z | — | — | U | — | — | U | — | — | — |
| Corophidae | Z | — | — | Z | U | U | U | U | U | U | U | U | U |
| Tanaidacae | Z | — | — | — | — | — | — | — | — | — | U | — | — |
| Jaera sp. | Z | — | Z | — | — | U | U | — | U | U | U | — | U |
| Palaemon spp. | Z | — | Z | — | — | — | U | — | — | U | — | U | U |
| Crangon crangon | — | Z | Z | Z | — | U | U | — | U | — | — | — | — |
| Insecta | |||||||||||||
| Chironominae | Z | Z | Z | — | U | — | — | — | U | — | U | U | — |
| Orthocladiinae | Z | — | — | — | — | — | — | — | — | — | U | — | — |
| Annelida: Polychaeta–Clitellata | |||||||||||||
| Nereidae | Z | Z | Z | Z | U | U | — | U | U | — | U | U | U |
| Glyceridae | — | Z | — | Z | — | — | — | — | U | — | — | — | — |
| Capitellidae | Z | Z | Z | Z | U | — | U | U | U | U | U | U | U |
| Nephtys spp. | Z | Z | Z | Z | U | — | U | U | U | — | U | U | U |
| Orbiniidae | Z | Z | Z | Z | U | — | — | — | U | — | U | — | — |
| Spionidae | Z | Z | — | Z | U | — | — | U | — | — | U | U | — |
| Pectinariidae | Z | — | — | Z | — | — | — | U | U | — | — | — | — |
| Terebellidae | Z | Z | Z | Z | U | — | U | — | — | — | — | — | — |
| Polynoidae | — | — | — | Z | — | — | — | U | U | U | — | U | — |
| Naididae | — | — | — | — | — | U | — | — | — | U | — | — | — |
| Nemertea and Hemichordata | |||||||||||||
| Nemertea | Z | — | Z | — | — | — | — | — | — | — | — | — | — |
| Hemichordata | — | Z | — | — | — | — | — | — | — | — | — | — | — |
| Echinodermata | |||||||||||||
| Asterias sp. | — | — | Z | Z | — | U | — | U | — | — | — | — | — |
Note: Z. marina-dominated habitat is indicated with the letter “Z” and Ulva-dominated habitat by the letter “U”. Only species occurring in more than one sample per site are shown.
Within-habitat differences
Z. marina
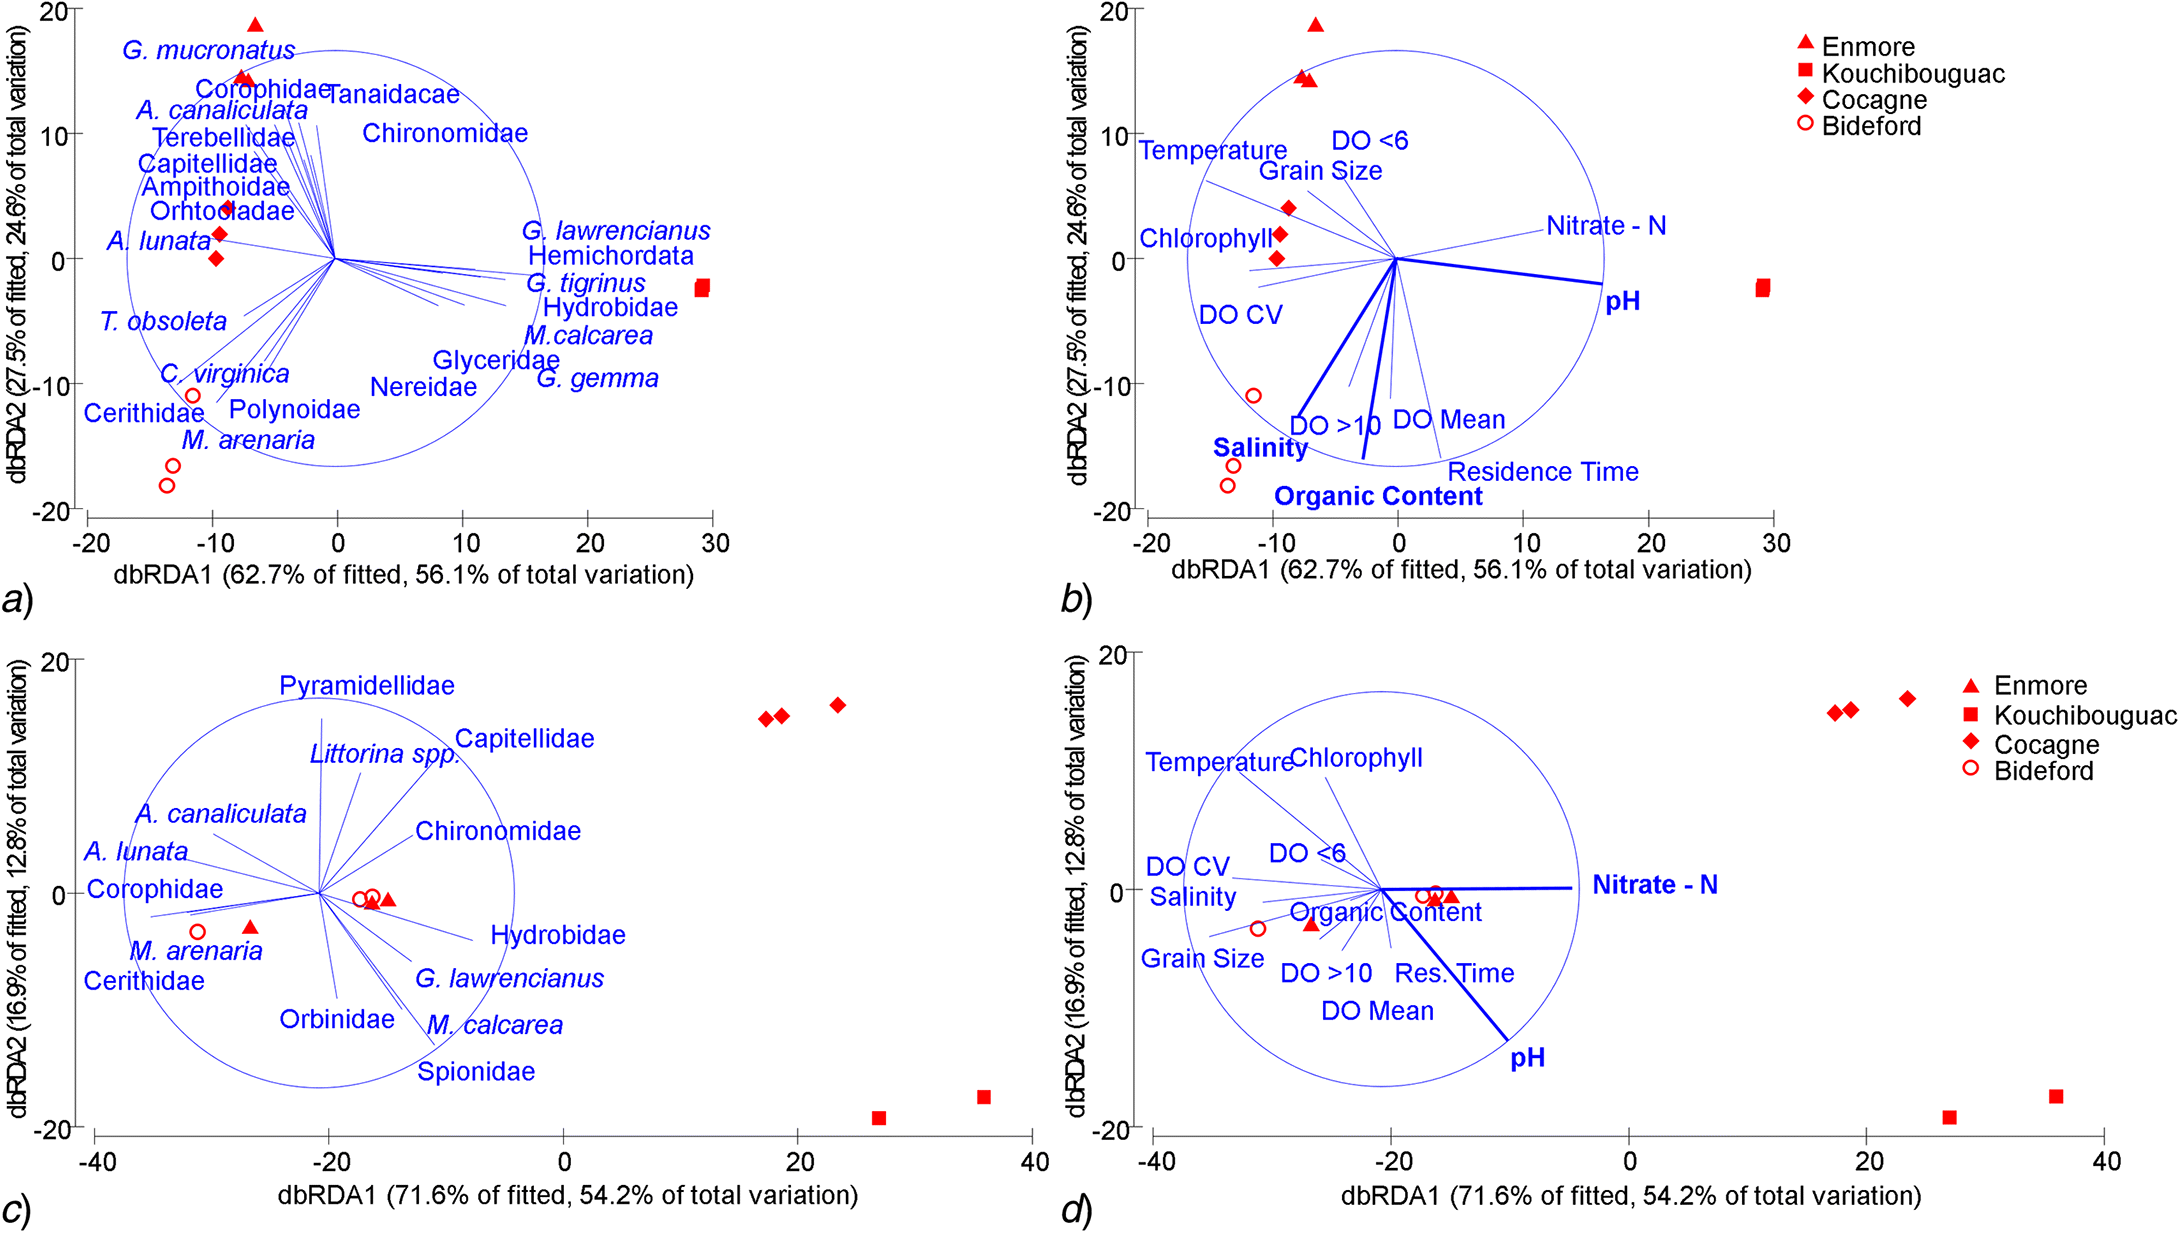
Ulva
Discussion
Acknowledgements
References
Supplementary material
- Download
- 330.51 KB
Information & Authors
Information
Published In

History
Copyright
Data Availability Statement
Key Words
Sections
Subjects
Authors
Author Contributions
Competing Interests
Metrics & Citations
Metrics
Other Metrics
Citations
Cite As
Export Citations
If you have the appropriate software installed, you can download article citation data to the citation manager of your choice. Simply select your manager software from the list below and click Download.