Community structure, species–habitat relationships, and conservation of amphibians in forested vernal pools in the Georgian Bay region of Ontario
Abstract
Forested vernal pools serve an integral role in the recruitment of amphibians in glaciated northeastern North America. In south-central Ontario, vernal pools exist in relatively unimpacted forest networks, but the amphibian communities face uncertain challenges from anthropogenic-induced climate change. We surveyed amphibian larvae and collected measurements of habitat characteristics from vernal pools to collect baseline information on amphibian community structure and species–habitat relationships. Amphibian communities were influenced by hydroperiod length and canopy openness, and the relative abundances of early breeding amphibians were affected by changes in the structure of vegetation communities within pools. Our study suggests that, even across moderate ranges of breeding habitat characteristics, the structure of amphibian communities is dynamic. With anthropogenic-induced climate change leading to more drought-prone summers, the conservation of intact forests that support diverse wetland assemblages will be a necessary component of future legislation.
Introduction
Global amphibian declines represent one of the hallmarks of the current biodiversity crisis. Amphibians are impacted by numerous stressors, including habitat loss and alteration, invasive species, disease, environmental pollution (Hamer and McDonnell 2008; Baldwin and DeMaynadier 2009; Rollins-Smith 2017); however, one of the least understood threats is global climate change because its effects have yet to be fully realized (Blaustein et al. 2010; Li et al. 2013). Shifts in seasonal timings of the onset of freeze–thaw periods may cause uneven changes in the phenological cycles of interacting species (Blaustein et al. 2001; Ficetola and Maiorano 2016; Green 2017), and environmental stress may increase the susceptibility of amphibians to disease (Blaustein et al. 2010; Rollins-Smith 2017). In addition, amphibians often have very specific breeding requirements that are tied to aquatic resources, so changes to climate that affect the availability of these resources could have detrimental effects on recruitment (Corn 2005; Brooks 2009). Our ability to predict and react to the direct effects of climate change and the negative synergistic effects with other stressors will rely on efforts to understand the diversity of amphibian habitats and how communities change across environmental gradients.
In glaciated northeastern North America, forested wetlands comprise a large proportion of amphibian breeding habitat. These wetlands vary in a number of qualities that dictate patterns in amphibian diversity across the landscape, including hydroperiod length (i.e., the amount of time a wetland is inundated; Babbitt et al. 2003; Baber et al. 2004), canopy cover (Werner and Glennemeier 1999; Werner et al. 2007), and surrounding land cover (Hecnar and M’Closkey 1998; Findlay et al. 2001; Houlahan and Findlay 2003). Despite these differences leading to unique amphibian assemblages, conservation efforts are often unequal across wetland types. Certain protections are provided to large and conspicuous permanent wetlands, but temporary wetlands are frequently overlooked in legislation because of their relative obscurity in forested landscapes (Mahaney and Klemens 2008). In northeastern North America, temporary wetlands that occur in the temperate forests are commonly referred to as vernal pools and are a primary breeding habitat for many amphibians that are intolerant of predatory fish populations, including salamanders in the genus Ambystoma and wood frogs (Lithobates sylvaticus). To better conserve amphibian diversity on regional scales, underrepresented habitats like vernal pools need greater research and management attention.
Our study focusses on vernal pool habitat in an intact forested region of eastern Georgian Bay, Ontario. Little is known about the aquatic resources in this region compared with more urban and agricultural regions in the southern part of the province. While breeding habitat associations for amphibians are well studied for southern Ontario (Findlay and Houlahan 1997; Hecnar and M’Closkey 1998; Findlay et al. 2001), there are differences in climate, landscape characteristics, wetland types, and amphibian ranges that could affect the reliability of these relationships across the province. The primary objective of this study was to document baseline information on vernal pool amphibian assemblages in the Georgian Bay region through assessments of community structure and species–habitat relationships. In particular, we were interested in re-examining relationships with influential variables from previous studies, including hydroperiod length and canopy cover (Babbitt et al. 2003; Egan and Paton 2004; Baldwin et al. 2006; Veysey et al. 2011; Semlitsch et al. 2015), to assess whether these variables were similarly important for community structure and abundance in vernal pools within a largely intact forest ecosystem. There is an urgent need to identify key habitat characteristics that structure amphibian communities in vernal pools of forests in the Ontario, especially in the face of anticipated threats associated with global climate change.
Methods
Study area
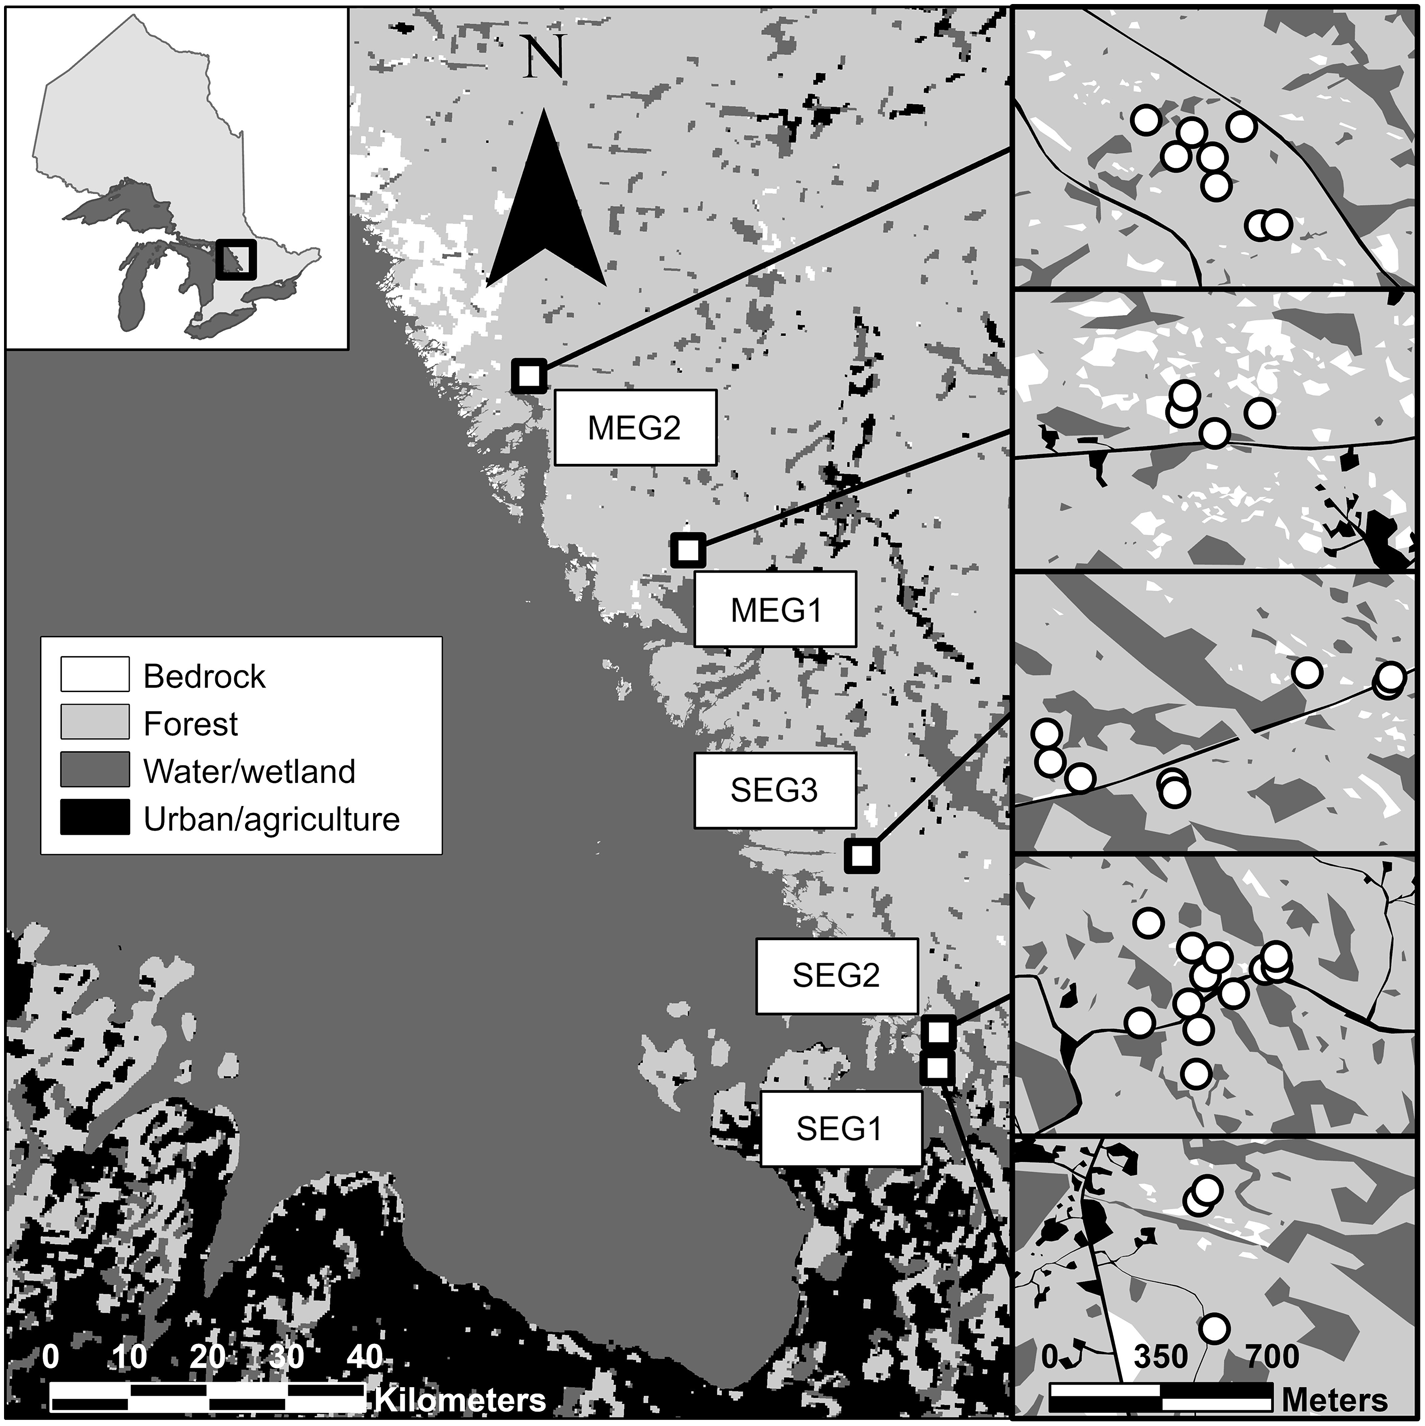
We conducted our study in forests along the eastern coast of Georgian Bay, Ontario. This area lies within the Georgian Bay Ecoregion (GBE) and marks the western extent of central Ontario. GBE is characterized by a mixture of deciduous, coniferous, and mixed forests and common species include white pine (Pinus strobus), red pine (P. resinosa), eastern hemlock (Tsuga canadensis), yellow birch (Betula alleghaniensis), sugar maple (Acer saccharum), beech (Fagus americana), black cherry (Prunus serotina), and white ash (Fraxinus americana) (Crins et al. 2009). The rugged terrain from the underlying Precambrian Shield creates numerous landscape depressions where wetlands form, including lakes, marshes, beaver ponds, thicket swamps, peatland, and vernal pools (Davidson 2015; Luymes and Chow-Fraser 2021). The climate is cool-temperate with average annual temperature and precipitation of 4.5 °C and 950 mm, respectively (Crins et al. 2009). The land cover is dominated by forests, with only a small proportion (<10%) classified as agriculture or urban (Crins et al. 2009). The shorelines of lakes and rivers are popular areas for cottage development and the eastern shore of Georgian Bay supports large cottage communities, including the Muskoka cottage region. Approximately half of the forests in GBE are on public land are a managed according to sustainable forestry practices (Davidson 2015).
Amphibian surveys
We conducted larvae surveys in 2019 and 2020 at 35 pools across five public (crown land) forest plots along the eastern coast of Georgian Bay: three plots along southeastern Georgian Bay and two plots along mid-eastern Georgian Bay (Fig. 1). Forest plots were generally characterized by few anthropogenic disturbances and a mixture of deciduous and coniferous species. Our criteria for wetland selection included easy access from roads or trails, a temporary hydroperiod, and signs of breeding amphibians. We did not observe signs of recent logging in the immediate vicinity of any of the study pools. To account for early- and late-breeding amphibians, we surveyed amphibian larvae twice per year. In 2019, early surveys took place during the last week of May and first week of June, and late surveys took place during the first and second weeks of July. In 2020, early surveys took place during the second-to-last week of June, and late surveys took place during the second week of July. Some pools with short hydroperiods were dry during the later survey periods. Survey timing changed between years due to differences in the onset of warm weather and the perceived rate of pool drying.
Fig. 1.
To mitigate biases associated with any one survey method, we used two techniques to estimate species abundance at each pool: bucket traps and dip netting (Fig. 2). Bucket traps were 19 L buckets (31 cm diameter) with bottoms removed and dip nets were 350-μm mesh nets on a D frame (30 × 30 × 60 cm). For each bucket trap sample, the bucket trap was driven into the pool substrate and any trapped larvae were extracted with a mesh strainer. For each dip net sample, the net was swept just above the substrate for a 1-m transect. The net was then inverted into a bucket of water and larvae were extracted with a mesh strainer. Extracted larvae were placed in gridded trays, where they were photographed and identified to species.
Fig. 2.
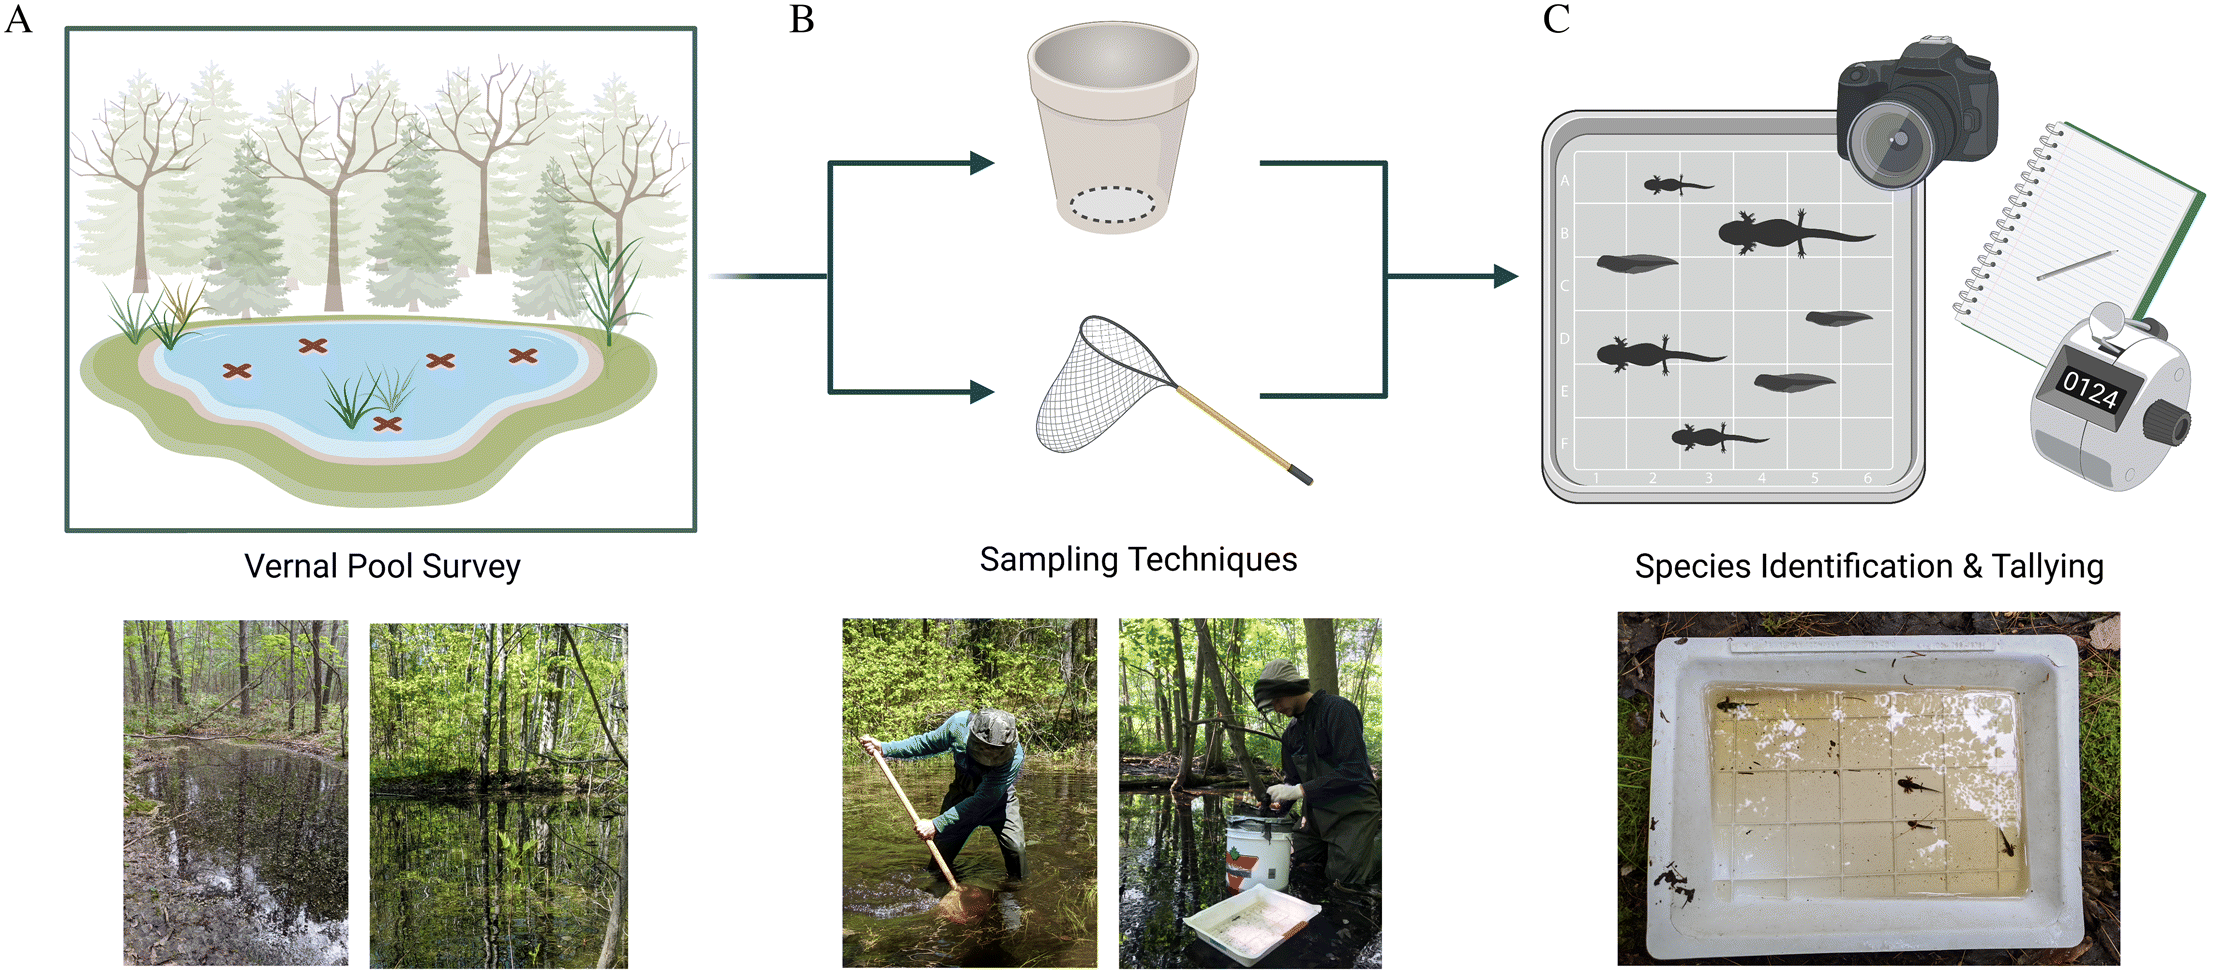
Each survey consisted of one bucket trap sample and one dip net sample. The total number of surveys per pool was proportional to pool surface area: the smallest pools (<50 m2) were surveyed 5 times and the number of surveys increased in increments of 5 surveys per 150 m2 up to a maximum of 25 surveys for the largest pools (>500 m2). Amphibian species are known to prefer different microhabitat types within wetlands (Heyer et al. 1994), so we stratified survey locations by the proportion of different microhabitat types (e.g., open leaf litter, emergent herbaceous vegetation, shrub thicket, pool edge, pool center) to get a representative sample for each pool. In the case of bucket trap samples, we were unable to survey locations deeper than 1 m, so survey locations were stratified by microhabitat types in accessible regions of each pool. Larvae were identified to species in the field following Altig et al. (2017) and Mills (2016) and released after photographs were taken.
Habitat surveys
We sampled multiple habitat variables for each pool that were thought to be important predictors of species presence and abundance, including hydroperiod length, pool surface area, maximum depth, percent cover of microhabitat types, percent canopy openness, and road density. To approximate hydroperiod length, we placed HOBO Pendant MX Water Temperature Data Loggers (Onset, Bourne MA, U.S.A.) in the deepest location of each vernal pool and set the recording interval to every hour. We retrieved the loggers in late August when most pools had dried; we then visually assessed the temperature traces to estimate the dates when each pool dried (Baldwin et al. 2006). Using depth data from Leveloggers (Solinst, Georgetown ON, Canada) placed alongside temperature loggers in three pools, we found estimates from the temperature data were accurate to within one day of the Levelogger estimates. Because of logistical constraints, we were only able to estimate pool drying dates in 2020. We were also unable to measure timing of ice-off for each pool but have found most pools to be ice-free by mid-April in previous years. While the timing of ice-off likely differs among pools, we assumed that differences in the timing of pool drying were greater and thus had a greater effect on hydroperiod length. Consequently, we estimated the average day of ice-off to be April 15 and characterized hydroperiod length to be the number of days between average ice-off and the date that each pool had dried. Future studies may benefit from actual observation of pool ice-off to better approximate differences in hydroperiod length. We analysed hydroperiod as an ordered categorical variable with three levels: short (<3 months; 19 pools), moderate (3–4 months; 7 pools), and long (>4 months—they had not dried before we took out the temperature loggers; 9 pools).
We measured pool length along the longest wetted transect and pool width along the longest wetted transect perpendicular to the length transect. We then used these measurements in an equation for an ellipse to calculate pool surface area. For irregularly shaped pools, we calculated the surface area of individual basins and added these together to calculate the total surface area. Maximum pool area and depth were measured in the early spring when pools were maximally inundated. We also estimated pool surface area during each survey period to correct for differences in larvae density as the pools dried and became smaller.
Canopy openness is known to affect resource availability for anuran larvae (Schiesari 2006). Open canopy wetlands primarily support grazing food chains starting with nutrient-rich algae, whereas closed canopy wetlands primarily support detritus food chains starting with nutrient-poor leaf litter (Werner and Glennemeier 1999; Skelly et al. 2002). We measured canopy openness during leaf-on conditions using a spherical densiometer (Model C; Forestry Suppliers, Jackson MS, U.S.A.) at four cardinal directions for five points within each pool: one point at the intersection of the length and width transects and four points near the pool edge at each end of the length and width transects. We then averaged these measures to come up with an estimate of overall canopy openness.
We visually assessed the percent cover of microhabitat types in early summer when most plant species had become established. We classified microhabitat types into four categories: open leaf litter or mud, herbaceous vegetation (emergent, floating, and submerged), shrub thicket, and moss. Several of the species in this region use persistent woody and nonwoody vegetation as egg attachment sites (Egan and Paton 2004) and the four-toed salamander (Hemidactylium scutatum) is known to deposit eggs within mossy hummocks along the pool margins (Chalmers and Loftin 2006). Herbaceous vegetation such as grass may also represent a high-quality food source for anuran tadpoles (Williams et al. 2008) and the presence of complex structure from vegetation communities may provide cover for developing larvae (Hecnar and M’Closkey 1997).
Road density was estimated with ArcGIS software. A 300-m diameter buffer size was chosen to encompass the approximate home ranges of common amphibian species in this study (Vasconcelos and Calhoun 2004; Semlitsch and Skelly 2008) and to limit spatial correlation of road density measurements among pools in the same forest plot.
Statistical analysis
Drivers of community structure
We quantified catch per unit effort (CPUE) of larval amphibians by dividing the total number of larvae captured during a survey period by the number of surveys during that period. We combined abundances from bucket trap and dip net surveys in our calculations of CPUE. We also wanted to account for changes in larvae density due to changes in pool surface area across survey periods, so we multiplied CPUE by the proportional pool area during the survey period (i.e., relative to the maximum area of the pool). We used these area-standardized CPUE values to calculate an average CPUE across all survey periods.
To visualise differences in the structure of amphibian assemblages, we used nonmetric multidimensional scaling (NMDS) plots. We used the Bray-Curtis dissimilarity matrix of the average CPUE values for each amphibian species encountered to create NMDS plots. We used “stress” of the NMDS solution to decide on the number of ordination axes and interpreted the stress values according to common rules of thumb (Clarke 1993). We used permutational multi-variate analysis of variance (PERMANOVA) to assess amphibian community composition across two habitat variables: hydroperiod length and canopy openness. These habitat variables have been found to have strong effects on species richness and community composition in previous studies (Skelly et al. 1999; Werner et al. 2007). PERMANOVAs were run with the Bray-Curtis dissimilarity matrix and 999 permutations. We created separate univariate models for each habitat variable and a marginal-effects model for all variables combined. Significance was assessed at a 0.05 confidence level based on p values derived from the pseudo F scores. For categorical variables that were found to be significant, we performed pairwise PERMANOVA comparisons and used the similarity percentage routine (SIMPER) to assess the contribution of each species to the average dissimilarity between different categories. PERMANOVA and SIMPER analyses can be disproportionately influenced by species or habitat categories with high variances in abundance (Warton et al. 2012). To overcome these biases, we used results from the species-specific models to validate results from the community analysis. All community analyses were performed in R Studio version 1.4 (R version 4.0.5) with the vegan package (Oksanen et al. 2020).
Species-specific relationships with habitat variables
We used generalized linear mixed models (GLMM) to evaluate the relationship between habitat variables and the larval abundance of any species that were encountered in >50% of the study pools. We fit our models with a Poisson distribution and a log link to accommodate the count data. We standardized the count data in our models using a log-transformed offset term with the number of surveys as the numerator and proportional pool area as the denominator. Our habitat variable set included hydroperiod length, maximum pool surface area, maximum depth, percent canopy openness, percent herbaceous vegetation cover, presence of thicket cover, and road density within a 300-m diameter buffer around each pool. Reproductive success is known to vary between years for pond-breeding amphibians due to changes in population sizes and weather-related impacts on breeding migrations and larval survival (Woodward 1982; Berven 1990; Werner et al. 2009). Consequently, we decided to include year as a variable in all models. We also included day of year as a variable in all models because larvae abundance within a pool initially increases as eggs hatch and decreases as hatched larvae compete for resources. The size of larvae may also have an impact on detectability, with observers less likely to miss larger larvae (Gunzburger 2007). Unfortunately, the structure of our surveys did not allow for an estimate of detection probability, so the effect of day of year on CPUE may be confounded by differences in detectability over time. We checked for collinearity in our variable set using Spearman’s rank correlation coefficient (ρ) and variance inflation factors (VIF). We used conservative cut-offs of ρ > 0.7 or VIF > 8 to consider removing variables from our analysis. All variables were scaled and centered prior to model development to allow for comparisons of effect sizes. We created 23 models for each species, including a null model, a global model, models for each habitat variable, and models with different a priori combinations of habitat variables.
Since pools in the same forest plot were often in close proximity to one another (<1 km apart), the abundance of larvae at one pool may be influenced by abundances in nearby pools. To account for potential spatial autocorrelation, we specified forest plot as a random effect in all of our models. We also specified pool ID and year nested within pool ID as random effects to account for repeated samples of each pool and unequal sampling of pools across years, respectively. Lastly, we found evidence of overdispersion in initial model formulations, so we specified an observation-level random effect for all models (Harrison 2014). We fit GLMM using the blme package in R (Dorie et al. 2020) and assigned priors to the covariance matrices using Wishart distributions that were parameterized using the blme package defaults.
We used an information theoretic approach with Akaike’s Information Criterion corrected for small samples sizes (AICc) to compare and select models with the best support from our data (Burnham and Anderson 2002). We considered models with the lowest AICc to have the best support. The difference between the AICc value of a model and the best-supported model is ΔAICc (Symonds and Moussalli 2011). Models with ΔAICc < 2 were considered to have strong support and were retained to derive final model sets for each species (Symonds and Moussalli 2011). For each habitat variable in the final model sets, we calculated a variable importance measure by summing the relative weights of all the models where that variable occurred (Burnham and Anderson 2002). Habitat variables with importance measures equal to 1.0 are found in all models in the final model set, whereas variables with importance measures close to 0 are found in only one or a few models. To compare the proportion of variance explained by the fixed effects between models, we calculated marginal R2 values for the top models. AICc values, model weights, and marginal R2 values were calculated using R package MuMIn (Bartoń 2020). Parameter estimates and confidence intervals were compared across models for consistency and were reported for the model with the lowest AICc for that variable, unless otherwise specified. To estimate confidence intervals, we resampled our data and calculated 95% confidence intervals using 500 bootstrap iterations (Davison and Hinkley 1997).
To evaluate whether the relative rank of amphibian abundances across pools was preserved between years, we tested the correlation of average CPUE between 2019 and 2020 for species encountered in >50% of pools. We would expect the CPUE of species with relatively consistent annual breeding effort, embryo survival, and (or) larvae survival to be highly correlated between years, while those with large population fluctuations and (or) strong dependence on annual weather conditions to be less correlated between years. All analyses were performed in R (R Core Team 2020).
Ethics approval
Animal handling for this study followed guidelines recommended by the Canadian Council on Animal Care and was approved by McMaster University’s Animal Research and Ethics Board (Animal Use Protocol: 17-01-06).
Results
Wetland characteristics
Pools varied in size and appearance (Table 1), with substrate and vegetation conditions spanning hard packed leaf litter to loose muddy bottoms, and dense thicket cover to emergent grasses and sedges. All variables had VIF < 8 and Spearman’s rank correlation coefficients for most of the within-pool variables considered in this study fell between −0.2 and 0.2 with P > 0.05. Pool vegetation cover and canopy openness were the only variables strongly correlated with one another (ρ = 0.72. P < 0.00001), while hydroperiod length was moderately correlated with canopy openness (ρ = 0.59, P < 0.001) and maximum depth (ρ = 0.49, P < 0.01). Since the mechanism by which key factors affect the amphibian community may vary, all correlated variables were retained for further statistical analyses.
Table 1.
| Variable | Description | Mean | Range |
|---|---|---|---|
| Canopy openness | Percent canopy openness; measured using a densitometer. | 24 | 4–57 |
| Herbaceous vegetation cover | Percent of pool covered by herbaceous vegetation; measured via ocular estimation. | 34 | 0–95 |
| Area | Pool area in square meters; estimated using length and width. | 180 | 13–590 |
| Maximum depth | Maximum depth of pool in centimeters. | 58 | 27–110 |
| Hydroperioda | Estimated number of ice-free, wetted days from 15 April–26 August 2020; maximum of 101 days. | 72 | 44–101+ |
| Road density | Length of roads (km) per squared kilometer in a 300-m buffer around pool. | 2.0 | 0–2.8 |
a
Pools were estimated to be ice-free around mid-April based on observations from previous years.
Larvae assemblages
During 2019 and 2020, we captured 2830 amphibian larvae from eight amphibian species (five anurans and three caudates). Of the 35 pools included in our study, 21 (60%) were surveyed four times, twice each year; eight (23%) were surveyed three times because the sites had dried before the second survey period in 2020; one (3%) was surveyed only twice in 2019 because it was dry during both 2020 survey periods; and five (14%) were surveyed only once because they only had standing water during the early part of the 2019 survey period. From these 35 pools, we excluded the 5 pools with extremely short hydroperiods from further analysis because they dried before any larvae could be captured (i.e., we found unhatched eggs of spotted salamander (Ambystoma maculatum)). The early surveys were generally characterized by early breeding species, including the spotted salamander, blue-spotted salamander (Ambystoma laterale), and wood frog (Lithobates sylvaticus), whereas later surveys were characterized by fewer encounters of wood frogs and more encounters of species with prolonged breeding periods, including the spring peeper (Pseudocris crucifer).
In pools with larvae, richness varied from 1 to 6, with a mean of 3.5. The most commonly encountered species, the spotted salamander, was captured in all but two pools (93% of the pools). Other common species included the blue-spotted salamander, wood frog, and spring peeper, which were found in more than 60% of the study pools (>17 pools). Together, spotted salamanders, blue-spotted salamanders, wood frogs, and spring peepers accounted for 95% of all larvae captured. Gray treefrogs (Hyla versicolor) and four-toed salamanders were less common but were still found in more than 20% of the study pools (>6 pools). American toads (Anaxyrus americanus) and green frogs (Lithobates clamitans) were the least common species in our study (one and two pools, respectively). Both of these rarely encountered species were excluded from the community analysis so as not to disproportionately influence overall trends.
Drivers of community structure
The stress of the two-dimensional NMDS model was 0.11, indicating a good representation of the dissimilarities between pools in reduced dimensions. Species with close phylogenetic relationships tended to be associated in ordination space. For instance, centroids for the two mole salamanders (spotted and blue-spotted salamanders) and for the two treefrogs (gray treefrogs and spring peepers) were found closer to each other than with centroids of other taxa (Fig. 3). The centroid for the four-toed salamander (upper right corner of the Fig. 3) was isolated from the other species in ordination space and this species tended to be captured in pools where other species were either absent or captured at low abundances. They were also the only species found in two sphagnum-dominated pools, which had environmental characteristics that were very different from those of the other pools. These two pools had a disproportionate influence on the appearance of initial NMDS ordinations and were excluded from further statistical analyses.
Fig. 3.
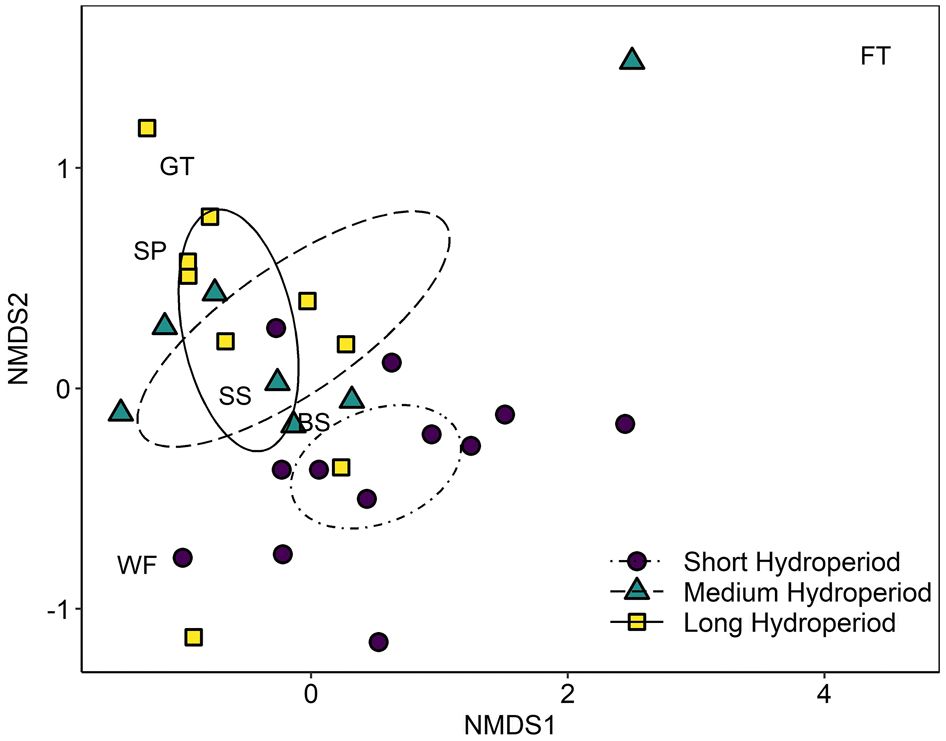
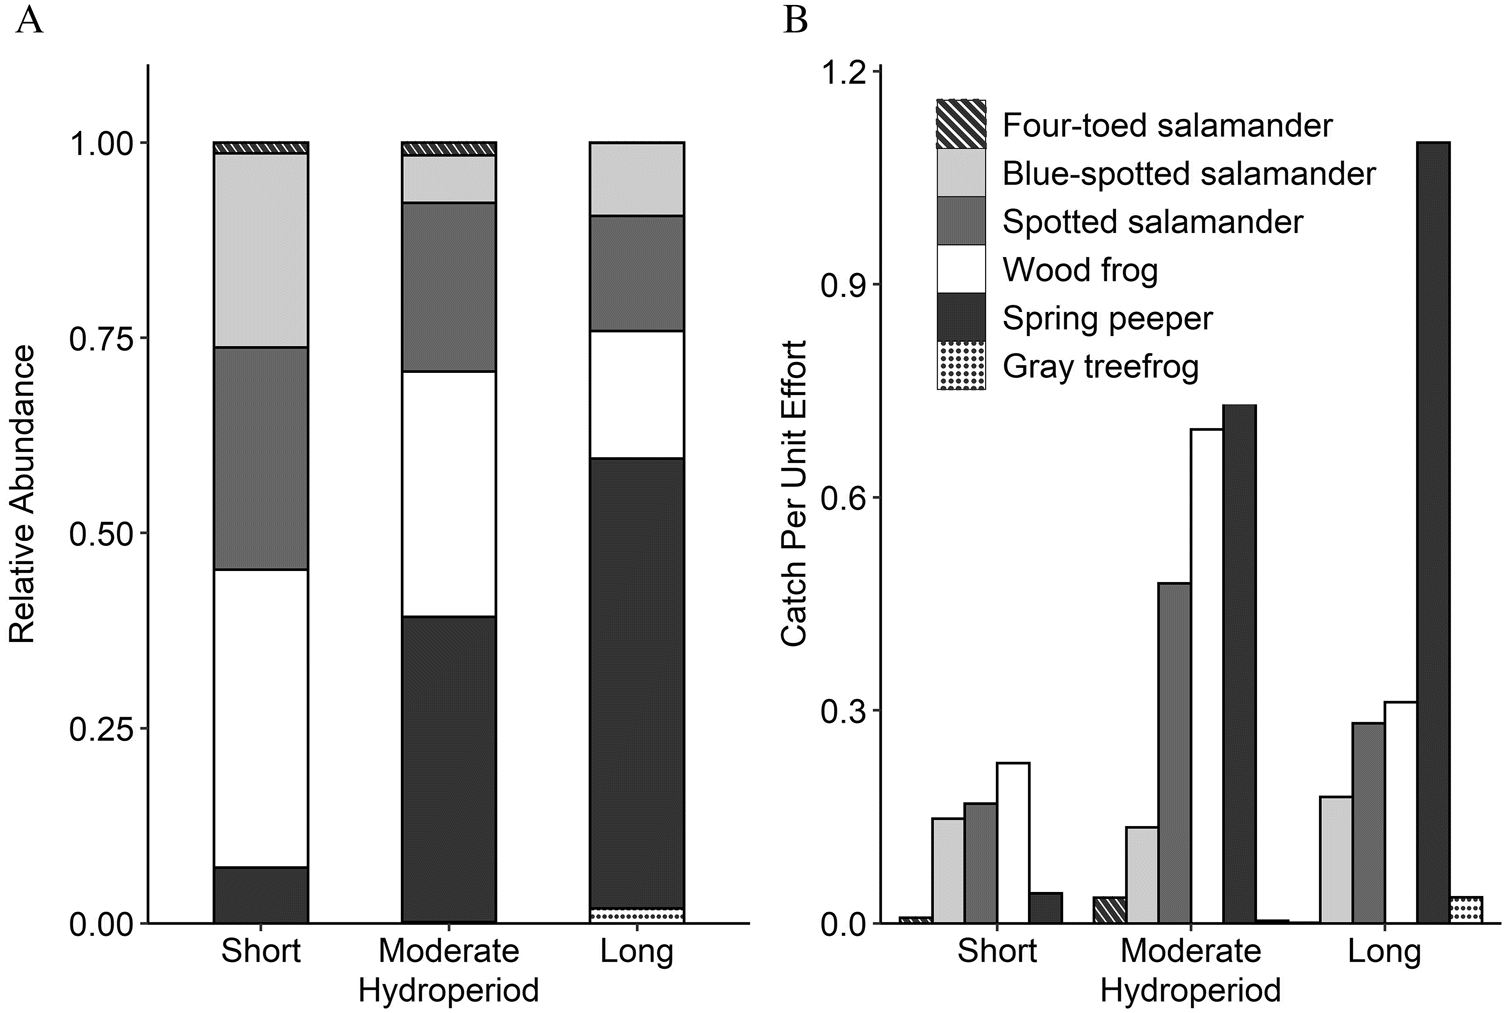
Results of the between-sites PERMANOVAs indicated that larvae community structure changed across hydroperiod classes (pseudo F = 2.27, P = 0.01; Fig. 3) and across the gradient of canopy openness (pseudo F = 2.25, P = 0.04); however, neither variable had significant independent effects on community structure in the marginal-effects model (hydroperiod: pseudo F = 1.59, P = 0.09; canopy openness: pseudo F = 1.00, P = 0.4). Pairwise comparisons of hydroperiod classes revealed community structures in pools with short hydroperiods were dissimilar from those in pools with long hydroperiods (pseudo F = 3.79, P = 0.003) and somewhat dissimilar from those in pools with moderate hydroperiods (pseudo F = 2.06, P = 0.05). Community structures in pools with moderate hydroperiods were not significantly different from those in pools with long hydroperiods (pseudo F = 0.51, P = 0.8). Spring peepers contributed the most to average dissimilarity (SIMPER) between pools with short hydroperiods and pools with moderate and long hydroperiods (32% and 50%, respectively), followed by wood frogs (25% and 22%, respectively) and spotted salamanders (20% and 14%, respectively). The remaining species contributed <20% to average dissimilarity between hydroperiod classes. The proportion of spring peepers in total larvae captured increased with hydroperiod (Fig. 4A); spring peepers had a low average CPUE in pools with short hydroperiods, whereas spring peepers in pools with moderate and long hydroperiods had the highest average CPUE (Fig. 4B). Average percent canopy openness also increased across hydroperiod classes and was twice as large in pools with long hydroperiods compared with those with short hydroperiods. The other three common species (spotted salamanders, blue-spotted salamanders, and wood frogs) did not appear to differ as strongly among hydroperiod classes, though wood frogs and spotted salamanders appeared to have a somewhat higher average CPUE in pools with moderate hydroperiods.
Fig. 4.
Species-specific relationships with habitat variables
GLMMs were used to test the effect of habitat variables on the relative abundances of spotted salamanders, blue-spotted salamanders, wood frogs, and spring peepers. Gray treefrogs and four-toed salamanders were excluded because they were found in less than 30% of the study pools. Variables in models with strong support (ΔAICc < 2) were considered potential drivers of species abundances (Table 2). Models without any habitat variables were strongly supported for two species (blue-spotted salamanders and wood frogs), but the best supported model for all species included some combination of habitat variables. The combinations of habitat variables in models with strong support did not overlap appreciably between species (Fig. 5). Since parameter estimates for the most influential variables were mostly conserved across models, we did not perform model averaging. The exceptions to this were canopy openness and hydroperiod, where parameter estimates were slightly weaker in models including both variables. Parameter estimates for canopy openness and herbaceous vegetation cover were also substantially different in models including both variables, but these models were relatively weak for all four species and not included in the final model set.
Table 2.
| Model | K | AICc | ΔAICc | W | R2 |
|---|---|---|---|---|---|
| Blue-spotted salamander (Ambystoma laterale) | |||||
| Herbaceous vegetation cover + year + Julian day | 8 | 412.6 | 0 | 0.39 | 0.14 |
| Year + Julian day | 7 | 413.6 | 1.0 | 0.23 | 0.08 |
| Canopy openness + year + Julian day | 8 | 413.7 | 1.1 | 0.22 | 0.12 |
| Herbaceous vegetation cover + thicket cover + year + Julian day | 9 | 414.4 | 1.8 | 0.16 | 0.15 |
| Spotted salamander (Ambystoma maculatum) | |||||
| Thicket cover + year + Julian day | 8 | 548.1 | 0 | 0.70 | 0.26 |
| Herbaceous vegetation cover + thicket cover + year + Julian day | 9 | 549.7 | 1.7 | 0.30 | 0.26 |
| Wood frog ((Lithobates sylvaticus) | |||||
| Thicket cover + year + Julian day | 8 | 334.9 | 0 | 0.35 | 0.12 |
| Herbaceous vegetation cover + thicket cover + road density + year + Julian day | 10 | 336.1 | 1.2 | 0.19 | 0.15 |
| Year + Julian day | 7 | 336.2 | 1.4 | 0.17 | 0.05 |
| Area + year + Julian day | 8 | 336.5 | 1.6 | 0.15 | 0.08 |
| Herbaceous vegetation cover + thicket cover + year + Julian day | 9 | 336.9 | 1.9 | 0.13 | 0.13 |
| Spring peeper (Pseudocris crucifer) | |||||
| Canopy openness + year + Julian day | 8 | 491.4 | 0 | 0.53 | 0.33 |
| Hydroperiod + vegetation cover + year + Julian day | 10 | 491.6 | 0.2 | 0.47 | 0.41 |
Note
Second order Akaike’s Information Criteria values (AICc) and marginal R2 statistics are shown for the top models for each species and for models with small differences in AICc (ΔAICc < 2). K = number of estimated parameters; W = model weight.
Fig. 5.
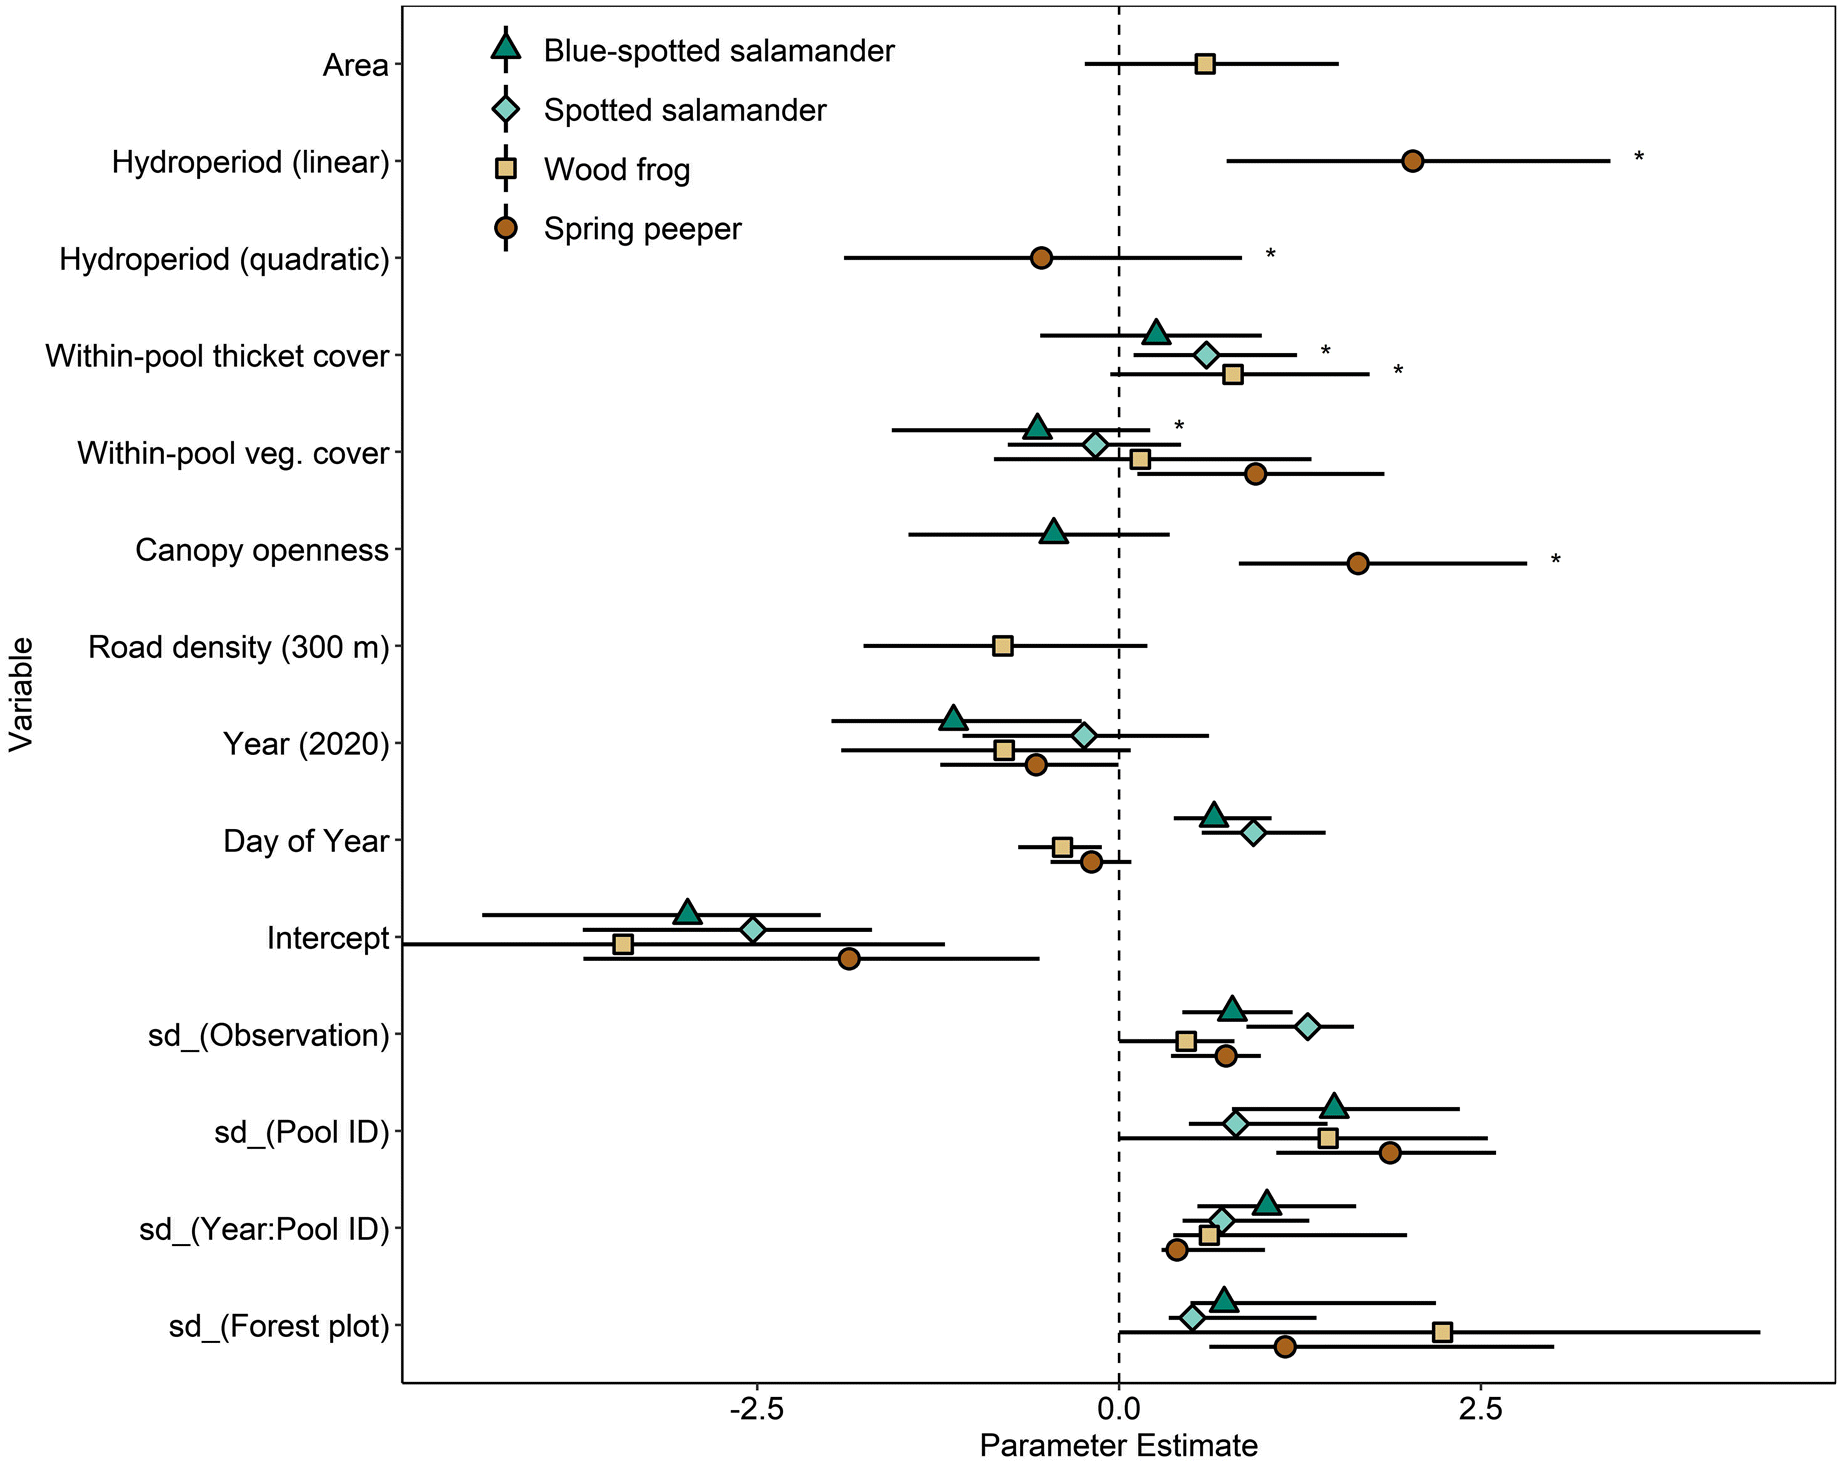
Herbaceous vegetation cover, thicket cover, and canopy openness were the only habitat variables that were important for more than one species. Higher vegetation cover and canopy openness were strongly and positively correlated with the CPUE of spring peepers and weakly and negatively correlated with CPUE of blue-spotted salamanders. Herbaceous vegetation was also weakly correlated with CPUE of wood frogs and spotted salamanders; however, these relationships appear to be tied to the strong effects of other variables included in the same models. Accounting for the effect of hydroperiod length, CPUE of spring peepers in pools with the most open canopies was estimated to be 50 times greater than in pools that were almost completely shaded by canopy. Similarly, spring peeper CPUE was estimated to be 20 times greater in pools with near-complete cover of herbaceous vegetation compared to pools with no herbaceous vegetation. The presence of thicket cover in pools was strongly associated with CPUE of spotted salamanders and wood frogs and weakly associated with CPUE of blue-spotted salamanders. The CPUE of wood frogs and spotted salamanders was 6 and 4 times greater, respectively, in pools with thicket cover compared with pools with no thicket cover.
Models including hydroperiod were only strongly supported for spring peepers and had a positive effect on spring peeper CPUE. Accounting for the effect of canopy openness, the CPUE of spring peepers was estimated to be five times higher in pools with moderate hydroperiods compared with pools with short hydroperiods and twice as large in pools with long hydroperiods compared with pools with moderate hydroperiods.
Wood frogs were the only species with strongly supported models that included pool size and road density. Increases in pool size were associated with increases in the CPUE of wood frogs, though the effect did not appear to be very strong. Road density within a 300-m diameter buffer appeared to have a negative effect on CPUE of wood frogs in our study; CPUE of wood frogs was 16 times lower in pools that had high road density (2.7 km/km2) compared with pools without any roads in the 300-m buffer.
All species had lower CPUE in 2020 compared to 2019, though this effect was weak for spotted salamanders (Fig. 5). We used Spearman’s rank correlation coefficients to investigate whether the rank order of CPUE in pools was conserved across years. CPUE exhibited a strong and positive correlation across years for spring peepers (ρ = 0.82 P < 0.0001) but was only weakly correlated for wood frogs (ρ = 0.35 P = 0.2), spotted salamanders (ρ = 0.30 P = 0.2), and blue-spotted salamanders (ρ = 0.26 P = 0.3).
Discussion
The four most common amphibian species identified in this study (Ambystoma maculatum, A. laterale, Lithobates sylvaticus, Pseudocris crucifer) were either absent or detected less frequently compared with other amphibians in previous studies in Ontario (Hecnar and M’Closkey 1998; Gagné and Fahrig 2007; Loder et al. 2019). For the most part, these studies investigated a wider range of wetland types, including permanent forested wetlands and wetlands in urban and agricultural settings. Species associated with permanent wetlands (e.g., Lithobates septentrionalis, L. catesbeianus, L. clamitans; Semlitsch et al. 2015) and those associated with open-canopy and anthropogenically disturbed wetlands (e.g., Anaxyrus americanus; Werner et al. 2007) were either absent or uncommon in our study pools. The species identified in our study generally aligned with species assemblages from previous studies that were found in temporary to semi-permanent forested wetlands with moderate to high canopy cover (Werner and Glennemeier 1999; Werner et al. 2007, Semlitsch et al. 2015).
The influence of hydroperiod on amphibians in our study was relatively minor, contrasting the large body of literature documenting the strong influence of hydroperiod on numerous aspects of pond-breeding amphibian communities (Snodgrass et al. 2000; Babbitt et al. 2003 Werner et al. 2007). Though we identified a significant effect of hydroperiod length on community composition, the strong positive relationship between hydroperiod length and spring peeper abundance appeared to be the primary driver. We only found the rarely encountered gray treefrog (Hyla versicolor) in pools with moderate or long hydroperiods, and this suggests that we may have found a similar positive relationship between hydroperiod length and abundance for this species if we had sampled more sites and for a longer duration. The apparent lack of an effect of hydroperiod on the other amphibian species may also be explained by our limited range in hydroperiod length. We focussed our study on forested vernal pools and did not sample any wetlands that were permanently inundated such as beaver ponds, thicket swamps, and marshes. At the other end of the spectrum, we lost seven of our pools with the shortest hydroperiods because pools dried before larvae hatched from their eggs. By expanding our sampling to include other wetland types and increasing sampling effort on pools that dry up quickly, future investigations may be able to obtain a more pronounced effect of hydroperiod on abundances of the vernal pool obligate amphibian species.
Canopy openness was positively correlated with herbaceous vegetation cover and hydroperiod length in our study and may have contributed to differences in amphibian community composition across hydroperiod classes. Spring peepers, in particular, had the highest larval abundance in open canopy pools with high herbaceous vegetation cover. By comparison, we found no evidence to suggest a strong effect of canopy openness or herbaceous cover on the abundance of wood frogs, spotted salamanders, or blue-spotted salamanders. The discrepancy between species responses to canopy openness is thought to be primarily linked to differences in resource requirements (Earl et al. 2011). Caudate larvae are carnivores and are considered canopy generalists because prey species are available across a gradient of canopy cover (Earl et al. 2011). Anurans in this region, however, are primarily herbivores/detritivores that feed on a range of food quality (Schiesari 2006). For instance, filamentous algae and decaying nonwoody plants in open canopy pools are of higher nutritional quality than the decaying leaf litter that covers closed canopy pools (Skelly et al. 2002; Williams et al. 2008). Lower food quality can depress growth and development rates of larvae, which can reduce fitness and increase the risk of mortality from pond drying (Werner and Glennemeier 1999; Skelly et al. 2002). Compared to other anurans, wood frogs are more efficient at metabolizing lower quality detritus and regularly breed in heavily shaded wetlands (Schiesari 2006).
The presence of vegetation may also influence breeding effort by increasing the number of available attachment sites for amphibian eggs. The anuran species and Ambystoma salamanders are known to attach their eggs to a variety of sturdy structures within the pool basin, including floating logs and branches, submerged thicket, and the remnants of herbaceous vegetation from the previous year (Egan and Paton 2004). Anecdotally, we have found the large egg masses of wood frogs and Ambystoma salamanders to be more frequently attached to submerged branches of shrubs compared with herbaceous vegetation, which may explain the positive relationship we observed between the presence of thicket cover and the abundance of wood frogs and Ambystoma salamanders. Unlike the other species encountered in our surveys, four-toed salamanders are known to lay their eggs in mossy clumps at the edges of pools (Chalmers and Loftin 2006). Though they were not included in our species-specific analysis, four-toed salamanders appeared to be associated with sphagnum moss cover and were the only species encountered in the two pools that were completely covered by sphagnum moss.
Changes in canopy openness and vegetation communities can occur as a result of human intervention, as is the case with forest management practices and land-use changes, or from disturbance events such as forest fires. While clear-cut logging can be harmful to many amphibian species (Quinn 2004), selective logging practices that maintain mature forests have been found to generally provide favourable conditions for amphibians in central Ontario (Enright 1998). Natural fire disturbances can be important for maintaining breeding habitat for some species (Skelly et al. 1999; Gorman et al. 2013); however, increases in the frequency and severity of fires from climate change may lead to more severe consequences, especially for species that depend on upland forest habitat for most of the year (Blaustein et al. 2010).
Prolonged periods of drought and more frequent disease outbreaks are also expected to affect forest health (Sturrock et al. 2011), which may further reduce the prevalence of closed canopy habitats. More research is needed to determine the effect of widespread canopy changes on the performance of amphibians in this region. Although changes in canopy openness in our study were modest, we saw obvious shifts in vegetation communities and dominant amphibian species. More pronounced canopy gradients have been associated with larger shifts in amphibian communities and can lead to drastically different ecosystems (Werner et al. 2007). Regardless of the resiliency of pond-breeding amphibians to widespread canopy changes, closed canopy wetlands represent unique ecosystems and efforts should be made to ensure sufficient land is protected to allow patches of these wetlands to persist in the event of forest loss.
Forests in our study region have had relatively minor changes in surrounding land use. Roads accounted for the highest percentage of urban land use and the only buildings within a kilometer radius of each forest plot were cottages or marinas. Despite low levels of anthropogenic stress, we found evidence to suggest that road density had negative effects on the abundance of wood frogs. These results are consistent with those in more impacted regions (Findlay et al. 2001; Veysey et al. 2011) and suggest wood frogs may be particularly sensitive to land-use changes that disrupt seasonal migration and dispersal. Impacts of land-use changes have also been found to extend to other species of pond-breeding amphibians in more anthropogenically impacted regions (Houlahan and Findlay 2003; Veysey et al. 2011). Many pond-breeding amphibians are hypothesized to be governed by metapopulation dynamics on large spatial scales and may rely on landscape connectivity between wetlands for gene flow and population rescue (Marsh and Trenham 2001; Semlitsch 2008). Future development plans for the Georgian Bay region may necessitate the inclusion of the protection of landscape connectivity to surrounding wetlands in management plans.
Despite the narrow range of hydroperiod lengths encountered in this study, our results suggested that wetland hydroperiod had an effect on the structure of vernal pool amphibian communities. The relationship between hydroperiod and amphibian community composition is especially important to consider in the face of global climate change. In northeastern North America, climate change is projected to lead to increased temperatures along with more frequent and longer periods of drought (Bush and Lemmen 2019). Although there is evidence that shifts in the timing of spring melt may promote earlier migration to breeding pools (Blaustein et al. 2001; Todd et al. 2011; Green 2017), the average length of hydroperiods is predicted to decrease and low recruitment years for amphibians are expected to occur more frequently (Brooks 2009; Blaustein et al. 2010).
How amphibian populations will respond to these changes remains unclear. The pools with the shortest hydroperiods will likely become unreliable for most amphibians, whereas wetlands that previously held fish populations may dry more frequently and become suitable for a greater range of amphibians. On the landscape level, reductions in wetland density could limit dispersal across the landscape, leading to reduced genetic diversity and slower rates of recolonization following local extinctions (Willson and Hopkins 2013; Coster et al. 2015). Within breeding pools, differences in species-specific phenological responses to earlier warming could alter predator–prey dynamics and lead to competitive advantages for species that have high adaptive capacity (Todd et al. 2009; Blaustein et al. 2010; Walls et al. 2013). The adaptive capacity of individual amphibian species may depend on their ability to colonize wetlands that become suitable due to climate-induced changes in hydroperiod or canopy openness. Conservation should prioritize the preservation of diverse assemblages of wetlands at the landscape scale.
While we did find associations between amphibians and habitat characteristics, it is clear that vernal pools and their communities are dynamic, and short-term studies will undoubtedly miss information. Hydroperiod length in this study is only useful as a relative measure, as annual weather conditions will ultimately affect the duration that pools are available in any given year (Brooks 2009). Longer-term studies could examine the effect of year-to-year fluctuations in hydroperiods on changes in the composition of species assemblages. Given the short nature of this study, we acknowledge the possibility that we did not obtain a complete list of species that use these vernal pools on a long-term basis. In addition, the relative performance of species in one year can have trickle-down effects in subsequent years; population booms and busts for short-lived species like wood frogs or spring peepers have the potential to affect breeding effort in subsequent years (Berven 1990; Werner et al. 2009).
Vernal pools in south-central Ontario are diverse in appearance and vary with respect to their suitability as breeding habitat for amphibian species. Vernal pools and forested wetlands in general are responsible for a considerable amount of energy and biomass that is then transferred to terrestrial habitats (Leibowitz 2003). Conservation of forested wetlands is necessary for the maintenance of the important ecological services provided by forests (Nyman 2011) and healthy forests, in turn, are important for the amphibians that spend a majority of their lives in forested environments (Skidds et al. 2007; Todd et al. 2009). Large remote forests like those in central Ontario support numerous forested wetlands and are thought to provide indispensable environmental values (Watson et al. 2018). Across Ontario, there is increased recognition of the importance of intact forest and wetland ecosystems, especially for building adaptive capacity to climate change and improving the ecological functions of watersheds (Environmental Commissioner of Ontario 2018). Sustainable management of these forests appears to be compatible with healthy amphibian communities and is attractive from an economic perspective due to the large number of cottagers, tourists, and campers that visit these forests every year (Davidson 2015).
This study represents one of the first to explore the diversity of pond-breeding amphibian communities in south-central Ontario. There is an urgent need to understand the hydrology and physical characteristics of amphibian breeding habitats, especially in the face of global climate change. A shift in timing of rain events or onset of hot weather could severely reduce the reproductive success of species with constrained breeding periods, such as wood frogs or Ambystoma salamanders (Brooks 2009; Blaustein et al. 2010). In areas where land-use changes already alter hydrological conditions, including changes in the rate and direction of overland flow, the effect of climate change on the flashiness of precipitation events is of even more concern (Semlitsch and Skelly 2008). In addition, climate change may also affect forest health in this region, as well as increase the frequency of forest fires and disease (Gillett et al. 2004; Bush and Lemmen 2019). Since the abundance of vernal pool obligate amphibians (wood frogs, spotted salamanders, blue-spotted salamanders) appeared to be influenced by changes in the composition of vegetation communities in this study, any change in forest health/canopy may also affect the assemblages of these species. Unfortunately, most climate investigations have focused on regions where the effect of climate change is difficult to separate from other amphibian stressors (Li et al. 2013). Small-scale ecosystems in large remote forests, such as forested wetlands, have not been explored as extensively as those in more urban settings, but may provide opportunities to study the effects of climate change in the absence of other major stressors. There is clearly a need for more research focused on forested ecosystems in these regions that support high diversity of wetland types and wetland-dependent biota.
Acknowledgements
We would like to thank all individuals involved in field surveys for this study, including Jonah Lehman, Jordan DeBoer, Reta Meng, Patrick Connors, and Cameron Brown. We would like to thank Jean DeMarco for hosting field crews at her cottage during our surveys. Funding for this project was provided by the Natural Sciences and Engineering Research Council of Canada in the form of a Discovery Grant to PC-F and a PGS-D to NL, and the Boreal Water Futures project, a project of the Global Water Futures Program funded by the Canada First Research Excellence Fund.
References
Altig R, McDiarmid RW, and Bauer AM. 2017. Handbook of Larval Amphibians of the United States and Canada, Handbook of Larval Amphibians of the United States and Canada. Cornell University Press, Ithaca, NY. 345 p.
Babbitt KJ, Baber MJ, and Tarr TL. 2003. Patterns of larval amphibian distribution along a wetland hydroperiod gradient. Canadian Journal of Zoology, 81(9): 1539–1552.
Baber MJ, Fleishman E, Babbitt KJ, and Tarr TL. 2004. The relationship between wetland hydroperiod and nestedness patterns in assemblages of larval amphibians and predatory macroinvertebrates. Oikos, 107(1): 16–27.
Baldwin RF, Calhoun AJK, and DeMaynadier PG. 2006. The significance of hydroperiod and stand maturity for pool-breeding amphibians in forested landscapes. Canadian Journal of Zoology, 84(11): 1604–1615.
Baldwin RF, and DeMaynadier PG 2009. Assessing threats to pool-breeding amphibian habitat in an urbanizing landscape. Biological Conservation, 142(8): 1628–1638.
Bartoń K. 2020. MuMIn: multi-model inference. R package version 1.43.17. [online]: Available from cran.r-project.org/web/packages/MuMIn/index.html.
Berven KA. 1990. Factors affecting population fluctuations in larval and adult stages of the wood frog (Rana sylvatica). Ecology, 71(4): 1599–1608.
Blaustein AR, Belden LK, Olson DH, Green DM, Root TL, and Kiesecker JM. 2001. Amphibian breeding and climate change. Conservation Biology, 15(6): 1804–1809.
Blaustein AR, Walls SC, Bancroft BA, Lawler JJ, Searle CL, and Gervasi SS. 2010. Direct and indirect effects of climate change on amphibian populations. Diversity, 2(2): 281–313.
Brooks RT. 2009. Potential impacts of global climate change on the hydrology and ecology of ephemeral freshwater systems of the forests of the northeastern United States. Climate Change, 95: 469–483.
Burnham KP, and Anderson DR. 2002. Model selection and multi-model inference: A Practical Information-Theoretic Approach. Springer. New York, NY. 488 p.
Bush E, and Lemmen DS. 2019. Canada’s changing climate report. Government of Canada, Ottawa, ON. 442 p.
Chalmers RJ, and Loftin CS. 2006. Wetland and microhabitat use by nesting four-toed salamanders in Maine. Journal of Herpetology, 40(4): 478–485.
Clarke KR. 1993. Non-parametric multivariate analyses of changes in community structure. Australian Journal of Ecology, 18(1): 117–143.
Corn PS. 2005. Climate change and amphibians. Animal Biodiversity and Conservation, 28(1): 59–67.
Coster SS, Babbitt KJ, Cooper A, and Kovach AI. 2015. Limited influence of local and landscape factors on finescale gene flow in two pond-breeding amphibians. Molecular Ecology, 24(4): 742–758.
Crins WJ, Gray PA, Uhlig PWC, and Wester MC. 2009. The ecosystems of Ontario, Part 1: Ecozones and ecoregions. Ontario Ministry of Natural Resources, Sault Ste. Marie. 76 p.
Davidson B. 2015. French-severn forest, Ontario, Canada. In Forest plans of North America. Edited by J Piry, P Bettinger, K Merry, D Grebner, K Boston, and C Cieszewski. Elsevier Inc., Cambridge, MA. pp. 367–376.
Davison AC, and Hinkley DV. 1997. Bootstrap methods and their application. Cambridge University Press, Cambridge, MA. 582 p.
Dorie V, Bates D, Maechler M, Bolker B, and Walker S. 2020. blme: Bayesian linear mixed-effects models. R package version 1.0-5 [online]: Available from cran.r-project.org/web/packages/blme/index.html.
Earl JE, Luhring TM, Williams BK, and Semlitsch RD. 2011. Biomass export of salamanders and anurans from ponds is affected differentially by changes in canopy cover. Freshwater Biology, 56(12): 2473–2482.
Egan RS, and Paton PWC. 2004. Within-pond parameters affecting oviposition by wood frogs and spotted salamanders. Wetlands, 24(1): 1–13.
Enright L. 1998. Effects of selection logging on amphibian diversity and abundance in shade-tolerant hardwood forests of Algonquin Provincial Park, Ontario. University of Guelph [online]: Available from atrium.lib.uoguelph.ca/xmlui/handle/10214/21055
Environmental Commissioner of Ontario. 2018. Back to basics: respecting the public’s voice on the environment. Environmental Protection Report [online]: Available from auditor.on.ca/en/content/reporttopics/envreports/env18/Back-to-Basics.pdf
Ficetola GF, and Maiorano L. 2016. Contrasting effects of temperature and precipitation change on amphibian phenology, abundance and performance. Oecologia, 181(3): 683–693.
Findlay CS, and Houlahan JE. 1997. Anthropogenic correlates of species richness in southeastern Ontario wetlands. Conservation Biology, 11(4): 1000–1009.
Findlay CS, Lenton J, and Zheng L. 2001. Land-use correlates of anuran community richness and composition in Southeastern Ontario wetlands. Ecoscience, 8(3): 336–343.
Gagné S, and Fahrig L. 2007. Effect of landscape context on anuran communities in breeding ponds in the National Capital Region, Canada. Landscape Ecology, 22(2): 205–215.
Gillett NP, Weaver AJ, Zwiers FW, and Flannigan MD. 2004. Detecting the effect of climate change on Canadian forest fires. Geophysical Research Letters, 31(18): 4.
Gorman TA, Haas CA, and Himes JG. 2013. Evaluating methods to restore amphibian habitat in fire-suppressed pine Flatwoods wetlands. Fire Ecology, 9(1): 96–109.
Green DM. 2017. Amphibian breeding phenology trends under climate change: predicting the past to forecast the future. Global Change Biology, 23(2): 646–656.
Gunzburger M. 2007. Evaluation of seven aquatic sampling methods for amphibians and other aquatic fauna. Applied Herpetology, 4(1): 47–63.
Harrison XA. 2014. Using observation-level random effects to model overdispersion in count data in ecology and evolution. PeerJ, 19.
Hamer AJ, and McDonnell MJ. 2008. Amphibian ecology and conservation in the urbanising world: A review. Biological Conservation, 141(10): 2432–2449.
Hecnar SJ, and M’Closkey RT. 1997. The effects of predatory fish on amphibian species richness and distribution. Biological Conservation, 79(2–3): 123–131.
Hecnar SJ, and M’Closkey RT. 1998. Species richness patterns of amphibians in southwestern Ontario ponds. Journal of Biogeography, 25(4): 763–772.
Heyer WR, Donnelly MA, McDiarmid RW, Hayek LC, and Foster MS. 1994. Supplemental Approaches to Studying Amphibian Biodiversity. In Measuring and Monitoring Biological Diversity: Standard Methods for Amphibians. Edited by WR Heyer. Smithsonian Institution Press. Central Washington, D.C. pp. 143–182.
Houlahan JE, and Findlay CS. 2003. The effects of adjacent land use on wetland amphibian species richness and community composition. Canadian Journal of Fisheries and Aquatic Sciences, 60(9): 1078–1094.
Leibowitz SG. 2003. Isolated wetlands and their functions: an ecological perspective. Wetlands, 23(3): 517–531.
Li Y, Cohen JM, and Rohr JR. 2013. Review and synthesis of the effects of climate change on amphibians. Integrative Zoology, 8(2): 145–161.
Loder AL, Weeber R, Wong SNP, Spooner IS, and Mallory ML. 2019. Correlates of waterbody characteristics and the occurrence or diversity of larval amphibians in central Ontario, Canada. Bulletin of Environmental Contamination and Toxicology, 103(4): 571–578.
Luymes N, and Chow-Fraser P. 2021. Detection of potential vernal pools on the Canadian shield (Ontario) using object-based image analysis in combination with machine learning. Canadian Journal of Remote Sensing, 47(4): 519–534.
Mahaney W, and Klemens M. 2008. Vernal pool conservation policy: the federal, state, and local context. In Science and conservation of vernal pools in Northeastern North America. Edited by AJK Calhoun and PG DeMaynadier. CRC Press, Boca Raton. pp. 193–212.
Marsh DM, and Trenham PC. 2001. Metapopulation dynamics and amphibian conservation. Conservation Biology, 15(1): 40–49.
Mills P. 2016. Metamorphosis. Library and Archives Canada Cataloguing in Publication. Ontario, Canada. 103 p.
Nyman JA. 2011. Ecological Functions of Wetlands. In Wetlands. Edited by B LePage. Springer. Dordrecht. pp. 115–128.
Oksanen J, Blanchet FG, Legendre P, Minchin PR, O’Hara RB, Simpson GL, et al. 2020. vegan: Community Ecology Package. R package version 2.5-7 [online]: Available from cran.r-project.org/web/packages/vegan/index.html.
Ontario Ministry of Natural Resources and Forestry. 2010. Ontario hydro network (OHN) – Waterbody [online]: Available from geohub.lio.gov.on.ca/datasets/mnrf::ontario-hydro-network-ohn-waterbody/explore?location=49.261208%2C-84.732487%2C4.95.
Ontario Ministry of Natural Resources and Forestry. 2016. Ontario and cover compilation v.2.0 [online]: Available from geohub.lio.gov.on.ca/documents/7aa998fdf100434da27a41f1c637382c/about.
Quinn NWS. 2004. The presettlement hardwood forests and wildlife of Algonquin Provincial Park: a synthesis of historic evidence and recent research. Forestry Chronicle, 80(6): 705–717.
R Core Team. 2020. R: a language and environment for statistical computing. R Foundation for Statistical Computing, Vienna, Austria [online.]: Available from r-project.org/.
Rollins-Smith LA. 2017. Amphibian immunity–stress, disease, and climate change. Developmental and Comparative Immunology, 66: 111–119.
Schiesari L. 2006. Pond canopy cover: a resource gradient for anuran larvae. Freshwater Biology, 51(3): 412–423.
Semlitsch RD. 2008. Differentiating migration and dispersal processes for pond-breeding amphibians. Journal of Wildlife Management, 72(1): 260–267.
Semlitsch RD, and Skelly DK. 2008. Ecology and conservation of pool-breeding amphibians. In Science and conservation of vernal pools in Northeastern North America. Edited by AJK Calhoun and PG DeMaynadier. CRC Press, Boca Raton. pp. 127–148.
Semlitsch RD, Peterman WE, Anderson TL, Drake DL, and Ousterhout BH. 2015. Intermediate pond sizes contain the highest density, richness, and diversity of pond-breeding amphibians. PLoS One, 10(4): e0123055.
Skelly DK, Werner EE, and Cortwright SA. 1999. Long-term distributional dynamics of a Michigan amphibian assemblage. Ecology, 80(7): 2326–2337.
Skelly DK, Freidenburg LK, and Kiesecker JM. 2002. Forest canopy and the performance of larval amphibians. Ecology, 83(4): 983–992.
Skidds DE, Golet FC, Paton PWC, and Mitchell JC. 2007. Habitat correlates of reproductive effort in wood frogs and spotted salamanders in an urbanizing watershed. Journal of Herpetology, 41: 439–450.
Snodgrass JW, Komoroski MJ, Bryan AL, and Burger J. 2000. Relationships among isolated wetland size, hydroperiod, and amphibian species richness: implications for wetland regulations. Conservation Biology, 14(2): 414–419.
Sturrock RN, Frankel SJ, Brown AV, Hennon PE, Kliejunas JT, Lewis KJ, et al. 2011. Climate change and forest diseases. Plant Pathology, 60(1): 133–149.
Symonds MRE, and Moussalli A. 2011. A brief guide to model selection, multimodel inference and model averaging in behavioural ecology using Akaike’s information criterion. Behavioral Ecology and Sociobiology, 65(1): 13–21.
Todd BD, Luhring TM, Rothermel BB, and Gibbons JW. 2009. Effects of forest removal on amphibian migrations: implications for habitat and landscape connectivity. Journal of Applied Ecology, 46(3): 554–561.
Todd BD, Scott DE, Pechmann JHK, and Gibbons JW. 2011. Climate change correlates with rapid delays and advancements in reproductive timing in an amphibian community. Proceedings of the Royal Society B: Biological Sciences, 278: 2191–2197.
Vasconcelos D, and Calhoun AJK. 2004. Movement patterns of adult and juvenile Rana sylvatica (LeConte) and Ambystoma maculatum (Shaw) in three restored seasonal pools in Maine. Journal of Herpetology, 38(4): 551–561.
Veysey JS, Mattfeldt SD, and Babbitt KJ. 2011. Comparative influence of isolation, landscape, and wetland characteristics on egg-mass abundance of two pool-breeding amphibian species. Landscape Ecology, 26(5): 661–672.
Walls SC, Barichivich WJ, and Brown ME. 2013. Drought, deluge and declines: the impact of precipitation extremes on amphibians in a changing climate. Biology, 2(1): 399–418.
Warton DI, Wright ST, and Wang Y. 2012. Distance-based multivariate analyses confound location and dispersion effects. Methods in Ecology and Evolution, 3(1): 89–101.
Watson JEM, Evans T, Venter O, Williams B, Tulloch A, Stewart C, et al. 2018. The exceptional value of intact forest ecosystems. Nature Ecology and Evolution, 2(4): 599–610.
Werner EE, and Glennemeier KS. 1999. Influence of forest canopy cover on the breeding pond distributions of several amphibian species. Copeia, 1999(1): 1–12.
Werner EE, Skelly DK, Relyea RA, and Yurewicz KL. 2007. Amphibian species richness across environmental gradients. Oikos, 116(10): 1697–1712.
Williams BK, Rittenhouse TAG, and Semlitsch RD, 2008. Leaf litter input mediates tadpole performance across forest canopy treatments. Oecologia, 155(2): 377–384.
Werner EE, Relyea RA, Yurewicz KL, Skelly DK, and Davis CJ. 2009. Comparative landscape dynamics of two anuran species: Climate-driven interaction of local and regional processes. Ecological Monographs, 79(3): 503–521.
Willson JD, and Hopkins WA. 2013. Evaluating the effects of Anthropogenic stressors on source-sink dynamics in pond-breeding amphibians. Conservation Biology, 27(3): 595–604.
Woodward BD. 1982. Local intraspecific variation in clutch parameters in the spotted salamander (Ambystoma maculatum). Copeia, 1982(1): 157–160.
Information & Authors
Information
Published In

FACETS
Volume 7 • Number 1 • January 2022
Pages: 215 - 235
Editor: Mark Mallory
History
Received: 8 July 2021
Accepted: 5 November 2021
Version of record online: 17 February 2022
Copyright
© 2022 Luymes and Chow-Fraser. This work is licensed under a Creative Commons Attribution 4.0 International License (CC BY 4.0), which permits unrestricted use, distribution, and reproduction in any medium, provided the original author(s) and source are credited.
Data Availability Statement
All relevant data are within the paper.
Key Words
Sections
Subjects
Authors
Author Contributions
NL conceived and designed the study.
NL performed the experiments/collected the data.
All analyzed and interpreted the data.
PC-F contributed resources.
All drafted or revised the manuscript.
Competing Interests
The authors declare there are no competing interests.
Metrics & Citations
Metrics
Other Metrics
Citations
Cite As
Nick Luymes and Patricia Chow-Fraser. 2022. Community structure, species–habitat relationships, and conservation of amphibians in forested vernal pools in the Georgian Bay region of Ontario. FACETS.
7(): 215-235. https://doi.org/10.1139/facets-2021-0097
Export Citations
If you have the appropriate software installed, you can download article citation data to the citation manager of your choice. Simply select your manager software from the list below and click Download.
There are no citations for this item