Considering the implications of climate-induced species range shifts in marine protected areas planning
Abstract
Climate change is affecting the ocean, altering the biogeography of marine species. Yet marine protected area (MPA) planning still rarely incorporates projected species range shifts. We used the outputs of species distribution models fitted with biological and climate data as inputs to identify trends in occurrence for marine species in British Columbia (BC), Canada. We assessed and compared two ways of incorporating climate change projections into MPA planning. First, we overlaid 98 species with modelled distributions now and by the mid-21st century under two contrasting (“no mitigation” and “strong mitigation”) climate change scenarios with existing Provincial marine parks in BC, to ask which species could overlap with protected areas in the future. Second, we completed a spatial prioritization analysis using Marxan with the projected future species ranges as inputs, to ask where priority regions exist for the 98 marine species. We found that many BC marine parks will lose species in both climate scenarios that we analyzed, and that protecting 30% of important marine species will be challenging under the “no mitigation” climate change scenario. Challenges included the coarse resolution of the data and uncertainty in projecting species range shifts.
Introduction
Marine ecosystems are at risk from the effects of climate change on marine species physiology, population and species diversity, and ecological interactions (Hoegh-Guldberg and Bruno 2010; Doney et al. 2012). As ectotherms, fish and invertebrate species are especially vulnerable to ocean warming, as their body temperature is largely determined by the surrounding environment (Sunday et al. 2011; Pinsky et al. 2019). Species ranges, an outcome of a species’ potential and realized habitat niche, are driven by environmental conditions and moderated by biological interactions such as competition, predation, and long-term interactions among species (such as mutualism, commensalism, parasitism, and others) (Ackerly et al. 2010). The distribution of many species and populations has already changed as species move in space, such as poleward or to deeper waters (marine species), higher altitudes (terrestrial species), and/or in time as the seasonality of species lifecycles shifts to earlier or later times of the year (Parmesan and Yohe 2003; Tingley and Beissinger 2009; Brown et al. 2015). Marine species range shifts are expected to continue under projected warming and other changes in ocean conditions, with consequences for ecosystems, economies, societies, and management (Cheung et al. 2015; Patrizzi and Dobrovolski 2018).
Climate change impacts on species ranges can change where marine protected areas (MPAs) should be situated (McLeod et al. 2009; Gerber et al. 2014) and can also disrupt connectivity between protected areas by changing dispersal pathways and species physiology (Álvarez‐Romero et al. 2017) and affecting adult movement (Friesen et al. 2021). Well-established conservation planning tools have been applied in response to climate change predictions, such as emphasizing MPA networks, increasing spatial connectivity, habitat heterogeneity, and improving management of the core and edges of reserves (Hannah et al. 2002). Designating new MPAs could augment the existing global network of MPAs and provide potential benefits of connectivity and redundancy for existing species ranges (Hannah 2008; Araújo 2009). However, adding more MPAs today might not provide future benefits to the specific species or habitats they were intended to protect because of climate change.
To date, others have proposed a range of methods to incorporate climate change into conservation planning (see reviews by Magris et al. 2014; Jones et al. 2016). Previous research has aimed to identify thermal refugia, or areas that may warm less rapidly and thus offer some protection from increasing temperatures (Ban et al. 2016; Lima et al. 2016). However, data limitations—especially in terms of understanding how protecting future habitat might increase species adaptive capacity to climate change—make these methods challenging and uncertain (Groves et al. 2012; Magris et al. 2014). Others make a case for “conserving the geophysical stage”, whereby conversation plans are defined by geophysical indicators such as topography as surrogates for biodiversity features (Groves et al. 2012), an appropriate approach for some but not all species. Others still promote incorporating ecological processes into systematic conservation planning, such as river flows, flood patterns, or animal migration patterns (McCook et al. 2009; Groves et al. 2012; D'Aloia et al. 2017). Typically, conservation planning methods and data have remained temporally static based on the current state of biodiversity; with climate change, much more adaptive and proactive adaptation strategies are necessary (Groves et al. 2012). Another technique is to ensure the protection of habitat distributions over time (temporal connectivity), which would allow species to track their climatic niche as habitats change with climate change (Hodgson et al. 2009). Ecological niche theory—the environmental conditions that an organism is dependent upon to survive and reproduce (Wiens et al. 2009)—can be applied to models to describe how species may respond to future environmental change by identifying habitats that are likely to be used in the future. These forecasts are called species distribution models (SDMs) or bioclimatic niche models (e.g., Cheung et al. 2015). These SDMs can then be applied to a spatial decision support tool such as Marxan or zonation to prioritize actions to protect those future habitat needs and species of interest (Magris et al. 2014; e.g., Alagador et al. 2014).
In this paper, we explored two ways that marine conservation planning could incorporate projected changes in species distributions using global climate projections available globally. We used the outputs of an existing dynamic bioclimate envelope model of shifting species distributions (Weatherdon et al. 2016b) to (1) determine where species ranges overlap within MPAs in the Northern Shelf Bioregion (see below) in the present and future (2060) and (2) use them as inputs into spatial prioritization software (Marxan) to identify priorities for MPAs to represent biodiversity now and into the future across the entire coast of BC (within the Canadian Pacific Exclusive Economic Zone (EEZ) and including the transboundary region of southeastern Alaska and Washington States). We also tracked challenges encountered and reflected on the usefulness of the results for MPA network planning.
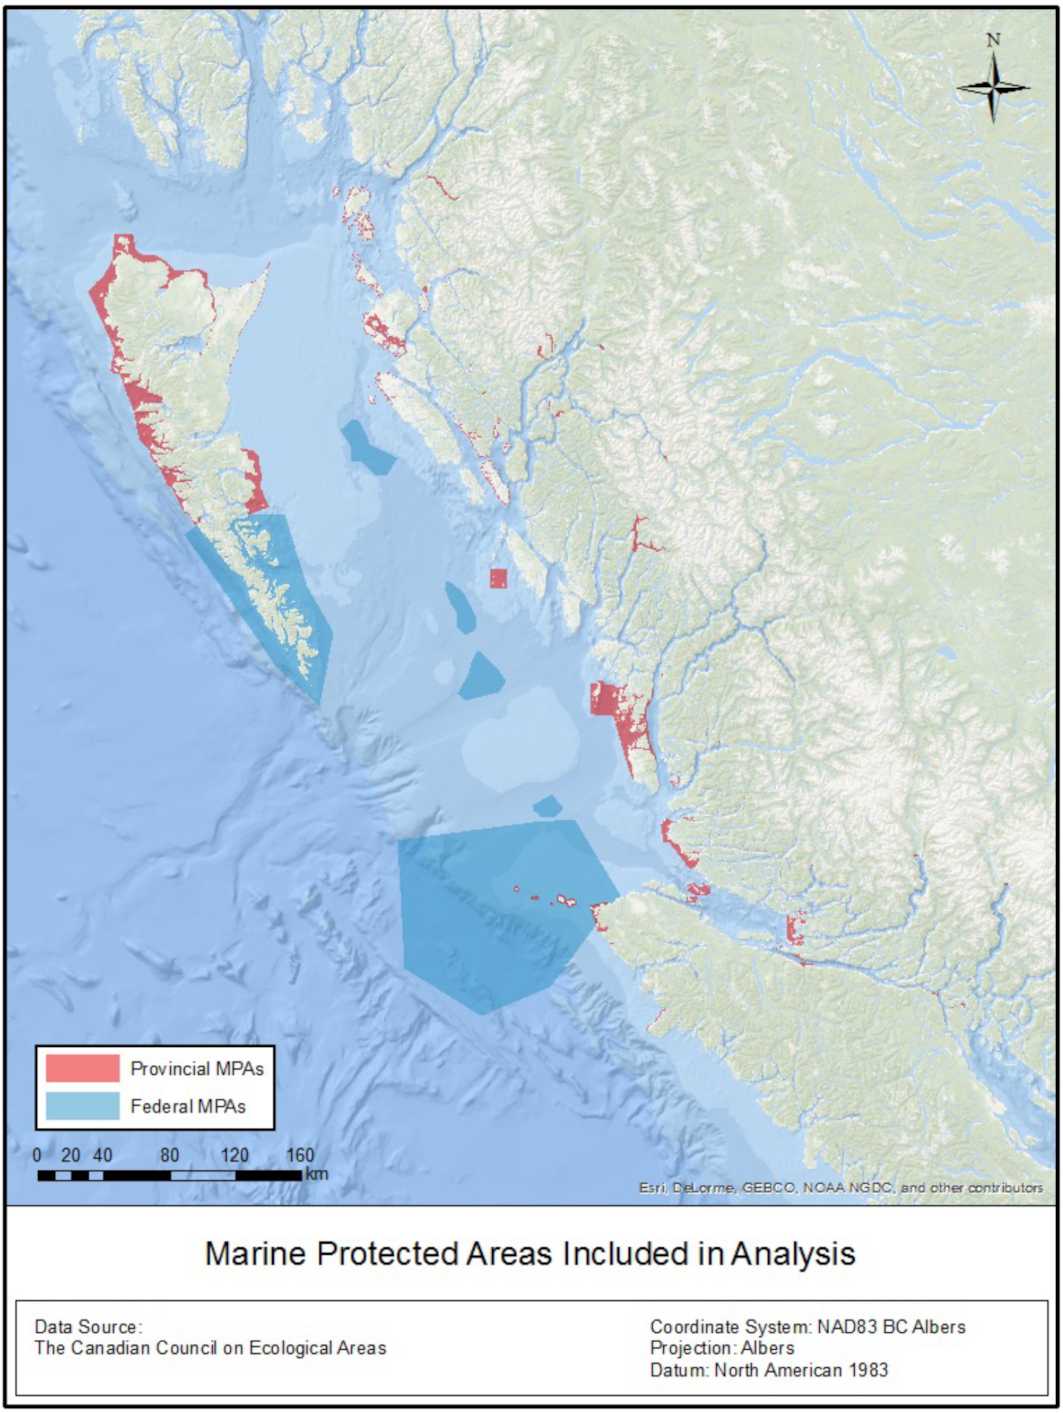
We focused on two scales: (1) the Northern Shelf Bioregion, and (2) all of Canada's Pacific EEZ and northern neighbouring regions in Alaska and northern Washington State. The smaller focal region, the Northern Shelf Bioregion, is relevant because this is the part of Canada's Pacific EEZ where a network of MPAs is currently actively being pursued jointly by Federal, Provincial, and First Nations government representatives (Gale et al. 2019) (Fig. 1). The bioregion, approximately 100,000 square kilometres in size, is one of 13 ecologically defined bioregions in Canada's EEZ (Government of Canada 2011). It is the only bioregion (out of 4) in Pacific Canada that has an active MPA network planning process underway and one that involves multiple governments (McGee et al. 2022; Reid et al. 2022). There are 118 conservancies, ecological reserves, and parks with a marine component that are under the jurisdiction of the Provincial BC government through BC Parks (hereafter referred to as BC MPAs) and 6 Federal MPAs within the bioregion included in this analysis. We focused on Provincial MPAs as part of this project, which was funded by BC Parks. We worked closely with members of the technical team planning the Northern Shelf Bioregion MPA network, including sharing our approaches, results, and associated data. Understanding how well existing MPAs in the region might fare under climate change is important for the development of the planning process, which includes a climate change sub-committee. The broader focus, on Canada's Pacific EEZ and beyond, is important for understanding how future range shifts might affect Canada's ability to protect marine species in its Pacific EEZ.
Fig. 1.
Methods
Application of climate change projections: species presence in current MPAs
We used modelled projections of species range shifts based on an Earth system model (ESM) (Weatherdon et al. 2016b) that models the effects of warming and other changes in ocean conditions to project changing species presence/absence in MPAs under Provincial jurisdiction both now (2016) and in the future (2060). Species distributions were projected using a dynamic bioclimate envelope model (DBEM) (Cheung et al. 2009) that projects the effects of large-scale climate change for 98 species of commercial interest and cultural value to coastal First Nations communities in BC (Weatherdon et al. 2016b), resulting in outputs of projected species distributions. These 98 species are a subset of the 140 priority species that are the focus of MPA network planning in the Northern Shelf Bioregion (Gale et al. 2019). Projections of ocean conditions, including temperature, oxygen, salinity, and net primary production, were from the Geophysical Fluid Dynamic Laboratory ESM-2 M (GFDL ESM2M). The models determine distributions and abundance based on a set of filters that are specific to the species and constrain movement. Abundance is expressed as an index relative to the unexploited level estimated from historical catches and the intrinsic population growth rate. The filters include latitudinal range, range-limiting polygons, depth range, and habitat preferences (Weatherdon et al. 2016a). The spatial resolution of the model and the input data were harmonized at 0.5° latitude × 0.5° longitude (see Cheung et al. 2016 for details). These projections have been calculated under two climate change scenarios: a low emissions “strong mitigation” scenario (Representative Conservation Pathway, RCP 2.6) and a high emissions “no mitigation” RCP 8.5 scenario (IPCC 2014). Previous studies have shown that the model can reproduce spatial patterns of abundance and catch with uncertainties in temporal projections associated with projections driven by outputs from different Earth system models and algorithms to calculate the environmental suitability of the species (Fernandes et al. 2013; Cheung et al. 2016).
Because we aim to explore the extent to which the current MPA planning in the Northern Shelf Bioregion may need to be adjusted under climate change, we focused on the extreme end of the emissions scenario (Raftery et al. 2017) for this part of the analysis. As such, we used only the “no mitigation” RCP 8.5 data for the analysis of future changes to marine species in BC MPAs in 2060. We then calculated the difference in species presence or absence (i.e., when projected relative abundance = 0) and reported the number and specific species whose projected range changes in relation to BC MPAs. We also calculated modelled species presence/absence for current and future conditions within each of the 59 MPAs included in the analysis (see Supplementary Material for details). These MPAs were selected as they were (a) of interest to BC Parks and (b) within the Northern Shelf Bioregion.
Spatial priority areas for future range distributions
To identify priority areas for marine species—areas that, if protected, would meet the targets for species included in the analysis—we used the conservation planning software Marxan (Ball et al. 2009). Marxan produces a “best case” solution for an MPA network by comparing the conservation goals and costs for planning units (cells) across a given area of management, and suggests a network of areas that meet the given conservation objectives at the lowest costs over many iterative configurations (Ardron et al. 2010). Input features can be species distributions, subspecies, habitats, physical features, or anything that the user wishes to use as a target or surrogate target. The number of times that a planning unit is selected, termed the selection frequency, can be interpreted as a measure of its conservation value (Carwardine et al. 2009). Where planning units contain features that need to be included, planning units with lower costs are more likely to be included in the network solution.
Due to the coarse grain size of the available species distribution projections relative to the Canadian EEZ in British Columbia and knowing that species are shifting poleward rapidly with transboundary management consequences, we applied these projections across a large planning area, including the southern coast of Alaska (139°–114°W, 45°–60°N). We used projections of species ranges and relative abundance data at both the low (RCP 2.6) and high (RCP 8.5) emissions scenarios to illustrate the differential implications for marine conservation planning and the likelihood of persistence of present-day species distributions and abundances. Here, we used area as a cost because other costs (future fishing areas, for example) will change and those data were not available. We set a 10× higher cost for planning units that fell outside of the BC EEZ than planning units within the BC EEZ to reflect the goal of protecting species within BC and the likely challenge of transboundary MPAs (Gissi et al. 2018). We ran two sets of scenarios: (1) resistance: we set the species abundance targets for all scenarios at 30% of the baseline-modelled relative abundance within the BC EEZ (at 2016, RCP 2.6) to reflect the intent to maintain species of importance at that abundance within BC; and (2) resilience: we set the species abundance targets to 30% at each time step, allowing the target abundance values to shift with the changing relative abundance projections across the planning unit grid. We used a target of 30% because this is one of the scenarios used in the Northern Shelf Bioregion MPA planning process. We considered the following scenarios for all 98 species included in the dataset:
1.
Baseline case: MPA priorities using modelled species distributions in 2016 (RCP 2.6);
2.
MPA priorities in potential future climates: modelled future distributions in 2030, 2040, 2050, and 2060 at both “strong mitigation” (RCP 2.6) and “no mitigation” (RCP 8.5) scenarios; and
3.
MPA priorities including 2016 and into the future to attempt to maintain protection of species through time (overlaying modelled distributions, including 2016–2030, 2040, and 2050 at RCP 2.6).
Results
Provincial MPA analysis
We examined how shifting species ranges may affect how well BC MPAs are meeting coverage targets for marine species within the next half-century. Model projections showed that marine species generally shift northward along the coast of BC. As species shift northward, some species will “leave” some MPAs while others “enter” (Table 1) (see Supplementary Material for full results). The MPAs that lost the most species were largely at the southern extent of the region in the Broughton Archipelago (e.g., Octopus Islands Marine Park, nine species lost), whereas some MPAs in the Central Coast (e.g., Kilbella Estuary Conservancy) may experience a turnover (sum of species gain and loss) in species with a slight overall gain (n = 1; Table 1). Most MPAs are likely to experience some species turnover as oceans warm and species ranges shift north following their thermal optima.
Table 1.
| Park name | Baseline presence of modelled species of interest within MPA (2016, RCP 2.6) | Species lost by 2060 within MPA (RCP 8.5) | Species gained by 2060 within MPA (RCP 8.5) | Difference |
|---|---|---|---|---|
| Octopus Islands Marine Park | 67 | 26 | 17 | −9 |
| Rock Bay Marine Park | 67 | 26 | 17 | −9 |
| Small Inlet Marine Park | 67 | 26 | 17 | −9 |
| Kilbella Estuary Conservancy | 62 | 22 | 23 | +1 |
| Dzawadi/Klinaklini Estuary Conservancy | 21 | 19 | 19 | 0 |
Ten species “left” BC MPAs most often (3 MPAs), including fish (Starry flounder (Platichthys stellatus), longspine thornyhead (Sebastolobus altivelis), China rockfish (Sebastes nebulosus), longnose skate (Raja rhina)), bivalves (butter clam (Saxidomus giganteus), Olympia oyster (Ostrea lurida), Pacific geoduck (Panopea abrupta), Pacific littleneck clam (Protothaca staminea), and northern horse mussel (Modiolus modiolus)), and invertebrates (red sea cucumber (Parastichopus californicus)). The species that may “enter” BC MPAs most often included Pacific sardine (Sardinops sagax) (10 MPAs), sidestriped shrimp (Pandalopsis dispar) (6 MPAs), and Manila clam (Venerupis philippinarum) (1 MPA).
By 2060, 19 species are unable to meet their targets (RCP 2.6) as their relative abundance within the core spatial planning area is projected to decline; these species included rockfishes (yellowtail, yelloweye, yellowmouth, and copper), lingcod, and bivalves (butter clam and Olympia oyster) (Table 2).
Table 2.
| Species ID | Common name | Occurrences held (PUs) | Target met |
|---|---|---|---|
| 11 | Yellowtail rockfish | 133 | no |
| 12 | Lingcod | 166 | no |
| 26 | Cabezon | 219 | no |
| 34 | Butter clam | 258 | no |
| 37 | Olympia oyster | 172 | no |
| 42 | Red rock crab | 231 | no |
| 45 | Sidestriped shrimp | 17 | no |
| 49 | Pacific gaper | 207 | no |
| 53 | Yelloweye rockfish | 71 | no |
| 56 | Yellowmouth rockfish | 211 | no |
| 60 | Copper rockfish | 174 | no |
| 69 | Rock scallop | 210 | no |
| 73 | Cutthroat trout | 181 | no |
| 77 | Pile perch | 226 | no |
| 78 | Kelp perch | 230 | no |
| 84 | Thornback sculpin | 211 | no |
| 87 | Black chiton | 184 | no |
| 92 | Acorn barnacle | 0 | no |
| 98 | Spiny dogfish | 0 | no |
Note: PU, planning unit.
Spatial prioritization analysis
Under climate change modelling further into the 21st century, more planning units are required for species to meet their target abundance for protection (set at 30% of 2016 relative abundance within the BC EEZ). To reach conservation targets in the mid-21st century and under the high emissions scenario (RCP 8.5), almost the entire coastline of BC and much of SE Alaska and Washington State are required to conserve 30% of the current relative abundance of these marine species in BC (a 3.5× increase in priority planning units by 2050; Table 3). The distribution of priority planning units shifting north tracks the distributional shift of marine priority species (Fig. 2). Between 2040 and 2050, a shift occurs whereby many more planning units (2.8×) may be needed in 2050 than in 2040 (at RCP 8.5). In the high emissions scenario (RCP 8.5), the modelled species ranges shifted outside of the core planning area zone by such a degree that fewer planning units are required within this spatial area, highlighting the challenges of spatial planning over periods of rapid change and the need for international cooperation, as well as adjusting our assumptions around conservation objectives over time (Parks et al. 2023).
Fig. 2.
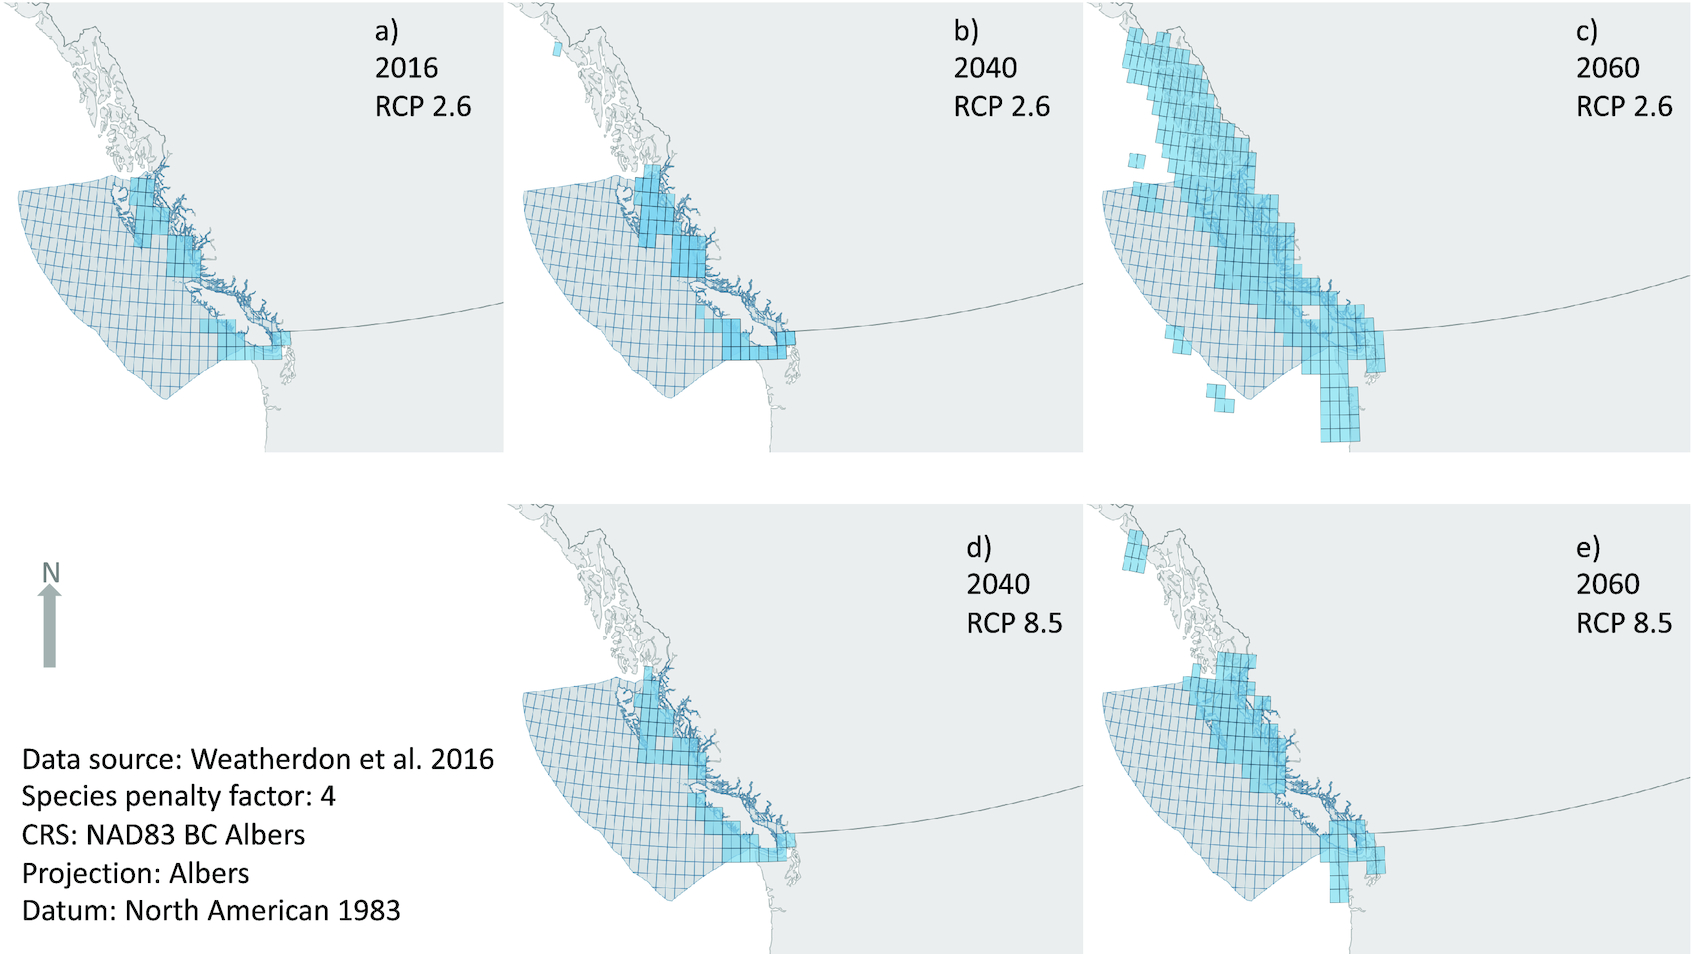
Table 3.
| Best solution | |||||
|---|---|---|---|---|---|
| Year | RCP scenario | # Species did not meet targets | # Planning units selected | Cost* | # Planning units outside BC EEZ |
| 2016 | 2.6 | 0 | 43 | 43 | 0 |
| 2030 | 2.6 | 0 | 50 | 50 | 0 |
| 2030 | 8.5 | 0 | 56 | 56 | 0 |
| 2040 | 2.6 | 0 | 47 | 56 | 1 |
| 2040 | 8.5 | 0 | 52 | 52 | 0 |
| 2050 | 2.6 | 2 | 65 | 65 | 0 |
| 2050 | 8.5 | 0 | 142 | 574 | 51 |
| 2060 | 2.6 | 19 | 278 | 1403 | 142 |
| 2060** | 8.5 | 0 | 102 | 291 | 33 |
| 2016–2050 (inclusive, with years 2016, 2030, 2040, and 2050) | 2.6 | 0 | 65 | 74 | 1 |
Note: All scenarios were run with a species penalty factor of 4. Targets were set at 30% of the relative abundance of each species within the BC EEZ at the 2016 RCP 2.6 scenario (the resistance scenario).
*
Cost was set as the area of each cell inside the Canadian Pacific EEZ, and 10× the area in cells outside of the Canadian EEZ.
**
Targets could not be met in this scenario.
By allowing the target abundance file to shift along with the projected species ranges and relative abundance values across the entire planning unit grid (which included SE Alaska and northern Washington States), the results were quite different (Table 4). In particular, the selected areas were not forced outside of the BC EEZ, and additional area was selected within Provincial waters (see maps in Supplementary Material). This highlights the necessity of transboundary conservation planning; to conserve a portion of the baseline relative abundance (as in Table 3), it will likely become necessary to develop protected areas management beyond the current Canadian jurisdiction.
Table 4.
| Best solution | |||||
|---|---|---|---|---|---|
| Year | RCP scenario | # Species did not meet targets | # Planning units selected | Cost | # Planning units outside BC EEZ |
| 2016 | 2.6 | 0 | 55 | 55 | 0 |
| 2030 | 2.6 | 0 | 54 | 72 | 2 |
| 2030 | 8.5 | 0 | 176 | 176 | 0 |
| 2040 | 2.6 | 0 | 57 | 75 | 1 |
| 2040 | 8.5 | 0 | 175 | 184 | 1 |
| 2050 | 2.6 | 0 | 54 | 63 | 1 |
| 2050 | 8.5 | 0 | 185 | 185 | 0 |
| 2060 | 2.6 | 0 | 52 | 61 | 1 |
| 2060 | 8.5 | 0 | 54 | 63 | 1 |
Note: All scenarios were run with a species penalty factor of 4. Targets were set at 30% of the relative abundance of each species at each time and emissions scenario (the resilience scenario).
Discussion
Considering climate change impacts is important for marine conservation planning, as climate changes will affect species’ ranges, larval dispersal, and population connectivity, and thus compromise the performance of MPAs and MPA networks (Álvarez‐Romero et al. 2017). MPAs and networks have largely lacked consideration for climate change (Bruno et al. 2018; Sala and Giakoumi 2018). Rapidly accelerating climate impacts make the Pacific region especially vulnerable to current and future impacts of global change (Okey et al. 2014; Asch et al. 2018). We used two approaches to incorporate existing climate change projections for species of cultural and economic importance within a coastal region. In the first of such analyses in this region, we showed that BC MPAs are likely to protect fewer species by 2060 than they do currently, as species ranges are projected to shift poleward and “leave” current MPAs. Similarly, spatial priority areas as selected by Marxan shifted north as species ranges shifted north, and more spatial priority areas were required for species to reach conservation targets. Knowing this, strategically adding new MPAs farther north as species ranges shift north would help to support conservation goals and objectives, although our analysis did not consider new species moving into the region or species interactions. It is important to note that species abundance is also projected to decline during this time period (Weatherdon et al. 2016b), and as such, it could become harder for the same number of MPAs to protect the same abundance of species. Weighting MPA zones that are projected to protect the highest number of species from analyses such as these could help to meet conservation objectives. More broadly, strategically working with fisheries management and other adaptation policies, and across jurisdictional borders, could help to improve the conservation effectiveness of MPAs considering climate-change related changes in species-specific thermal niches.
Our efforts to use global data to analyze and inform MPA planning and management in BC highlighted two key challenges. First, there are many uncertainties embedded in our analyses and associated data. By necessity, bioclimatic models incorporate a great deal of complexity and species data, but this adds uncertainty to the predictions of future species distributions (Ackerly et al. 2010). The projected species ranges model outputs that we used as inputs into both analyses have high uncertainties around emissions, projected changes in ocean conditions, and also around species responses to climate change. The projections also did not consider other socioeconomic or human drivers such as fishing and habitat changes that may affect species’ abundance (Heikkinen et al. 2006; Wiens et al. 2009; Cheung et al. 2016; IPCC 2018). More specifically, in the Marxan analyses, we used modelled relative abundance data available through SDMs (Weatherdon et al. 2016b). Applying SDM abundance data to systematic conservation planning has several assumptions and potential associated errors (Tulloch et al. 2016). These include the assumption that occurrence data that are used as inputs into SDMs reflect the preferred habitat conditions of the species that we explicitly included in our SDMs; some abiotic (e.g., fishing) and/or biotic (e.g., food availability and predation) factors not represented in the models may be driving the past and projected future distributions. As well, these projections assume that species detectability is constant across species, whereas there are known irregularities in species-specific data availability for model inputs (Weatherdon et al. 2016b).
Future research should take species-specific responses to changing habitat conditions beyond the thermal niche into account, including species interactions and motility (Montoya and Raffaelli 2010; Parks et al. 2023). As well, there is uncertainty in real-world future emissions that will affect biological outcomes and adaptation strategies that could be developed at local, regional, or national scales to mitigate these impacts (Gattuso et al. 2015; IPCC 2018). Using climate velocity, or the localized speed and direction of climate contours as they are predicted to shift, as a proxy for how species’ distributions will shift to track those thermal niches, could be a simpler method of incorporating climate effects on species movement than modelling species ranges (Loarie et al. 2009; García Molinos et al. 2015), although these data are not yet available for this region. Climate velocities can also be combined with species traits where those data are available to build more robust predictions of species range shifts (Sunday et al. 2015). In addition, future research could incorporate the effects of MPAs on species population dynamics and how conservation targets could be met through spatial planning (e.g., increasing species’ abundance). For example, MPAs could buffer or offset the impacts of climate change on declining species abundance (Fox et al. 2012).
The second challenge was the coarse resolution of the outputs of the bioclimate modelling used, and hence also our Marxan analysis. The global data we used for the analysis were at a relatively coarse resolution relative to the area of BC MPAs and current MPA network planning efforts in the region. Such a mismatch in spatial resolution increases the projection uncertainties at the grid cell level that are used by the existing management and planning efforts. While our results could not directly inform the design of BC MPA networks, they might be suitable for other broader planning efforts in the region. Downscaled projections are being developed and refined for Canada's Pacific waters, but at present these are unable to resolve the complex nearshore waters and thus exclude most waters where BC MPAs are located (Masson and Fine 2012; Holdsworth et al. 2021). In the future, downscaled climate projections will be available to model species range shifts and/or climate velocities relevant for the scale of MPA planning, but this will come too late for the development of the current MPA network. Once available, these should be considered in the adaptive management of the MPA network. Species-specific analyses will also be helpful to understand whether they are being protected by MPAs in a changing climate.
Despite these challenges, the conclusions from our results are still useful for planners and managers within BC to understand the conservation potential of coastal MPA networks now and in the future and to advocate for increased protection measures that can support the resilience of marine ecosystems in an increasingly uncertain climate. In particular, our results highlight that climate change confronts the assumptions of conventional spatial approaches to conservation (Lawler et al. 2015). To maintain 30% of the baseline (2016) relative abundance of species within BC waters, large portions of the NE Pacific coast may require some type of spatial protection. Given the uncertainty inherent in projecting species range shifts and the effects of ocean warming on the dispersal capacity of many marine species, larger MPAs or a well-connected network of MPAs reduce the reliance on accurate predictions of biodiversity now and in the future and will also be necessary to maintain population recruitment and recolonization after discrete disturbances (Álvarez‐Romero et al. 2017). However, given the rapid pace of change and the numerous biological outcomes that are not accounted for in these range shift projections (e.g., changing species interactions), static area-based conservation efforts are unlikely to be sufficient on their own to support species persistence in the long term (Tittensor et al. 2019), and managers will also have social implications to consider. For example, while large MPAs may have high ecological value (Edgar et al. 2014), smaller MPAs may support human wellbeing, which is important in the coastal context (Ban et al. 2019). Unconventional approaches, such as temporally dynamic MPAs (Alagador et al. 2014) and assisted migration (Swan et al. 2015), might be worth considering in addition to static MPAs (D'Aloia et al. 2019). Overall, adaptation strategies and unconventional conservation approaches will be necessary as part of a portfolio response to support resilience to climate change (Millar et al. 2007; Galatowitsch et al. 2009).
Maintaining biological diversity for resilience to environmental change is a key policy issue for local and national governance in this era of accelerating climate change. Given our finding that it will be difficult to maintain species abundances within MPAs in the future, a key challenge is to understand and develop management approaches across jurisdictions (Canadian and American; Federal, Provincial, and First Nations in Canada's Pacific waters) that can support adaptation and response to global environmental change. While conservation planning cannot prevent the impacts of climate change, the general effects can be predicted and integrated into conservation planning decisions. Depending on the adaptive capacity of species and populations, based on thermal tolerance estimates, some species will be adaptable to changing climates over time, while others will disperse rapidly, if possible, in response to changing habitats and environmental conditions (Sunday et al. 2012). Managing for resilience through precautionary conservation planning would suggest that incorporating what we do know about climate change impacts, rather than focusing on what we do not, is a more appropriate management choice.
Acknowledgements
We gratefully acknowledge the financial support of the Province of British Columbia through the Ministry of Environment and Climate Change Strategy and the Ministry of Forests, Lands, Natural Resource Operations and Rural Development. We specifically thank Tori Stevens, Jennifer Grant, and Stephen Ban from BC Parks for their support and suggestions with the component of the analysis that was completed for BC Parks. This research is sponsored by the NSERC Canadian Healthy Oceans Network and its Partners: Department of Fisheries and Oceans Canada and INREST (representing the Port of Sept-Îles and City of Sept-Îles). CKW was also supported by the National Science and Engineering Research Council (NSERC) through a Canada Graduate Scholarship, the Pacific Institute for Climate Solutions, the Social Science and Humanities Research Council of Canada (SSRHC) through the OceanCanada Partnership, and a PEO Scholar Award. NCB was supported by NSERC and SSHRC. Many thanks to Lauren Weatherdon and Gabriel Reygondeau for assistance with the dynamic bioclimate model projections, Sebastian Pardo and Stephen Ban for data analysis support, and Emily Goodman for assisting with geospatial analysis and map production.
References
Ackerly D.D., Loarie S.R., Cornwell W.K., Weiss S.B., Hamilton H., Branciforte R., Kraft N.J.B. 2010. The geography of climate change: implications for conservation biogeography. Diversity and Distributions, 16: 476–487.
Alagador D., Cerdeira J.O., Araújo M.B. 2014. Shifting protected areas: scheduling spatial priorities under climate change. Journal of Applied Ecology, 51: 703–713.
Álvarez‐Romero J.G., Munguía-Vega A., Beger M., Mancha-Cisneros M.M., Suárez-Castillo A.N., Gurney G., et al. 2017. Designing connected marine reserves in the face of global warming. Global Change Biology, 24: 1–21.
Araújo M.B.M. 2009. Climate change and spatial conservation planning. In Spatial conservation prioritization: quantitative methods and computational tools. pp. 172–184.
Ardron J.A., Possingham H.P., Klein C.J. 2010. Marxan good practices handbook, version 2. Pacific Marine Analysis and Research Association.
Asch R.G., Cheung W.W.L., Reygondeau G. 2018. Future marine ecosystem drivers, biodiversity, and fisheries maximum catch potential in Pacific Island countries and territories under climate change. Marine Policy, 88: 285.
Ball I.R., Possingham H.P., Watts M.E. 2009. Marxan and relatives: software for spatial conservation prioritization. Spatial conservation prioritization. Quantitative methods & computational tools, 185–195.
Ban N.C., Gurney G.G., Marshall N.A., Whitney C.K., Mills M., Gelcich S., et al. 2019. Well-being outcomes of marine protected areas. Nature Sustainability, 2: 524–532.
Ban S.S., Alidina H.M., Okey T.A., Gregg R.M., Ban N.C. 2016. Identifying potential marine climate change refugia: a case study in Canada's Pacific marine ecosystems. Global Ecology and Conservation, 8: 41–54.
Brown C.J., O'Connor M.I., Poloczanska E.S., Schoeman D.S., Buckley L.B., Burrows M.T., et al. 2015. Ecological and methodological drivers of species’ distribution and phenology responses to climate change. Global Change Biology, 22: 1548.
Bruno J.F., Bates A.E., Cacciapaglia C., Pike E.P., Amstrup S.C., Van Hooidonk R., et al. 2018. Climate change threatens the world's marine protected areas. Nature Climate Change, 8: 499–503.
Carwardine J., Klein C.J., Wilson K.a., Pressey R.L., Possingham H.P. 2009. Hitting the target and missing the point: target-based conservation planning in context. Conservation Letters, 2: 4–11.
Cheung W.W.L., Brodeur R.D., Okey T.A., Pauly D. 2015. Projecting future changes in distributions of pelagic fish species of Northeast Pacific shelf seas. Progress in Oceanography, 130: 19–31.
Cheung W.W.L., Jones M.C., Reygondeau G., Stock C.A., Lam V.W.Y., Frolicher T.L. 2016. Structural uncertainty in projecting global fisheries catches under climate change. Ecological Modelling, 325: 57–66.
Cheung W.W.L., Lam V.W.Y., Sarmiento J.L., Kearney K., Watson R., Pauly D. 2009. Projecting global marine biodiversity impacts under climate change scenarios. Fish and Fisheries, 10: 235–251.
D'Aloia C.C., Daigle R.M., Côté I.M., Curtis J.M.R., Guichard F., Fortin M.-J. 2017. A multiple-species framework for integrating movement processes across life stages into the design of marine protected areas. Biological Conservation, 216: 93–100.
D'Aloia C.C., Naujokaitis-Lewis I., Blackford C., Chu C., Curtis J.M.R., Darling E., et al. 2019. Coupled networks of permanent protected areas and dynamic conservation areas for biodiversity conservation under climate change. Front. Ecol. Evol. 7: 1–8.
Doney S.C., Ruckelshaus M., Emmett Duffy J., Barry J.P., Chan F., English C.A., et al. 2012. Climate change impacts on marine ecosystems. Annual Review of Marine Science, 4: 11–37.
Edgar G.J., Stuart-smith R.D., Willis T.J., Kininmonth S., Baker S.C., Banks S., et al. 2014. Global conservation outcomes depend on marine protected areas with five key features. Nature, 506: 216–220.
Fernandes J.A., Cheung W.W.L., Jennings S., Butensch??n M., De Mora L., Frlicher T.L., et al. 2013. Modelling the effects of climate change on the distribution and production of marine fishes: accounting for trophic interactions in a dynamic bioclimate envelope model. Global Change Biology, 19: 2596–2607.
Fox H.E., Mascia M.B., Basurto X., Costa A., Glew L., Heinemann D., et al. 2012. Reexamining the science of marine protected areas: linking knowledge to action. Conservation Letters, 5: 1–10.
Friesen S.K., Ban N.C., Holdsworth A.M., Peña M.A., Christian J., Hunter K.L. 2021. Physical impacts of projected climate change within Marine Protected Areas in the Pacific Bioregions. Canadian Technical Report of Fisheries and Aquatic Sciences, 3422: iv + 60 p.
Galatowitsch S., Frelich L., Phillips-Mao L. 2009. Regional climate change adaptation strategies for biodiversity conservation in a midcontinental region of North America. Biological Conservation, 142: 2012–2022.
Gale K.S.P., Frid A., Lee L., McCarthy J., Robb C., Rubidge E., et al. 2019. A framework for identification of ecological conservation priorities for Marine Protected Area network design and its application in the Northern Shelf Bioregion. DFO Can. Sci. Advis. Sec. Res. Doc. 2018/055. pp. 1–186.
García Molinos J.G., Halpern B.S., Schoeman D.S., Brown C.J., Kiessling W., Moore P.J., et al. 2015. Climate velocity and the future global redistribution of marine biodiversity. Nature Climate Change, 6: 83.
Gattuso J.-P., Magnan A., Bille R., Cheung W.W.L., Howes E.L., Joos F., et al. 2015. Contrasting futures for ocean and society from different anthropogenic CO2 emissions scenarios. Science, 349(80): 349.
Gerber L.R., Del Mark Mancha-Cisneros M., O'Connor M., Selig E.R. 2014. Climate change impacts on connectivity in the ocean: implications for conservation. Ecosphere, 5: art33.
Gissi E., McGowan J., Venier C., Di Carlo D., Musco F., Menegon S., et al. 2018. Addressing transboundary conservation challenges through marine spatial prioritization. Conservation Biology, 32: 1107.
Government of Canada. 2011. National framework for Canada's network of marine protected areas. Ottawa.
Groves C.R., Game E.T., Anderson M.G., Cross M., Enquist C., Ferdaña Z., et al. 2012. Incorporating climate change into systematic conservation planning. Biodiversity and Conservation, 21: 1651–1671.
Hannah L., 2008. Protected areas and climate change. Annals of the New York Academy of Sciences, 1134: 201–212.
Hannah L., Midgley G.F., Lovejoy T., Bond W.J., Bush M., Lovett J.C., et al. 2002. Conservation of biodiversity in a changing climate. Conservation Biology, 16: 264–268.
Heikkinen R.K., Luoto M., Araujo M.B., Virkkala R., Thuiller W., Sykes M.T. 2006. Methods and uncertainties in bioclimatic envelope modelling under climate change. Progress in Physical Geography: Earth and Environment, 30: 751–777.
Hodgson J.A., Thomas C.D., Wintle B.A., Moilanen A. 2009. Climate change, connectivity and conservation decision making: back to basics. Journal of Applied Ecology, 46: 964–969.
Hoegh-Guldberg O., Bruno J.F. 2010. The impact of climate change on the world's marine ecosystems. Science, 328(80): 1523–1528.
Holdsworth A.M., Zhai L., Lu Y., Christian J.R. 2021. Future Changes in Oceanography and Biogeochemistry Along the Canadian Pacific Continental Margin. Frontiers in Marine Science, 8: 1–20.
IPCC. 2014. Summary for policymakers. In: Climate change 2014: impacts, adaptation, and vulnerability. Part A: global and sectoral aspects. Contribution of Working Group II to the Fifth Assessment Report of the Intergovernmental Panel on Climate Change [Field, C.B., V, Climate change 2014: impacts, adaptation and vulnerability. Part A: global and sectoral aspects. Contributions of the Working Group II to the Fifth Assessment Report of the Intergovernmental Panel on Climate Change [Field, C.B., V.R. Barros, D.J. Dokken. Renewable energy]. 351376.
IPCC. 2018. Global warming of 1.5° C. Summary for Policymakers.
Jones K.R., Watson J.E.M., Possingham H.P., Klein C.J., 2016. Incorporating climate change into spatial conservation prioritisation: a review. Biological Conservation, 194: 121–130.
Lawler J., Watson J., Game E. 2015. Conservation in the face of climate change: recent developments. F1000Research, 4: 1158.
Lima F.P., Gomes F., Seabra R., Wethey D.S., Seabra M.I., Cruz T., et al. 2016. Loss of thermal refugia near equatorial range limits. Global Change Biology, 22: 254–263.
Loarie S.R., Duffy P.B., Hamilton H., Asner G.P., Field C.B., Ackerly D.D. 2009. The velocity of climate change. Nature, 462: 1052–1055.
Magris R.A., Pressey R.L., Weeks R., Ban N.C. 2014. Integrating connectivity and climate change into marine conservation planning. Biological Conservation, 170: 207–221.
Masson D., Fine I. 2012. Modeling seasonal to interannual ocean variability of coastal British Columbia. Journal of Geophysical Research: Oceans 117: n/a–n/a.
McCook L.J., Almany G.R., Berumen M.L., Day J.C., Green A.L., Jones G.P., et al. 2009. Management under uncertainty: guidelines for incorporating connectivity into the protection of coral reefs. Coral Reefs, 28: 353–366.
McGee G., Byington J., Bones J., Cargill S., Dickinson M., Wozniak K., Pawluk K.A. 2022. Marine plan partnership for the North Pacific Coast: engagement and communication with stakeholders and the public. Marine Policy, 142: 104613.
McLeod E., Salm R., Green A., Almany J. 2009. Designing marine protected area networks to address the impacts of climate change. Frontiers in Ecology and the Environment, 7: 362–370.
Millar C.I., Stephenson N.L., Stephens S.L. 2007. Climate change and forests of the future: managing in the face of uncertainty. Ecological Applications, 17: 2145–2151.
Montoya J.M., Raffaelli D. 2010. Climate change, biotic interactions and ecosystem services. Philosophical Transactions of the Royal Society B, 365: 2013–2018.
Okey T.A., Alidina H.M., Lo V., Jessen S. 2014. Effects of climate change on Canada's Pacific marine ecosystems: a summary of scientific knowledge. Reviews in Fish Biology and Fisheries, 24: 519–559.
Parks S.A., Holsinger L.M., Abatzoglou J.T., Littlefield C.E., Zeller K.A. 2023. Protected areas not likely to serve as steppingstones for species undergoing climate-induced range shifts. Global Change Biology, 29: 2681.
Parmesan C., Yohe G. 2003. A globally coherent fingerprint of climate change impacts across natural systems. Nature, 421: 37–42.
Patrizzi N.S., Dobrovolski R. 2018. Integrating climate change and human impacts into marine spatial planning: a case study of threatened starfish species in Brazil. Ocean & Coastal Management, 161: 177–188.
Pinsky M.L., Eikeset A.M., McCauley D.J., Payne J.L., Sunday J.M. 2019. Greater vulnerability to warming of marine versus terrestrial ectotherms. Nature, 569108.
Raftery A.E., Zimmer A., Frierson D.M.W., Startz R., Liu P. 2017. Less than 2 °C warming by 2100 unlikely. Nature Climate Change, 7: 637–641.
Reid M., Lena M.L., Hall S.R.J., Mason E., McGee G., Frid A. 2022. Protecting our coast for everyone's future : indigenous and scientific knowledge support marine spatial protections proposed by Central Coast First Nations in Pacific Canada. People and Nature, 4: 1052.
Sala E., Giakoumi S. 2018. No-take marine reserves are the most effective protected areas in the ocean. ICES Journal of Marine Science, 75: 1166–1168.
Sunday J.M., Bates A.E., Dulvy N.K. 2011. Global analysis of thermal tolerance and latitude in ectotherms. Proceedings of the Royal Society B, 278: 1823–1830.
Sunday J.M., Bates A.E., Dulvy N.K. 2012. Thermal tolerance and the global redistribution of animals. Nature Climate Change, 2: 686–690.
Sunday J.M., Pecl G.T., Frusher S., Hobday A.J., Hill N., Holbrook N.J., et al. 2015. Species traits and climate velocity explain geographic range shifts in an ocean-warming hotspot. Ecology Letters, 18944.
Swan K.D., Mcpherson J.M., Seddon P.J., Moehrenschlager A. 2015. Managing marine biodiversity : the rising diversity and prevalence of marine conservation translocations. Conservation Letters, 7582: 1–13.
Tingley M.W., Beissinger S.R. 2009. Detecting range shifts from historical species occurrences: new perspectives on old data. Trends in Ecology & Evolution, 24: 625–633.
Tittensor D.P., Beger M., Böerder K., Boyce D., Cavanagh R., Cosandey-Godin A., et al. 2019. Integrating climate adaptation and biodiversity conservation in the global protected ocean. Science Advances.
Tulloch A.I.T., Sutcliffe P., Naujokaitis-Lewis I., Tingley R., Brotons L., Ferraz K.M.P.M.B., et al. 2016. Conservation planners tend to ignore improved accuracy of modelled species distributions to focus on multiple threats and ecological processes. Biological Conservation, 199: 157–171.
Weatherdon L.V., Ota Y., Jones M.C., Close D.A., Cheung W.W.L. 2016a. Projected scenarios for coastal first nations’ fisheries catch potential under climate change: Management challenges and opportunities. PLoS One, 11: e0145285.
Weatherdon L.V., Ota Y., Jones M.C., Close D.A., Cheung W.W.L.L. 2016b. Projected scenarios for coastal first nations’ fisheries catch potential under climate change: management challenges and opportunities. PLoS One, 11: e0145285.
Wiens J.A., Stralberg D., Jongsomjit D., Howell C.A., Snyder M.A. 2009. Niches, models, and climate change: assessing the assumptions and uncertainties. Proceedings of the National Academy of Sciences of the United States of America, 106: 19729–19736.
Supplementary material
Supplementary Material 1 (DOCX / 68.6 KB).
- Download
- 68.64 KB
Supplementary Material 2 (DOCX / 20.9 KB).
- Download
- 20.98 KB
Information & Authors
Information
Published In

FACETS
Volume 8 • January 2023
Pages: 1 - 10
Editor: Brett Favaro
History
Received: 17 February 2022
Accepted: 7 June 2023
Version of record online: 24 August 2023
Notes
This paper is part of a collection entitled “Climate change and the Canadian marine conservation framework”.
Copyright
© 2023 The Author(s). This work is licensed under a Creative Commons Attribution 4.0 International License (CC BY 4.0), which permits unrestricted use, distribution, and reproduction in any medium, provided the original author(s) and source are credited.
Data Availability Statement
The primary data used in this article are published in previous papers and cited as references. Data generated during this study are available on Github at: https://github.com/charwhitney/mpaclimate.
Key Words
Sections
Subjects
Plain Language Summary
Existing marine parks may not protect marine species persistence in a rapidly warming climate
Authors
Author Contributions
Conceptualization: CKW, WWLC, NCB
Data curation: WWLC
Formal analysis: CKW
Funding acquisition: CKW, NCB
Investigation: CKW
Methodology: CKW, WWLC
Project administration: CKW, NCB
Supervision: WWLC, NCB
Writing – original draft: CKW
Writing – review & editing: CKW, WWLC, NCB
Competing Interests
The co-authors have no conflicts of interest to declare.
Metrics & Citations
Metrics
Other Metrics
Citations
Cite As
Charlotte K. Whitney, William W.L. Cheung, and Natalie C. Ban. 2023. Considering the implications of climate-induced species range shifts in marine protected areas planning. FACETS.
8(): 1-10. https://doi.org/10.1139/facets-2022-0041
Export Citations
If you have the appropriate software installed, you can download article citation data to the citation manager of your choice. Simply select your manager software from the list below and click Download.
Cited by
1. Evaluating the design of the first marine protected area network in Pacific Canada under a changing climate