Wet–dry cycles influence methylmercury concentrations in water in seasonal prairie wetland ponds
Abstract
Methylmercury concentrations [MeHg] in whole water were measured in 28 prairie wetland ponds in central Saskatchewan between 2006 and 2012. Ponds fell into four land use categories (established grass, recent grass, traditional cultivated, and certified organic cultivated) and two water level patterns (“Mainly Wet” ponds stayed wet at least until October and “Mainly Dry” ponds dried up each summer). Despite similar atmospheric Hg deposition, average [MeHg] and proportion of total Hg that was MeHg (%MeHg) were higher in water from ponds surrounded with established grass or organic farming; this trend may be driven by high [MeHg] at one Organic site. A stronger relationship was observed with water level patterns. Average [MeHg] and %MeHg were significantly higher in Mainly Wet ponds compared to Mainly Dry ponds. Higher [MeHg] in Mainly Wet ponds were correlated with much higher dissolved organic carbon (DOC) and sulfate (SO4−2) concentrations and higher specific UV absorbance of DOC. We suggest that prairie wetland ponds may not fit the accepted paradigm that wetlands with high [SO4−2] show inhibition of Hg methylation. Our work suggests controls such as the chemical nature of DOC or redox fluctuations in hydrologically dynamic systems may be important in determining net [MeHg] in these sites.
Introduction
Mercury emitted into the atmosphere enters aquatic ecosystems both as direct surface water deposition (either wet or dry) and runoff from terrestrial areas (Obrist et al. 2018; Cooke et al. 2020). Once present in aquatic systems, inorganic Hg (HgII) can be converted to methylmercury (MeHg), a neurotoxin that is easily bioaccumulated by humans and wildlife that consume aquatic organisms such as insects or fish (Eagles-Smith et al. 2018). The main source of MeHg in aquatic systems is microbial methylation, most often occurring at the oxic–anoxic interfaces in lake sediments and wetlands (Obrist et al. 2018). Historically, only sulfur-reducing bacteria (SRB), iron-reducing bacteria, and methanogens were identified methylators; more recently many bacteria and archaea have been shown to possess the gene pair (hgcAB) necessary for Hg methylation (Hamelin et al. 2011; Gilmour et al. 2013; Peterson et al. 2020). MeHg is also demethylated to reactive HgII or elemental Hg via a diverse suite of bacterial processes (Oremland et al. 1991; Huang et al. 2022) or abiotically from sunlight exposure (Sellers et al. 1996) such that the MeHg available to biota is the net result of these two processes.
Generally, the extent of MeHg production is controlled by factors impacting the metabolic activity of organisms capable of methylation and the inorganic Hg available for uptake for methylators (“bioavailable Hg”) (Tang et al. 2020). Methylating organisms need adequate substrates and niche conditions (temperature, redox, pH, among others) to be ecologically successful and thus produce MeHg (Hsu-Kim et al. 2013). The amount of bioavailable Hg is often controlled geochemically and these controls tend to be complex. For example, we know that systems high in dissolved organic carbon (DOC) concentrations facilitate Hg movement in aquatic systems (reviewed in Shanley et al. 2022), across microbial membranes (Graham et al. 2013), and into food webs (French et al. 2014). Less clear is the impact of high DOC concentrations on rates of MeHg production with studies showing both inhibition and facilitation may occur in the presence of high DOC concentrations (Graham et al. 2013; Zhao et al. 2017; reviewed by He et al. 2019). Additionally, it is becoming increasingly clear that the chemical nature, or “quality” of DOC both in water columns and in sediment porewaters exerts control on the mobilization of Hg to methylating microbes and throughout aquatic systems (Bravo et al. 2016; Poulin et al. 2017; Janssen et al. 2022; Wang et al. 2022). Finally, the presence of sulfate (SO4−2) and sulfide (HS− or H2HS−) may exert important methylation controls (Benoit et al. 1999; Yu and Barkay 2022) because the binding strength of Hg to HS− results in the reduction of some bioavailable Hg forms (Hammerschmidt et al. 2008) and enhancement of others (Drott et al. 2007).
These geochemical controls vary significantly in prairie wetland ponds which are typically small (<1 ha), shallow (typically <2 m), highly productive aquatic ecosystems scattered throughout the Prairie Pothole Region (PPR) of the North American Great Plains (van der Kamp et al. 2003). These wetland systems, under stress from intensive agricultural practices and vulnerable under projected climate change scenarios (Johnson et al. 2005), play vital roles in groundwater aquifer recharge (Bam et al. 2020; Negm et al. 2021), flood control, water quality (van der Valk 1989), and carbon and nutrient sequestration (Cheng and Basu 2017). They are critical wildlife habitats, providing cover and nesting sites for hundreds of game and nongame wildlife species and contain some of the most important waterfowl breeding habitats remaining in North America (Batt et al. 1989; Johnson et al. 2005). These unique chemical and physical characteristics offer prairie wetland ponds as ideal environments to explore factors controlling the production of neurotoxic MeHg.
The hydrology of these ecosystems has been studied extensively (Winter 1989; van der Kamp and Hayashi 2009; Hayashi et al. 2016). These systems are highly dependent on spring melt for water supply, and the overall annual water balance during the open water season is negative due to evapotranspiration exceeding precipitation (Woo and Rowsell 1993). As a result, water levels in prairie wetlands fluctuate widely in response to climatic cycles and in years with typical precipitation inputs, ponds generally dry up in the late summer and early fall months (Van der Valk 2005). Despite low topographic complexity, prairie potholes are generally isolated in terms of surface–water exchange, except in periods of deluge, when surface connectivity results. Groundwater exchange is complex and highly variable in space between recharge ponds (that lose water to deep groundwater) and discharge ponds (that gain water from deep groundwater), as well as variable in time (Hayashi et al. 2016; Bam et al. 2020). This hydrological variability results in great diversity in water chemistry (LaBaugh and Winter 1984; LaBaugh 1989) (including large ranges in DOC concentrations (Curtis and Adams 1995) and conductivity (Arts et al. 2000; Waiser 2006)) that may affect methylation rates. Variability in hydrology and water chemistry may be significantly impacted by the effects of climate change, which is expected to cause increased frequency of drought in the Great Plains region (Swain and Hayhoe 2015; Fay et al. 2016). Climatic variables are not the only control on hydrology in prairie wetlands; land use may also play a role (Daniel et al. 2022). Due to the agricultural development in the region, the majority of wetland ponds are surrounded by a diversity of annual or perennial crops and pastures. Few wetland ponds are surrounded by native grassland. The uplands of wetland ponds surrounded by cultivated areas in Saskatchewan tended to have decreased infiltration rates than grasslands due to small numbers and size of soil macropores and decreased evapotranspiration due to lower biomass of adjacent vegetation (van der Kamp et al. 2003).
While wetland ponds in the PPR are typically understudied, there are a small number of investigations that inform us on MeHg cycling in these systems. First, a survey of MeHg concentrations ([MeHg]) in whole water in wetlands across southern Saskatchewan showed that [MeHg] can be high compared to those in other aquatic habitats (Hall et al. 2009). In North Dakota, Sando et al. (2007) determined that MeHg concentrations varied in response to the hydrological definition of the pond. Bates and Hall (2012) showed that Hg concentrations in some aquatic insects are influenced by the type of land use on areas adjacent to the ponds. Finally, Hoggarth et al. (2015) determined that potential methylation rates in ponds in the PPR did not explain high concentrations of MeHg in surface waters. Therefore, the goal of the current study is to further explore the factors that may be controlling MeHg production in central Saskatchewan wetland ponds. We examined two possible factors that may influence [MeHg] in water from these systems, the role of fluctuating water levels, and the influence of the type of land use adjacent to wetland ponds.
Methods
Study sites
Our three study sites were located within and near the St. Denis National Wildlife Area (SDNWA; 52°12.537′N, 106°5.240′W; Fig. 1) (Government of Canada 2022), part of the PPR of North America that extends from northwestern Alberta to northwestern Iowa. This region is characterized by hummocky glacial till, aspen parkland terrain and contains numerous small, depressional mineral soil wetlands. Annual precipitation at the site based on local observations from precipitation gauges and snow surveys (Bam et al. 2019) for the period 1994–2017 is approximately 360 mm·year−1, with around 80 mm·year−1 falling as snow. The locally measured monthly mean air temperature for the same period varies between −15.8 °C (in January) and 17.9 °C (in July).
Fig. 1.

We sampled 28 ponds classified using the Circular 39 classification system of Shaw and Fredine (1956) as temporary ponds with the duration of ponded water on the order of weeks (Type III), months or seasons (Type IV), and permanent sites with water year-round regardless of periods of drought (Type V wetlands; Table S1). Although one pond (Pond 66) was mesohaline (conductivity, which we used as a proxy for salinity, = 11 mS·cm−1), the majority of ponds were either freshwater (<0.5 mS·cm−1; n = 10) or oligohaline (0.5–5 mS·cm−1; n = 17; Table S2). Sixteen ponds sampled were located in the eastern section of the SDNWA, which consists of a ring of semipermanent ponds at low elevations and an upland area that is 5–10 m higher in elevation. Low elevation ponds (Ponds 1, 2, 3, 65, 66, 67, 88, 97, 125 N, 130, and 139) have higher solute concentrations, whereas upland ponds (Ponds 100, 104, 110, 113, and 118) have lower solute concentrations (Kiss and Bedard-Haughn 2021), likely due to lower groundwater inputs. Three ponds were located in the western section of SDNWA (Ponds 26, 50, and 60). Six of our wetland ponds (Cultivated 1–3 and Grass 1–3) were located on private lands ∼2 km west of the SDNWA. Three additional sites (Organic 1, 2, and 4) were located on private land east of Vonda, SK ∼7.0 km north of the SDNWA (Fig. 1).
Prior to 1968, the entire SDNWA area was cultivated by local land owners. In 1977, land surrounding the wetlands in the low elevation area of the SDNWA was converted to brome grass (Bromus inermis Leyss.), alfalfa (Medicago sativa L.) and yellow sweet clover (Melilotus officinalis L.). Conversion to these grasses at the lower elevations was complete by 1983 (Conly and van der Kamp 2001). In May 2004, approximately half of the upland area (adjacent to Ponds 100, 104, and 118) was converted to a mix of perennials consisting mainly of intermediate wheatgrass (Elymus intermedius M. Bieb) and meadow brome (Bromus biebersteinii Roem. and Scult.). The other half (adjacent to Ponds 110, 113, and 118) was cultivated land and planted with flax (Linum usitatissimum; 2006), oats (Avena sp.; 2007), barley (Hordeum vulgare L.; 2008 and 2010), and canola (Brassica campestris L.; 2009, 2011). In years not listed, the land was in fallow.
For wetland ponds located on private lands immediately outside of and adjacent to the SDNWA, three ponds (Cultivated 1–3) were surrounded by cultivated fields planted with legumes in 2007 and a cereal crop in 2008 and 2009 and three ponds (Grass 1–3) were surrounded by grassland previously returned to fallow from cultivation practices in 1995 (Table S1, Fig. 1). Flora surrounding ponds in the grassland area consisted of aspen groves (Populus tremuloides Michx.), willows (Salix spp.), Medicago sativa, white sweet-clover (Melilotus alba Medic.), Canada thistle (Cirsium arvense (L.) Scop.), goldenrod (Solidago canadensis L.), and mixed tame and native grasses. The land adjacent to the three ponds north of the SDNWA (Organic 1, 2, and 4; Fig. 1) was managed as certified organic since 1985. Two Organic ponds (Organic 1 and 2) were adjacent to a crop of barley in 2007, plow down clover in 2008, and red fife wheat (Triticum aestivum L.) in 2009. Our third Organic pond (Organic 4) was surrounded by a plow down pea crop (Pisum sativum L.) in 2008 and red fife wheat in 2009. In dry years, cultivation occurred in the depressions left by Organic 2 and 4. With a few exceptions (Organic 2 and 4), all ponds were surrounded by some riparian vegetation, consisting of mostly willows and grasses.
Samples were taken from ponds located in areas characterized as falling into four land use categories—land converted to a perennial grass cover in 1977 (Grassland) and 2004 (Recent Grassland), land cultivated using nonorganic methods (Cultivated), and land cultivated using certified organic methods (Organic). Throughout this manuscript, land use categories refer to the type of land use on the watershed supplying immediate runoff to the ponds. All Type IV and V ponds (1, 26, 50, 65, 66, 67, 97, and 125 N) were surrounded by land classified as both Grassland and Cultivated land, and as such we used only Type III wetlands in our analysis of the impact of land use (see below).
Sampling took place between 2006 and 2012 (Table S3). In 2006, we performed an initial survey examining whole water [MeHg] in 19 ponds throughout the SDNWA. Beginning in 2007, efforts were concentrated on the ponds with different land use on private lands. From 2008 onwards, we focused on Type III ponds in the SDNWA for which we had water level data (see below). Private wetland ponds were not sampled after 2009.
Sample collection and analysis
Surface water sampled for Hg analysis was collected using trace metal-free techniques from open water areas of the ponds beyond the fringe of riparian vegetation (St. Louis et al. 1994; Olson et al. 1997). Samples were taken by hand in shallow areas by wading into the open water area and avoiding the plume or from a fibreglass canoe or inflatable boat in deeper water. Samples were visually inspected for large particles and if present the sample was taken again. Total mercury (THg; all forms of Hg) samples were collected in pre-cleaned glass bottles and preserved using trace metal grade concentrated HCl to 1% of total sample volume. Until 2011, MeHg samples were taken in sterile fluorocarbon polymer and, as was standard in the early years of our sampling efforts, were immediately placed on ice and frozen within 48 h. In 2010, we switched to pre-cleaned glass bottles for collection and acidification similar to THg samples. On two occasions in 2007, MeHg and THg were obtained from dissolved and particulate phase of samples from seven sites. After collection as outlined above, samples were filtered into clean bottles using 0.45 µm muffled quartz fibre filters and Teflon filter holders. The filtrate was preserved in the same manner as whole water samples. Filters loaded with particulate samples were immediately frozen on dry ice.
Methylmercury concentrations were determined by cold vapour atomic florescence spectrometry (CVAFS) after distillation, ethylation, and separation (Bloom 1989; Horvat et al. 1993; Liang et al. 1994). Detection limits for MeHg in water were between 0.01 and 0.05 ng·L−1. Matrix spike recoveries for MeHg were generally >80% and >90%. Total Hg was analyzed by CVAFS after BrCl oxidation and SnCl2 reduction following EPA Method 1631 (U.S. EPA 2002). Recoveries of THg from a certified standard reference material (National Research Council DORM-3) run concurrent with samples were between 100% and 102%. Average THg recoveries from sample duplicates spiked with a known concentration of a Hg standard were 90%–113% with a mean of 99%. Detection limits were 0.01–0.05 ng·L−1. Approximately 10%–15% of the samples were analyzed in duplicate and average relative differences among duplicates were 2.19% and 3.30% for THg and MeHg, respectively.
Ponds were sampled for temperature, dissolved oxygen concentrations, conductivity, and pH using a YSI probe. Samples for DOC and SO4−2 concentrations were taken from water filtered through 47 mm glass fibre filters and analyzed using standard methods (Stainton et al. 1977). Specific ultraviolet absorbance (SUVA) at λ = 254 nm (an indication of aromatic moieties in a sample and thus of the quality of the DOC) was determined as described in Hall et al. (2008).
Characterization of hydro-status
Water levels in ponds at the SDNWA have been monitored from 1968 using an approach presented in Conly et al. (2004). Briefly, a rod was inserted at the lowest point of the wetland pond to be used as a consistent point of reference for subsequent measurements. During the open water season (typically April–October), a measuring rod with a small circular metal base and graduated to 1 mm accuracy was used to measure the water level from the bottom of the pond. Measurements were typically taken monthly, although in some years measurements were taken only on a few occasions and in others as often as biweekly (Conly and van der Kamp 2001). To assess the impact of water levels, we narrowed our data set to only Type III wetlands at the SDNWA (Table 1) and examined water levels over the period 2000–2012. We chose this time period because it contained both a period of drought in the early part of the decade (2000–2004; Hanesiak et al. 2011) with subsequent wetter conditions (2005–2012). During the drought, the vast majority of Type III ponds held no water over the entire ice-free period (Table 1, Fig. S1). In 2005, a heavy spring melt resulting from larger than normal snow fall over the preceding winter (Pennock et al. 2010) increased water levels in most ponds and allowed us to sample these sites. Wet conditions due to greater than average spring precipitation persisted in the latter part of the decade and from 2006 to 2012, all ponds, with the exception of Pond 104 in 2008, contained water for some portion of each ice-free season. Based on the water level data, we categorized two types of ponds: (i) “Mainly Wet” ponds (Ponds 2, 3, 60, 88, 130, and 139; Fig. S1a) which either did not dry up at all over the course of each summer or stayed wet until October of each year from 2005 to 2012 and (ii) “Mainly Dry” ponds (Ponds 100, 104, 110, 113, and 118; Fig. S1b) which dried up in the earlier parts of each summer during 2005–2009 (Table 1). There were a few exceptions with Ponds 100, 110, and 118 tending to be wetter longer into the season in 2010–2012. Water level data were not available for the ponds located on private lands, and as such were not included in the statistical analysis on the impact of water levels. All of the ponds in the Mainly Wet category, with the exception of Ponds 60 and 88, were classified as Grassland sites (Table 1). In the Mainly Dry category, all of the sites were either Recent grass or Cultivated sites. We note that even during our “wet” periods, fill and spill conditions were still relatively isolated to freshet and/or large storm events. Finally, we do not have water level data for ponds outside the SDNWA; as such ponds in the Mainly Dry and Mainly Wet categories do not include Organic ponds.
Table 1.
| Water level status 2000–2012 | ||||||||||||||
|---|---|---|---|---|---|---|---|---|---|---|---|---|---|---|
| Pond name | Land use | 2000 | 2001 | 2002 | 2003 | 2004 | 2005 | 2006 | 2007 | 2008 | 2009 | 2010 | 2011 | 2012 |
| Mainly wet | ||||||||||||||
| Pond 60 | Cultivated | Dry | Dry | Dry | Dry | Dry | Wet | Wet | Wet | Oct | Wet | Wet | Wet | Wet |
| Pond 88 | Cultivated | Dry | Dry | Dry | Dry | Sept | Wet | Wet | Wet | Oct | Oct | Wet | – | – |
| Pond 2 | Grass | Dry | Dry | Dry | Dry | Dry | Dry | Wet | Wet | Wet | Wet | Wet | Wet | Wet |
| Pond 3 | Grass | Dry | Dry | Dry | Dry | Dry | Dry | Wet | Wet | Wet | Wet | Wet | Wet | Wet |
| Pond 130 | Grass | Dry | Dry | Dry | Dry | Dry | Dry | Wet | Wet | Wet | July | Wet | Wet | Wet |
| Pond 139 | Grass | Dry | Dry | Dry | Dry | Dry | Wet | Wet | Wet | Oct | Oct | Wet | Wet | Wet |
| Mainly dry | ||||||||||||||
| Pond 100 | Recent Grass | – | Dry | – | – | Dry | July | Aug | Aug | July | July | Wet | Wet | Wet |
| Pond 104 | Recent Grass | – | Dry | – | Dry | May1 | July | Aug | July | Dry | – | – | – | Wet |
| Pond 110 | Cultivated | Dry | Dry | Dry | Dry | May | Aug | Aug | Oct | July | July | Wet | Wet | Wet |
| Pond 113 | Cultivated | Dry | Dry | Dry | Dry | May | Dry | Aug | Oct | July | July | Wet | Oct | Oct |
| Pond 118 | Recent Grass | Dry | Dry | Dry | Dry | May | July | Aug | Oct | July | July | Wet | Wet | Wet |
Note: Dry, water absent from May to October; Wet, water present from May to October. Month indicates time when pond level went to zero (dry). Dashes represent years with no data. Blue shading represents years in which sampling took place.
1
“May” had spring water levels only.
Statistical procedures
Average concentrations of MeHg, THg, DOC, and SO4−2 and the proportion of THg that was MeHg (%MeHg) were calculated for each site by combining pond data from different sampling dates, thus, ponds were our experimental units. Forward multiple linear regressions were performed on data to determine which variables predicted [MeHg]. Variables included temperature, pH, conductivity, dissolved oxygen, SO4−2 and DOC concentrations, SUVA values, land use, wetland type, and hydrological status. Conductivity, MeHg, and SO4−2 concentrations were log transformed to meet requirements of normality, and to address the large range in conductivity and [SO4−2] (correlations’ comparisons of both original and log variable are presented in Table S4). Smallest Akaike Information Criteria (AIC) and Bayesian Information Criteria were used for best-fit model selection. Data analysis was performed using R statistical software (R Development Core Team 2013), with the dplyr (Wickham et al. 2021) and Mu-MIn (Barton 2009) packages. t tests and one-way analyses of variance were used to test differences in DOC and log SO4−2 concentrations and SUVA with land use category and hydro-status.
Results and discussion
Mercury in water
Average MeHg and total Hg concentrations (all forms of Hg, [THg]) in unfiltered water from individual ponds ranged from 0.123 to 9.947 ng·L−1 and 0.57 to 7.32 ng·L−1, respectively (Figs. 2A and S2, Table S5). The %MeHg values ranged from 3.2% to 64.5% (Fig. 2B, Table S5). All of these measurements were similar to values observed in other Saskatchewan ponds in 2006–2007 (Hall et al. 2009) and in North Dakota in 2003–2004 (Sando et al. 2007), with the exception of Organic 2, where average [MeHg] in water was significantly higher than all other ponds in this study (9.947 ± 5.054 ng·L−1). Total Hg concentrations in Organic 2 (7.31 ± 2.15 ng·L−1) were also elevated compared to other sites; however, the difference was not as striking as with [MeHg].
Fig. 2.
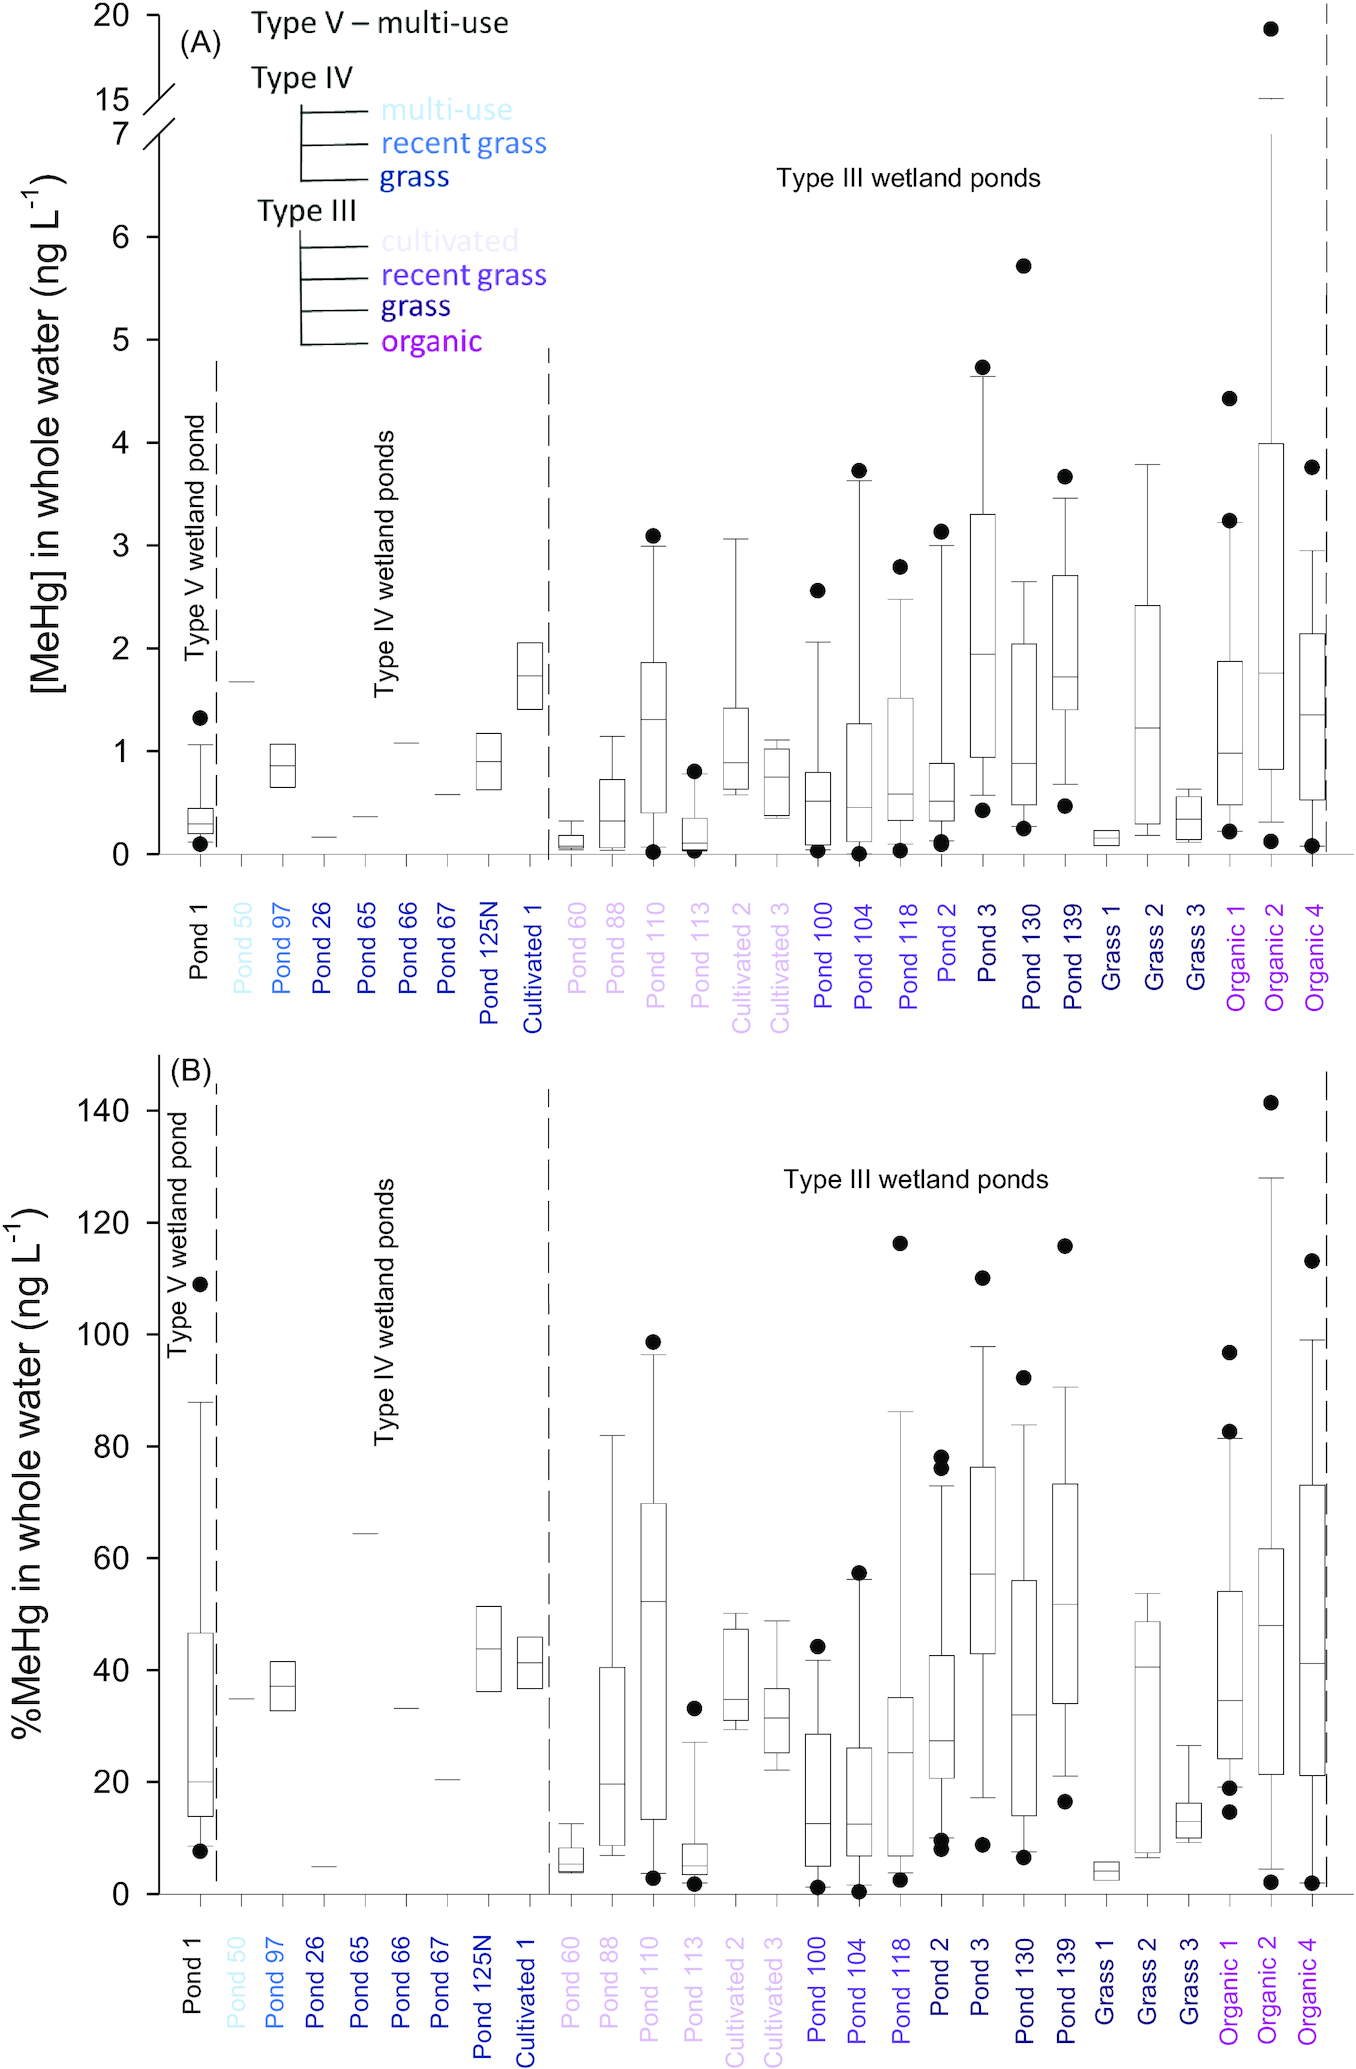
Shallow ponds in this area are often turbid due to shallow depths, loose sediments, and constant mixing due to wind (de la Cruz 1979; cited in Murkin 1989). Since we did not filter the majority of our samples, and although we made every effort to exclude particulates when sampling, the amount of particulate matter in some samples was substantial, potentially leading to %MeHg values that were greater than 100%. To assess the general contributions of particles to overall whole water concentrations, MeHg and THg in both the dissolved and particulate phases were examined from seven sites on two occasions in 2007 (Table S6). In six out of seven sites, the percentage of MeHg and THg in the dissolved phase ranged from 73.0% to 98.4% and 85.7% to 99.7%, respectively. These results are similar to ponds in North Dakota where the majority of MeHg was found in the dissolved phase (Sando et al. 2007) or in the colloidal phase that may pass through 0.45 µm filters (Hsu Kim et al. 2013). In Organic 2, 53% of MeHg and 62% of THg was in the particulate phase (Table S6). This site was shallow with extremely fine and flocculate sediments and it was impossible to avoid large particulates in the sample and, as such, increased particulate matter in Organic 2 may explain high whole water concentrations at that site. Variability within whole water samples in Organic 2 was large and %MeHg values ranged from 13.5% to 177.3%. Concentrations of MeHg and THg in insects were also high at this site compared to others (Bates and Hall 2012), suggesting bioaccumulation in the invertebrate food chain was occurring in that pond. We reiterate a conclusion presented in Hoggarth et al. (2015) that, from a management perspective, measuring MeHg concentrations, as well as the %MeHg, in surface water may be sufficient to predict and assess MeHg risks to biota.
What is controlling MeHg in Type III wetland ponds?
Forward multiple linear regression on data from Type III ponds determined period of inundation (hydro-status), SO4−2 and DOC concentrations, SUVA values, conductivity, pH, temperature, and Organic and Grassland land use to be significant variables predicting MeHg concentrations (Table 2). Model selection was based on AIC values (Table S7) and Quantile–Quantile plots of residuals support appropriate fitting of the model. Coefficients were as follows: log [MeHg] in whole water (ng·L−1) = −0.821 – (0.558*Mainly Wet) + (0.040* temperature (°C) − (0.647*log conductivity (mS·cm−1)) − (0.435*pH) + (0.364*log SO4−2 (mg·L−1)) + (0.007*DOC (mg·L−1)) + (0.288*SUVA (L mg·C−1·cm−1)) + (0.825*Organic land use) + (1.016*Grassland use) + ε.
Table 2.
| Variable | df | Sum sq | Mean Sq | F value | Pr (>F) | Significance |
|---|---|---|---|---|---|---|
| Temperature | 1 | 5.062 | 5.062 | 5.048 | 0.026 | 0.05 |
| log conductivity | 1 | 18.252 | 18.252 | 18.202 | 3.401e-05 | <0.001 |
| pH | 1 | 3.124 | 3.124 | 3.116 | 0.079 | 0.1 |
| log [SO4−2] | 1 | 15.690 | 15.690 | 15.646 | 0.0001 | 0.001 |
| [DOC] | 1 | 2.056 | 2.056 | 2.051 | 0.154 | 0.27 |
| SUVA | 1 | 9.049 | 9.049 | 9.0233 | 0.003 | 0.01 |
| Hydro-status | 3 | 8.531 | 2.844 | 2.836 | 0.034 | 0.05 |
| Land use | 4 | 36.29 | 9.072 | 9.047 | 1.310e-06 | <0.001 |
| Residuals | 159 | 159.44 | 1.003 |
Note: All samples are included. Sulfate concentrations = [SO4−2]; mg·L−1, dissolved organic carbon concentrations = [DOC]; mg·L−1, specific UV absorbance values = SUVA; L mg·C−1·cm−1.
Water chemistry controls on MeHg concentrations
Considering that our ponds were all within 3 km of each other, the variation of water chemistry parameters (Table S2) may be surprising if unfamiliar with the high temporal and spatial variability of these prairie wetland systems (Euliss and Mushet 1996; Nachson et al. 2014). Concentrations of DOC and SO4−2 (range = 10.06–188.20 mg·L−1 and 0.04–8168 mg·L−1 for DOC and SO4−2, respectively), conductivity (range = 0.168–11.220 mS·cm−1), and pH (range = 6.1–9.4) varied widely among ponds over the course of our sampling period. Similarly water temperature varied (range = 7.64 °C–32.11 °C) likely as a function of the difference in depth and climatic conditions over the open water season. Despite the variability, forward multiple linear regression on data from Type III ponds identified SO4−2 and DOC concentrations, SUVA values, conductivity, pH, and temperature to be significant variables predicting MeHg concentrations (Table 2). Predictive relationships between [MeHg] in whole water and both SO4−2 and DOC concentrations and SUVA is not surprising because previous studies have demonstrated that these parameters may control MeHg production by providing necessary substrates to methylating communities (Benoit et al. 1999; Aiken et al. 2003; Gorski et al. 2008; Hall et al. 2008; Janssen et al. 2022) (see below). A positive relationship between conductivity and MeHg reflects the fact that most of our systems are SO4−2 dominated. As methylation is by in large a microbially mediated process, we are also not surprised that temperature predicated [MeHg]. Finally, expectations on the processes in which pH may influence [MeHg] are less clear with early work showing inverse relationships between pH and Hg concentrations in fish (Winfrey and Rudd 1990) and that increasing concentrations of H+ facilitates the uptake of Hg by methylating organisms (Kelly et al. 2003). We note, however, that these findings were made in low pH lakes. Studies on the impact of pH in less acidic lakes are rare.
Controls of land use on MeHg concentrations
Average MeHg concentrations in water were higher in Type III wetland ponds surrounded by organic farming (p < 0.001) and grasslands (p < 0.001) compared to those surrounded by cultivated lands or lands that had been recently converted to grass (Fig. 3). The significant difference in [MeHg] and %MeHg in the Organic land use group could have been driven by data from Organic 2, which had high concentrations due to high particle loads (see above). Concentrations of THg in ponds surrounded by cultivated land were significantly lower than in ponds with other land use (p = 0.002; Fig. S3).
Fig. 3.
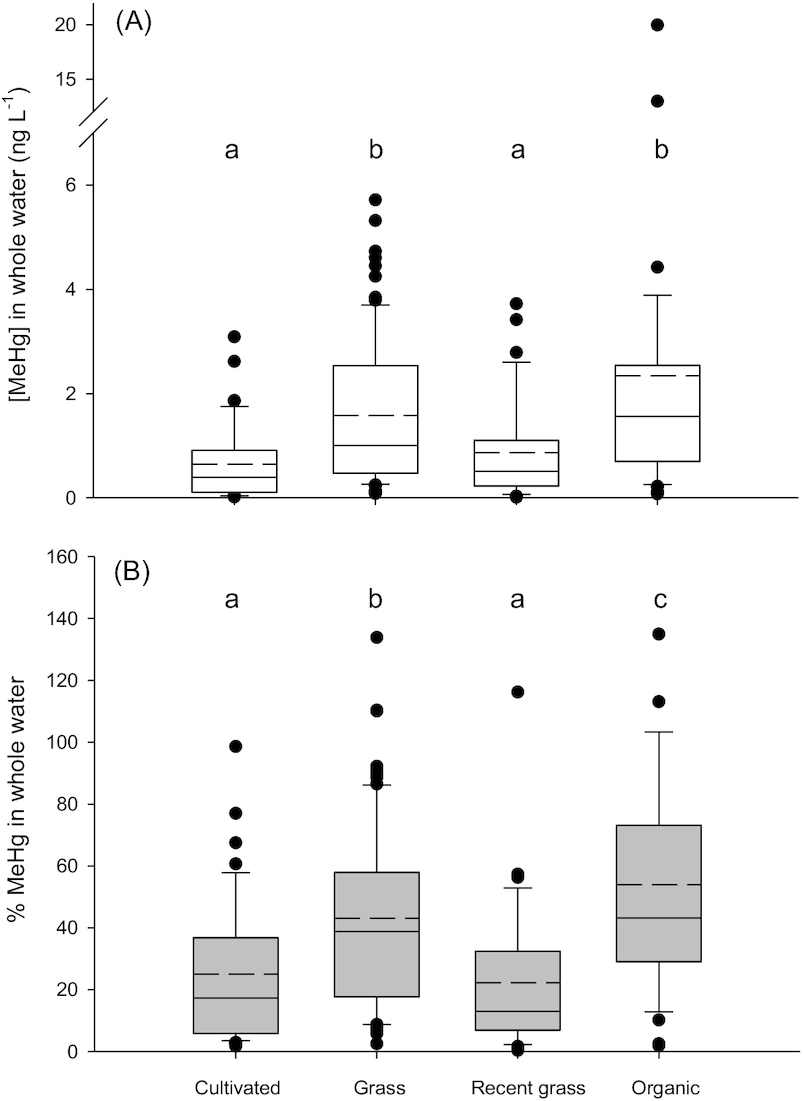
We present two explanations for why land use might indirectly influence [MeHg] in these environments; both are based on the finding that DOC concentrations were significantly lower in Cultivated ponds (Fig. S4A). First, because organic matter may influence rates of Hg methylation, impacts of land use on DOC mobilization to ponds may increase net MeHg concentrations in waters. For example, ponds with grassland riparian areas may have increased organic matter inputs due to heavily vegetated shorelines compared to ponds where the riparian vegetation is removed in an annual harvest. Ponds surrounded by organic farms may have increased organic matter inputs due to the use of green manures as fertilizers (Lundquist et al. 1999).
Second, ponds surrounded by grasslands tend to have increased hydraulic conductivity due to increased infiltration rates, macroporosity, and evapotranspiration in the riparian zone (Conly and van der Kamp 2001; Bodhinayake and Si 2004). As a result, infiltration of summer precipitation and snowmelt is likely to be higher and runoff smaller in undisturbed grasslands compared to cultivated lands. Increased upland infiltration may result in increased input of porewaters with high MeHg and DOC concentrations, or DOC that is more chemically complex. However, in very wet periods, water fluctuations tend to be smaller for grasslands wetlands compared to cultivated wetlands (Euliss and Mushet 1996). In fact, the conversion of cultivated lands at the SDNWA to grass in the 1980s resulted in a decrease in water levels in grassland ponds compared to cultivated ponds in subsequent years (van der Kamp et al. 1999, 2003).
Controls of period of inundation on MeHg concentrations
Ideally, we would have liked to examine differences in [MeHg] among Type III, IV, and V ponds to determine if length of hydroperiod controlled concentrations. However, samples numbers in the more permanent ponds (Type IV and V) were small and thus we restricted our analysis to Type III ponds. Average [MeHg] and %MeHg in ponds classified into the Mainly Wet category were significantly higher than ponds classified to the Mainly Dry category (t test, [MeHg] p < 0.001 and %MeHg p < 0.001; Fig. 4). There was no significant difference in average [THg] in ponds with different hydro-status (p = 0.479; Fig. S5).
Fig. 4.
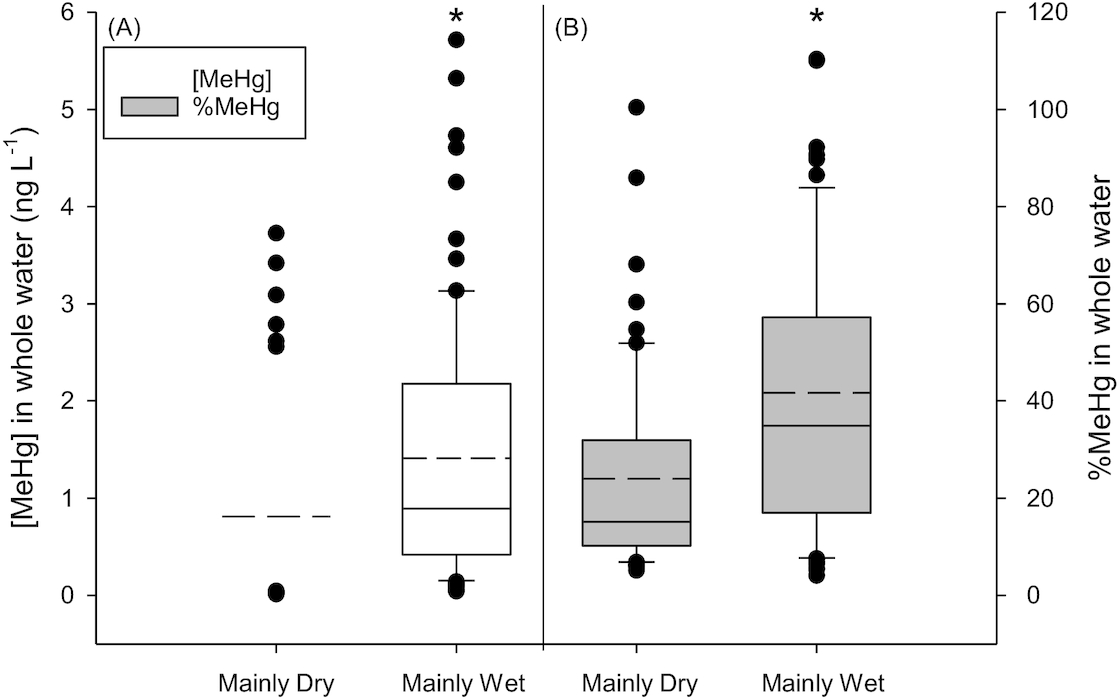
The high variability of hydrologic cycles that result in the alternation of wet–dry conditions of prairie wetlands may result in unusually high rates of MeHg production. We identify two strong possibilities to explain higher [MeHg] in ponds that had significant periods of flooding following years of drought conditions (Mainly Wet ponds). First, rewetting sediments increases the amount of labile DOC due to decomposition of flooded soils and vegetation growth in dried wetlands during periods of drought (Lundquist et al. 1999; Graham et al. 2013). We observed higher DOC in our Mainly Wet ponds (range = 15.0–181.8, mean = 63.9) than in the Mainly Dry ponds (range = 10.6–158.0 mg·L−1, mean = 50.0 mg·L−1; p = 0.030) and this correlated with [MeHg] (Figs. 4 and 5A). As well, infrequent, yet major, hydrological events (including snow melt and intense precipitation events) may result in temporary flooding of soils and terrestrial or riparian vegetation leading to increased DOC concentrations (cited in Brothers et al. 2014; Raymond et al. 2016; Pang et al. 2021). As such, because flooding of organic matter stimulates MeHg methylation (Hall et al. 2005; Windham-Myers et al. 2014; Eckley et al. 2015; Herrero Ortega et al. 2018), this high-quality, labile DOC can support increased microbial activity and Hg bioavailability to cells (Kelly et al. 1997; Hall and St. Louis 2004; St. Louis et al. 2004; Bravo and Cosio 2020). In a study examining the impact of the length of hydroperiod on [MeHg] on similar types of prairie ponds at Lostwood Reserve in North Dakota, Sando et al. (2007) found that whole water [MeHg] and %MeHg values were generally higher in seasonal and semipermanent wetlands compared to those from temporary and permanent wetlands. This was attributed to increased methylation due to the stimulation of the anaerobic microbial community following reflooding of dried ponds. Similar studies in the Everglades have also shown increases in [MeHg] in response elevated oxidized S due to wet–dry cycles (Krabbenhoft and Fink 2000; Janssen et al. 2022).
Fig. 5.

Second, water-level declines expose anoxic wetland sediments or inundated soils to oxygen, thereby changing redox conditions (Coleman Wasik et al. 2015) resulting in the oxidation of sulfide to SO4−2, a required substrate for SRB methylators. After such, rewetting and re-establishment of anoxic conditions, may stimulate MeHg production rates (Eckley et al. 2015). At the SDNWA, Hoggarth et al. (2015) found that ponds with elevated SO4−2 concentrations had elevated MeHg concentrations compared to ponds with lower SO4−2 concentrations, but found no significant difference in potential rates of MeHg production with the use of stable Hg isotope sediment incubations. The elevated SO4−2 sites in Hoggarth et al. (2015) correspond to our Mainly Wet ponds which had SO4−2 concentrations ranges that were an order of magnitude higher than those in the Mainly Dry ponds (range = 0.19–2184 and 0.04–176 mg·L−1 and mean = 703.5 and 25.9 mg·L−1, respectively, Fig. 5B; p < 0.0001 for log [SO4−2]). A number of studies (Benoit et al. 1999; Li and Cai 2012; Poulin et al. 2017; Jones et al. 2020; Huang et al. 2022; Janssen et al. 2022) have led to the development of a general paradigm that lakes or wetlands with lower concentrations of SO4−2 have lower SRB activity, and therefore less MeHg production, whereas those with higher SO4−2 concentrations result in inhibition of methylation due to formation of insoluble Hg–sulfide complexes not bioavailable to methylating organisms (Gilmour et al. 1998). Although we suspect high sulfide concentrations may have been present based on occasional H2S odours and visual observation of black sediments, our data suggest that our sites may not fit this paradigm because Hoggarth et al. (2015) did not observe inhibition of potential methylation rates, and [MeHg] in sites with elevated SO4−2 were high compared to those in sites with lower SO4−2 concentrations. Prolonged flooding of the saline ring formed around the typical pond margin could also release SO4−2 into the pond while water levels are high (Mushet et al. 2018). Rates of SO4−2 reduction can be rapid in prairie wetland sediment with turnover of the porewater SO4−2 pool in hours to days (Dalcin Martins et al. 2017).
To further investigate the impact of S species on MeHg concentrations in our ponds, we used traditional geochemical speciation modelling. In the absence of details on DOC characterization, historic data from 18 ponds at SDNWA (Bam et al. 2019) were input into the geochemical modeling software Visual MINTEQ ver. 3.1 (Gustafsson 2014) to determine the dominant S species in anoxic bottom waters of our ponds. At pH = 8, models suggest that Hg species were dominated by small, ionic S containing species such as HgSH2− and HgS2−2 (Fig. S6). Under the assumption that bioavailable Hg enters methylating cells passively (which may or may not be the case; Hsu-Kim et al. 2013), ionic Hg species tend to be less bioavailable, and if our sites fit the accepted paradigm of inhibition of methylation in high S systems, we would have expected to see lower concentrations of MeHg in high SO4−2 sites. Higher MeHg concentrations in high SO4−2 sites suggest that the formation of HgS complexes are not rate limiting for MeHg production. It is possible that DOC is outcompeting sulfide species for Hg binding and facilitating MeHg production in high DOC, high SO4−2 sites.
The chemical composition of DOC also influences MeHg cycling in aquatic systems, in part because DOC and S species compete for Hg binding and thus controlling the ability of Hg to enter methylating cells (Miller et al. 2007). Highly complex aromatic moieties in DOC measured using SUVA mobilizes both inorganic and organic Hg facilitating increased inorganic Hg methylation and increased MeHg mobilization from sediments into other components of aquatic systems (Aiken et al. 2003, 2011). In our sites, SUVA ranged from 0.43 to 4.9 L mg·C−1·cm−1 and were not significantly different in Mainly Wet compared to Mainly Dry ponds (t test, p = 0.404 for SUVA; Fig. 5A). The range in SUVA values in our sites was similar to those in dark water systems that had significant relationships between MeHg concentrations and SUVA values (Louisiana wetlands range = 2.6–4.0 L mg·C−1·cm−1 (Hall et al. 2008), boreal lakes = 1.4–4.8 L mg·C−1·cm−1 (Bravo et al. 2016), and European lotic systems = 2.4–5.2 L mg·C−1·cm−1). The highest SUVA values in our sites were higher than those in North Dakota (1.2–2.1 L mg·C−1·cm−1 (Holloway et al. 2011)). Prairie wetland ponds typically experience intense irradiation due to long summer days, lower cloud cover, and reduced overhanging riparian or floating vegetation. As a result, due to intense photodegradation and despite high DOC concentrations, waters in many prairie ponds are not highly coloured and contain less aromatic and labile DOC (Waiser and Robarts 2004); however, some of our ponds do not follow this trend. Finally, more complex DOC (more complex DOC could be more aromatic, have more complicated active side groups, and be less bio- or photodegraded) in our Mainly Wet ponds may inhibit photolytic demethylation to a greater extent compared to less complex DOC in our Mainly Dry ponds, facilitating increased net MeHg concentrations in the water.
Investigating possible explanations on why prairie wetland ponds may not fit the accepted model is on-going in our lab, including the identification of putative methylating and demethylating microbes in ponds with differing MeHg properties and on-going studies investigating how DOC with different in optical characteristics may clarify the role of DOC composition in Hg cycling in SDNWA ponds.
Conclusion
Wetland ponds in the SDNWA region exhibit a large amount of hydrological and geochemical diversity. Due to the regional nature of our study sites, we assume that our sites receive similar amounts of atmospheric Hg deposition. Despite this, MeHg concentrations and %MeHg in whole water differed among our sites (Fig. 2). Average MeHg concentrations and %MeHg were higher in water from ponds surrounded with established grass or organic farming (Fig. 3). A stronger relationship was observed with water level patterns where average [MeHg] and %MeHg were significantly higher in the Mainly Wet ponds compared to the Mainly Dry ponds (Fig. 4). Higher [MeHg] in Mainly Wet ponds were correlated with much higher DOC and SO4−2 concentrations and higher SUVA of DOC (Fig. 5).
The majority of studies examining Hg cycling in freshwater systems have led to a widely accepted conceptual model of Hg cycling in temperature-stratified lakes in the Boreal region. In this model, there is clear evidence of the importance of atmospheric and catchment inputs of inorganic mercury which lead to the production of MeHg by SRB in the anoxic sediments. Recently, Branfireun et al. (2020) has suggested that this paradigm may not adequately explain important processes controlling MeHg production in the systems not defined as temperate, stratified lakes. We suggest that prairie wetland systems may lie outside the accepted paradigm. Our lab is currently exploring the microbial communities with the goal of identifying and comparing putative methylating and demethylating organisms in our Mainly Wet and Mainly Dry ponds. There may also be redox situations that are preventing the formation of insoluble complexes which may be impacting the bioavailability of Hg to methylating organisms. Finally, we suspect that photosynthetic biofilms may play an important role in MeHg production possibly due to anaerobic niches within habitats that are rich in microbial resources.
This work is also important because our work shows that hydrologically induced changes in SO4−2 and DOC substrates may lead to increases in net MeHg available to biota in aquatic systems. In the North American Great Plains, projected climate change scenarios will be spatiotemporally heterogeneous (Zhang et al. 2021), and include increased temperatures and intensified hydrological cycles (anticipated to increase the frequency of both drought and deluge (Millett et al. 2009), changes to UV exposure (Van Meter and Basu 2015), and plant community shifts (Dieleman et al. 2015)) all of which have the potential to change the geochemical parameters influencing net methylation. Land management, such as consolidation drainage, may favour wetlands of the mainly wet type with relatively stable water levels and loss of wetlands of the mainly dry type (McCauley et al. 2015; Anteau et al. 2016). Examining environmental factors regulating MeHg production in prairie wetlands is vital to addressing fundamental gaps in understanding of environmental controls on the production of MeHg in general, and specifically, in prairie wetlands, and will provide information necessary to protect wildlife populations inhabiting these vulnerable habitats.
Acknowledgements
We thank L. Baron, R. Cooper, P. Humenchuk, J. Lawrence, and J. Reeve assisted with field sampling. MeHg samples were analyzed by Drs. J. Graydon and J. Kirk at the University of Alberta Biogeochemical Analytical Services Laboratory (BASL) and M. Collins and R. Tiller in Dr. B. Branfireun’s lab at Western University. L. Baron and P. Humenchuk analyzed the THg samples at the University of Regina (UofR). The BASL and UofR Environmental Quality Analysis Laboratory analyzed SO4−2 and DOC samples, respectively. Research was supported by grants from the National Science and Engineering Research Council of Canada to BDH. Publication costs supported by the President's Publication Grant to BDH. Access to the SDNWA was obtained via permits from Environment and Climate Change Canada. M. Loiselle, the Lebreque family and A. Denis granted access to wetlands on private lands. This research took place on Treaty 4 and 6 Territory and the homeland of the Métis/Michif Nation.
References
Aiken G.R., Haitzer M., Ryan J.N., Nagy K. 2003. Interactions between dissolved organic matter and mercury in the Florida Everglades. Journal de Physique IV, 107: 29–32.
Aiken G.R., Hsu-Kim H., Ryan J.N. 2011. Influence of dissolved organic matter on the environmental fate of metals, nanoparticles, and colloids. Environmental Science & Technology, 45: 3196–3201.
Anteau M.J., Wiltermuth M.T., van der Burg M.P., Pearse AT. 2016. Prerequisites for understanding climate-change impacts on northern prairie wetlands. Wetlands, 36(2): 299–307.
Arts M.T., Robarts R.D., Kasai F., Waiser M.J., Tumber V.P., Plante A., et al. 2000. The attenuation of ultraviolet radiation in high dissolved organic carbon waters of wetlands and lakes on the northern Great Plains. Limnology and Oceanography, 45(2): 292–299.
Bam E.K.P., Brannen R., Budhathoki S., Ireson A.M., Spence C., van der Kamp G. 2019. Meteorological, soil moisture, surface water, and groundwater data from the St. Denis National Wildlife Area, Saskatchewan, Canada. Earth System Science Data, 11(2): 553–563.
Bam E.K.P., Ireson A.M., van der Kamp G., Hendry J.M. 2020. Ephemeral ponds: are they the dominant source of depression-focused groundwater recharge? Water Resources Research, 56(3): e2019WR026640.
Barton K. 2009. Mu-MIn: multi-model inference. R Package version 0.12.2/r18.
Bates L.M., Hall B.D. 2012. Concentrations of methylmercury in invertebrates from wetlands of the Prairie Pothole Region of North America. Environmental Pollution, 160: 153–160.
Batt B.D., Anderson M.G., Anderson C.D., Caswell F.D. 1989. The use of prairie potholes by North American ducks. In Northern prairie wetlands. Edited by A.G. van der Valk. Iowa State University Press, Ames, IA. pp. 204–227.
Benoit J.M., Gilmour C.C., Mason R.P., Heyes A. 1999. Sulfide controls on mercury speciation and bioavailability to methylating bacteria in sediment pore waters. Environmental Science & Technology, 33: 951–957.
Bloom N.S. 1989. Determination of picogram levels of methylmercury by aqueous phase ethylation, followed by cryogenic gas chromatography with cold vapour atomic fluorescence detection. Canadian Journal of Fisheries and Aquatic Sciences, 46: 1131–1140.
Bodhinayake W., Si B.C. 2004. Near-saturated surface soil hydraulic properties under different land uses in the St. Denis National Wildlife Area, Saskatchewan, Canada. Hydrological Processes, 18: 2835–2850.
Branfireun B.A., Cosio C., Poulain A.J., Riise G., Bravo A.G. 2020. Mercury cycling in freshwater systems - an updated conceptual model. Science of the Total Environment, 745: 140906.
Bravo A.G., Cosio C. 2020. Biotic formation of methylmercury: a bio–physico–chemical conundrum. Limnology and Oceanography, 65(5): 1010–1027.
Bravo A.G., Bouchet S., Tolu J., Bjorn E., Mateos-Rivera A., Bertilsson S. 2016. Molecular composition of organic matter controls methylmercury formation in boreal lakes. Nature Communications, 8: 14255.
Brothers S., Köhler J., Attermeyer K., Grossart H.P., Mehner T., Meyer N., et al. 2014. A feedback loop links brownification and anoxia in a temperate, shallow lake. Limnology and Oceanography, 59(4): 1388–1398.
Cheng F.Y., Basu N.B. 2017. Biogeochemical hotspots: role of small water bodies in landscape nutrient processing. Water Resources Research, 53(6): 5038–5056.
Coleman Wasik J.K., Engstrom D.R., Mitchell C.P.J., Swain E.B., Monson B.A., Balogh S.J., et al. 2015. The effects of hydrologic fluctuation and sulfate regeneration on mercury cycling in an experimental peatland. Journal of Geochemical Research: Biogeosciences, 120(9): 1697–1715.
Conly F.M., van der Kamp G. 2001. Monitoring the hydrology of Canadian prairie wetlands to detect the effects of climate changed and land use changes. Environmental Monitoring and Assessment, 67: 195–215.
Conly F.M., Su M., van der kamp G., Millar J.B. 2004. A practical approach to monitoring water levels in prairie wetlands. Wetlands, 24(1): 219–226.
Cooke C.A., Martínez-Cortizas A., Bindler R., Sexauer Gustin M. 2020. Environmental archives of atmospheric Hg deposition – a review. Science of the Total Environment, 709: 134800.
Curtis P.J., Adams H.E. 1995. Dissolved organic matter quantity and quality from freshwater and saltwater lakes in Alberta. Biogeochemistry, 30: 59–76.
Dalcin Martins P., Hoyt D.W., Bansal S., Mills C.T., Tfaily M., Tangen B.A., et al. 2017. Abundant carbon substrates drive extremely high sulfate reduction rates and methane fluxes in Prairie Pothole Wetlands. Global Change Biology, 23(8): 3107–3120.
Daniel J., Rooney R.C., Robinson D.T. 2022. Climate, land cover and topography: essential ingredients in predicting wetland permanence. Biogeosciences, 19(5): 1547–1570.
De la Cruz A.A. 1979. Production and transport of detritus in wetlands. In Wetland functions and values: the state of our understanding. Edited by P.E. Greeson.
Dieleman C.M., Branfireun B.A., McLaughlin J.W., Lindo Z. 2015. Climate change drives a shift in peatland ecosystem plant community: implications for ecosystem function and stability. Global Change Biology, 21(1): 388–395.
Drott A., Lambertsson L., Bjorn E., Skyllberg U. 2007. Importance of dissolved neutral mercury sulfides for methyl mercury production in contaminated sediments. Environmental Science & Technology, 2007: 2270–2276.
Eagles-Smith C.A., Silbergeld E.K., Basu N., Bustamante P., Diaz-Barriga F., Hopkins W.A., et al. 2018. Modulators of mercury risk to wildlife and humans in the context of rapid global change. Ambio, 47(2): 170–197.
Eckley C.S., Luxton T.P., McKernan J.L., Goetz J., Goulet J. 2015. Influence of reservoir water level fluctuations on sediment methylmercury concentrations downstream of the historical Black Butte mercury mine, OR. Applied Geochemistry, 61: 284–293.
Euliss N.H., Mushet D.M. 1996. Water-level fluctuations in wetlands as a function of landscape condition in the prairie pothole region. Wetlands, 16(4).
Fay P.A., Guntenspergen G.R., Olker J.H., Johnson W.C. 2016. Climate change impacts on freshwater wetland hydrology and vegetation cover cycling along a regional aridity gradient. Ecosphere, 7(10): e01504.
French T.D., Houben A.J., SDesforges J.-P.W., Kimpe L.E., Kokelj S.V., Poulain A., et al. 2014. Dissolved organic carbon thresholds affect mercury bioaccumulation in Arctic lakes. Environmental Science & Technology, 48(6): 3162–3168.
Gilmour C.C., Riedel G.S., Ederington M.C., Bell J.T., Benoit J.M., Gill G.A., et al. 1998. Methylmercury concentrations and production rates across a trophic gradient in the northern Everglades. Biogeochemistry, 40(2/3): 327–345.
Gilmour C.C., Podar M., Bullock A.L., Graham A.M., Brown S., Somenahally A.C., et al. 2013. Mercury methylation by novel microorganisms from new environments. Environmental Science & Technology, 47(20): 11810–11820.
Gorski P.R., Armstrong D.E., Hurley J.P., Krabbenhoft D.P. 2008. Influence of natural dissolved organic carbon on the bioavailability of mercury to a freshwater alga. Environmental Pollution, 1–8.
Government of Canada. 2022. St. Denis National Wildlife Area [online]. Available from https://www.canada.ca/en/environment-climate-change/services/national-wildlife-areas/locations/st-denis.html [accessed January 2020].
Graham A.M., Aiken G.R., Gilmour C.C. 2013. Effect of dissolved organic matter source and character on microbial Hg methylation in Hg-S-DOM solutions. Environmental Science & Technology, 47: 5746–5754.
Gustafsson J.P. 2014. Visual MINTEQ ver. 3.1. Available from https://vminteq.lwr.kth.se/ [accessed February 2023].
Hall B.D., St. Louis V.L. 2004. Methylmercury and total mercury in plant litter decomposing in upland forests and flooded landscapes. Environmental Science & Technology, 38: 5010–5021.
Hall B.D., St. Louis V.L., Rolfhus K.R., Bodaly R.A., Beaty K.G., Paterson M.J., et al. 2005. The impact of reservoir creation on the biogeochemical cycling of methyl and total mercury in boreal upland forests. Ecosystems, 8: 248–266.
Hall B.D., Aiken G.R., Krabbenhoft D.P., Marvin-Dipasquale M., Swarzenski C.M. 2008. Wetlands as principal zones of methylmercury production in Southern Louisiana and the Gulf of Mexico region. Environmental Pollution, 154: 124–134.
Hall B.D., Baron L.A., Somers C.M. 2009. Mercury concentrations in surface water and harvested waterfowl from the prairie pothole region of Saskatchewan. Environmental Science & Technology, 43: 8759–8766.
Hamelin S., Amyot M., Barkay T., Wang Y., Planas D. 2011. Methanogens: principal methylators of mercury in lake periphyton. Environmental Science & Technology, 45(18): 7693–7700.
Hammerschmidt C.R., Fitzgerald W.F., Balcom P.H., Visscher P. 2008. Organic matter and sulfide inhibit merhylmercury production in sediments of New York/New Jersey Harbor. Marine Chemistry, 109: 165–182.
Hanesiak J.M., Stewart R.E., Bonsal B.R., Harder P., Lawford R., Aider R., et al. 2011. Characterization and summary of the 1999–2005 Canadian prairie drought. Atmosphere Ocean, 49(4): 421–452.
Hayashi M., Van der Kamp G., Rosenberry D.O. 2016. Hydrology of prairie wetlands: understanding the integrated surface-water and groundwater processes. Wetlands, 36(Suppl 2): 237–254.
He M., Tian L., Braaten H.F.V., Wu Q., Luo J., Cai L.-M., et al. 2019. Mercury–organic matter interactions in soils and sediments: angel or devil? Bulletin of Environmental Contamination and Toxicology, 102(5): 621–627.
Herrero Ortega S., Catalán N., Björn E., Gröntoft H., Hilmarsson T.G., Bertilsson S., et al. 2018. High methylmercury formation in ponds fueled by fresh humic and algal derived organic matter. Limnology and Oceanography, 63(S1): S44–S53.
Hoggarth C.G.J., Mitchell C.P.J., Hall B.D. 2015. Mercury methylation in high and low-sulphate impacted wetland ponds within the prairie pothole region of North America. Environmental Pollution, 205: 269–277.
Holloway J.M., Goldhaber M.B., Mills C.T. 2011. Carbon and nitrogen biogeochemistry of a Prairie Pothole wetland, Stutsman County, North Dakota, USA. Applied Geochemistry, 26: S44–S47.
Horvat M., Bloom N.S., Liang L. 1993. Comparison of distillation with other current isolation methods for the determination of methyl mercury compounds in low level environmental samples: Part I. Sediments. Analytica Chimica Acta, 281: 135–172.
Hsu-Kim H., Kucharzyk K.H., Zhang T., Deshusses M.A. 2013. Mechanisms regulating mercury bioavailability for methylating microorganisms in the aquatic environment: a critical review. Environmental Science & Technology, 47(6): 2441–2456.
Huang H., Mangal V., Rennie M.D., Tong H., Simpson M.J., Mitchell C.P.J. 2022. Mercury methylation and methylmercury demethylation in boreal lake sediment with legacy sulphate pollution. Environmental Sciences: Processes and Impacts.
Janssen S.E., Tate M.T., Poulin B.A., Krabbenhoft D.P., DeWild J.F., Ogorek J.M., et al. 2022. Decadal trends of mercury cycling and bioaccumulation within Everglades National Park. Science of the Total Environment, 838: 156031.
Johnson W.C., Millett B.V., Gilmanov T., Voldseth R.A., Guntenspergen G.R., Naugle D.E. 2005. Vulnerability of northern prairie wetlands to climate change. BioScience, 55(10): 863–872.
Jones D.S., Johnson N.W., Mitchell C.P.J., Walker G.M., Bailey J.V., Pastor J., et al. 2020. Diverse communities of hgcAB+ microorganisms methylate mercury in freshwater sediments subjected to experimental sulfate loading. Environmental Science & Technology, 54(22): 14265–14274.
Kelly C.A., Rudd J.W.M., Bodaly R.A., Roulet N.T., St. Louis V.L., Heyes A., et al. 1997. Increases in fluxes of greenhouse gases and methyl mercury following flooding of an experimental reservoir. Environmental Science & Technology, 31: 1334–1344.
Kelly C.A., Rudd J.W.M., Holoka M.H. 2003. Effect of pH on mercury uptake by an aquatic bacterium: implications for Hg cycling. Environmental Science & Technology, 37(13): 2941–2946.
Kiss J., Bedard-Haughn A. 2021. Predictive mapping of solute rich wetlands in the Canadian Prairie Pothole Region through high resolution digital elevation model analyses. Wetlands, 41(3): 38.
Krabbenhoft D.P., Fink LE. The effect of dry down and natural fires on mercury methylation in the Florida Everglades. International Conference on Heavy Metals in the Environment, Ann Arbour, MI.
LaBaugh J.W. 1989. Chemical characteristics of water in northern prairie wetlands. In Nothern prairie wetlands. Edited by A.G. van der Valk. Iowa State University Press, Ames, IA. pp. 56–90.
LaBaugh J.W., Winter T.C. 1984. The impact of uncertainties in the hydrologic measurment on phosphorus budgets and empirical models for two Colorado reservoirs. Limnology and Oceanography, 29(2): 322–339.
Li Y., Cai Y. 2012. Progress in the study of mercury methylation and demethylation in aquatic environments. Chinese Science Bulletin, 58(2): 177–185.
Liang L., Horvat M., Bloom N.S. 1994. An improved speciation method for mercury by GC/CVAFS after aqueous phase ethylation and room temperature precollection. Talanta, 41(3): 371–379.
Lundquist E.J., Jackson L.E., Scow K.M. 1999. Wet–dry cycles affect dissolved organic carbon in two California agricultural soils. Soil Biology and Biochemistry, 31(7): 1031–1038.
McCauley L.A., Anteau M.J., van der Burg M.P., Wiltermuth M.T. 2015. Land use and wetland drainage affect water levels and dynamics of remaining wetlands. Ecosphere, 6(6): art92.
Miller C.L., Mason R.P., Gilmour C.C., Heyes A. 2007. Influence of dissolved organic matter on the complexation of mercury under sulfidic conditions. Environmental Toxicology and Chemistry, 26(4): 624–633.
Millett B.V., Johnson W.C., Guntenspergen G. 2009. Climate trends of the North America prairie pothole region 1906-2000. Climatic Change, 93: 243–267.
Murkin H.R. 1989. The basis for food chains in prairie wetlands. In Northern prairie wetlands. Edited by A.G. Van der Valk. Iowa State University Press, Ames, Iowa. pp. 316–338.
Mushet D.M., McKenna O.P., LaBaugh J.W., Euliss N.H., Rosenberry D.O. 2018. Accommodating state shifts within the conceptual framework of the wetland continuum. Wetlands, 38(3): 647–651.
Nachson U., Ireson A., van der Kamp G., Davies S.R., Wheater H.S. 2014. Impacts of climate variability on wetlands salinization in the North American prairies. Hydrology and Earth System Sciences, 18: 1251–1263.
Negm A., Abdrakhimova P., Hayashi M., Rasouli K. 2021. Effects of climate change on depression-focused groundwater recharge in the Canadian Prairies. Vadose Zone Journal, 20(5): e20153.
Obrist D., Kirk J.L., Zhang L., Sunderland E.M., Jiskra M., Selin N.E. 2018. A review of global environmental mercury processes in response to human and natural perturbations: changes of emissions, climate, and land use. Ambio, 47(2): 116–140.
Olson M.L., Cleckner L.B., Hurley J.P., Krabbenhoft D.P., Heelan T.W. 1997. Resolution of matrix effects on analysis of total and methyl mercury in aqueous samples from the Florida Everglades. Fresenius Journal of Analytical Chemistry, 358: 392–396.
Oremland R.S., Culbertson C.W., Winfrey M.R. 1991. Methylmercury decomposition in sediments and bacterial cultures: involvement of methanogens and sulfate reducers in oxidative demethylation. Applied and Environmental Microbiology, 57(1): 130–137.
Pang Y., Wang K., Sun Y., Zhou Y., Yang S., Li Y., et al. 2021. Linking the unique molecular complexity of dissolved organic matter to flood period in the Yangtze River mainstream. Science of the Total Environment, 764: 142803.
Pennock D., Yates T., Bedard-Haughn A., Phipps K., Farrell R., McDougal R. 2010. Landscape controls on N2O and CH4 emissions from freshwater mineral soil wetlands of the Canadian Prairie Pothole region. Geoderma, 155(3–4): 308–319.
Peterson B.D., McDaniel E.A., Schmidt A.G., Lepak R.F., Janssen S.E., Tran P.Q., et al. 2020. Mercury methylation genes identified across diverse anaerobic microbial guilds in a eutrophic sulfate-enriched lake. Environmental Science & Technology, 54(24): 15840–15851.
Poulin B.A., Gerbig C.A., Kim C.S., Stegemeier J.P., Ryan J.N., Aiken G.R. 2017. Effects of sulfide concentrations and dissolved organic matter characteristics on the structure of nanocolloidal metacinnabar. Environmental Science & Technology, 51: 13133–13142.
R Development Core Team. 2013. R: a language and environment for statistical computing. R Foundation for Statistical Computing, Vienna, Austria.
Raymond P.A., Saiers J.E., Sobczak W.V. 2016. Hydrological and biogeochemical controls on watershed dissolved organic matter transport: pulse-shunt concept. Ecology, 97(1): 5–16.
Sando S.K., Krabbenhoft D.P., Johnson K.M., Lundgrean R.F., Emerson D.G. 2007. Mercury and methylmercury in water and bottom sediments of wetlands at Lostwood National Wildlife Refuge, North Dakota, 2003–2004. U.S. Department of the Interior/U.S. Geological Survey. USGS Scientific Investigations Report 2007–5219. pp. 74.
Sellers P., Kelly C.A., Rudd J.W.M., Machutchon A. 1996. Photodegradation of methylmercury in lakes. Nature, 380: 694–697.
Shanley J.B., Taylor V.F., Ryan K.A., Chalmers A.T., Perdrial J., Stubbins A. 2022. Using dissolved organic matter fluorescence to predict total mercury and methylmercury in forested headwater streams, Sleepers River, Vermont USA. Hydrological Processes, 36(5):e14572.
Shaw S.P., Fredine C.G. 1956. Wetlands of the United States - their extent and their value to waterfowl and other wildlife. U.S. Department of the Interior, Washington, D.C. Circular 39. Northern Prairie Wildlife Research Center Online.
St. Louis V.L., Rudd J.W.M., Kelly C.A., Beaty K.G., Bloom N.S., Flett R.J. 1994. Importance of wetlands as sources of methyl mercury to boreal forest ecosystems. Canadian Journal of Fisheries and Aquatic Sciences, 51: 1065–1076.
St. Louis V.L., Rudd J.W.M., Kelly C.A., Bodaly R.A., Harris R. 2004. The rise and fall of mercury methylation in an experimental reservoir. Environmental Science & Technology, 38(5): 1348–1358.
Stainton M.P., Capel M.J., Armstrong F.A.J. 1977. The chemical analysis of fresh water. pp. 166.
Swain S., Hayhoe K. 2015. CMIP5 projected changes in spring and summer drought and wet conditions over North America. Climate Dynamics, 44(9): 2737–2750.
Tang W.-L., Liu Y.-R., Guan W.-Y., Zhong H., Qu X.-M., Zhang T. 2020. Understanding mercury methylation in the changing environment: Recent advances in assessing microbial methylators and mercury bioavailability. Science of the Total Environment, 714: 136827.
United States Environmental Protection Agency (U.S. EPA). 2002. Method 1631: Mercury in water by oxidation, purge and trap, and cold vapor atomic fluorescence spectrometry, Revision E. EPA 821-R-95-027. Office of Water, Washington, DC.
van der Kamp G., Hayashi M. 2009. Groundwater-wetland ecosystem interaction in the semiarid glaciated plains of North America. Hydrogeology Journal, 17(1): 203–214.
van der Kamp G., Stolte W.J., Clark R.G. 1999. Drying out of small prairie wetlands after conversion of their catchments from cultivation to permanent brome grass. Hydrological Sciences Journal, 44: 387–397.
van der Kamp G., Hayashi M., Gallén D. 2003. Comparing the hydrology of grassed and cultivated catchments in the semi-arid Canadian prairies. Hydrological Processes, 17: 559–575.
van der Valk A.G. 1989. Northern prairie wetlands. Iowa State University Press, Ames, IO.
van der Valk A.G. 2005. Water-level fluctuations in North America prairie wetlands. Hydrobiologia, 539: 171–188.
Van Meter K.J., Basu NB. 2015. Signatures of human impact: size distributions and spatial organization of wetlands in the Prairie Pothole landscape. Ecological Applications, 25(2): 451–465.
Waiser M.J. 2006. Relationship between hydrological characteristics and dissolved organic carbon concentration and mass in northern prairie wetlands using a conservative tracer approach. Journal of Geophysical Research: Biogeosciences, 111(G2).
Waiser M.J., Robarts R.D. 2004. Photodegradation of DOC in a shallow prairie wetland: Evidence from seasonal changes in DOC optical properties and chemical characteristics. Biogeochemistry, 69: 263–284.
Wang Y., Liu J., Liem-Nguyen V., Tian S., Zhang S., Wang D., et al. 2022. Binding strength of mercury (II) to different dissolved organic matter: the roles of DOM properties and sources. Science of the Total Environment, 807: 150979.
Wickham H., François R., Henry L., Müller K. 2021. dplyr: a grammar of data manipulation. R package version 1.0.5.
Windham-Myers L., Fleck J.A., Ackerman J.T., Marvin-DiPasquale M., Stricker C.A., Heim W.A., et al. 2014. Mercury cycling in agricultural and managed wetlands: a synthesis of methylmercury production, hydrologic export, and bioaccumulation from an integrated field study. Science of the Total Environment, 484: 221–231.
Winfrey M.R., Rudd J.W.M. 1990. Environmental factors affecting the formation of methylmercury in low pH lakes. Environmental Toxicology and Chemistry, 9: 853–869.
Winter T.C. 1989. Hydrologic studies of wetlands in the northern prairie. In Northern prairie wetlands. Edited by A.G. van der Valk. Iowa State University Press, Ames, IA. pp. 16–24.
Woo M.-K., Rowsell R.D. 1993. Hydrology of a prairie slough. Journal of Hydrology, 146: 175–207.
Yu R.-Q., Barkay T. 2022. Chapter Two - Microbial mercury transformations: molecules, functions and organisms. In Advances in applied microbiology. Edited by G.M. Gadd, S. Sariaslani. Academic Press. pp. 31–90.
Zhang Z., Bortolotti L.E., Li Z., Armstrong L.M., Bell T.W., Li Y. 2021. Heterogeneous changes to wetlands in the Canadian prairies under future climate. Water Resources Research, 57(7): e2020WR028727.
Zhao L., Chen H., Lu X., Lin H., Christensen G.A., Pierce E.M., et al. 2017. Contrasting effects of dissolved organic matter on mercury methylation by Geobacter sulfurreducens PCA and Desulfovibrio desulfuricans ND132. Environmental Science & Technology, 51(18): 10468–10475.
Supplementary material
Supplementary Material 1 (DOC / 567 KB).
- Download
- 567.50 KB
Information & Authors
Information
Published In

FACETS
Volume 8 • January 2023
Pages: 1 - 14
History
Received: 28 July 2022
Accepted: 24 January 2023
Version of record online: 1 June 2023
Notes
The article was originally published with minor errors in figure 4 which have now been corrected.
Copyright
© 2023 The Author(s). This work is licensed under a Creative Commons Attribution 4.0 International License (CC BY 4.0), which permits unrestricted use, distribution, and reproduction in any medium, provided the original author(s) and source are credited.
Data Availability Statement
Data generated or analyzed during this study are available from the corresponding author upon reasonable request.
Key Words
Sections
Subjects
Authors
Author Contributions
Conceptualization: BDH
Data curation: LMB, SAB, JDS, CGJH
Formal analysis: BDH, SL, JDS
Funding acquisition: BDH
Methodology: BDH
Project administration: BDH
Writing – original draft: BDH
Writing – review & editing: BDH, CGJH, LMB, SAB, JDS, AMI
Competing Interests
The authors declare there are no competing interests.
Metrics & Citations
Metrics
Other Metrics
Citations
Cite As
Britt D. Hall, Sichen Liu, Cameron G.J. Hoggarth, Lara M. Bates, Stacy A. Boczulak, Jamie D. Schmidt, and Andrew M. Ireson. 2023. Wet–dry cycles influence methylmercury concentrations in water in seasonal prairie wetland ponds. FACETS.
8(): 1-14. https://doi.org/10.1139/facets-2022-0168
Export Citations
If you have the appropriate software installed, you can download article citation data to the citation manager of your choice. Simply select your manager software from the list below and click Download.
There are no citations for this item