How might climate change impact water safety and boil water advisories in Canada?
Abstract
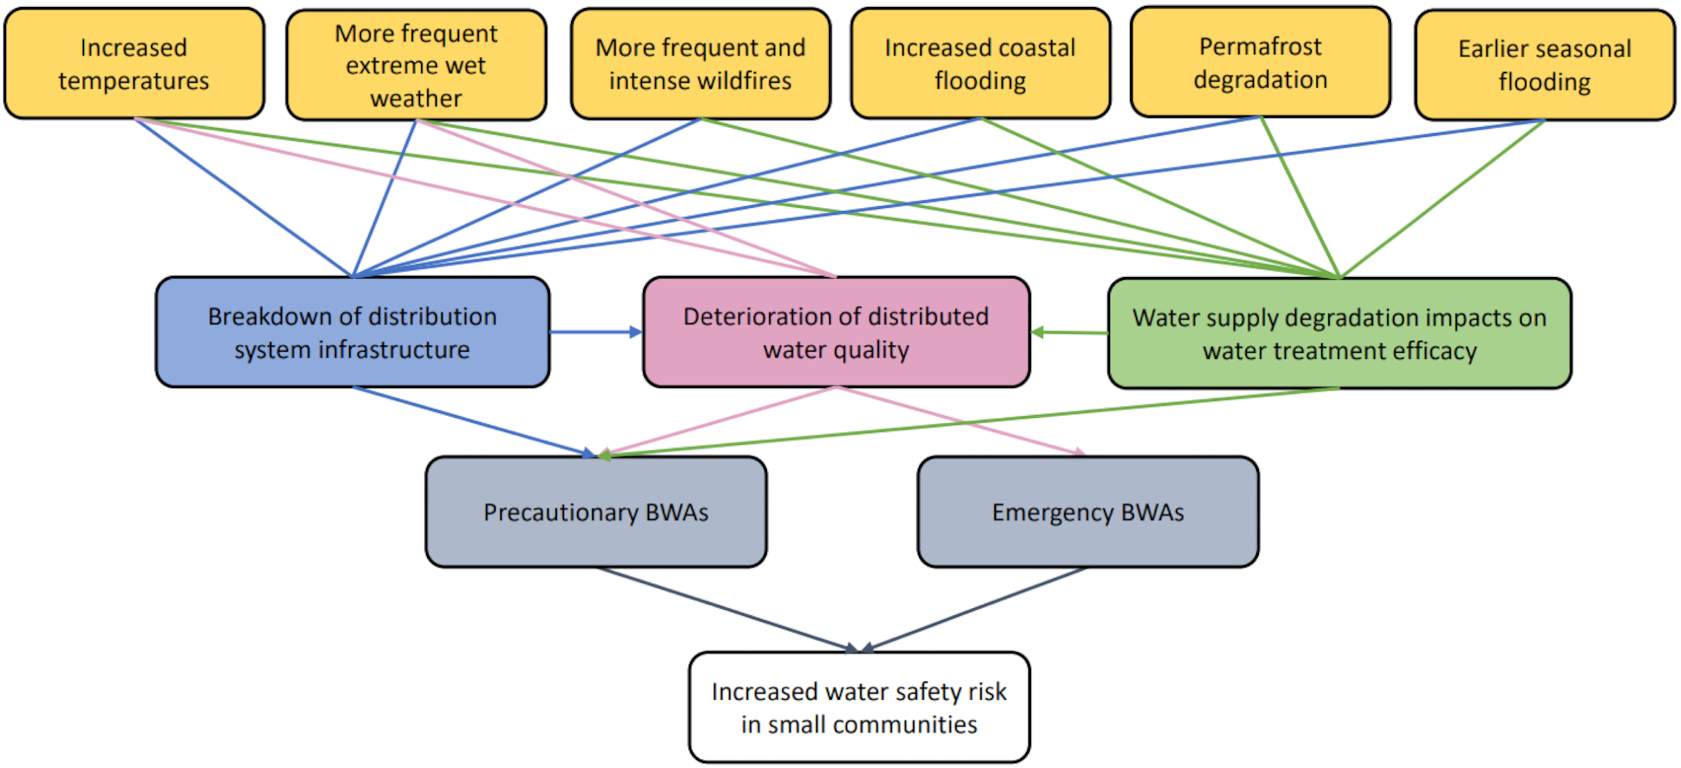
A boil water advisory (BWA) informs the public that there is an increased level of risk associated with their water and that they should boil it before consuming. Studies show that small communities in Canada are particularly likely to experience repeat and long-term BWAs. Climate change has led to changes in precipitation and temperature patterns, leading to region-specific impacts such as increased frequency, severity, or variance in floods, forest fires, droughts, freezing rain, and sea water intrusion. Academic and non-academic “grey” literature was reviewed to establish the most likely impacts of climate change on water treatment and infrastructure. Anonymized data from public drinking water systems in Canada was analyzed to determine the most common causes of BWAs between 2005 and 2020. Most BWAs reported were related to breakdowns/malfunctions along the distribution, though inadequate disinfection residual and turbidity or coliforms in the treated water were also common. Furthermore, statistical analysis of the data showed seasonal trends in some of these parameters. The results of this study suggest that increased precipitation, flooding, permafrost degradation, and forest fires are likely to have significant impacts on water safety in Canada.
Highlights:
•
Climate change effects are expected to worsen many current water challenges.
•
Climate change will disproportionately impact small, rural, and remote water utilities.
•
Water distribution systems are the main source of water safety risk in Canada.
•
Groundwater-supplied systems experience a disproportionate number of BWAs.
•
Seasonal trends in BWA reasons provide opportunities for targeted mitigation.
Graphical Abstract
1. Introduction
Drinking water safety is a persistent concern in small, rural, remote, and Indigenous communities in Canada (Health Canada 2015; Lane and Gagnon 2020; Environment and Climate Change Canada 2022). Boil water advisories (BWAs) are public announcements advising users that they should boil their drinking water prior to consumption to eliminate any suspected or confirmed disease-causing microorganisms in the water (Health Canada 2015). Emergency BWAs are issued in response to confirmed detection indicators of fecal contamination in distributed drinking water (Health Canada 2015). Precautionary BWAs are issued when one of the steps from the source to the tap has the potential to cause fecal contamination of distributed drinking water, including source water quality or quantity changes; insufficient, poorly operated, or malfunctioning water treatment equipment; and damaged distribution system infrastructure (Health Canada 2015). Common themes reported in previous water safety studies in Canada include the lack of consistent BWA-reporting methods from one jurisdiction to the next, the challenge of compiling and completing accurate data sets, and inconsistent reporting formats across federal and provincial jurisdictions (Lane and Gagnon 2020). This results in issues and gaps in data sets, making it difficult to accurately understand and address the problems that underlie BWAs in Canada. Complete Canada-wide data sets for either municipal, private, or Indigenous (First Nations, Métis, and Inuit) water systems are difficult for the public to access or non-existent (Lane and Gagnon 2020), though it should be noted that due to the federal government’s initiative to end all BWAs in First Nation communities by 2021, several academic and government-commissioned studies have highlighted and made recommendations to address BWA trends over time in these communities (e.g., Lane and Gagnon 2020).
BWAs are intended to be used as short-term public health interventions, and repeat and long-term BWAs can diminish users’ trust of their drinking water (Health Canada 2015; Minnes and Vodden 2017). Lack of trust in drinking water quality and safety can push users towards more expensive options like bottled water (Doria 2006; Castleden et al. 2015) or motivate people to collect water from untreated streams and springs, though the latter can also be driven by local preferences and cultural traditions (Goldhar et al. 2013). BWAs can also introduce safety concerns such as an increased risk of scalding when consumers are boiling and using the water and can have economic impacts on local businesses and services (Health Canada 2015). Under most circumstances, it is not necessary to boil tap water for non-consumptive household purposes such as bathing, showering, laundry, or washing dishes. However, in the event of a confirmed waterborne outbreak, it may be necessary to take additional precautions, some of which can be difficult, tedious, and(or) expensive for consumers to comply with, especially for long periods of time (Health Canada 2015).
The warming of the Earth and the effects of changing climate over several decades has been linked to changes in the hydrological cycle, including increasing atmospheric water vapour content; changing precipitation patterns, intensity, and extremes; reduced snow cover and widespread melting of ice, including glaciers; and changes in soil moisture and runoff (Bates et al. 2008). In Canada, the expected effects of climate change include substantially higher mean annual and seasonal temperatures, increased incidence and frequency of excess heat, extreme wet weather events, sea level rise and increased coastal flooding, more frequent and severe forest fires, and permafrost degradation, among others (Bush et al. 2022). The extent and timelines of these changes will depend on whether and how soon greenhouse gas emissions are reduced across the world and how different interrelated climate factors interact with one another (Bush et al. 2022). Some of these climate change effects are likely to impact the integrity and operation of water infrastructure and may therefore impact the number, length, and types of BWAs issued in Canada, a fact that is beginning to be reflected in design standards in some parts of Canada. An example of this is the Atlantic Canada Water Supply Guidelines (Koljin 2021; ACWWA 2022). The potential effects of extreme weather events related to climate change on drinking water infrastructure, water quality, and the frequency of BWAs has only begun to be explored in the academic literature. A series of recent government and non-governmental reports have highlighted the potential impacts of climate change phenomena on water infrastructure (Swanson et al. 2021; Bush et al. 2022). Our study aimed to identify the most common causes of BWAs in Canada, highlight the likely impacts of climate change on drinking water infrastructure, and explore how climate change phenomena might affect the overall number and underlying causes of BWAs in Canada.
This study was the first to conduct a Canada-wide assessment of the potential impacts of climate change on water safety as indicated by the reasons, frequency, and length of BWAs and to conduct an in-depth statistical analysis of the seasonality of BWA reasons in Canada. This study consists of an in-depth review of academic and industry-related literature related to water safety and climate change with a focus on factors relevant to Canada. Various keywords were used to identify academic and grey literature that provided an understanding of the current implications of climate change in Canada, as well as their relation and impacts on water safety. A review and analysis of historical BWA records from the Canadian Network of Public Health Intelligence (CNPHI), a public health surveillance and alerting resource of the Public Health Agency of Canada (PHAC), was conducted to determine the leading causes of BWAs in Canada. The data were aggregated and analysed based on various parameters, such as population, reason for BWA, and water source, to identify trends and consistencies within each parameter and with each other. This review also consisted of a statistical analysis of historical BWA records using X12 ARIMA decomposition followed by the Mann–Kendall test. The anticipated impacts of this study are to provide a high-level assessment of the potential impacts of climate change on water safety and BWAs in Canada.
2. Methodology
2.1. Literature review methodology
Four major scholar databases (Omni, Scholars Portal, ProQuest, and EBSCOhost) related to environmental science and engineering as well as a search engine (Google Scholar) were used to identify literature related to climate change, BWAs, and water quality. The analysis of historical BWA records, as described later in this section, was used to identify relevant key search words and literature, which included boil water advisories, climate change, water, water quality, coliforms, and extreme weather. These keywords were searched together, interchangeably, using the databases search method that allows for multiple terms to be searched in order of relevancy. The databases identified literature with these keywords in the titles, keywords, abstracts, and citations.
Information about BWAs and climate change is not limited to the peer-reviewed academic literature. Many high-quality “grey”, or non-academic, literature sources are publicly available and contain important information related to water safety and the potential impacts of climate change on drinking water infrastructure. These include the Intergovernmental Panel on Climate Change (IPCC) Sixth Assessment Report, Canada’s Changing Climate Report, reports prepared by reputable non-governmental organizations like the International Institute for Sustainable Development, and numerous Health Canada documents. The Public Infrastructure Engineering Vulnerability Committee (PIEVC) Engineering Protocol for Infrastructure Vulnerability Assessment and Adaptation to a Changing Climate and the United States Agency of International Development’s Climate Risk Screening and Management Tools (USAID 2017) were also reviewed for this study. The academic and industry literature sources consulted in this study were supplemented with interviews with industry experts who provided further insight into the intersections between water safety and climate change impacts in Canada. A total of 96 papers about the impacts of climate change on drinking water sources and infrastructure were reviewed in this study. Of these, 15 were about increasing temperatures, 30 were about flooding due to extreme weather and changes in snow and ice cover, 23 were about coastal flooding, 14 were about drought, 6 were about wildfires, and 8 were about permafrost degradation.
2.2. Review, analysis, and visualization of drinking water advisory data
Historical BWA records for drinking water systems across Canada were provided by the CNPHI, a public health surveillance and alerting resource of the PHAC. The data included information about BWAs issued from 4 February 2005 to 8 July 2021 in multiple Canadian jurisdictions and included 9825 records, each of which represented a single BWA. Each BWA record included information about the drinking water supply type, status, water quality reason, operational reason, estimated population affected, the dates when the BWA was issued and rescinded, and the drinking water source type.
A total of 1630 communities are represented in the database, but as a condition of the data sharing agreement with CNPHI the data was provided in an anonymized format and no information was provided about the location of the communities that experienced BWAs. According to the agency, anonymization was required because the data provided to CNPHI belongs to the individual agencies who collect and report it (Environment and Climate Change Canada 2022).
Jurisdiction over drinking water safety is primarily held by provincial and territorial governments in Canada; thus, BWA criteria and processes vary from one Canadian jurisdiction to the next, making it difficult to compare data from one region to another (Lane and Gagnon 2020). To overcome this, CNPHI assigns each BWA in their database a primary reason and a secondary “operational reason” that together can be used to aggregate data and explore BWA trends in Canada as a whole.
Primary reasons included measures of treated and(or) distributed water quality such as turbidity, Escherichia coli, total coliforms, and inadequate disinfection residual, as well as infrastructure-related reasons such as “line break and pressure loss in distribution system”, indicating a breakdown in the water distribution system or “significant deterioration of source water quality”. Some primary reasons, such as “exceedance of maximum accepted concentration” were open to interpretation. Secondary reasons included “planned system maintenance”, “treatment unable to cope with source water deterioration”, “power outage resulting in system power loss or reduced storage of treated water”, “contamination during construction, repair, or operation”, and “inadequate disinfection residual in distribution system”, among others. In 15% of cases, however, the primary reason was listed as “not applicable”, and in these instances, the secondary operational reason was assumed to be the primary reason for the BWA. Equation 1 summarizes this approach:
(1)
Primary reasons that accounted for less than 0.5% of all BWAs were removed from the analysis to simplify visualization and interpretation of the results. The resulting data set included 9728 individual BWA records.
Drinking water source types were categorized as groundwater, surface water, cistern or holding tank, groundwater under the influence of surface water (GUDI), hauled water, high-risk GUDI, potential GUDI, water pipeline, mixed (blended), unknown, and satellite system. GUDI is defined as a groundwater source that is located close enough to nearby surface water, such as a river or lake, to receive direct surface water recharge (Howe n.d.). The formal definition of GUDI differs from one jurisdiction to the next; however, GUDI is usually defined as any water beneath the surface of the ground with significant occurrence of insects; other macro-organisms, algae, organic debris, or large-diameter pathogens such as Giardia lamblia or Cryptosporidium; or significant and relatively rapid shifts in water characteristics such as turbidity, temperature, conductivity, or pH that clearly correlate to climatological or surface water conditions (Nova Scotia Enviroment n.d.). A water pipeline system is one where water is transported via a water pipe from another community’s water source. A satellite system is a drinking water system that receives water from another drinking water system through a service relationship or hub system. A cistern or holding tank is a waterproof receptacle for holding water. The provided data set may have contained some variations in source water identification, particularly pipeline, region distribution systems, partial area advisories, area-wide advisories, or blended systems. Consultation with CNPHI confirmed that pipeline, regional distribution system, satellite system, and blended system all referred to water systems that were fully or partially supplied by a water pipeline from outside of the community. Due to the anonymity of the database, it is unclear which advisories are for partial areas, a full city, or town.
Each BWA in the database was assigned an estimated population range by CNPHI. The smallest range was 0–100 people and the largest was >100 000.
The length of each BWA was computed by subtracting the date that the BWA was issued from the date that it was rescinded. In the case of BWAs that were ongoing at the end of the covered period (4 February 2005 to 8 July 2021), the length of the BWA was assumed to be the difference between the date that the BWA was issued from 1 July 2021.
All data visualizations were prepared in R using the ggplot2 and gridExtra packages. Time series analysis was conducted using MATLAB 2022b. X12 autoregressive moving average (ARIMA) filter (Findley et al. 1998) followed by the Mann–Kendall test being used to identify the presence of monotonic increasing or decreasing trends in the reasons why BWAs were called over time. The X12 ARIMA filter decomposes a time series into the trend, seasonal, and irregular components, which can then be evaluated separately. The presence of seasonality in BWA reasons was identified using the sample autocorrelation function and visualized using the X12 ARIMA filter. The autocorrelation function defines how data points in a time series are related on average to the preceding data points. All significance tests were conducted at the 95% confidence level.
3. Review of literature about the potential impacts of climate change on water infrastructure and water safety in Canada
Around the world, climate change effects such as increased temperatures, sea level rise, flooding, drought, forest fires, and permafrost thaw are expected to exacerbate many of the challenges that water utilities face today. This is especially true in rural and remote communities, which often lack the financial and operational capacity to maintain or replace aging infrastructure and the flexibility to respond to extreme weather events (Warren and Lulham 2021). Our discussion is mostly limited to national trends in Canada because the national, anonymous BWA database provided by CNPHI did not include information about community locations. Canada is a large country, however, and local climate trends are expected to vary from one region to another (Bush and Lemmen 2019). These regional or watershed-level climate shifts are likely to be even more pertinent to water safety and water infrastructure planning than national trends.
3.1. Increasing temperatures
Evidence suggests that annual mean surface temperatures across Canada increased by between 0.7 (Atlantic Canada) and 2.3 °C (Northern Canada) between 1948 and 2016 (Zhang et al. 2019). In most parts of Canada, mean winter temperatures have increased more than summer temperatures. These changes in average annual and seasonal temperatures have been linked to longer growing seasons and fewer frost days across the country as well as reduced snowpack in BC and increased wildfire events in AB (Zhang et al. 2019). Current projections suggest that mean temperatures will continue to increase until at least 2050, at which point they are projected to plateau or continue to increase depending on the emission scenario. Northern areas of Canada are expected to have a greater increase in winter temperatures than southern regions, and Arctic regions of Canada are projected to warm above two times the rate of global surface temperature (Zhang et al. 2019).
Thomas et al. found that 35% of waterborne outbreaks in Canada between 1975 and 2001 occurred between June and August, suggesting a link between temperature and microbial water safety (Thomas et al. 2006). The underlying reasons for diminished water safety in warmer months is likely complex, encompassing impacts on distributed water quality and indirect effects related to source water quality, water treatment efficacy, and distribution system infrastructure.
Higher temperatures will increase evaporation rates, possibly leading to diminished surface water and groundwater volumes, both of which could affect the amount of water available for human consumption. These processes have been observed elsewhere in the world, but it is unclear how the competing trends of higher temperatures and increased precipitation will balance out in different parts of Canada (Bonsal et al. 2019).
It is predicted that higher surface water temperatures will indirectly increase water pollution such as sediment, nutrients, dissolved organic carbon, pathogens, pesticides, and salt (Bates et al. 2008). These effects are discussed in later sections. Increased temperatures can also increase the growth of harmful algal blooms, which in turn increases the amount of organic matter in surface water sources (Mosley 2015). Any change in source water quality requires treatment changes; many treatment plants, especially those in smaller communities, may be unable to accommodate these changes.
Increased temperatures can also influence buried infrastructure, mostly in indirect ways. Distribution pipe failure is a complex process, but it has been widely reported that some pipe materials (iron, ductile iron, and steel) are most likely to fail during cold months due to increased frost loads, while asbestos cement pipes fail more often during hot and dry months due to decreased soil moisture (Kleiner and Rajani 2002; Harvey et al. 2014; Khan et al. 2015; Barton et al. 2019; Wols et al. 2019). Thus, the type and timing of pipeline failures may change in the future as extreme weather events increase (Barton et al. 2019). Soil moisture effects will be further explored in the subsections below related to extreme wet weather and droughts.
Finally, increased average temperatures can directly negatively impact distributed water quality. In most communities in Canada, secondary disinfectants such as free chlorine are used to prevent microbial regrowth in the distribution system and to provide a measure of distributed water stability (Health Canada 2020). The rate of decay of free chlorine increases in warmer conditions (Jadas-Hécart et al. 1992; Fisher et al. 2012; Health Canada 2021) and depending on the initial disinfectant dose and the chemical characteristics of the water may double for every 4–10 °C temperature increase (Fisher et al. 2012). The effects of increased temperature on free chlorine decay can be mitigated by increasing the initial chlorine dose or by boosting the chlorine residual at different points in the distribution system. Nitrifying bacteria and some opportunistic pathogens thrive at higher ambient temperatures, while other microorganisms, including many enteric pathogens, survive longer at cooler temperatures (Health Canada 2021).
Projected increases in temperatures across Canada may increase BWAs indirectly because of deteriorated source water quality and(or) quantity and directly by increasing the likelihood of low disinfectant residuals and microbial regrowth in distribution systems.
3.2. Flooding due to extreme wet weather and changes in snow and ice cover
Precipitation data have not been tracked as comprehensively as temperature data in Canada, particularly in northern Canada, and precipitation has higher spatio-temporal variability than long-term temperature trends (Zhang et al. 2019; Bush et al. 2022). As a result, although there is evidence that the average amount of precipitation experienced across the country has increased since 1900 in many parts of Canada, particularly in winter and spring, the magnitude of this increase remains ill-defined (Zhang et al. 2019; Bush et al. 2022). Projections for the late 21st century (2081–2100) show a very high probability of an increase in frequency, intensity, and amount of heavy precipitation events, particularly in the winter and the spring, in many regions in Canada. Current projections show increases in both pluvial flooding (“flash floods”) and annual streamflow and associated fluvial flooding (river flooding) due to increased precipitation (Bush et al. 2022).
Rain and flooding can change surface and groundwater quality, which can have negative downstream impacts on water treatment and distribution infrastructure. Waterborne disease outbreaks have been linked to heavy rainfall events (Thomas et al. 2006; O’Dwyer et al. 2016). A recent desktop study from the International Joint Commission demonstrated that reports of acute gastrointestinal illness (AGI) increased in three major cities in the Great Lakes Region 1–4 weeks after a major rainfall event (IJC 2021). A review of 46 extreme weather case studies in Australia and the USA identified heavy rainfall as the most common cause of degraded source water quality and determined that it had a greater range of potential impacts on water utilities than other extreme weather events (Khan et al. 2015). Heavy rainfall can result in sewer overflow events and(or) stormwater influx into surface water sources, leading to poorer water quality downstream (Bertone et al. 2016; Thompson and Dickenson 2021). Heavy precipitation can also increase the transport of soil and debris into surface water supplies (Moffatt and Struck 2011), resulting in increased turbidity and sediment concentration. High turbidity has been associated with higher levels of contamination, such as parasites, viruses, and other pathogens (Bertone et al. 2016). It also increases coagulant demand, increases filter backwash frequency, and shields microorganisms from UV inactivation (Cantwell and Hofmann 2008). Groundwater supplies can also be negatively affected by extreme wet weather events—a comprehensive literature review by Andrade et al. identified 14 peer-reviewed studies linking increased flood frequency and intensity to groundwater contamination and waterborne disease outbreaks in high-income countries (Andrade et al. 2018).
Increased frequency and severity of wet weather and associated flooding can also have indirect effects on source water that have negative downstream impacts on water treatment unit processes and distributed water quality. There is clear evidence of increased concentration of natural organic matter (NOM), often referred to as browning, in water bodies in the northern hemisphere over the past 30 years. Some of this browning has been conclusively linked to de-acidification of lakes in the wake of controls on industrial sulfur emissions (Anderson et al. 2016; de Wit et al. 2016; Meyer-Jacob et al. 2017), but increased frequency and severity of wet weather events have also been identified as contributing factors (de Wit et al. 2016). Climate change is likely to exacerbate this trend. Williamson et al. demonstrated how heavy rain changed both the quantity and character of NOM in a tributary to Lake Michigan (Williamson et al. 2017), while Zhou et al. demonstrated that rainstorms increased the transport of hydrophobic and aromatic NOM into a surface water supply in China (Zhou et al. 2020). A preliminary study by Neil et al. reported changes in the reactivity of NOM in raw surface water over the course of a storm event and linked it to changes in the potential for the formation of regulated disinfection by-products (DBPs) (Neil et al. 2019). NOM quantity and character, particularly its hydrophobicity and optical properties, can affect the efficacy of coagulation, flocculation, filtration, UV inactivation, and chemical disinfection processes (Linden and Darby 1998; Hurst et al. 2004; Crittenden et. al 2012; Anderson et al. 2016), any of which could potentially contribute to microbial breakthrough into the treated water if they are not addressed through operational changes, namely increased coagulant dose, increased filter backwashing rates, increased UV fluence, and(or) increased concentration and(or) contact time for chemical disinfectants.
Flooding has been linked to power shutdowns, pressure fluctuations, and contamination in water distribution systems. Pumping stations, which rely on electrical components, are particularly vulnerable to flooding (Arrighi and Tarani 2017). The corrosivity of soil, which can drive external corrosion and eventual failure of buried pipes, is impacted by moisture content, with wetter soils more likely to contribute to corrosion than drier soils—though this relationship is not linear and is influenced by soil type (Wasim et al. 2018). Elevated soil moisture can also contribute to pipe failure by increasing the volume of clay and other expansive soils, which compresses buried pipes (Clark 1971; Chan et al. 2015). Other distribution system components, including valve chambers, can be flooded and impacted by contaminated runoff during rain events (Ebacher et al. 2013).
In short, projected increases in precipitation may increase the likelihood of BWAs directly by causing more distribution system infrastructure breakdowns and indirectly by increasing source water contamination and negatively impacting water treatment system operation.
At high latitudes and elevations, global warming has already changed the spatial and temporal distribution of snow and ice (Taylor 2013; Bonsal et al. 2019). Warmer winter temperatures result in less snow accumulation and earlier melting of snow, as well as more winter precipitation, including “rain on snow” events (Taylor 2013; Bonsal et al. 2019). Together, these factors may change the intensity and seasonal distribution of fluvial flooding events. The Centre for Climate Change Research lists the risk of increased snow melt-related fluvial flooding as undetermined, though its authors state that based on existing evidence it is likely that as average temperatures increase, these floods will occur earlier in the year (Bonsal et al. 2019). Fluvial flooding can overwhelm water treatment and distribution infrastructure that has been built in the stream floodplain, causing treatment and(or) distribution system infrastructure failures and ultimately leading to increased water safety risk related to distributed water. Thomas et al. (2006) reviewed a data set that included 92 waterborne outbreaks in Canada between 1975 and 2001 and observed a peak in March (Thomas et al. 2006), a month that corresponds to the spring freshet in many parts of Canada. Changes to the timing of melt-related fluvial flooding may result in a change to the seasonal distribution of BWAs.
3.3. Coastal flooding: sea level rise, storm surge, and convective storms
Coastal flooding is expected to increase in Canada as a result of climate change (Greenan et al. 2019) and has many of the same impacts on water infrastructure as pluvial and fluvial flooding (damaged infrastructure, power outages, sewage overflow, etc.) along with additional effects on aquifers and surface water quality (Su et al. 2022). Coastal flooding can be caused by sea level rise or storm surge related to severe coastal storms (e.g., tropical cyclones, commonly referred to as hurricanes in North America) (Greenan et al. 2019).
Relative sea level rise is a function of multiple phenomena—global sea level rise due to increasing liquid water volume due to melting glaciers and ice sheets; the thermal expansion of water due to increased temperatures; and vertical land movement in coastal areas (Bush and Lemmen 2019). Climate change projections suggest that the relative sea level will increase by more than 75 cm in some parts of Atlantic Canada, with lower but nonetheless substantial increases on the coasts of the Pacific Ocean and the Beaufort Sea. Relative sea level is expected to fall in many parts of Arctic Canada because of land uplift (Greenan et al. 2019), depending on the emission reduction scenario (Bush and Lemmen 2019). Sea level rise, along with decreased freshwater flows, have contributed to sea water intrusion into surface water supplies and unconfined coastal aquifers (Lassiter 2021). Sea level rise has also been linked to groundwater flooding (Rotzoll and Fletcher 2013). Aquifers experiencing groundwater flooding can interact with buried infrastructure like sewage collection pipes and water mains (Su et al. 2022) and has also been shown to increase wastewater overflow events (McKenzie et al. 2021).
Storm surge, a short-term incursion of water onto the land during coastal storms (e.g., hurricanes) and tsunamis, has been linked to vertical infiltration of saltwater and lateral saltwater intrusion into groundwater aquifers (Paldor and Michael 2021) and damage to drinking water system components (US EPA 2006a, 2006b). Recent hurricanes have had documented effects on water safety in many parts of North America. In 2017, Hurricane Harvey made landfall in TX, causing extensive flooding and damaging wastewater infrastructure, which results in contamination of local surface water bodies with fecal bacteria (Kapoor et al. 2018). Microbial contamination in private drinking water wells was also widespread in the area (Pieper et al. 2021).
Atlantic Canada is regularly impacted by hurricanes that travel north up the Eastern Seaboard, and past hurricanes and tropical storms have damaged electrical grids (Chattha 2019; Snodden 2019; IBC 2021), transportation routes (Chattha 2019), flooded wastewater infrastructure (Healey 2019), and BWAs in the region (Ward and Roberts 2022). Hurricane Fiona, which hit Atlantic Canada in September 2022, was described as a “historic extreme event” to impact Canada (BBC News 2022) and was reported to cause more than $385 million in damages to NS and $220 million in damages in PE (CBC News 2022). Hundreds of thousands of people in communities impacted by the storm were left without power for multiple days (BBC News 2022). In preparation for the storm, the government of NS advised users of non-municipal drinking water sources to boil their water for one minute before consumption (Nova Scotia 2022). Although there is some evidence that hurricanes are increasing in severity and impact in many parts of the world as a result of climate change, the 6th IPCC report listed the strength of this evidence as low because of limited availability of historic data (O’Neill et al. 2022). For the same reason, the recent impacts of climate change on coastal storms in Canada are not well characterized (Greenan et al. 2019). Should the frequency and severity of hurricanes increase in Atlantic Canada, source water, water treatment, and water distribution infrastructure risks associated with heavy rainfall and high winds will increase as well, along with the BWAs that are used to communicate these risks. Indeed, the severity and magnitude of Hurricane Fiona serves as a possible indication of how more intense storms fuelled by higher ocean temperatures related to climate change might impact water infrastructure in the Atlantic Region (Mulligan 2022).
Lightning, tornadoes, hail, and high winds can be generated during severe convective storms, often along with heavy precipitation. The impacts of convective storms on infrastructure include power outages at water treatment plants and pumping stations, reduced structural integrity of dams, rupture of water lines and storage tanks, and flooding of treatment plant infrastructure (Khan et al. 2015; Bertone et al. 2016). High winds have been linked to increased pipe failure due to disturbances caused by uprooted trees (Wols et al. 2019). High winds can also indirectly impact water treatment and distribution infrastructure by damaging electrical infrastructure and buildings (Swanson et al. 2021). Lightning strikes can also spark forest fires, spawning contaminant spikes in source water, treatment challenges, and in some cases, compromised distributed water quality as described earlier. The most recent IPCC report describes the evidence for increased incidence of convective storms as “low” because of a lack of historic data and the complexity of the atmospheric processes that give rise to these storms but also notes that some of the conditions that give rise to these storms, namely high temperatures and moist air, are projected to increase in the future (Lawrence and Mackey 2022). Canada’s Changing Climate Report makes only a single, non-specific mention of severe weather events associated with convective storms. As such, although convective storms have the potential to negatively impact all built aspects of drinking water systems, it is unclear whether these risks will increase in the future due to climate change.
3.4. Drought
Increased temperature and changing precipitation patterns can lead to droughts, which may decrease water source water quantity and lower water quality in the remaining water (Kolijn 2021). Historical climate records do not indicate an increase in droughts in Canada. Climate change projections for Canada predict increases in average temperatures that will increase evapotranspiration in summer and decrease snow accumulation in the winter, potentially increasing drought risk. There is more robust evidence indicating that some regions, including the Canadian Prairies and parts of BC, will experience more severe and persistent droughts (Bonsal et al. 2019; Bush et al. 2022).
Although the transport of nutrients, organics, and turbidity into surface water bodies is often reduced in droughts, these parameters can accumulate on the land during the drought only to be delivered to drinking water sources when flow and catchment runoff return post-drought (Mosley 2015; Kolijn 2021). Water treatment processes are designed based on historic water quality data, and a sudden influx of contaminants and change in water quality can reduce treatment efficacy. Another potential effect of drought on source water quality and treatment efficacy is the increased influence of stormwater and treated wastewater effluent. De facto wastewater reuse increases during droughts as streamflow is reduced and stormwater and(or) treated wastewater effluent make up a larger proportion of the total volume or flow in surface water supplies (Benotti et al. 2010; Rice et al. 2013; Rice and Westerhoff 2015). A model developed by Rice and Westerhoff predicted that in periods of very low streamflow, the average de facto reuse increased, on average, from 3.6% to 46% at the 80 drinking water intakes included in the analysis and that these effects are most likely to be felt at water treatment plants that rely on smaller streams as their water supplies (Rice and Westerhoff 2015).
Droughts also reduce the moisture content of soil, reducing soil volume (shrinkage) and allowing deeper frost penetration into soils (Kleiner and Rajani 2002). In some parts of Canada, increased pipeline breaks have been reported between September and January in the wake of particularly dry summers because of changes in soil volume that exert pressure on buried pipes (Baracos et al. 1955). This is in line with more recent findings from elsewhere in the world (Chan et al. 2015; Barton et al. 2019). Other regions of Canada have recorded higher numbers of pipe breaks during winters that follow dry summers due to increased potential for frost penetration into drier soils (Kleiner and Rajani 2002). Soil moisture content can also drive external corrosion of pipes, and drier soils are generally thought to be less corrosive to buried pipes than wetter soils (Wasim et al. 2018). Taken together, the studies cited above suggest that the projected increased frequency and severity of droughts in some parts of Canada may increase the likelihood of pipe failure due to soil moisture changes in these regions, though this might be offset to some degree by reduced soil corrosivity and a decreased number of frost days and diminished frost penetration.
3.5. Wildfires
Wildfires are a natural part of many forest ecosystems; however, higher temperatures, prolonged droughts, and other climatic changes can lead to larger, more severe wildfires and are a threat to forest watersheds globally (Hohner et al. 2019). The forest fire weather index (FWI) combines information about temperature, precipitation, and other weather variables to determine the likelihood that a forest fire will occur and(or) spread (Zhang et al. 2019). The majority of wildfire impacts on water source and quality are experienced during heavy rainfall events following the fire (Khan et al. 2015). Intense storms following forest fires dramatically increase surface runoff, washing away ash and soil into receiving waterbodies (Hohner et al. 2019). Wildfires can expose soils to sediments, nutrient, metal, and NOM (Hohner et al. 2019). This can impact the vegetation, soils, and watersheds that regulate water supply sources and can cause challenges for downstream drinking water treatment plants (Hohner et al. 2019). Forest fires may release large amounts of gradually accumulated contaminants such as arsenic, aluminum, cadmium, chromium, iron, lead, mercury, sulfate, chloride, calcium, magnesium, manganese, barium, sodium, and potassium in sediment and runoff streams (Khan et al. 2015); this can have significant impacts on downstream rivers and have design, operation, and cost implications of drinking water treatment facilities (Emelko et al. 2011). For example, following a wildfire near Los Angeles, CA, concentrations of many trace metals such as lead and cadmium were three times higher than the pre-fire concentrations (Khan et al. 2015). Hohner et al. determined that post-fire precipitation events increased turbidity and dissolved organic carbon (DOC), causing significant treatment challenges and leading to the closure of the water intake, that these high-DOC residuals led to the increased formation of DBPs such as total trihalomethane and five regulated haloacetic acids, and that aromatic DOM remained in the treated water (Hohner et al. 2019). Fires can also increase the amount of sediment in surface water supplies, leading to costly restoration activities (Bladon et al. 2014). Overall, the projected increase in the FWI in some parts of Canada (Zhang et al. 2019) may increase the number of forest fires and thus the number of BWAs that are indirectly related to source water quality.
3.6. Permafrost degradation
Approximately 40% of Canada’s landmass is underlain by permafrost (Cohen et al. 2019). Although only a small proportion of the Canadian population lives in these areas, the communities that do are generally small, remote, and have limited water treatment and thus are highly vulnerable to water safety hazards. Past studies have linked permafrost degradation to changes in particulate, NOM, nutrient, and ionic species concentrations in surface water as well as changes to aquatic ecosystems (Thienpont et al. 2013; Abbott et al. 2015; Vonk et al. 2015; Miner et al. 2021). The direction and timeline of these changes depend upon ground ice volume and the characteristics of the surrounding soils (Abbott et al. 2015; Vonk et al. 2015). As described previously, changes in source water quality can challenge water treatment processes, rendering them less effective and(or) requiring expensive equipment upgrades or operational changes. A recent study by Elliott et al. linked seasonal spikes of chloride, conductivity, and hardness in a source water used by a community in NU, Canada, to permafrost thaw and subsequent mobilization of salts in the marine sediments surrounding the water source. The community was required to install costly water treatment equipment (reverse osmosis membranes) to achieve treated water-quality goals (Elliot et al. 2022). In some regions, permafrost thaw may also result in the release of accumulated chemical contaminants such as mercury (Vonk et al. 2015; Schaefer et al. 2020; Miner et al. 2021) and legacy industrial chemicals (Miner et al. 2021) into surface water. Although these contaminants will not result in BWAs, they could result in negative health outcomes related to exposure to dangerous chemicals as well as DNC orders that diminish users’ confidence in the water provided to them. Permafrost degradation results in heaving and slumping of the surrounding soil and has the potential to damage surface and buried infrastructure, including drinking water distribution systems and sewage collection systems. This could result in increased pipe breaks and pressure loss in water distribution systems as well as cross contamination of distributed water by sewage seeping from broken sewer lines (Swanson et al. 2021). In summary, based on current projections, permafrost degradation should be considered an important drinking water hazard that may increase the total number of BWAs occurring in future years.
3.7. Summary
Canada has seen and will continue to see an increase in frequency and intensity of extreme weather events, such as extreme temperatures, severe wet weather events, floods, wildfires, and permafrost degradation. These will change and in many cases increase and exacerbate challenges related to surface water, groundwater supplies, and drinking water treatment and distribution infrastructure. The impacts of these events on the factors that result in the issuance of BWAs (poor distributed water quality, damaged distribution infrastructure, and malfunctioning treatment equipment) will be mostly indirect and often complex, requiring the use of holistic and multipronged strategies to ensure that water remains safe despite projected climate changes. Table 1 summarizes the observed changes caused by the mentioned climate change phenomena, as well as their potential impacts on drinking water.
Table 1.
| Observed or projected changes | Impacts on drinking water | |
|---|---|---|
| Increasing temperatures | • Increase in annual mean surface temperature (Zhang et al. 2019) • Arctic regions to warm above two times the global rate (Zhang et al. 2019) | • 35% of waterborne outbreaks occurred between June and August (Thomas et al. 2006) • Diminished surface and groundwater due to evaporation (Bonsal et al. 2019) • Warm temperatures increase chlorine decay (Jadas-Hécart et al. 1992; Fisher et al. 2012; Health Canada 2021) |
| Flooding due to extreme wet weather and changes in snow and ice cover | • High probability of increase in frequency, intensity, and amount of heavy precipitation • Increase in pluvial flooding, annual streamflow, and fluvial flooding (Bush and Lemmen 2019) | • Waterborne diseases linked to heavy rainfall (O’Dwyer et al. 2016; Thomas et al. 2006) • Sewer overflow from heavy rainfall (Bertone et al. 2016; Thompson and Dickenson 2021) • Heavy precipitation increases the transport of soil and debris into surface water (Moffatt and Struck 2011) • Increased turbidity, causing increase in contamination (Bertone et al. 2016) • Changed both the quantity and character of NOM (Williamson) (Zhou et al. 2020) |
| Changes in snow and ice cover | • Changes in spatial and temporal distribution of snow and ice (Taylor 2013; Bonsal et al. 2019) • Less snow accumulation, earlier melting of snow, more winter precipitation (Taylor 2013; Bonsal et al. 2019) | • Flooding causing power outages impacting infrastructure (Arrighi and Tarani 2017) • Flooding can overwhelm water treatment and distribution infrastructure (Thomas et al. 2006) |
| Coastal flooding: sea level rise, storm surge and convective storms | • Coastal flooding is expected to increase (Greenan et al. 2019) • Coastal flooding caused by sea level rise or storm surge (Greenan et al. 2019) • Sea level rise due to increasing liquid water volume due to melting glaciers (Bush and Lemmen 2019) • Relative sea level expected to fall in Arctic Canada because of land uplift (Greenan et al. 2019) • Increase in severity and magnitude of intense storms (Mulligan 2022) | • Impacts on water infrastructure and additional effects on aquifers and surface water quality (Su et al. 2022) • Sea level rise causing groundwater flooding (Pieper et al. 2021) • Aquifers experiencing flooding can interact with buried infrastructure like sewage pipes and water mains (Su et al. 2022) • Storm surge linked to vertical infiltration of saltwater and lateral saltwater intrusion into groundwater aquifer (Paldor and Michael 2021) and damage to drinking water systems (US EPA 2006A) • Hurricanes and intense storms causing extensive flooding and damage to wastewater infrastructure resulting in contamination of surface water bodies (Kapoor et al. 2018) • High winds causing increased pipe failure and indirectly impacting water treatment and distribution infrastructure through damaged electrical infrastructure (Wols et al. 2019; Swanson et al. 2021) |
| Drought | • Increased temperature and changing precipitation leads to droughts (Luh et al. 2015; Kolijn 2021) • Canadian Prairies and BC will experience more severe and persistent droughts (Bonsal et al. 2019; Bush et al. 2022) • Reduced moisture content and volume of soil, allowing for deeper frost penetration into soils (Kleiner and Rajani 2002) | • Post-drought rainfall events can deliver nutrients, organics, and turbidity into water sources (Mosley 2015; Kolijn 2021) • Increased likelihood of pipe failure due to soil moisture (Baracos et al. 1955; Kleiner and Rajani 2002) |
| Wildfires | • Higher temperatures and prolonged droughts lead to larger and more severe wildfires (Hohner et al. 2019) • Increase in FWI project increases the number of forest fires (Zhang et al. 2019) | • Heavy rainfall post-wildfire impact water source and quality (Khan et al. 2015) • Ash, soil, sediment, nutrient, and NOM exposed from fire runoff into waterbodies (Hohner et al. 2019) • Large amounts of gradually accumulated contaminants are released into streams, which can impact treatment facilities (Emelko et al. 2011; Khan et al. 2015; Hohner et al. 2019) • Increase in surface water sediment (Bladon et al. 2014) |
| Permafrost degradation | • Increase in permafrost degradation due to increased temperatures | • Changes in particulate, NOM, nutrients, and ionic species in surface water (Thienpont et al. 2013; Abbott et al. 2015; Vonk et al. 2015; Miner et al. 2021) • Permafrost degradation linked to changes in chloride, conductivity, and hardness in source water (Elliot et al. 2022) • Release of accumulated mercury and industrial chemicals into surface water (Vonk et al. 2015; Schaefer et al. 2020; Miner et al. 2021) • Can cause increase in pipe breaks and pressure loss in distribution systems (Swanson et al. 2021) |
4. Analysis of CNPHI BWA data
Our analysis of the CNPHI data explored the number and trends in BWAs in Canada from 2005 and 2020. Our central hypotheses were
•
Small and very small communities will be more likely to have experienced BWAs, repeat BWAs, and long-term BWAs than larger communities
•
In keeping with common media narratives in Canada, most BWAs will have been linked to treatment failures and distributed water quality
•
The reasons why BWAs are called will have varied seasonally because of seasonal temperature, moisture, and precipitation trends
4.1. Population
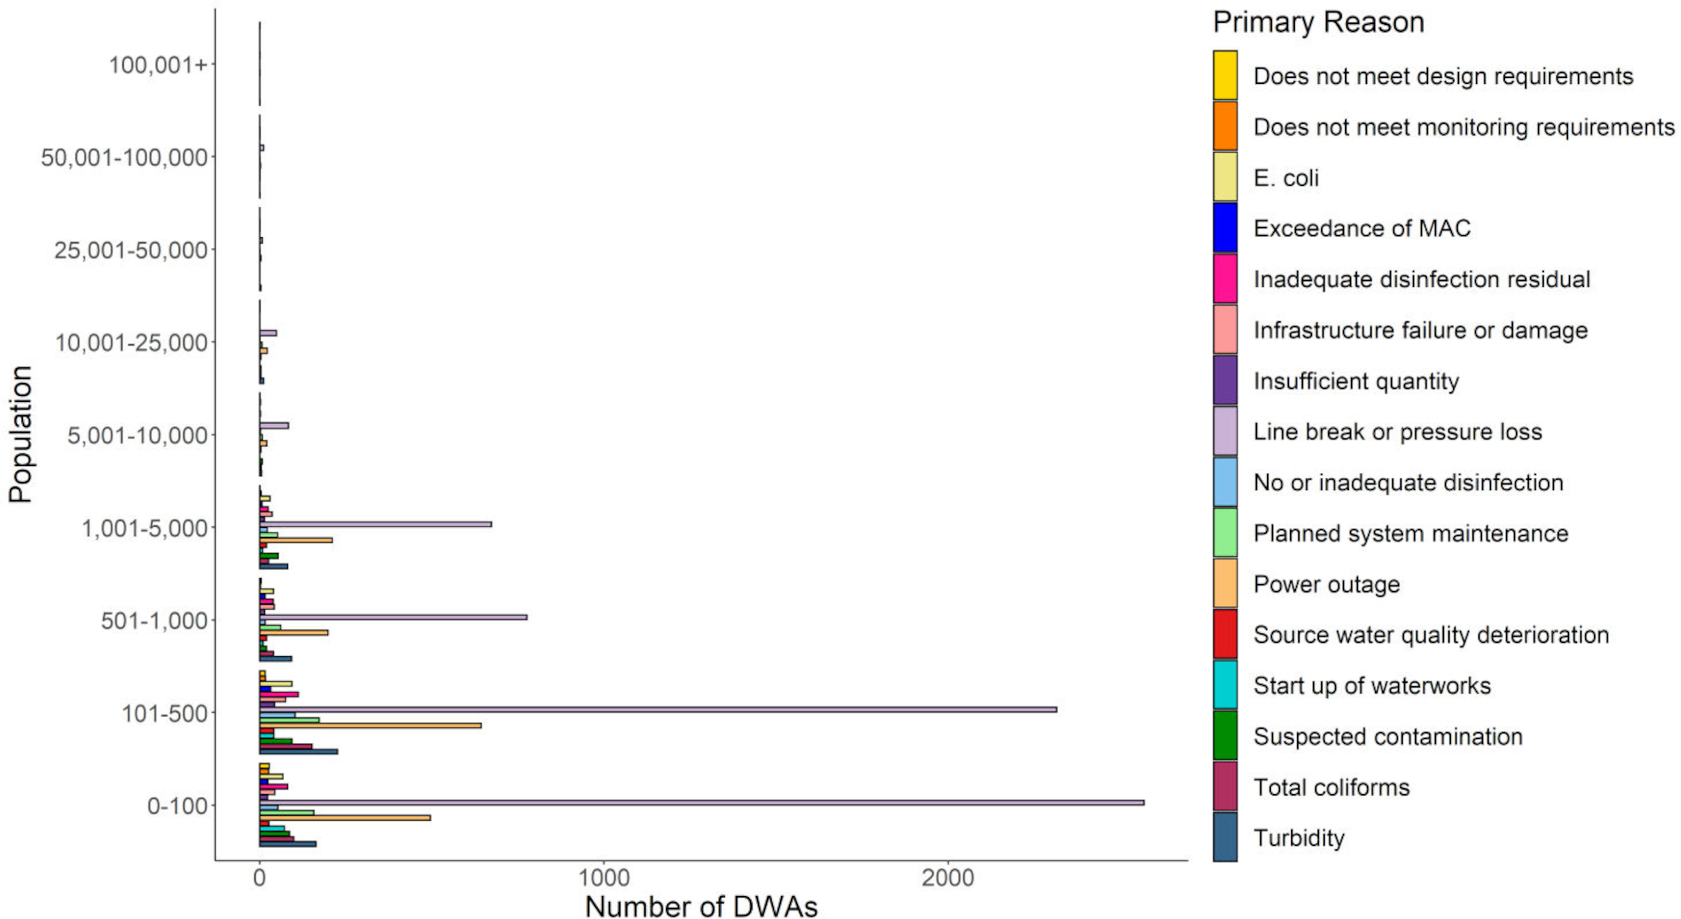
Figure 1 illustrates the primary reasons for BWA reasons in communities of different sizes, with aggregated results from across Canada. Smaller communities have a disproportionally higher frequency of BWAs, with communities of up to 100 and 500 residents experiencing more than 2000 BWAs over the study period. Similarly, communities with up to 1000 and 5000 residents also have a relatively high occurrence of BWAs compared to larger communities. Furthermore, Fig. 1 shows that the most frequent primary reasons for the issuing of BWAs are “line break or pressure loss in distribution system”, “planned maintenance”, “equipment failure”, “total coliforms detected”, and “power outage”. In small communities (up to 100, 500, 1000, and 5000 residents), “line break of pressure loss in distribution system” counts for the majority of the primary reason for BWAs, followed by “power outage”. This is in contrast to the common media narrative in Canada that BWAs are called because of treatment failures and(or) that pathogens have been detected in distributed water.
Fig. 1.
4.2. Water supply type
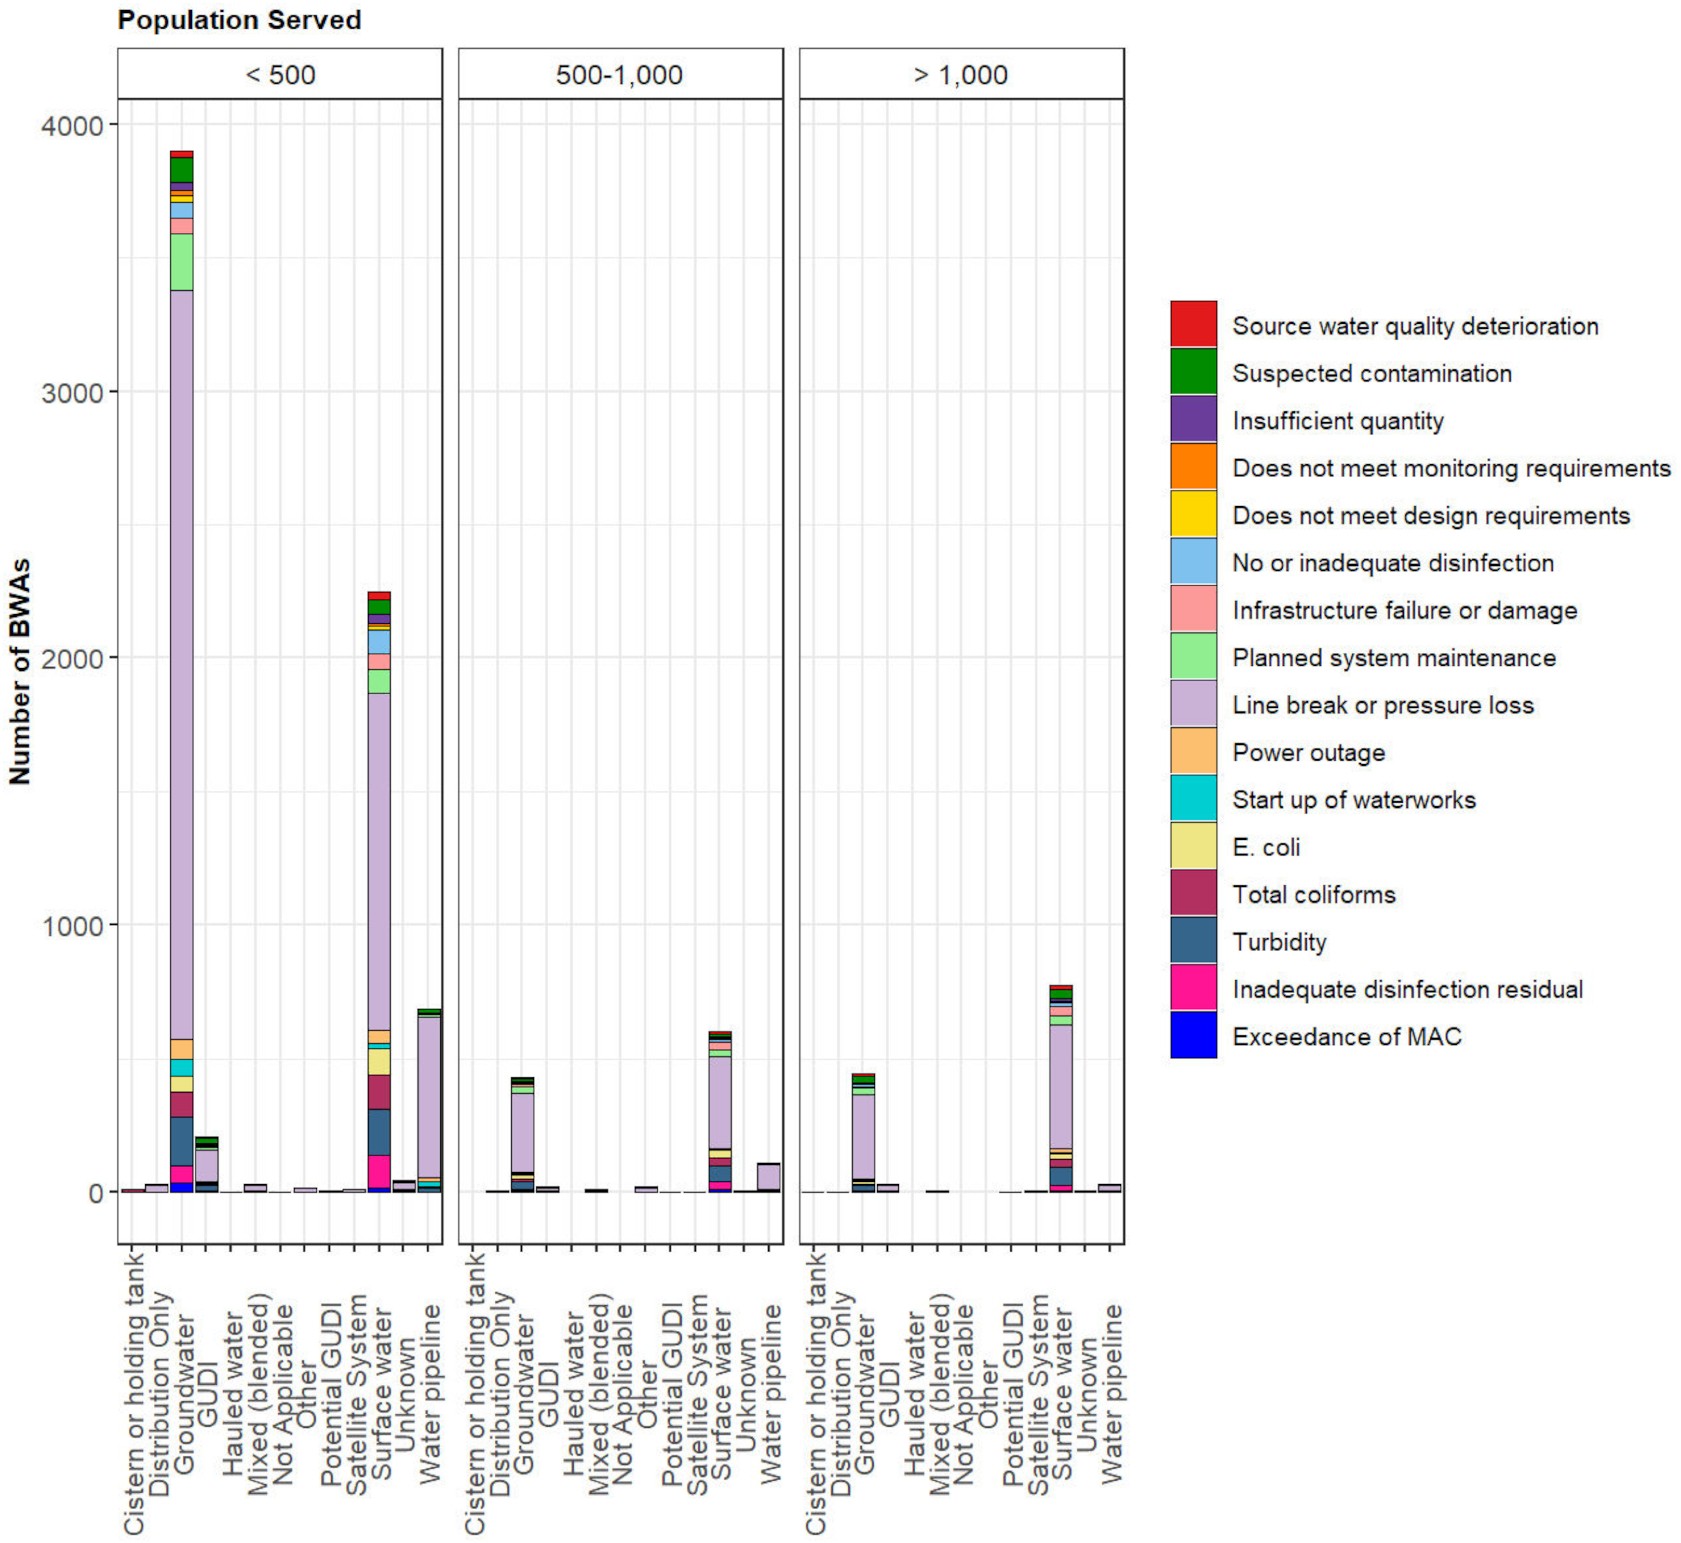
Nearly all of the BWAs in the CNPHI database were called in systems supplied by surface water (37%) and groundwater (49%) as depicted in Fig. 2. The Biennial Drinking Water Plants Survey (BDWPS) results from 2019 indicated that 86% of Canadians get their water from municipal drinking water plants, 87% are served by plants supplied by surface water, 11% by plants supplied by groundwater, and 2% with GUDI supplies. The BDWPS only collects information from communities with more than 300 inhabitants (Statistics Canada 2022) and therefore does not include information related to some of the smaller communities in the CNPHI BWA database. In the CNPHI database, groundwater-supplied systems were responsible for more than 11% of BWAs in communities with 500 or more people, indicating that municipal water systems supplied with groundwater have a disproportionately higher number of BWAs than those supplied by surface water. The results in Fig. 2 also indicate that irrespective of the water source type, the leading reasons for the issuing of BWAs is a line break or pressure loss in the distribution system, planned maintenance, equipment failure, inadequate disinfection, and power outage.
Fig. 2.
4.3. Long-term and repeat BWAs
Figure 3 illustrates that the longest-running BWAs were issued in smaller communities (population < 500), verifying the hypothesis that smaller communities experience the longest BWAs. Ninety-three percent of BWAs lasting between 5 and 15 years are in communities serving less than 500 people, and 82% of advisories lasting between 1 and 5 years were also in communities serving less than 500 people. 14.6% of advisories between 8 and 60 days were in communities serving between 501 and 1000 people, with the remaining 76.8% and 13.3% in communities serving less than 500 people and more than 1000 people, respectively. Figure 3 also illustrates that many of these BWAs lasted for over 1000 days, with some extending for up to 5125 days—that is about 3 years and over 13 years, respectively.
Fig. 3.
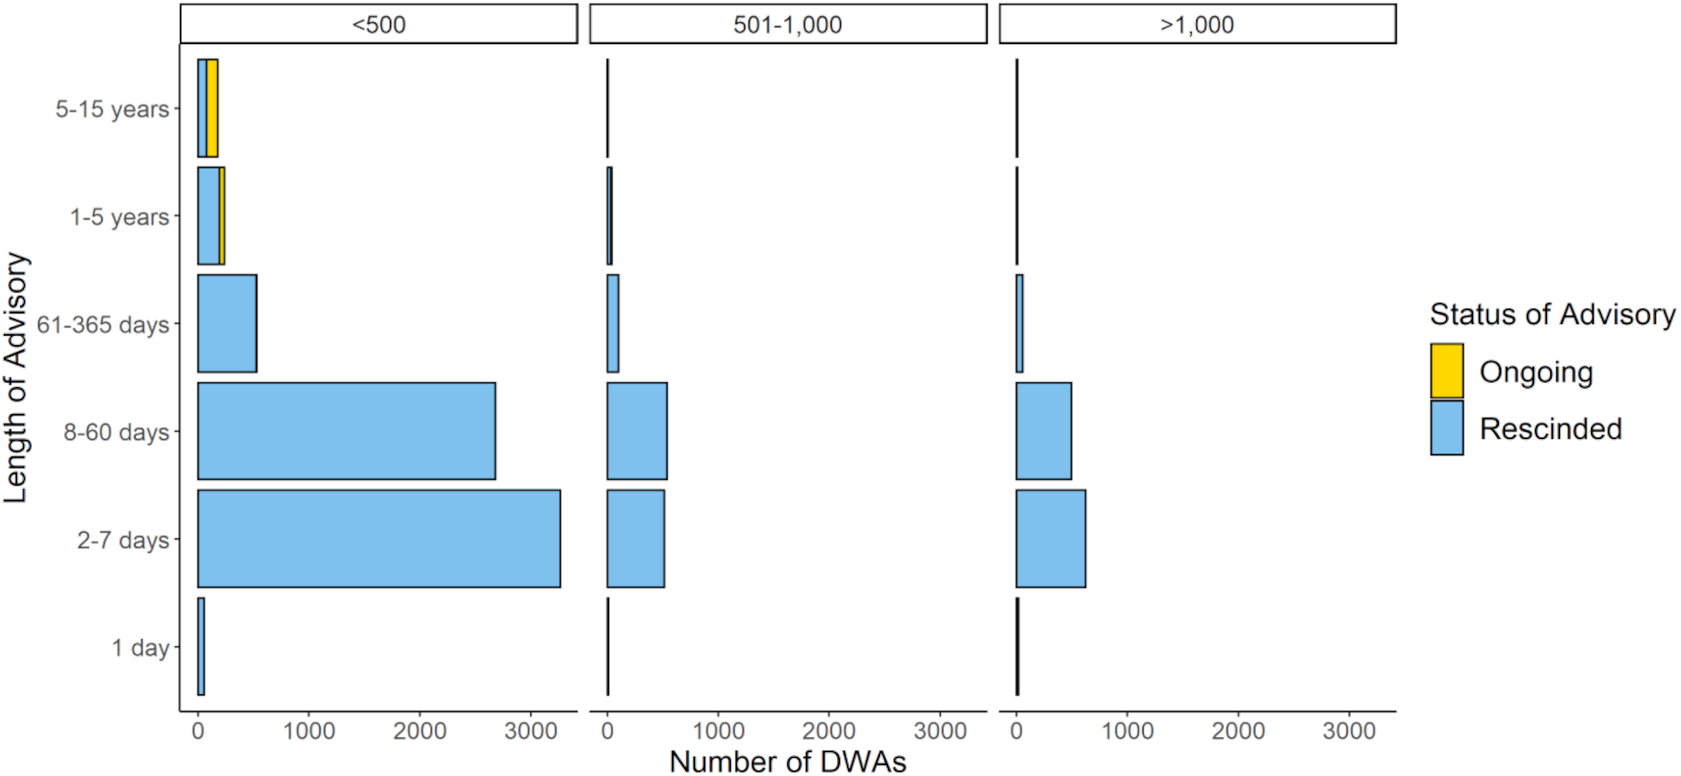
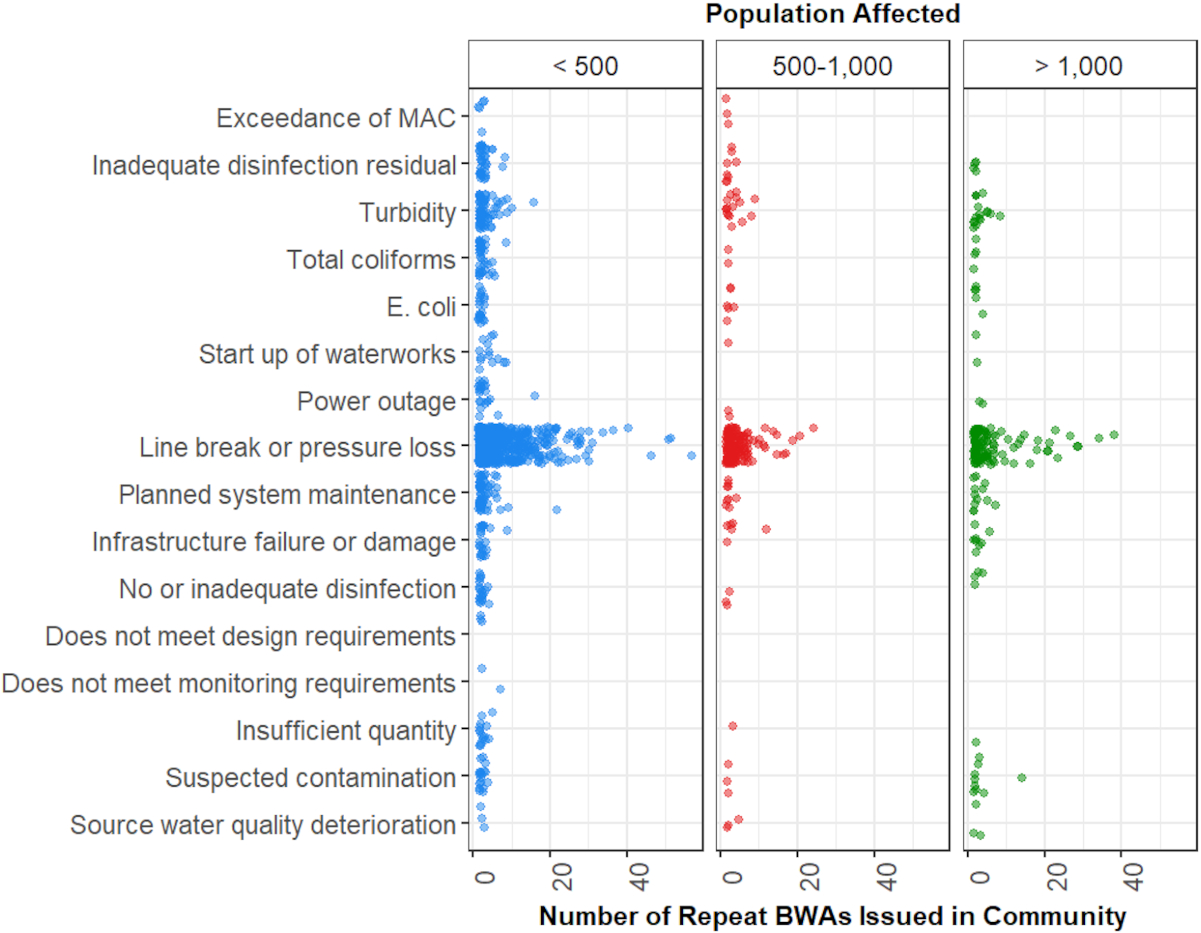
Figure 4 demonstrates that repeat BWAs are also common in small communities in Canada. The most common cause of repeat BWAs was a line break in the distribution system, with some small communities experiencing upwards of 40 repeat BWA due to line breaks during the 15-year span represented by the data. Other common causes of repeat BWAs included inadequate disinfection residual, turbidity, and total coliforms.
Fig. 4.
4.4. Trends over time
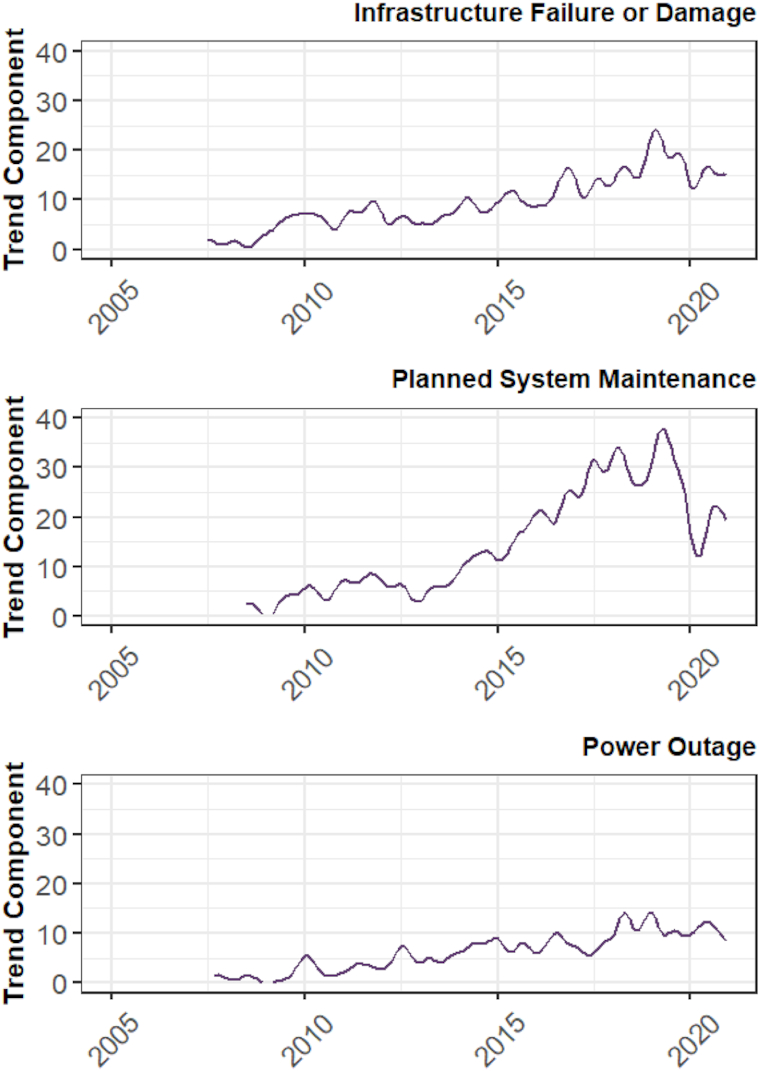
Temporal trends in two important categories of BWAs, those related to breakdowns in the distribution system and those related to distributed water quality, were explored in more detail using X12 ARIMA decomposition followed by the Mann–Kendall test. Figure 5 shows the top three secondary reasons listed in the CNPHI database for BWAs with the primary reason being line break or pressure loss. These three secondary reasons accounted for 76% of all BWAs associated with this primary reason. Each of these had a statistically significant increasing trend over time. Planned system maintenance and, to a lesser extent, infrastructure failure or damage have steeper trends than power outage.
Fig. 5.
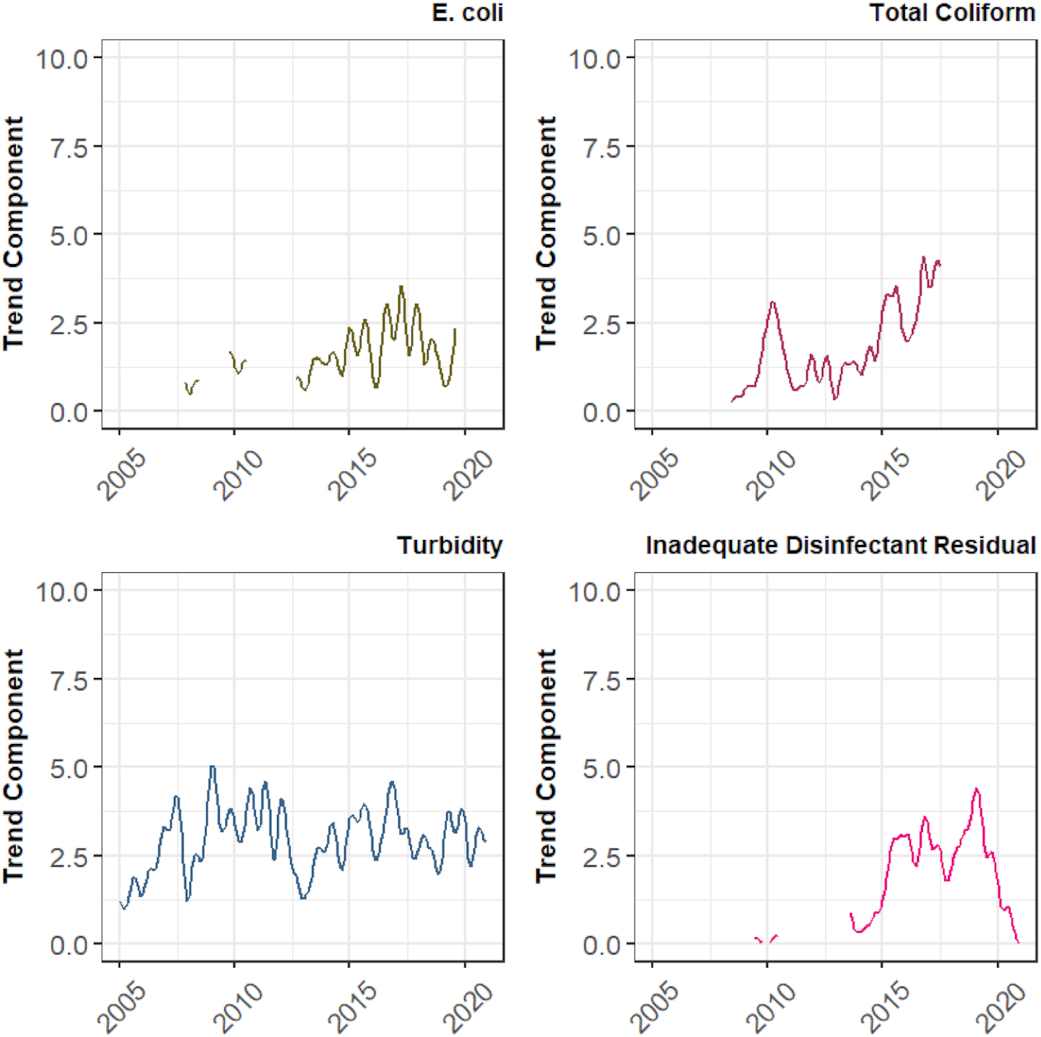
Statistically significant temporal trends were also apparent in the four primary BWA reasons associated with distributed water quality: E. coli, total coliforms, turbidity, and inadequate disinfectant residual (Fig. 6). The number of BWAs issued due to E. coli, total coliforms, and turbidity increased over the study period, and the number issued due to inadequate disinfectant residual decreased.
Fig. 6.
The significant trends observed in this analysis are likely related to changes in how BWAs were issued, recorded, and reported to CNPHI over the study period but may also be linked to climatological changes over the study period. Jurisdiction-specific analysis is required to confirm whether seasonal BWA patterns have shifted over time in response to documented changes in climate in different regions in Canada.
4.5. Seasonal effects
Many of the underlying causes of BWAs are influenced by temperature and other seasonal factors, so it was expected that some of the BWA reasons would show seasonal patterns. Fig. 7 shows the number of BWAs issued due to line break and pressure loss between 2005 and 2020 broken out by secondary reason and month. Seasonality was explored using two statistical methods: significance testing with the autocorrelation function and isolation of the seasonality component using X12 ARIMA decomposition.
Fig. 7.
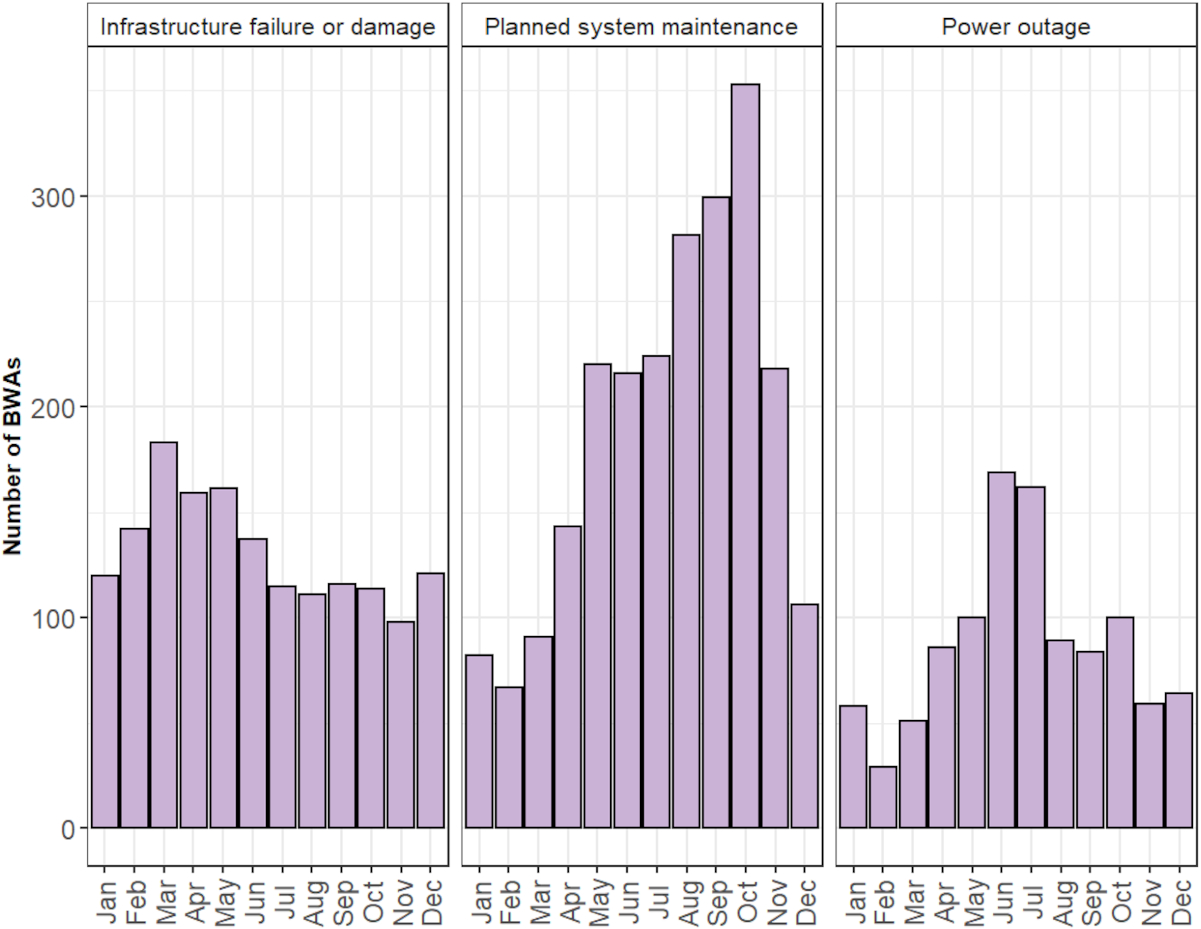
Figure 8 shows the X12 ARIMA seasonal component of the time series for each of these secondary reasons. Each of the secondary reasons had a statistically significant seasonal component based on the autocorrelation function. BWAs related to infrastructure failure or damage were mostly issued between February and June, with a peak in March and April. This period coincides with cold weather (February to March) and spring thaw (March to May) in many parts of Canada, conditions that would be expected to give rise to infrastructure damage (Kleiner and Rajani 2002). This was reflected in the significant seasonality observed in this BWA reason, though the strength of the seasonal component decreased with time (i.e., lower seasonality in recent years compared to 2010–2014). This may be due to changing seasonal weather patterns and(or) related to changing BWA criteria reported in different jurisdictions.
Fig. 8.
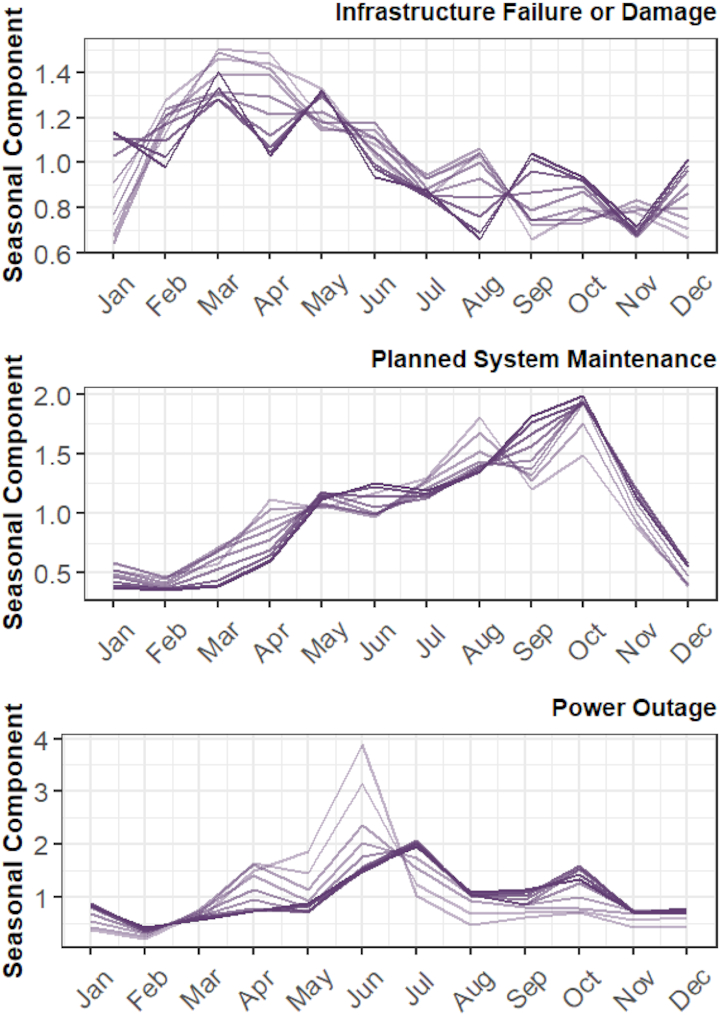
Precautionary BWAs issued ahead of planned system maintenance ramped up in late spring into midsummer and peaked during the late summer and early autumn, and a consistent, strong, statistically significant seasonal effect was observed, peaking in October every year. This pattern might reflect the progression of the “construction season” in many parts of Canada. It is recommended that this trend be confirmed through consultations with water utilities in future studies.
Lastly, the incidence of BWAs related to power outages was highest in June and July, which corresponds to the highest frequency of extreme wet weather and electrical storms in many parts of Canada. Interestingly, the seasonal trend for BWAs caused by power outages shifts from peaking in June to peaking in July, with a decreasing seasonal effect with time.
Figure 9 suggests that BWAs associated with distributed water quality also have clear seasonal patterns. The number of BWAs called due to the two common microbial water quality indicators, E. coli and total coliforms, peaks in the summer months when temperatures across Canada are at their highest, suggesting a link between temperature and microbial activity in the distribution system—a reasonable finding given that most microorganisms are known to be more active at higher ambient temperatures. Based on the autocorrelation function, both E. coli and total coliforms had a statistically significant seasonal component. The X12 ARIMA test was not performed for these BWA reasons because it requires a continuous time series and there were multiple years where no BWAs were called due to E. coli or total coliforms.
Fig. 9.
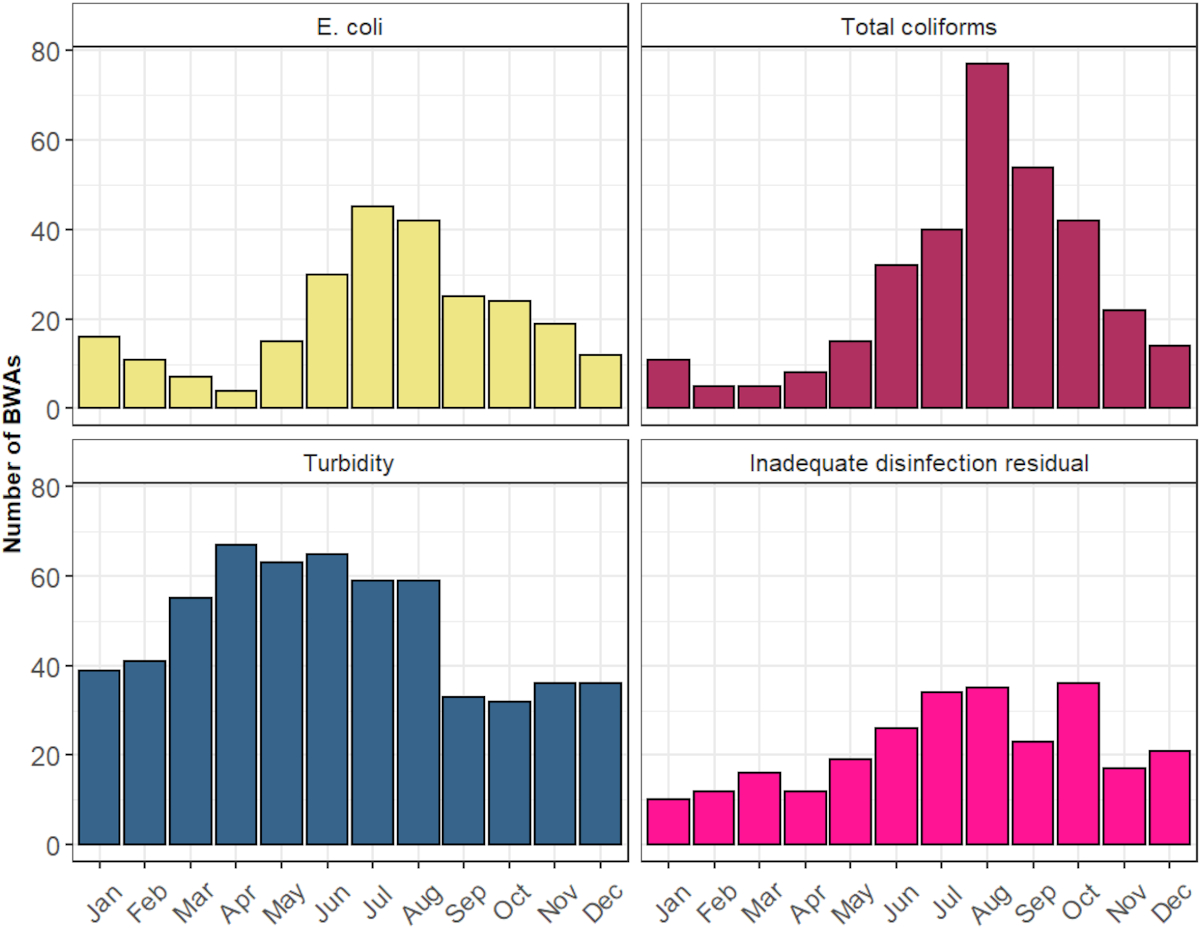
Unlike the microbial indicators, turbidity-related BWAs were common in both the spring and summer months (Fig. 9). The data demonstrated significant seasonality, with BWAs called due to turbidity peaking in April between 2005 and 2013 and in later years breaking into multiple peaks across the spring and summer months (Fig. 10). March to May corresponds to the spring freshet and higher precipitation levels in many parts of Canada. Both phenomena are associated with higher levels of particulate matter in source water.
Fig. 10.
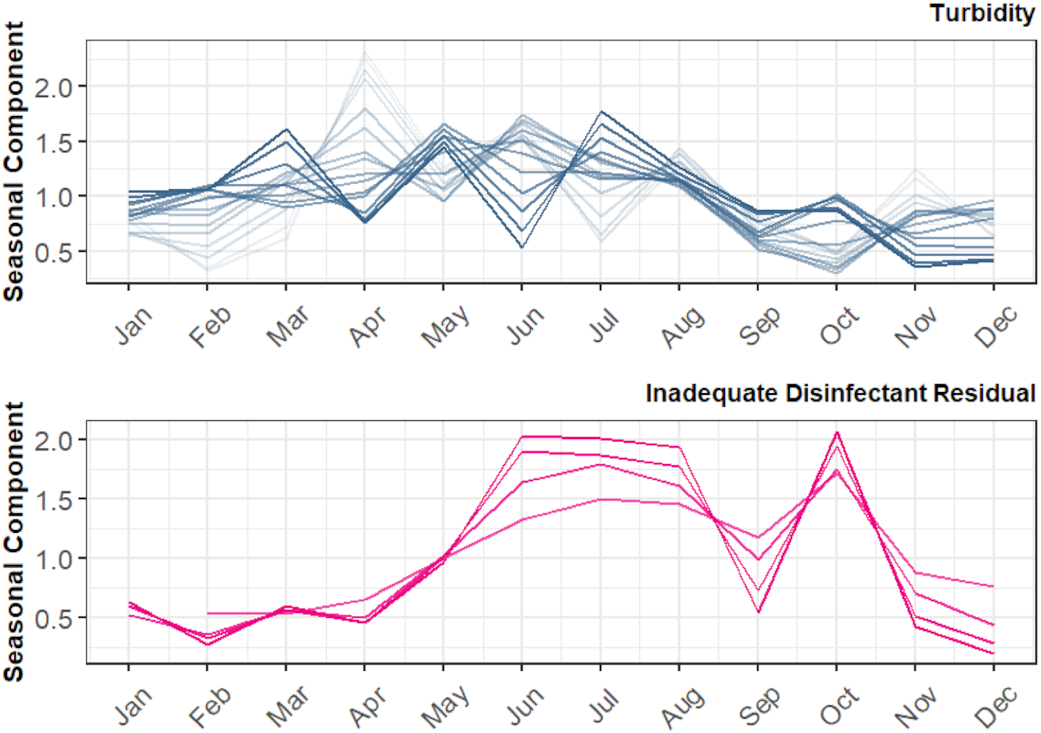
The decay of free chlorine and other secondary disinfectants is accelerated at higher temperatures (Crittenden et. al 2012), increasing the chance that disinfectant residuals will be below required levels in warmer months. A statistically significant seasonal trend peaking in the summer months was observed for BWAs issued due to inadequate disinfection residual, as shown in Fig. 10. The cause of the October peak for this BWA reason is unclear.
While intuitive, the seasonal trends discussed in this section should be explored and confirmed on a region-to-region basis by cross-referencing BWA data from specific jurisdictions with information about regional climate trends. Over time, shifting climatological phenomena are expected to produce corresponding shifts in the seasonal patterns in BWAs, though the magnitude and timing of these seasonal effects may vary from one region to the next. This variation, coupled with the anonymous (i.e., location-free) nature of the CNPHI data set, make it difficult to decisively link BWA frequency and reasons with seasonal phenomena.
5. Discussion
5.1. Population
A small system is defined as a drinking water system serving less than 5000 people, according to Health Canada (Galway 2016). A common observation in past studies has been the large number of long-term and repeat BWAs, particularly in small communities (Lane and Gagnon 2020), and that long-term BWAs occur most often in small water systems (Edwards et al. 2012). Indeed, previous work by others has shown that between 2010 and 2012, 98.5% of BWAs listed in the CNPHI database were issued to systems serving 5000 people or less, and 88.5% of advisories were issued to systems serving 1000 people or less (Health Canada 2015). These percentages are in line with our findings and with data from 2021 that was recently published by Environment and Climate Change Canada (2022). Small water systems commonly lack access to funding, resources, and trained personnel (Edwards et al. 2012). In recognition of the interrelated logistical, operational, and financial capacity issues faced by small communities, very small water and(or) remote systems are held to less rigorous treatment standards in some Canadian jurisdictions. For example, in the northern territory of NU, 24 out of 25 communities have fewer than 5000 residents and 50% of communities rely exclusively on chlorination (no filtration) for water treatment (Elliot et al. 2022). In NL, water treatment in approximately 65% of communities is limited to chlorination (Newfoundland Labrador 2022). Exclusive reliance on chlorination for drinking water treatment has been linked to higher incidence of AGI in Canada (Murphy et al. 2016). Other jurisdictions in Canada (e.g., ON) expect small municipal systems to achieve the same treatment objectives as larger municipal systems through a combination of filtration and disinfection (Safe Drinking Water Act 2002), but small and remote municipalities often face additional challenges achieving these (Hrudey et al. 2006; Castleden et al. 2015). This puts small water systems at a higher risk of enteric waterborne disease resulting from inadequate treatment and infrastructure, poor source water quality, and insufficient operations and maintenance (Edwards et al. 2012). The residents of these communities must also engage in time-consuming and(or) expensive activities (e.g., boiling or purchasing water) to ensure that they have access to clean water (Health Canada 2015).
5.2. Source water impacts
Source water is rarely the direct cause of BWAs in Canada, but particularly in communities that lack rigorous water treatment infrastructure, it can make water treatment more difficult and(or) expensive and in communities with limited treatment (e.g., chlorination only) directly impact distributed water quality. Groundwater supplies are associated with a disproportionate amount of BWAs in Canada (Fig. 2), possibly because groundwater supplies are commonly used in smaller communities and(or) because the treatment requirements for water treatment plants using groundwater supplies are often less rigorous than for surface water supplies (Elliot et al. 2022; Newfoundland Labrador 2022). Groundwater is vulnerable to contamination during floods (Andrade et al. 2018; McKenzie et al. 2021; Paldor and Michael 2021; Su et al. 2022), and its quantity can be impacted by drought. Small groundwater-supplied communities in areas that are likely to be impacted by these coastal floods or droughts are thus particularly vulnerable to increased water safety hazards.
5.3. Water treatment equipment and operation
Our analysis of the CNPHI database indicated that fewer than 5% of the BWAs issued in Canada between 2005 and 2020 were primarily linked to poor design or failure of water treatment unit processes. Nonetheless, treatment plants that are unable to reliably remove particulate, NOM, and other contaminants can indirectly reduce downstream water safety in ways that increase a community’s chance of experiencing a BWA. Systems that rely exclusively on chlorination are particularly vulnerable—previous research has linked these systems to higher incidence of AGI (Murphy et al. 2016). Similarly, climate change phenomena are likely to impact water treatment plant equipment and operation in indirect ways. For example, increases in the frequency and intensity of wet weather events and wildfires are both likely to increase the concentration and change the characteristics of NOM in ways that will affect coagulant dosing requirements, increase DBP formation, and(or) interfere with UV and chemical disinfection. Drought may increase de facto reuse of wastewater (Rice et al. 2013; Benotti et al. 2010; Rice and Westerhoff 2015), and large rain events after droughts are likely to cause sudden influxes of contaminants into surface water supplies (Mosley 2015; Kolijn 2021). These changes to contaminant loading and character are likely to tax existing water treatment plants, leading to higher chemical and energy costs and potentially more frequent treatment failures.
5.4. Water distribution system infrastructure
Our analysis of the CNPHI data set clearly indicates that water distribution systems are the main source of water safety risk in Canada as indicated by the number of BWAs issued for distribution-related reasons. Precautionary BWAs are usually called when there is a line break or pressure loss in the system because there is the potential for the pipe and(or) distributed water to become contaminated. This concern is well-founded—a systematic review of 20 studies linked increased incidence of AGI to low pressure and interrupted tap water supply in water distribution systems (Ercumen et al. 2014). An epidemiological case study in the US reported that AGI was more prevalent in households that experienced prolonged low pressure or full interruption of water service due to water main breaks than comparable households that were not impacted by these phenomena (Gargano et al. 2015).
The seasonal patterns in the secondary causes of distribution infrastructure failure described in Fig. 5 are in line with seasonal trends reported in established literature, namely the fact that pipe line breaks tend to peak near the end of the winter season when temperatures are at their lowest (Kleiner and Rajani 2002; Harvey et al. 2014; Barton et al. 2019). Average temperatures, including winter temperatures, are expected to increase in Canada due to climate change, as are the number of frost-free days (Bush and Lemmen 2019), which may shift existing seasonal patterns in pipe breaks across Canada. Some types of pipes, notably asbestos cement, are more likely to fail at higher temperatures (Wols et al. 2019), and it is conceivable that pipe breaks in asbestos cement pipes may increase as temperatures increase in Canada and elsewhere in the world. Increased frequency and intensity of precipitation events and droughts due to climate change may exacerbate changes in soil moisture content and soil conductivity, potentially increasing the likelihood of pipe breakage. The interactions between temperature, soil moisture content, and soil conductivity are complex (Kleiner and Rajani 2002; (Barton et al. 2019), however, and it remains unclear how these phenomena will interact with one another and with buried water infrastructure as time progresses. Irrespective of these interactions and their effects, ageing drinking water distribution infrastructure is currently and will likely remain an important source of water safety risk in Canada and the renewal and maintenance of this infrastructure should be a priority, especially in smaller communities.
5.5. Distributed water quality
Increased risk of contamination of distributed water is ultimately the underlying cause of all BWAs, whether they are called because there is evidence of microbial contamination (emergency BWAs) or when there is the potential for contamination (precautionary BWAs). Based on our literature review, many climate change phenomena that negatively impact source water quality, water treatment, and distribution infrastructure integrity could have indirect effects on distributed water quality as described in Sections 5.2–5.4 and in Table 1.
Climate change may also have direct effects on distributed water quality. For example, higher average temperatures can encourage microbial regrowth and increase the rate of decay of disinfectant residuals (Fisher et al. 2012; Health Canada 2021), and past studies have determined a disproportionate number of waterborne outbreaks in warmer months (Thomas et al. 2006). The seasonal trends in Fig. 6 of this study clearly illustrate that BWAs related to microbial contamination and inadequate disinfection residual peak in the warmest months of the year. Whether these BWAs were directly related to warmer conditions in the distribution system or caused by a combination of direct and indirect factors remains unclear. Ultimately, both emergency and precautionary BWAs, and the increased water safety risk that they represent, will only be minimized by holistic solutions that address both the direct and multiple indirect effects of climate change on distributed water quality.
5.6. Limitations and research gaps
This is the first study to analyze a Canada-wide BWA database and interpret it in the context of climate change. Nonetheless, important limitations exist in this work. Notably, the anonymization of the data provided by CNPHI made it impossible to analyze regional and local trends in BWAs, to link them to existing and projected future environmental conditions, or to cross-reference the data with capital or operational costing data. The data set also lacked information about the design and operation of water treatment and distribution infrastructure as well as details about operator training and certification. Thus, important research gaps remain regarding the specific impacts of climate change on water safety in different parts of Canada and the best ways to minimize BWAs now and in the future.
6. Conclusions and recommendations
Canada has and will continue to experience an increase in both frequency and intensity of extreme weather events, which can directly and indirectly impact drinking water infrastructure and overall drinking water safety. The main ideas and conclusions of this review can be summarized as following:
•
Climate change phenomena such as increased temperatures, sea level rise, flooding, drought, forest fires, and permafrost thaws can have negative impacts on drinking water sources and infrastructure.
•
Most of the BWAs that were issued in Canada between 2005 and 2020 were related to the failure of distribution system infrastructure.
•
Small communities experience the most frequent, long-term, and repeated BWAs than larger communities.
•
A disproportionate number of BWAs were associated with groundwater supplies.
•
Seasonal trends exist in the number of BWAs issued due to line breaks and pressure losses in the distribution system and distributed water quality concerns.
Thus, climate change phenomena that result in changes in seasonal weather patterns and(or) that negatively impact distribution system components, groundwater sources, and small and remote communities should be front of mind for utilities and other practitioners aiming to increase the resilience of their water infrastructure. Based on our analysis, we have five recommendations for how this work could be expanded and used to develop sustainable and resilient drinking water solutions in Canada.
Recommendation #1: Use case studies and regional data sets to elucidate the impacts of regulatory approaches, system design guidelines, and local climate projections on water safety.
Different regions of Canada have and will continue to experience different climate extremes across various climate aspects (Bush and Lemmen 2019). The vulnerability of each region to climate change depends on the type of extreme weather event being considered; although national climate change adaptation policies have been proposed, it’s important for region-specific and locally adapted policies to be developed to address these differences (Luh et al. 2015). We recommend that our current analysis be expanded by collecting and analyzing data from different jurisdictions in Canada in collaboration with relevant governmental bodies and other stakeholders. This would enable a more granular exploration of the potential intersections among water safety (as indicated by BWAs), water infrastructure, and climate change. This would also allow for a more accurate evaluation of seasonal effects without interference from changing reporting and data collection methods. Some jurisdictions, including NB and NL, maintain public BWA databases on their provincial government websites (Lane and Gagnon 2020), though the former only includes data from 2020 to 2023 and the latter is limited to current BWAs. In-depth historical BWA data for First Nations in Canada can be gleaned from existing academic and industry literature (e.g., (Neegan Burnside Ltd. 2011), and Indigenous Services Canada maintains a list of boil water advisories called in First Nations communities in 2022 and 2023 on their website, but it is worth noting that in recent years important concerns have been raised about Indigenous data sovereignty (The First Nations Information Governance Centre 2019), and these should be taken into account during any future analysis of BWA data from Indigenous communities.
Recommendation #2: Cross-reference BWA and other water safety data with water infrastructure costing data and socioeconomic indicators to better understand the cost and social impacts of climate change on drinking water systems and water users.
The short- and long-term monetary costs of BWAs are not well understood. We recommend that existing data related to BWAs in Canada be disaggregated by jurisdiction and location and cross-referenced with the cost of designing, building, and operating water infrastructure. Data should also be collected regarding the socioeconomic costs of BWAs, particularly repeat and long-term BWAs, on small communities. This information will help governments prioritize solutions that are most likely to increase infrastructure resilience, water safety, community well-being, and short- and long-term emergency preparedness planning (e.g., evacuation or forced migration due to deteriorated water safety).
Recommendation #3: Mobilize industry expertise to develop cost-effective and sustainable long-term water safety solutions that are resilient to expected climate change phenomena.
The American Water Works Association’s State of the Industry Report, which collects data from water professionals across North America, listed “renewal and replacement of aging water infrastructure” as the most important issue facing the water industry in 2022. Long-term water supply availability, emergency preparedness, and source water protection were also in the top 10 (AWWA 2022). Clearly, water industry professionals are aware of the vulnerabilities identified in the current study and eager to contribute their expertise to address them. We propose that this industry knowledge and drive be harnessed to ideate climate resilient, economically sustainable, and culturally appropriate solutions to these problems.
Frameworks for this have already been proposed. The Public Infrastructure Engineering Vulnerability Committee protocol combines the expertise of professional and local stakeholders, and location-specific climate information is used to produce a realistic estimate of the severity of an infrastructure-climate interaction (PIEVC 2016). The First Nations Resilience Toolkit (FN-IRT), released in 2020, is an example of how the original PIEVC tool can be adapted to include important jurisdictional and cultural considerations. Summaries of past PIEVC projects and an example of the application of the FN-IRT (Stantec Consulting Ltd. 2020) can be accessed online (https://pievc.ca/). Similarly, a joint exercise between the Water Research Foundation and the National Research Council of Canada (Imran et al. 2009) combined established water chemistry concepts with stakeholder engagement activities to identify the potential downstream impacts of water treatment process changes on distribution system infrastructure and distributed water quality. Many other models, frameworks, and consultative processes that could be used to better understand existing problems and develop solutions have been proposed in the literature and by government bodies. We recommend that these be reviewed along with the PIEVC and the Water Research Foundation project and piloted with representative stakeholder groups in Canada.
Recommendation #4: Harmonization of BWA policies and reporting procedures across Canada
Each jurisdiction in Canada, including the 10 provinces, 3 territories, and areas under federal jurisdiction, has a distinct set of policies, criteria, and implementation procedures for BWAs. This results in a lack of consistency and general form in the collected data and information, making it difficult to compile an accurate and consistent data set (Lane and Gagnon 2020). Harmonization of BWA policies and record keeping across Canadian jurisdictions is no simple matter, but it would greatly benefit future research and policy development. The CNPHI database is an important step in the right direction.
Recommendation #5: Work to shift public perception of water safety in Canada from BWAs to a more holistic and comprehensive understanding of safe water.
The near exclusive focus on BWAs in public discourse is problematic as BWAs do not address other water safety concerns, including metals (e.g., lead), cyanotoxins, legacy industrial contamination, or endocrine-disrupting compounds. Opening up the public conversation to include multiple water safety concerns, instead of simply BWAs, would give the public a better understanding of the complexity of water quality and safety. Finally, BWAs are reactive, not proactive, and are implemented from the top down. This is an understandable but nonetheless disempowering approach to water safety that clearly is not working for many of the smallest and most vulnerable communities in Canada. An alternative approach is required that explicitly accounts for aesthetic water quality, local environmental conditions, and cultural practices and preferences.
Acknowledgements
We thank Tim Beattie at CNPHI for providing the anonymized BWA data set and background information about how the data were collected and organized; Judy McDonald for making the connections required to get this work started; Danker Koljin for his climate change expertise; Caroline Duncan for her helpful feedback about presentation; attendees of the 2022 Annual OWWA Conference in Niagara Falls whose insightful questions and comments inspired us to explore seasonal BWA trends in greater detail; and the NSERC Discovery Grant Program and York University for providing funding support.
References
Abbott B., Jones J., Godsey S., Larouche J., Bowden W. 2015. Patters and persistence of hydrologic carbon and nutrient export from collapsing upland permafrost. Biogeosciences, 12, 3725–3740.
Anderson L.E., Krosek W.H., Stoddart A.K., Trueman B.F., Gagnon G.A. 2016. Lake recovery through reduced sulfate deposition: a new paradigm for drinking water treatment. Environment Science & Technology, 1414–1422.
Andrade L., O’Dwyer J., O’Neill E., Hynds P. 2018. Surface water flooding, groundwater contamination, and entric disease in developed countries: a scoping review of connections and consequences. Environmental Pollution, 540–549.
Arrighi C., Tarani F. 2017. Flood impacts on a water distribution network. Natural Hazards and Earth System Sciences, 17: 2109–2123.
AWWA. 2022. State of the Water Industry ’22 executive summary. American Water Works Association.
Baracos A., Hurst W., Legget R. 1955. Effects of physical environment on cast-iron pipe. American Water Works Association. Available from https://www.jstor.org/stable/41254520. [accessed on September 10th, 2023].
Barton N.A., Farewell T.S., Hallet S.H., Acland T.F. 2019. Improving pipe failure predictions: factors affecting pipe failure in drinking water networks. Water Research, 164: 114926.
Bates B., Kundzewicz Z.W., Shaohong W., Palutikof J. (Editors). 2008. Climate change and water. IPCC Working Group, Geneva.
BBC News. 2022. Hurricane Fiona: Canada hit by ‘historic, extreme event’. https://www.bbc.com/news/world-us-canada-63011195. [accessed on April 15th, 2023].
Benotti M.J., Stanford B.D., Snyder S.A. 2010. Impact of drought on wastewater contaminants in an urban water supply. Journal of Environmental Quality, 39: 1196–1200.
Bertone E., Sahin O., Richards R., Roiko A. 2016. Extreme events, water quality and health: a participatory Bayesian risk assessment tool for managers of reservoirs. Cleaner Production, 135: 657–667.
Bladon K.D., Emelko M.B., Silins U., Stone M. 2014. Wildfire and the future of water supply. Environment Science & Technology, 48: 8936–8943.
Bonsal B.R., Peters D.L., Seglenieks F., Rivera A., Berg A. 2019. Changes in freshwater availability across Canada. In Canada’s changing climate report (chapter 6). Bush E., Lemmen D.S. Ottawa.
Bush E., Lemmen D.S. 2019. Canada’s changing climate report. Environment and Climate Change Canada, Gatineau, QC.
Bush E., Bonsal B.D., Flato G., Fyfe J., Gillet N., Greenan B.J., Zhang X. 2022. Canada’s changing climate report in light of the latest global science assessment. Government of Canada, Ottawa, ON.
Cantwell R.E., Hofmann R. 2008. Inactivation of indigenous coliform bacteria in unfiltered surface water by ultraviolet light. Water Research, 42: 2729–2735.
Castleden H., Crooks V.A., Meerveld I.V. 2015. Examining the public health implications of drinking water-related behaviours and perceptions: a face-to-face exploratory survey of residents in eight coastal communities in British Columbia and Nova Scotia. The Canadian Geographer, 59(2): 111–125.
CBC News. 2022. Post-tropical storm Fiona most costly weather event to ever hit Atlantic Canada, new estimate says. NS.
Chan D., Gallage C.P., Rajeev P., Kodikara J. 2015. Field performance of in-service cast iron water reticulation pipe buried in reactive clay. Canadian Geotechnical Journal 52: 1861–1873.
Chattha S. 2019. Hurricane Dorian causes $105 million in insured damage. Water Canada. Available from https://www.watercanada.net/hurricane-dorian-causes-105-million-in-insured-damage/.
Clark C.M. 1971. Expansive-soil effect on buried pipe. Journal of American Water Works Association, 63: 424–427. Available from www.jstor.org/stable/41266407.
Cohen S., Bush E., Zhang X., Gillett N., Bonsal B., Derksen C., Flato G. 2019. Changes in Canada’s regions in a national and global context. In Canada’s Changing Climate Report (chapter 8). Government of Canada.
Crittenden J.C., Trussell R.R., Hand D.W., Howe K.J., Tchobanoglous G. 2012. MWH’s water treatment: principle and design. 3rd ed. John Wiley & Songs Inc.
de Wit H.A., Valinia S., Weyhenmeyer G.A., Futter M.N., Kortelainen P., Austnes K., Vuorenmaa J. 2016. Current browing of surface waters will Be further promoted by wetter climate. Environment Science & Technology Letters, 430–435.
Doria M.F. 2006. Bottled water versus tap water: understanding consumers’ preference. Journal of Water Health, 4: 271–276.
Ebacher G., Besner M.-C., Prevost M. 2013. Submerged appurtenances and pipelines: an assessment of water levels and contaminant occurance. Journal of American Water Works Association, 105: E684–E698.
Edwards J.E., Henderson S.B., Struck S., Kosatsky T. 2012. Characteristics of small residential and commercial water systems that influence their likelihood of being on drinking water advisories in rural British Columbia, Canada: a cross-sectional study using administrative data. Journal of Water Health, 10(4): 629–649.
Elliot J., Clayden M.G., Clouter K., Collins S., Tremblay T., LeBlanc-Havard M. 2022. Community water quality data across Nunavut: an Introduction to available data for community water supplies. Summer of Activities 2021. pp. 57–68. Available from https://cngo.ca/summary-of-activities/2021/.
Emelko M.B., Silins U., Bladon K.D., Stone M. 2011. Implications of land disturbance on drinking water treatability in a changing climate: demonstrating the need for "source water supply and protection" strategies. Water Research, 45: 461–472.
Environment and Climate Change Canada. 2022. Canadian environmental sustainability indicators: boil water advisories. Environment and Climate Change Canada. https://www.canada.ca/en/environment-climate-change/services/environmental-indicators/boil-water-advisories.html. [accessed on August 15th, 2022].
Ercumen A., Gruber J.S., Colford J.M. 2014. Water distribution system deficiencies and gastrointestinal illnesses: a systematic review and meta-analysis. Environmental Health Perspectives, 122(7): 651–660.
Findley D., Monsell B., Bell W., Otto M., Chen B. 1998. New capabilities and methods of the X-12-ARIMA seasonal-adjustment program. Journal of Business and Economic Statistics, 16:127–152.
Fisher I., Kastl G., Sathasivan A. 2012. A suitable model of combined effects of temperature and initial condition on chlorine bulk decay in water distribution systems. Water Research, 46: 3293–3303.
Galway L. 2016. Boiling over: a descriptive analysis of drinking water advisories in First Nations communities in Ontario, Canada. International Journal of Environmental Research and Public Health, 13: 505.
Gargano J., Freeland A., Morrison M., Stevens K., Zajac L., Wolkon A., Brunkard J. 2015. Acute gastrointestinal illness following a prolonged community-wide water emergency.Epidemiology and Infection, 143: 2766–2776.
Goldhar C., Bell T., Wolf J. 2013. Vulnerability to freshwater changes in the Inuit settlement region of Nunatsiavut, Labrador: a case study from Rigolet. Arctic, 71–83. Available from https://www.jstor.org/stable/24363722.
Greenan B.J.W., James S.J., Loder J.W., Pepin P., Azetsu-Scott K., Ianson D. et al. 2019. Changes in oceans surrounding Canada. In Canada’s changing climate report (chapter 7). Edited by Bush E., Lemmen D.S. Government of Canada.
Harvey R., McBean E.A., Gharabaghi B. 2014. Predicting the timing of water main failure using artificial neural networks. Journal of Water Resources Planning and Management, 425–434.
Healey J. 2019. Hurricane damage: raw sewage dumped into Lunenburg Harbour after sea water gets ‘in places it had never been before’. Nova Scotia: Saltwire. Available from https://www.saltwire.com/nova-scotia/news/hurricane-damage-raw-sewage-dumped-into-lunenburg-harbour-after-sea-water-gets-in-places-it-had-never-been-before-350847/. [accessed on July 17th, 2022].
Health Canada. 2015. Guidance for issuing and rescinding boil water advisories in Canadian drinking water supplies. Minister of Health, Ottawa.
Health Canada. 2020. Guidelines for Canadian drinking water quality: guideline technical document—chloramines. Available from https://www.canada.ca/en/health-canada/services/publications/healthy-living/guidelines-canadian-drinking-water-quality-guideline-technical-document-chloramines.html#s4-4-1. [accessed on July 17th, 2022].
Health Canada. 2021. Guidance on the temperature aspects of drinking water. Water and Air Quality Bureau, Health Environments and Consumer Safety Branch, Ottawa.
Hohner A.K., Rhoades C.C., Wilkerson P., Rosario-Ortiz F.L. 2019. Wildfires alter forest watersheds and threaten drinking water quality. Accounts of Chemical Research. 52: 1234–1244.
Howe S. n.d. GWI Program. Washington State Department of Health. Available from https://www.doh.wa.gov/CommunityandEnvironment/DrinkingWater/SourceWater/GWIProgram. [accessed on June 18th, 2022].
Hrudey S.E., Hrudey E.J., Pollard S.J. 2006. Risk management for assuring safe drinking water. Environment International, 32, 948–957.
Hurst A., Edwards M., Chipps M., Jefferson B., Parsons S. 2004. The impact of rainstorm events on coagulation and clarifier performance in potable water treatment. Science of the Total Environment, 219–230.
IBC. 2021. Hurricane Larry caused $25 million in insured damage. Insurance Bureau of Canada, Halifax. Available from http://www.ibc.ca/nl/resources/media-centre/media-releases/hurricane-larry-caused-25-million-in-insured-damage. [accessed on July 7th, 2022].
IJC. 2021. A proof-of-concept pilot study transboundary monitoring of environmental factors and their influence on waterborne protozoan acute gastrointestinal illnesses in cities that source water from the Great Lakes. International Joint Commission by the Health Professionals Advisory Board.
Imran S.A., Sadiq R., Kleiner Y. 2009. Effects of regulation and treatment technologies on water distribution infrastructure. Journal of American Water Works Assoc., 101(3): 82–95.
Jadas-Hécart A., El Morer A., Stitou M., Bouillot P., Legube B. 1992. The chlorine demand of a treated water. Water Research, 26: 1073–1084.
Kapoor V., Gupta I., Pasha Tanvir A., Phan D. 2018. Real-time quantitative PCR measurements of fecal indicator bacteria and human-associated source tracking markers in a Texas river following Hurricane Harvey. Environmental Science & Technology Letters, 5(322–328): 2018.
Khan S.J., Deere D., Leush F., Humpage A., Jenkins M., Cunliffe D. 2015. Extreme weather events: should drinking water quality management. Water Research, 85: 124–136.
Kleiner Y., Rajani B. 2002. Forecasting variations and trends in water-main breaks. Journal of Infrastructure Systems, 8: 122–131.
Kolijn D. 2021. Climate change effects in Canada relevant to drinking water safety and infrastructure. (S. Moghaddam-Ghadimi, Interviewer).
Lane K., Gagnon G. 2020. Evaluating the use and intent of drinking water advisories in Atlantic Canada. Water Policy, 22: 908–924.
Lassiter A. 2021. Rising seas, changing salt lines, and drinking water salinization. Current Opinion in Environmental Sustainability, 50: 208–214.
Lawrence J., Mackey B. 2022. Austalasia. In IPCC WGII Sixth Assesment Report (Chapter 11). IPCC.
Linden K., Darby J.L. 1998. Ultraviolet disinfection of marginal effluents: determining ultraviolet absorbance and subsequent estimation of ultraviolet intensity. Water Environment Research, 70: 214–223.
Luh J., Christenson E., Toregozhina A., Holcomb D.A., Witsil T., Hamrick L., Bartram J. 2015. Vulnerability assessment for loss of access to drinking water due to extreme weather events. Climatic Change, 133: 665–679.
McKenzie T., Habel S., Dulai H. 2021a. Sea-level rise drives wastewater leakage to coastal waters and storm drains. Limnology and Oceanography Letters, 6: 154–163.
Meyer-Jacob C., Michelutti N., Paterson A.M., Monteith D., Yang H., Weckstrom J., Bindler R. 2017. Inferring past trends in lake water organic carbon concentrations in Northern Lakes using sediment spectroscopy. Environment Science & Technology, 51: 13248–13255.
Miner K.R., D’Andrilli J., Mackelprang R., Edwards A., Malaska M.J., Waldrop M.P., Miller C.E. 2021. Emergent biogeochemical risks from Arctic permafrost degradation. Nature Climate Change, 11: 809–819.
Minnes S., Vodden K. 2017. The capacity gap: understanding impediments to sustainable drinking water systems in rural Newfoundland and Labrador. Canadian Water Resources Journal / Revue canadienne des ressources hydriques, 42: 163 to 178.
Moffatt H., Struck S. 2011. Water-born disease outbreaks in Canadian small drinking water systems. National Collaborating Centres for Public Health.
Mosley L.M. 2015. Drought impacts on the water quality of freshwater systems; review and integration. Earth-Science Review, 140: 203–214.
Mulligan R.P. 2022. Fiona hits Atlantic Canada: climate change means the region will see more frequent storms. https://theconversation.com/fiona-hits-atlantic-canada-climate-change-means-the-region-will-see-more-frequent-storms-191313. [accessed on April 15th, 2023].
Murphy H., Thomas M., Schmidt P., Medeiros D., McFadyen S., Pintar K. 2016. Estimating the burden of acute gastrointestinal illness due to Giardia, Cryposporidium, Campylobacter, E. coli O157 and norovirus associated with private wells and small water systems in Canada. Epidemiology and Infection, 144: 1355–1370.
Neegan Burnside Ltd. 2011. National assessment of First Nations water and wastewater systems.
Neil C.W., Zhao Y., Zhao A., Neal J., Meyer M., Jeffrey Yang Y. 2019. Trihalomethane precursor reactivity changes in drinking water treatment unit processes during a storm event. Water Science Technology Water Supply, 19: 2098–2106.
Newfoundland Labrador. 2022. Newfoundland and Labrador Water Resources Portal. Available from https://maps.gov.nl.ca/water/#PublicWater. [accessed on September 30th, 2022].
Nova Scotia. 2022. Hurricane Fiona update. Nova Scotia. https://novascotia.ca/news/release/?id=20220924001. [accessed on April 15th, 2023].
Nova Scotia Environment. n.d. Appendix A—protocol for determining groundwater under direct influence of surface water. Environmental Science and Program Management Divison. https://novascotia.ca/nse/water/docs/Treatment_Standards_for_Municipal_Drinking_Water_Systems_Appendix%20A.pdf. [accessed on January 15th, 2021].
O’Dwyer J., Morris Downes M., Adley C.C. 2016. The impact of meterology on the occurence of waterborne outbreaks of vero cytotoxins-producing Escherichia coli (VTEC): a logistic regression approach. Journal of Water and Health, 14: 39–46.
O’Neill B., Aalast M.V., Ibrahim Z.Z., Zaiton Z. 2022. Key risks across sectors and regions. In IPCC WGII Sixth Assessment Report (Chapter 16). IPCC.
Paldor A., Michael H. 2021. Storm surges cause simulataneous salinization and feshening of coastal aquifers, exacerbated by climate change. Water Resources Research, 57.
Pieper K.J., Jones C.N., Rhoads W.J., Rome M., Gholson D.M., Katner A., Beighley R.E. 2021. Microbial contamination of drinking water supplied by private wells after Hurricane Harvey. Environment Science & Technology, 55: 8382–8392.
PIEVC. 2016. Principles and guidelines: fundamentals of risk and risk assessment.
Rice J., Westerhoff P. 2015. Spatial and temporal variation in de facto wastewater reuse in drinking water systems across the U.S.A. Environment Science & Technology, 49: 982–989.
Rice J., Wutich A., Westerhoff P. 2013. Assessment of de facto wastewater reuse across the U.S.: Trends between 1980 and 2008. Evironmental Science & Technology, 11099–11105.
Rotzoll K., Fletcher C.H. 2013. Assessment of groundwater inundation as a consequence of sea-level rise. Nature Climate Change, 3: 477–481.
Safe Drinking Water Act. 2002.
Schaefer K., Elshorbany Y., Jafarov E., Schuster P.F., Striegl R.G., Wickland K.P., Sunderland E.M. 2020. Potential impacts of mercury released from thawing permafrost. Nature Communications, 11.
Snodden R. 2019. How does Dorian compare to 2003’s Hurricane Juan? CBC News. Available from https://www.cbc.ca/news/canada/nova-scotia/snoddon-tropical-weather-1.5277600. [accessed on September 30th, 2022].
Stantec Consulting Ltd. 2020. Climate change risk assessment Kasabonika Lake First Nation infrastructure.
Statistics Canada. 2022. Biennial Drinking Water Plants Survey (DKWP). Government of Canada. Available from https://www23.statcan.gc.ca/imdb/p2SV.pl?Function=getSurvey&Id=1260950. [accessed on September 25th, 2022].
Su X., Belvedere P., Tosco T., Prigiobbe V. 2022. Studying the effect of sea level rise on nuisance flooding due to groundwater in a coastal urban area with aging infrastructure. Urban Climate, 43: 101164.
Swanson D., Murphy D., Temmer J., Scaletta T. 2021. Advancing the climate resilience of Canadian infrastructure: a review of literature to inform the way forward. International Institute for Sustainable Development, Winnipeg.
Taylor R.G., Scanlon B., Döll P., Rodell M., Beek R.V., Wada Y., et al. 2013. Ground water and climate change. Nature Climate Change, 3: 322–329.
The First Nations Information Governance Centre. 2019. First Nations data sovereignty in Canada. Statistical Journal of the IAOS, 35: 47–69.
Thienpont J.R., Ruhland K.M., Pisaric M.F., Kokelj S.V., Kimpe L.E., Blias J.M., Smol J.P. 2013. Biological responses to permafrost thaw slumping in Canadian Arctic lakes. Freshwater Biology, 58: 337–353.
Thomas K.M., Charron D.F., Waltner-Toews D., Schuster C., Maarouf A.R., Holt J.D. 2006. A role of high impact weather events in waterborne disease outbreaks in Canada, 1975–2001. International Journal of Environmental Health Research, 16: 167–180.
Thompson K.A., Dickenson E.R. 2021. Using machine learning classification to detect simulated increases of de facto reuse and urban stormwater surges in surface water. Water Research, 204: 117556.
US E.P.A. 2006a. EPA’s and Mississippi’s efforts to assess and restore public drinking water supplies after Hurricane Katrina. U.S. Environmental Protection Agency Office of Inspector General.
US E.P.A. 2006b. EPA’s and Louisiana’s efforts to assess and restore public drinking water systems after Hurricane Katrina. United States Environmental Protection Agency Office of Inspector General.
USAID. 2017. Annex to the Climate Risk Screening and Management Tools.
Vonk J., Tank S., Bowden W., Laurion I., Vincent W., Alekseychik P. 2015. Reviews and syntheses: effects of permafrost thaw on Arctic aquatic ecosystems. Biogeosciences, 12: 7129–7167.
Ward N., Roberts D. 2022. ‘Total devastation’ as Port aux Basques declares state of emergency due to post-tropical storm Fiona. St. John, NL, Canada. https://www.cbc.ca/news/canada/newfoundland-labrador/hurricane-fiona-nl-saturday-1.6594422. [accessed on April 13th, 2023].
Warren F.J., Lulham N. 2021. Canada in a changing climate: National Issues Report. Government of Canada, Ottawa, ON.
Wasim M., Shoaib S., Mubarak N., Inamuddin, Asiri A.M. 2018. Factors influencing corrosion of metal pipes in soils. Environmental Chemistry Letters, 16: 861–879.
Williamson C.E., Madronich S., Lal A., Zepp R.G., Lucas R.M., Overholt E.P., Lee-Taylor J. 2017. Climate change-induced increases in precipitation are reducing the potential for solar ultraviolet radiation to inactivate pathogens in surface water. Scientific Reports, 7.
Wols B., Vogelaar A., Moerman A., Raterman B. 2019. Effects of weather conditions on drinking water distirbution pipe failures in the Netherlands. Water Supply, 19: 404–416.
Zhang Y., Gao X., Smith K., Inial G., Liu S., Conil L.B., Pan B. 2019. Integrating water quality and operation into prediction of water production in drinking water treatment plants by genetic algorith enhanced artificial neural network. Water Research, 164: 114888.
Zhou Y., Liu M., Zhou L., Jang K.-S., Xu H., Shi K., Wu F. 2020. Rainstorm events shift the molecular composition and export of dissolved organic matter in a large drinking water reservoir in China: high frequency buoys and field observations. Water Research, 187: 116471.
Supplementary material
Supplementary Material 1 (DOCX / 1.96 MB).
- Download
- 1.96 MB
Information & Authors
Information
Published In

FACETS
Volume 8 • January 2023
Pages: 1 - 21
Editor: Yann Joly
History
Received: 25 October 2022
Accepted: 10 May 2023
Version of record online: 31 July 2023
Copyright
© 2023 The Author(s). This work is licensed under a Creative Commons Attribution 4.0 International License (CC BY 4.0), which permits unrestricted use, distribution, and reproduction in any medium, provided the original author(s) and source are credited.
Data Availability Statement
Anonymized boil water advisory data were provided by the Canadian Network for Public Health Intelligence under an information-sharing agreement with the authors. Data generated by the authors in this study are available upon request.
Key Words
Sections
Subjects
Plain Language Summary
Boil water advisories and climate change in Canada
Authors
Author Contributions
Conceptualization: SM, SLG
Data curation: SM, AT
Formal analysis: SM, AT
Funding acquisition: SLG
Methodology: SM, SLG
Project administration: SLG
Resources: SLG
Visualization: SM, AT, SLG
Writing – original draft: SM, AT, UTK, SLG
Writing – review & editing: SM, UTK, SLG
Competing Interests
The authors declare that there are no competing interests.
Funding Information
This work was supported by the NSERC Discovery Grant (2021-03620).
Metrics & Citations
Metrics
Other Metrics
Citations
Cite As
Sara Moghaddam-Ghadimi, Audrey Tam, Usman T. Khan, and Stephanie L. Gora. 2023. How might climate change impact water safety and boil water advisories in Canada?. FACETS.
8(): 1-21. https://doi.org/10.1139/facets-2022-0223
Export Citations
If you have the appropriate software installed, you can download article citation data to the citation manager of your choice. Simply select your manager software from the list below and click Download.
There are no citations for this item