Using transcriptomics to examine the physiological status of wild-caught walleye (Sander vitreus)
Abstract
Lake Winnipeg, Manitoba, is Canada’s second largest commercial inland freshwater fishery, and concern over collapse of the walleye fishery is growing. Molecular techniques have been increasingly used to study responses of wild organisms to environmental and anthropogenic stressors. The present study used transcriptomics to examine the physiology of wild-caught walleye (Sander vitreus (Mitchell, 1818)) across Lake Winnipeg using non-lethal techniques. Gill transcriptomes of walleye sampled from the north and south basins of Lake Winnipeg, and the channel connecting them, exhibited distinct profiles implicating regionally specific biological responses. North basin walleye exhibited transcriptomic responses indicative of exposure to environmental stressors. Transcriptomic patterns suggested a shift to increased reliance on anaerobic metabolism and up-regulation of hypoxia-sensitive genes in north basin fish, possibly representing exposure to low-oxygen conditions. Exposure to environmental stressors may also have driven increases in gene transcripts associated with proteasomal catabolism, DNA repair, molecular chaperones, and ion regulation. North basin fish also exhibited transcriptomic patterns indicative of gill remodeling via regulation of the mTOR pathway, cytoskeleton reorganization, and fatty acid synthesis. Our results highlight the complexity of examining wild fish across environmental gradients but also the potential use of molecular techniques in elucidating organismal sensitivity to local environmental factors.
Introduction
Anthropogenic stressors increasingly harm aquatic ecosystems, resulting in population declines of species over time. For the conservation of aquatic organisms, it thus becomes fundamental to understand how species and populations respond to a changing environment throughout their distribution. In their environments, organisms may experience abiotic stressors (e.g., temperature, dissolved oxygen, salinity, and pH), biotic stressors (e.g., intraspecific competition, invasive species, pathogens, and predators), and anthropogenic stressors (e.g., fisheries, habitat degradation, and pollutants) (Schulte 2014). These environmental stressors may act on their own or, more likely, as parts of complex interactions (Crain et al. 2008; Jackson et al. 2016). Due to the presence of multiple stressors in many ecosystems, deciphering the responses of organisms to these environmental stressors can be challenging. Physiological responses of wild organisms are also mediated by previous exposure history as well as genomic variation that may be associated with adaptations to local environmental conditions (Whitehead et al. 2011; Crozier and Hutchings 2014). Therefore, when considering the conservation of a species, it becomes important to consider the physiological responses of that species across its distribution to determine how the local environment as well as genetic factors may influence these responses (Homyack 2010; Cooke et al. 2013).
The physiological response to stressors is typically characterized as an integrated response to cope with the stress and reestablish homeostasis. Part of this integrated organismal response to stressors is through changes in gene expression (e.g., Jeffries et al. 2021). The gene expression response to environmental stressors is complex and can be influenced by several factors, contributing to phenotypic variation within and among populations (Whitehead and Crawford 2006; López-Maury et al. 2008). The abundance of mRNA transcripts, the intermediate step between the transcription of the gene coding region of DNA and the translation into proteins, is a useful approximation of gene expression (Buccitelli and Selbach 2020). In particular, whole-transcriptomic (e.g., mRNA sequencing (RNA-seq)) approaches provide a mechanism to examine transcriptome profiles of wild, non-model species, for which genomic resources may be limited (Connon et al. 2018) to assess the cellular processes that are responding to a stressor. The transcriptomic responses of wild organisms to local environments can provide valuable insight into the cellular responses to a variety of stressors and are particularly useful when those environmental stressors are not well understood in a system (Semeniuk et al. 2022). In line with this approach, transcriptomic analyses can provide information about what stressors may be present in an environment and acting on local species. For instance, liver transcriptional analyses revealed that silver carp (Hypophthalmichthys molitrix (Valenciennes in Cuvier and Valenciennes, 1844)) residing at the leading edge of their range in the Illinois River (Illinois, USA) may be living in more polluted habitats compared to fish at the center of their distribution (Jeffrey et al. 2019). Similarly, transcriptomic patterns in wild Pacific salmon suggest that responses to viral pathogens may be impacting both freshwater migration and return migration, as well as spawning success (Miller et al. 2011; Jeffries et al. 2014). Transcriptomics, thus, has the potential to provide invaluable information about possible environmental stressors and the physiological responses of organisms to these stressors.
Freshwater fishes are some of the most at-risk organisms due to climate change as well as other human-related activities, such as fisheries. Lake Winnipeg (Manitoba, Canada) is the 10th largest lake globally based on surface area and is characterized by a large north basin, smaller south basin, and a narrow channel that connects the two basins (Wassenaar and Rao 2012). Lake Winnipeg is home to Canada’s second largest freshwater fishery, of which walleye (Sander vitreus (Mitchell, 1818)) make up the largest component (Johnston et al. 2012). Sustainable management of walleye is thus critically important, not only to commercial fishing but also recreational angling, subsistence fishing, and the Lake Winnipeg ecosystem as a whole. Since 2002, however, the annual commercial yield from the walleye fishery has been above the maximum sustainable yield, and commercial harvests have declined between 2014 and 2018 (Manitoba Government 2018; Manitoba Sustainable Development 2018). The Lake Winnipeg ecosystem is simultaneously being impacted by additional stressors, such as eutrophication, invasive species, and collapse of a prey species (i.e., rainbow smelt; Osmerus mordax (Mitchell, 1814)), that may be further exacerbating the fishery declines (Schindler et al. 2012; Jansen et al. 2017; Enders 2019; Enders et al. 2021; Thorstensen et al. 2021). Reflecting this increase in anthropogenic pressure, walleye body condition has been declining across the lake (Manitoba Government 2018; Manitoba Sustainable Development 2018). Similarly, basin-specific effects are evident, with younger fish in the north basin showing smaller length-at-age, which may reflect nutritional limitation in more recent annual cohorts (Thorstensen et al. 2021). A blood metabolite panel associated with amino acid metabolism and protein turnover in walleye also suggested that fish from the north basin (i.e., Dauphin River) may have elevated levels of protein degradation (Thorstensen et al. 2021). Although low population divergence was detected for Lake Winnipeg walleye, sequence differences in mRNA transcripts associated with cell membrane protein and cytoskeletal function did vary latitudinally, suggesting that genomic differences may, in part, underlie phenotypic differences (Thorstensen et al. 2020). Furthermore, contemporary gene flow from the connected Lake Manitoba (Manitoba, Canada) was concentrated in Lake Winnipeg’s north basin, possibly because of environmental differences between the basins of Lake Winnipeg (Thorstensen et al. 2022). Together, the complexity of stressors potentially affecting walleye in the Lake Winnipeg system, as well as basin-specific genomic, physiological, and morphological metrics of walleye, suggest the need for conservation attention at a local scale.
The present study used the emerging challenges Lake Winnipeg walleye are facing to test whether whole transcriptome interrogation of individual fish from across regions can identify environmental stressors that might be contributing to population declines and morphological differences in walleye. To this end, walleye were sampled at locations representing the north basin (Dauphin River), the south basin (Red River), and the channel that connects the basins (Matheson Island) in 2017 and 2018. Gill samples were acquired non-lethally from walleye, allowing for the whole-transcriptome profiling of eight walleye from each location and year using RNA-seq. Due to the potential variability generated by sampling wild-caught fish, of particular interest were patterns of transcript regulation that were consistent across the two years examined. From these genes that differed in their mRNA abundance among locations consistently across years, a selection of 20 genes was examined using quantitative PCR (qPCR) across a larger sampling of fish, as well as from an additional site in the south basin (Riverton). Overall, by identifying consistent patterns of biological responses in walleye across the Lake Winnipeg system, information not only on walleye physiology but also potential environmental factors driving these responses can be determined. Furthermore, identification of key biological pathways or responses will facilitate targeted studies to draw more specific links between walleye genomic and phenotypic differences that may be driven by local environmental factors.
Materials and methods
Lake Winnipeg sampling
Walleye (n = 156) were collected over two years (2017 and 2018) from four locations in the Lake Winnipeg system: Dauphin River and Matheson Island, representing sites in the north basin and channel, respectively, and Riverton and Red River, representing the south basin (Fig. 1, Table 1). Gill tissue was collected during the spawning season (approximately May through early June in 2017 and 2018), as in Thorstensen et al. (2020). Walleye were collected by electrofishing, measured for total length and mass (Table 1), and anaesthetized using a Portable Electroanesthesia System (Smith Root, Vancouver, WA, USA). A non-lethal gill biopsy was retrieved by collecting 2–3 mm of the terminal ends of 3–4 filaments from the left side of the fish. Gill tissue was placed in RNAlater solution (Thermo Fisher Scientific, Waltham, MA, USA) and stored at 4 °C for 24 h prior to storage at −80 °C. Walleye were caught and sampled as part of a complementary Fisheries and Oceans Canada project, where fish were implanted with an acoustic telemetry tag. The implantation of the tag allowed for the sex to be determined from most fish via the small ventral incision made to insert the tag. Due to the size restriction related to tag size (fish were ≥0.5 kg), most fish sampled and included in the study were female (111 female, 31 male, 14 unidentified sex; Table 1). Total length and mass were analyzed for differences among locations and years using a two-way analysis of variance (ANOVA). Residuals were examined for normality and equal variance using the “check model” function from the R package “performance” (Lüdecke et al. 2020). Significant effects were further explored using a Tukey’s Honestly Significant Difference (HSD) post hoc test using the “emmeans” package in R (Lenth 2020). All fish collection and sampling techniques were in accordance with the approved animal use protocols of Fisheries and Oceans Canada (FWI-ACC-2017-001 and FWI-ACC-2018-001), the University of Manitoba (FC-019), and the University of Nebraska–Lincoln (Project ID: 1208).
Fig. 1.
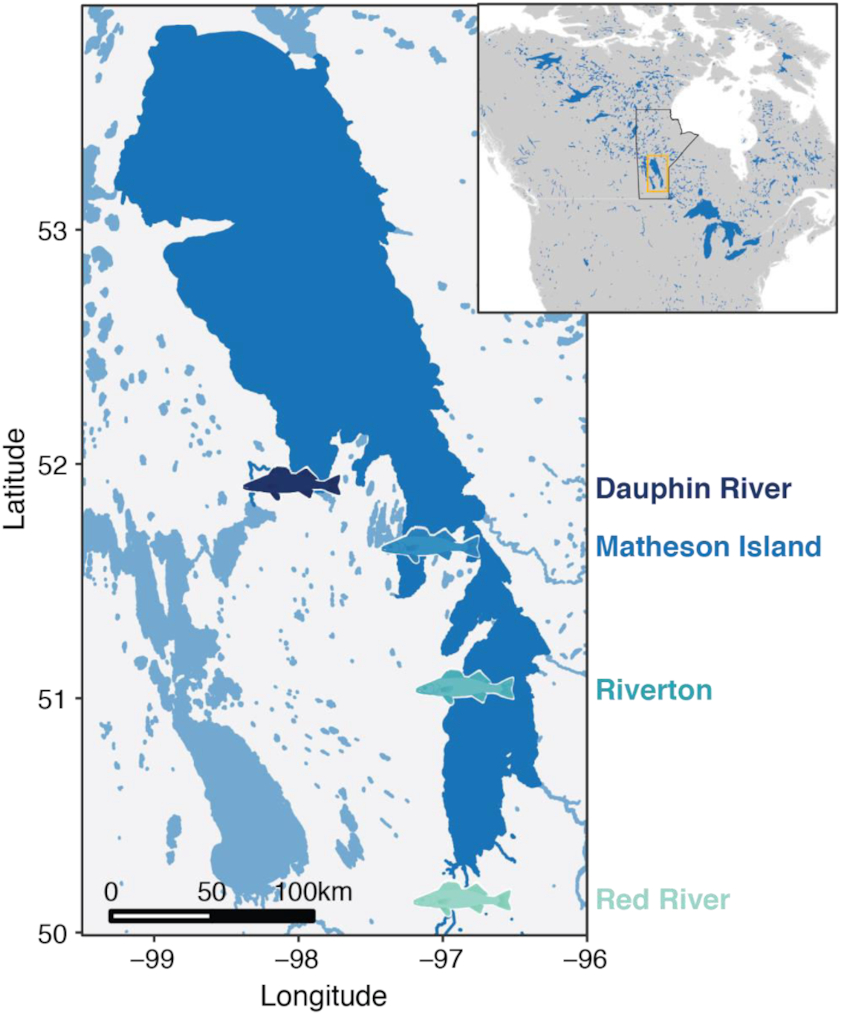
Table 1.
| Location | Year | Total n | Female n | Male n | Unknown sex n | Total length (mm) | Mass (kg) |
|---|---|---|---|---|---|---|---|
| Red River | 2017 | 21 | 19 | 2 | 0 | 644 ± 63a | 2.93 ± 0.93a |
| 2018 | 18 | 9 | 9 | 0 | 549 ± 132a | 2.27 ± 1.73a | |
| Riverton | 2017 | 25 | 20 | 5 | 0 | 647 ± 60a | 2.73 ± 0.89a |
| 2018 | 25 | 14 | 7 | 4 | 535 ± 109a | 1.79 ± 1.18a | |
| Matheson | 2017 | 10 | 8 | 2 | 0 | 600 ± 58ab | 2.09 ± 0.73ab |
| 2018 | 18 | 15 | 0 | 3 | 541 ± 113ab | 1.74 ± 1.21ab | |
| Dauphin River | 2017 | 19 | 13 | 6 | 0 | 563 ± 69b | 1.76 ± 0.60b |
| 2018 | 20 | 13 | 0 | 7 | 493 ± 66b | 1.30 ± 1.33b |
Note: Data are presented as means ± sd. For total length and mass, a significant main effect of location is represented by lowercase letters, and locations that do not share a letter are significantly different from one another. A significant effect of year was also detected for total length and mass (two-way ANOVA; see the text for details).
RNA extraction and RNA-sequencing
Total RNA was extracted from gill samples using the RNeasy Plus Mini Kit (Qiagen, Toronto, ON, CA) with minor modifications described in Thorstensen et al. (2020). The quantity and quality of RNA were determined using a NanoDrop One (Thermo Fisher Scientific) and by visualization on a 1% agarose gel, respectively.
For RNA-seq, eight samples were chosen per location, per year, for the Red River, Matheson Island, and Dauphin River, representing one site for each of the south basin, channel, and north basin, respectively (Riverton site was not included in the sequencing component of the study). Samples were chosen based on their total RNA quality, and primarily female samples were included in the study to limit the contribution of sex as a covariate (44 females, 4 of unknown sex; Table S1). The construction and sequencing of the cDNA libraries were performed by Centre d’expertise et de services Génome Québec (http://gqinnovationcenter.com), as detailed in Thorstensen et al. (2020). Prior to cDNA library construction, the quality of the RNA was assessed on a bioanalyzer (R.I.N. ≥ 8). Each individual library was tagged with a unique adapter, and the 48 libraries were pooled prior to sequencing. Sequencing was performed using NovaSeq 6000 (Illumina) on a single lane and produced 2.17 billion paired-end reads. Raw reads were submitted to the NCBI SRA database (accession #PRJNA596986).
Differential expression analysis
Differential expression analyses were carried out in a similar fashion to Jeffrey et al. (2019). For detailed methods regarding the differential analysis, see Supplementary materials. Briefly, Salmon v0.13.3 (Patro et al. 2017) was used to estimate transcript abundances using a previously assembled reference transcriptome for walleye generated by Jeffrey et al. (2020) (Sequence Read Archive Accession SRP150633), and differential expression of genes was examined using the R/Bioconductor package “edgeR” (Robinson et al. 2010). A priori contrasts were designed to compare sampling sites (i.e., Dauphin River vs. Red River, Dauphin River vs. Matheson Island, Matheson Island vs. Red River) within a year and genes were considered differentially expressed at a Benjamini–Hochberg-corrected False Discovery Rate (FDR) < 0.05.
To identify differentially expressed genes that were specific to each sampling site, lists were generated that consisted of genes that were differentially expressed at that site compared to both other sites within a given year (e.g., Red River vs. both Matheson Island and Dauphin River; Matheson Island vs. both Red River and Dauphin River; Dauphin River vs. both Red River and Matheson Island). The site-specific differentially expressed genes were then identified as being consistently different across years, different only within 2017, or different only within 2018.
Gene enrichment analysis was performed for each set of up- or down-regulated differentially expressed genes with annotation information (see Supplementary materials) using EnrichR (Chen et al. 2013). Since multiple assembled sequences can be annotated to the same gene, gene lists were re-filtered based on the gene name so that any gene names in the “both years” gene list did not appear in either 2017 or 2018 “only” gene lists. Only gene ontology (GO) terms with an adjusted p value < 0.05 and a minimum of four genes were considered as significantly enriched. EnrichR only considers a single copy of a gene for the analysis; thus, multiple copies of a gene represented by more than one transcript were disregarded. Enriched GO terms were summarized and visualized using REVIGO (Supek et al. 2011).
Principal component analysis of gene abundances
In addition to the differential gene expression analysis, a principal component analysis (PCA) was used to examine broad differences in transcript regulation across samples. Log counts per million (cpm) from the filtered and normalized gene abundances (see Supplementary materials) were used in the PCA. The PCA was performed using the R package “FactoMineR” (Lê et al. 2008), and results were visualized using “factoextra” (Kassambara and Mundt 2017). A two-way ANOVA was used to examine the fixed factors of location, year, and location × year for the score of principal component (PC) 1 and PC2. Residuals were examined for normality and equal variance, as above. Significant effects were further explored using a Tukey’s HSD post hoc test, as above.
Candidate genes for qPCR assay for walleye in Lake Winnipeg
Using the RNA-seq data, a set of 20 candidate genes (Table S2) were selected for qPCR using a strategy similar to that of Akbarzadeh et al. (2020) to develop qPCR assays for hypoxia biomarkers in salmonids. Briefly, a PCA was used to select annotated genes that were most strongly correlated with a PC associated with the separation of sampling location (see Supplementary materials).
For all walleye sampled from the Lake Winnipeg system (i.e., Red River, Riverton, Matheson Island, Dauphin River; Table 1), cDNA was synthesized from 0.5 µg of total RNA using the QuantiTect Reverse Transcription Kit (Qiagen), following manufacturer’s protocol. The relative abundance of 20 target genes was determined using qPCR (Table S2). Sequences retrieved from the previously assembled walleye reference transcriptome (Jeffrey et al. 2020) were used to develop oligonucleotide primers for the target genes using Primer express v.3 (Applied Biosystems, Thermo Fisher Scientific) (Table S2). Reference gene primer sets for 60S ribosomal protein L7, L8, and L13a (rpl7, rpl8, rpl13a) and 40S ribosomal protein S6 and S9 (rps6, rps9) were previously used in walleye (Jeffrey et al. 2020). Standard curves were generated for each primer set to optimize reaction compositions and used cDNA synthesized from the RNA pooled from 24 individuals (3 fish per location and year). All qPCRs were run using the QuantStudio 5 Real-Time PCR System (Thermo Fisher Scientific) and PowerUP SYBR Green Master Mix (Applied Biosystems, Thermo Fisher Scientific), following manufacturer’s protocols, with the exception that reaction compositions were scaled to a total volume of 12 µL. The stability of the five reference genes was analyzed using RefFinder (https://www.heartcure.com.au/reffinder/). RefFinder integrates four computational programs (geNorm, Normfinder, BestKeeper, and the comparative Delta-Ct method) to compare and rank candidate reference genes (Xie et al. 2012). Additionally, reference gene stability was examined for potential location and year effects. Of the five reference genes tested, rpl13a, rps6, and rps9 were the most stable across sites and years and were thus included in further analyses. Target gene mRNA levels were normalized to the three reference genes and were expressed relative to the mean of the fish sampled in 2017 in the Red River using the delta-delta Ct method. Four samples were removed from the dataset for further analysis based on poor amplification due to low 260/230 values or were identified as outliers across multiple target genes.
Comparison of RNA-seq data with qPCR
For the samples analyzed by RNA-seq, the same RNA was used to examine mRNA abundance of 20 candidate genes. Equivalent contrasts to the RNA-seq data were calculated for the qPCR data and expressed as log2 fold changes. A correlation analysis was performed between the log2 fold changes across the 20 genes. A Spearman’s correlation analysis was used as the data were non-normally distributed data. Additional analyses were carried out to establish whether the individuals examined in the RNA-seq study were representative of the larger sample size assessed using qPCR (see Supplementary materials).
Statistical analysis for mRNA abundance of candidate genes
The significant effects of location and year were evaluated on the larger sample size of fish using qPCR for the 20 target genes. Individuals from the Red River, Riverton, Matheson Island, and Dauphin River were included in these analyses. Outliers were identified using Grubbs tests with the “outliers” R package. For each target gene, a linear model was developed with location, year, the interaction of location and year, as well as total length and mass as fixed factors. Since sex was not known for all fish, it was not initially included as a factor in the analysis. A stepwise Akaike Information Criterion (AIC) was used to compare models and determine the best fit for the data, and the residuals of this “best fit” model were examined to ensure that the assumptions of the linear model were met. If the data were not normally distributed or equally variable, the data were rank-transformed (only for actin-related protein 2 (actr2)). A Tukey’s HSD post hoc test was used to further explore any significant categorical factors. Total length was not a significant factor when included in the models. Mass was only significantly related to protein FAM49B (fam49b) mRNA levels, and this relationship was further explored using a correlation analysis.
An additional set of analyses on the 20 candidate genes was conducted to evaluate the potential influence of sex on mRNA abundance in the gill where individuals of unknown sex (total n = 14) were removed from the dataset and the above analyses were repeated with the inclusion of sex as a covariate. In no case was sex a significant factor when included in the models.
Results
Total length and mass
Although walleye greater than 0.5 m were targeted to accommodate the telemetry tag, size differences were evident across locations. Both total length and mass were lower for walleye sampled in Dauphin River compared to both the Red River and Riverton, with Matheson Island fish being intermediate (Table 1; two-way ANOVA; total length, p < 0.001 for location and year, p = 0.609 for location × year; mass, p = 0.009 for location, p < 0.001 for year, p = 0.638 for location × year).
Differential analysis of mRNA transcript abundance
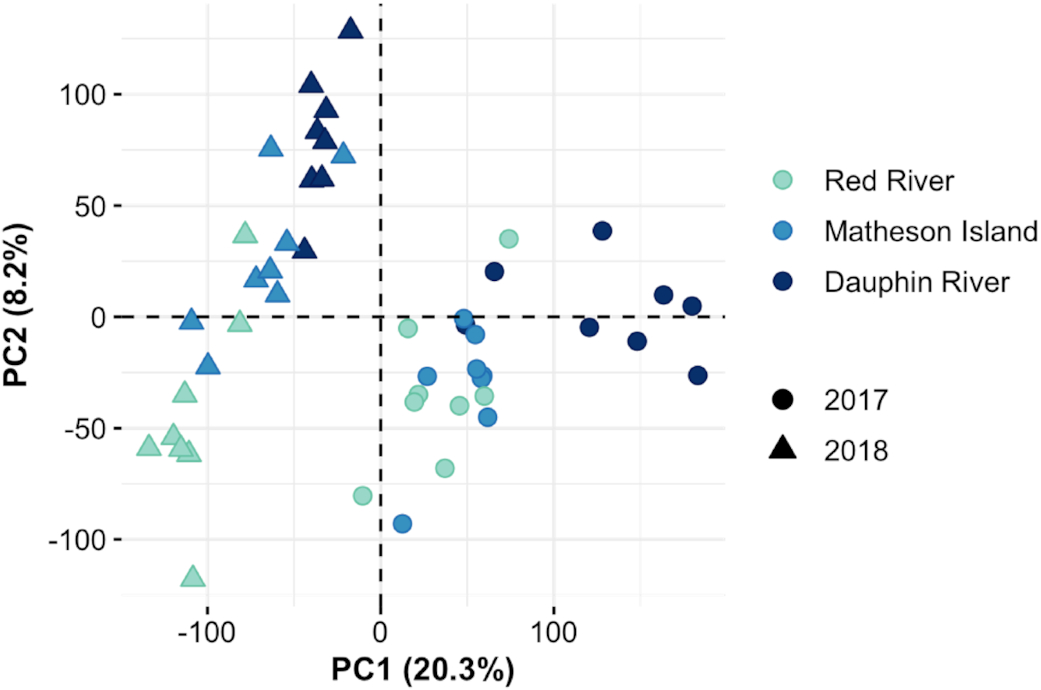
A PCA including the normalized cpm values revealed clustering of samples by year and by location (Fig. 2). Along PC1 (20.3% variance explained), fish were significantly separated by both year and location, where each location was significantly different from another (Fig. S1a; two-way ANOVA; p < 0.001 for location and year, p = 0.314 for location × year). Separation by location along PC2 (8.2% variance explained) was limited to fish sampled in 2018, with each location being significantly different from the other (Fig. S1b; two-way ANOVA; p = 0.054, <0.001, and 0.002 for location, year, and location × year, respectively). Additionally, separation by year along PC2 was specific to fish sampled in the Red River and Matheson Island (Fig. S1b).
Fig. 2.
For walleye sampled in the Red River, combined over both years, there were a total of 4340 genes with differential mRNA transcript abundance compared to fish sampled from Matheson Island and Dauphin River at an FDR < 0.05. Of these genes, 212 were consistently different across years, and 1162 and 796 were only differentially regulated in 2017 or 2018, respectively (Fig. S2). A total of 3213 genes were differentially regulated (FDR < 0.05) in walleye sampled in the Dauphin River, of which 60 were consistently different across years, and 163 and 1384 were only differently regulated in 2017 or 2018, respectively (Fig. S2). Fewer genes were differentially expressed in fish sampled at Matheson Island compared to the two other locations (Red River and Dauphin River), with only 652 genes with differential mRNA transcript abundance (FDR < 0.05), of which only 6 genes were consistently different across years (90 and 230 genes were differentially regulated only in 2017 or 2018, respectively; Fig. S2). Due to the lower number of differentially expressed genes specific to Matheson Island fish and the resulting lower number of enrichment terms (Fig. S3), we limit our description of the GO enrichment analysis in the main text to Dauphin River and Red River fish (further details available in Supplementary materials for Matheson Island).
Functional analysis of differentially expressed genes
Dauphin River
In total, 880 genes (811 unique genes) that were differentially regulated in walleye from the Dauphin River compared to both Matheson Island and the Red River were included in the enrichment analyses (Tables S3 and S4). Only the GO term “actin binding” was significantly enriched for genes that were consistently up-regulated in Dauphin River fish compared to fish from the other two locations across years (Fig. S4a) and constituted four enriched genes, angiogenin, advillin, fascin, unconventional myosin-VI (Table S5). There were no significantly enriched GO terms for Dauphin River comparisons in 2017.
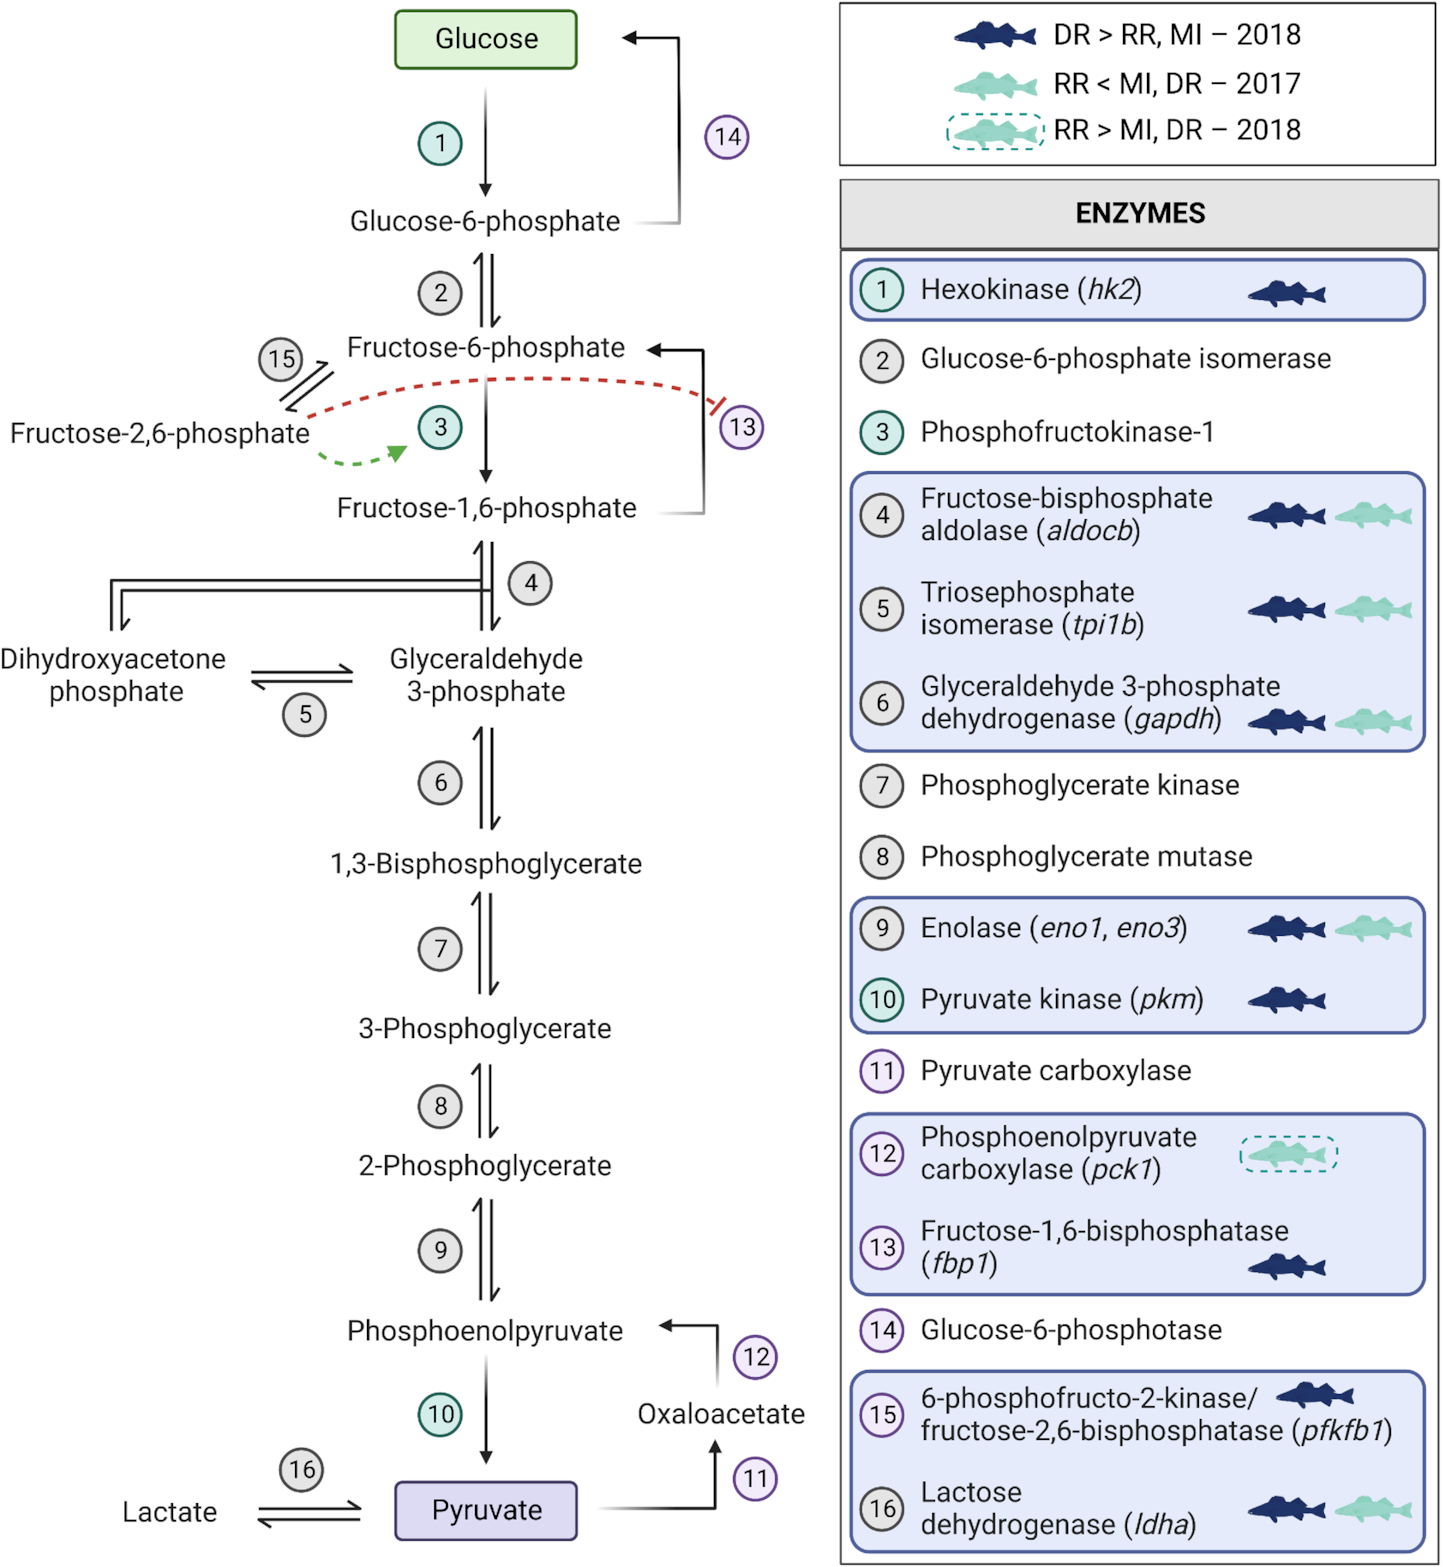
For genes up-regulated in Dauphin River fish in 2018, significantly enriched GO terms included glycolysis, mitochondrion, negative regulation of catabolic process, chromatin remodeling, protein transport, and RNA and cadherin binding (Fig. S4b). Several glycolysis- and gluconeogenesis-related genes were enriched as part of the GO terms glycolysis, glycolytic process, gluconeogenesis, and carbohydrate catabolic process (Fig. 3, Table S6). In addition, the parent term “canonical glycolysis” also included the following GO terms: nicotinamide nucleotide metabolic process, low-density lipoprotein particle receptor metabolism, secondary alcohol biosynthetic process (including six genes involved in cholesterol and lipid biosynthesis; Table S5), and RNA processing and splicing. Four genes involved in the regulation and targets of mTOR complex 1 (mTORC1) were up-regulated in fish sampled from the Dauphin River compared to those from the other two sites (Fig. 4, Table S6). Four subunits of the vacuolar-type H+-ATPase enzyme (atp6v1a, atp6v1b2, atp6v1c1, atp6v1e1) were significantly enriched as part of the GO term “intracellular pH reduction” and the parent term “negative regulation of catabolic process” (Fig. S4b, Tables S5 and S7).
For those genes down-regulated in Dauphin River fish in 2018, significantly enriched GO terms included respiratory electron transport chain, autophagosome, and membrane raft (Fig. S4c). Several transcripts of genes encoding subunits of complexes I, III, and IV contributed to the enriched GO term “respiratory electron transport chain” (Fig. 5; Table S6). Although not enriched as part of the functional analysis, ATP synthase subunit a (mt-atp6) and mitochondrial ATP synthase subunit d (atp5h) were also significantly lower in Dauphin River fish compared to fish from the other two sampling sites in 2018 (Table S4). Correspondingly, mitochondrial transcription termination factor 3 (mterf3) transcript levels, a negative regulator of mammalian mtDNA transcription, was elevated in Dauphin River fish in 2018 (Fig. 5, Table S4). Significantly enriched genes associated with autophagy and autophagosome formation included two gamma-aminobutyric acid receptor-associated proteins (gabarap and gabarapl1), tumor protein p53-inducible nuclear protein 2, vacuole membrane protein 1, WD repeat domain phosphoinositide-interacting protein 1, and autophagy-related protein 2 homolog A (Fig. S4c; Table S5).
Red River
For fish sampled from the Red River compared to those from Matheson Island and Dauphin River, a total of 1349 differentially regulated genes (1234 unique genes) were included in the enrichment analyses (Table S3). For genes consistently up-regulated across years in walleye from the Red River, enrichment analysis revealed several significant GO terms involved in mitochondrial electron transport, complex I, and NADH dehydrogenase activity (Fig. S5a). In total, six genes were significantly enriched, including five of the seven hydrophobic complex I subunits (mt-nd3−6 and mt-nd4l) (Fig. 5, Table S6).
For genes consistently down-regulated across both years in Red River fish, significantly enriched GO terms were involved in the cell cycle and nucleosome organization, regulation of actin cytoskeleton reorganization, actin binding, and focal adhesion (Fig. S5b), constituting 50 enriched genes (Table S5). Enriched genes associated with regulation of actin cytoskeleton reorganization included genes such as rho GDP-dissociation inhibitor 1, cell division control protein 42 homolog (cdc42), and junctional adhesion molecule A (f11r). Eight other GO terms were summarized within “regulation of actin cytoskeleton reorganization,” including “epigenetic regulation of gene expression” that was associated with genes such as glutathione peroxidase 1 (gpx1), histone H3.3a, and histone-binding protein rbbp7; “regulation of programmed cell death” and the associated enriched genes death-associated protein kinase 2, TRAF family member-associated NF-kappa-B activator (tank), and tumor necrosis factor receptor superfamily member 1A; and “response to ionizing radiation” and the associated genes BRISC and BRCA1-A complex member 2 (babam2), DNA repair-scaffolding protein (spidr), and DNA repair protein XRCC4 that are involved in DNA repair. Enriched genes involved in cell cycle and nucleosome organization included replication protein A 32 kDa subunit (rpa2) and DNA replication licensing factor MCM3. For a full list of GO terms and associated enriched genes, see Fig. S5b and Table S5.
For genes that were only differentially regulated in walleye from the Red River in 2017, significant enrichment of GO terms for up-regulated genes included regulation of mRNA splicing, helicase activity, positive regulation of cell death, and secondary active transmembrane transporter activity (Fig. S6b). Genes such as helicases (probable ATP-dependent RNA helicase DDX5 and DDX17) and RNA-binding protein 25 associated with mRNA splicing, low-density lipoprotein receptor-related protein 1 and sap30 binding protein associated with cell death, and solute carriers (sodium-dependent phosphate transporter 1-A (slc20a1a), band 3 anion exchange protein (slc4a1), solute carrier organic anion transporter family member 2A1 (slco2a1)) associated with active transmembrane transport were significantly enriched for Red River walleye in 2017 (see Table S5 for a full list).
There were several significantly enriched GO terms for down-regulated genes in Red River fish in 2017, including gluconeogenesis, Ras protein signal transduction, proteasome-mediated ubiquitin-dependent protein catabolic process, Golgi vesicle transport, viral life cycle, apoptotic process, epithelial cell differentiation, cadherin binding, focal adhesion, and vesicle coat (see Fig. S6a for a full list of terms). In total, 451 down-regulated genes were significantly enriched for Red River fish in 2017. Caspase-9 and cell death-inducing p53 target protein 1 that are associated with apoptosis were significantly enriched, as well as some anti-apoptotic genes such as serine/threonine-protein kinase mTOR (mtor), BCL2/adenovirus E1B 19 kDa protein-interacting protein 2 (bnip2), and the associated Ras-related GTP-binding protein C (rragc). Four genes involved in the reversible steps of gluconeogenesis/glycolysis were down-regulated and part of the enriched “gluconeogenesis” GO term (Fig. 3, Table S6). Relatedly, transcript levels of the gluconeogenic enzyme, phosphoenolpyruvate carboxylase (pck1), were higher and L-lactate dehydrogenase chain A (ldha) transcript levels were lower in Red River fish in 2017 compared to fish from the other two sampling sites (Fig. 3, Table S4). Transcript levels of the cytosolic isoform of isocitrate dehydrogenase (idh1) that catalyzes the reversible conversion of α-ketoglutarate from isocitrate, as well as two proteins involved in the citric acid cycle, 2-oxoglutarate dehydrogenase (ogdh) and succinate dehydrogenase subunit A (sdha), were also down-regulated in Red River fish in 2017 and constituted part of the enriched “dicarboxylic acid metabolic process” GO term (Fig. S6a; Table S5). Several genes enriched as part of the GO term “proteasome-mediated ubiquitin-dependent protein catabolic process” were associated with endoplasmic reticulum-associated degradation, such as cell division cycle protein 27 homolog, cullin-3, endoplasmic reticulum chaperone BiP (hspa5), proteosomal subunits (psmb8, psmd5, psmd6, psmd12), and ubiquitin conjugating enzymes/factors (ube2a, ube4b) (see Table S5 for a full list). Genes involved in other protein modifications (e.g., phosphorylation and glycosylation) and RNA processing and metabolism were also enriched as part of the parent term “proteasome-mediated ubiquitin-dependent catabolic process” (Fig. S6a, Table S5). Genes involved in the regulation of the mTOR pathway (e.g., via growth factors, insulin, and nutrients stimulated pathways) as well as mTOR targets (e.g., protein synthesis and autophagy) were down-regulated in Red River fish in 2017 (Fig. 4, Table S6). Several of the genes related to the mTOR pathways were included in the enriched “Ras protein signal transduction” GO term (Fig. S6a, Table S5). Related to the mTOR pathway, key regulators and targets of AKT (RAC-alpha serine/threonine-protein kinase) and the PI3K/AKT/mTOR pathway were down-regulated in Red River fish in 2017. These genes included mtor and 3-phosphoinositide-dependent protein kinase 1 (pdpk1) that are involved in the activation of AKT as well as genes that are involved in the targeted effects of AKT such as fatty acid synthesis (ATP-citrate synthase (acly), acetyl-CoA carboxylase 1 (acaca)) and cell survival and proliferation (foxhead box protein O1 (foxo1a)) (Table S6). Similar to down-regulated genes enriched across both years, genes associated with the cytoskeleton were significantly enriched, as part of the parent GO term “vesicle coat” (Fig. S6a). These genes related to the cytoskeleton included beta-centractin (actr1b), allograft inflammatory factor 1-like, two subunits of the actin-related protein 2/3 complex (arpc1a, arpc2), F-actin-capping protein subunit alpha-1 (capza1), cadherin-1, four septins (sept2, sept7, sept8b, sept9), and WAS/WASL-interacting protein family member 1 (Table S5). Interestingly, transcripts of the same four subunits of the vacuolar-type H+-ATPase that were up-regulated in Dauphin River fish in 2018 were also down-regulated in Red River fish in 2017 (i.e., atp6v1a, atp6v1b2, atp6v1c1, atp6v1e1) in addition to two other subunits (atp6v0a2, atp6v0e1) (Tables S4 and S7).
Enrichment analysis revealed significant enrichment of GO terms for down-regulated, but not up-regulated, genes for Red River walleye in 2018. Significantly enriched GO terms included regulation of DNA biosynthesis and replication, as well as cell cycle phase transition and chromosome condensation (Fig. S7). In total, 126 unique down-regulated genes were significantly enriched in 2018 for Red River fish (Table S5). Similar to 2017, ubiquitin-dependent protein catabolism and protein ubiquitination were also down-regulated in Red River fish in 2017, as part of the parent term “positive regulation of DNA biosynthetic process” (Fig. S7). Significantly enriched genes related to ubiquitination and protein catabolism included genes such as f-box/WD repeat-containing protein 7 and protein-tyrosine kinase 2-beta, as well as the chaperones, heat shock protein 90 alpha and beta (hsp90aa1, hsp90ab1) and phosducin-like protein 3 (Table S5). Several genes related to DNA repair (as part of the parent term “DNA replication”) were down-regulated and significantly enriched in Red River fish in 2018, a pattern echoed in genes down-regulated in Red River fish across both years (see above). Significantly enriched genes related to DNA repair included serine/threonine-protein kinase Chk1 (chek1), checkpoint protein hus1 (hus1), DNA repair protein RAD50 (rad50), and RAD51-associated protein 1 (rad51ap1) (see Table S5 for a full list). Similar to significantly enriched GO terms in 2017 and across both years, genes associated with the cytoskeleton were enriched in Red River fish in 2018. Within the parent term “chromosome, centromeric region”, genes related to the cytoskeleton included capzb, filamin-B, cytokeratin-13 (krt13), tubulin alpha-4Achain (tuba4a), and tubulin beta chain-like (tubb).
Hypoxia responsive genes
As glycolytic and anaerobic metabolic pathways were differentially regulated among the three sampling sites, differentially regulated genes were examined for genes sensitive to hypoxic conditions. Six hypoxia related genes were differentially regulated among the sampling sites (Table S6). In 2018, Dauphin River fish exhibited higher transcript levels of hypoxia up-regulated protein 1 (hyou1) and heme oxygenase (hmox), and lower transcript levels of hemoglobin subunit alpha-D compared to fish from the other sites. Correspondingly, lower transcript levels of Egl nine homolog 3 (hypoxia-inducible factor prolyl hydroxylase 3; egln3/hif-ph3), nitric oxide synthase, and solute carrier family 2, facilitated glucose transporter member 1 (slc2a1) were detected in Red River fish in 2017 compared to fish from the other two sites.
Ion regulatory genes
In addition to the vacuolar-type H+-ATPases detected as part of the functional analysis (see above), several genes involved in ion regulation were differentially regulated among the three sampling sites (Table S7). Two subunits of the Na+/K+-ATPase alpha 1 were differentially regulated, with atp1a3 transcripts up-regulated and atp1a1 transcripts down-regulated in Dauphin River fish in 2018. Two other ion ATPases were also differentially regulated, with plasma membrane ATPase 4 (PMCA4/atp2b4) being down-regulated in Red River fish in 2017 and sarcoplasmic/endoplasmic reticulum calcium ATPase 2 (atp2a2) being down-regulated in Dauphin River fish in both years. Several ion exchangers were also differentially regulated. Na+/H+ exchangers 1 and 3 (NHE1/slc9a1 and NHE3/slc9a3) were higher in Red River fish compared to fish from the other two sites, and NHE3 transcripts were lower in Dauphin River fish in 2018. Na–Cl cotransporter (NCC/slc12a3) and slc12a8 transcripts were up-regulated in Dauphin River fish in 2018. The basolateral anion exchanger (NBC/slc4a1) was up-regulated in Red River fish in 2017. Three calcium/calmodulin-dependent protein kinases (camk-1, 1d, 2g) were either up-regulated in Dauphin River fish or down-regulated in Red River fish in 2017 and/or 2018. Three aquaporins (aqp-a, 3, 8) and six claudins (cldn-1, 3–5, 8, 22) were differentially regulated, with the majority being down-regulated in Dauphin River fish in 2018 or up-regulated in Red River fish across both years. The tight junction protein ZO-3 (tjp3) and cdc42 were down-regulated in Red River fish in 2017. Ammonium transporter Rh type C 1 (rhcg1) transcripts were highest in Red River fish and lowest in Dauphin River fish in 2018. Finally, the mineralocorticoid receptor (nr3c2) was down-regulated in Red River fish in 2017.
Discovery of candidate genes for qPCR
In total, 276 genes were significantly different among sites in both 2017 and 2018, of which 193 genes with annotation information were subjected to PCA. A separation of sampling locations was detected along PC1 (Fig. S8), which was expected given that genes were selected on the basis of their difference among locations. A separation between years was also observed along PC2. As such, candidate genes were selected on the basis that they were significantly correlated with PC1 (p < 0.05) but not with PC2 (p > 0.10), resulting in a list of 96 potential target genes. Twenty candidate genes (Table S2) were then selected for qPCR based on their physiological function and/or their presence in the significantly enriched gene lists (Table S5).
Correlation between transcriptomic and qPCR data
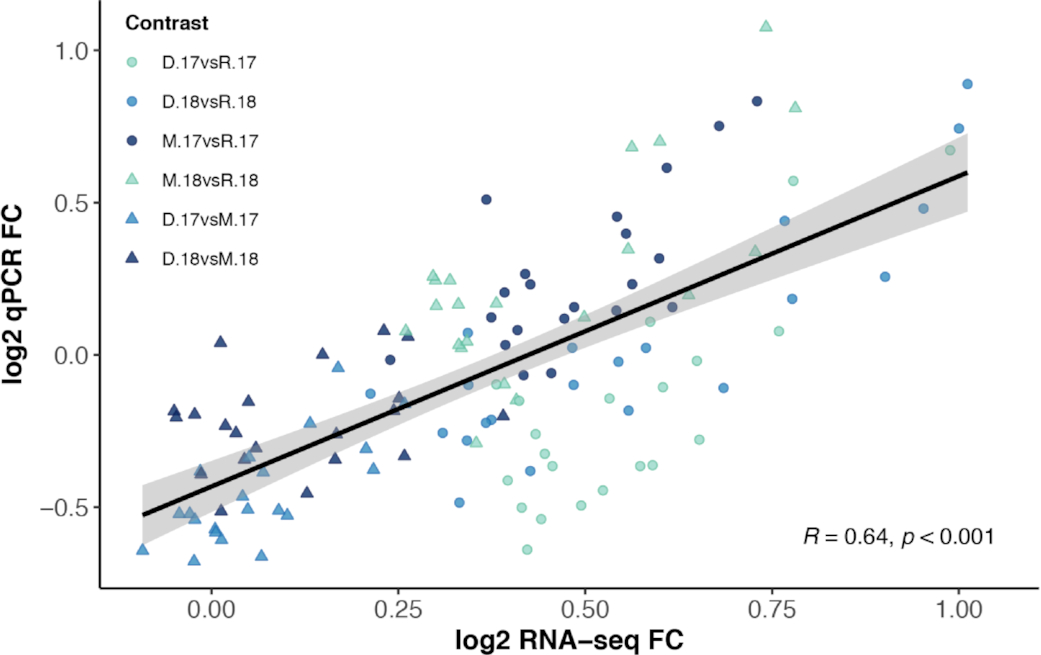
Validation of the transcriptomic data for the 20 candidate genes using qPCR was conducted using a correlation analysis of the log2 fold changes for the 48 samples analyzed on both platforms. Overall, there was a significant correlation between the log2 fold changes between platforms (Spearman, R = 0.63, p < 0.001; Fig. 6).
The data were further explored to determine whether the fish chosen for RNA-seq analysis were representative of the larger group of fish sampled. For only 1 of the 20 target genes (alpha-actinin-4; actn4) were the mRNA levels of individuals examined using RNA-seq significantly different from those not examined using RNA-seq (Table S8).
Candidate gene mRNA abundance
Similar patterns to those of the RNA-seq study were observed for the candidate genes when examined on a broader group of fish and across four sampling sites (Table S9). For 14 of the 20 target genes, the mRNA abundance was higher in the gill of fish sampled in 2017 compared to 2018 (Figs. S9 and S10, Table S9). For an additional four genes (aldo-keto reductase family 1 member A1-B (akr1a1b), ADP-ribosylation factor 6 (arf6),metal transporter CNNM4 (cnnm4), ubiquitin-conjugating enzyme E2 J1 (ube2j1)), this year effect was only evident in fish sampled at Matheson Island, and of these genes, abundances were also higher in 2017 compared to 2018 in Dauphin River (arf6) and Riverton (ube2j1) fish (Fig. S9). Even with the effect of sampling year, location-specific effects consistent with the RNA-seq results were evident for 10 of the 20 target genes (Fig. S9). For actr2, coactosin-like protein (cotl1), fam49b, gpx1, and rpa2, mRNA abundances were lowest for the walleye sampled in the Red River compared to the three other locations, regardless of year. In 2017, similar effects were observed for arf6, where mRNA abundances were significantly lower for Red River fish compared to Matheson Island and Dauphin River but not Riverton. For dnaJ homolog subfamily C member 9 (dnajc9) and ube2j1 (2017 only), mRNA abundances were lower in Red River fish compared to Matheson Island, and for profilin-2 (pfn2), mRNA abundances were lower in Red River fish compared to Riverton and Matheson Island but not Dauphin River. Additionally, mRNA abundances of cnnm4 were lower in fish from Riverton compared to Matheson Island in 2017.
Discussion
In the present study, RNA-seq was used to examine differences in the transcriptomic profiles of walleye that were non-lethally sampled at northern, central (channel), and southern locations within the Lake Winnipeg system. Since walleye were sampled from a wild setting with inherent environmental variability, of particular interest were differences in transcript levels that were consistent across the two years examined. Interestingly, several biological pathways/processes were consistently variable across the latitudinal gradient. In most cases, transcript levels of genes associated with a biological pathway were different between Dauphin River fish (northernmost site) and Red River fish (southernmost site), with the Matheson Island (channel) site being intermediate. Since no true “control” site was possible with the present study design, and to simplify discussion of these complex trends, we limited the discussion of the overall regulation of transcripts/pathways to those being highest or lowest in the northernmost (Dauphin River) compared to southernmost (Red River) locations.
Walleye from the northernmost site exhibited elevated transcript abundances associated with a general response to low oxygen. For instance, transcript levels for several genes associated with glycolysis (e.g., fructose-bisphosphate aldolase C-B (aldocb)glyceraldehyde-3-phosphate dehydrogenase (gapdh), alpha-enolase (eno1)), as well as anaerobic metabolism (ldha), were highest in Dauphin River fish consistently across years (Fig. 3). A correspondingly lower level of transcripts for genes associated with the oxidative phosphorylation (e.g., genes related to complexes I, III, IV of the electron transport chain) was also observed in Dauphin River fish across both years (Fig. 5). Interestingly, in 2018, the lower level of genes associated with the electron transport chain corresponded with elevated mterf3 transcript levels, a negative regulator of mtDNA transcription in mammals (Park et al. 2007). Collectively, these patterns suggest an elevated use of anaerobic pathways. Similar shifts in transcript regulation of metabolic processes in the gill have been detected in fishes exposed to both acute and chronic periods of hypoxia (van der Meer et al. 2005; Li et al. 2017). Further suggesting that walleye in the north basin may have encountered an increased frequency of low-oxygen conditions, hypoxia-related gene transcripts such as hmox, hyou1, and egln3 were highest in Dauphin River fish in 2017 or 2018, reflective of the potential activation of hypoxia-induced pathways (Zhang et al. 2017). Although stratification of the Lake Winnipeg system is minor, the greater depth of the north basin (13.3 m in the north vs. 9.7 m in the south) results in a lower degree of mixing and may result in low-oxygen concentrations in the bottom waters of the north basin. Increasing levels of cultural eutrophication in Lake Winnipeg may also contribute to bottom water oxygen depletion (Environment Canada and Manitoba Water Stewardship 2011). Oxygen-depleted waters (<2.9 mg L−1) below the thermocline have been previously recorded across multiple years (2003, 2006, and 2007) in areas of the north basin during the summer months (Environment Canada and Manitoba Water Stewardship 2011). Together, these data suggest regulation of genes involved in anaerobic metabolism and responses to hypoxia in north basin walleye, pointing to their potential exposure to low-oxygen environments.
Fig. 3.
Further indicators of general stress were observed in fish sampled from the north basin. Dauphin River fish exhibited the highest levels of mRNA transcripts associated with DNA repair and molecular chaperones (e.g., hsp90aa1 and hsp90ab1 in 2018). Additionally, increased transcript levels of genes associated with proteasomal catabolism (e.g., proteasomal subunits psm-d5, d6) were observed consistently across years in fish from the Dauphin River. To support an increase in ammonium excretion across the gill as a result of protein breakdown, the mRNA abundance of several vacuolar-type H+-ATPases was also consistently elevated in fish from the Dauphin River across years. Vacuolar-type H+-ATPases are thought to support the production of an acidified gill water boundary layer to protonate excreted NH3 (Weihrauch et al. 2009). Walleye sampled in Dauphin River in 2017 showed elevated amino acid metabolites associated with post-transcriptional modifications of proteins, which may point to elevated turnover of previously synthesized proteins in these northernmost fish in comparison to the southernmost fish (Thorstensen et al. 2021). Growth rates and body condition for Lake Winnipeg walleye have been declining in recent years, especially those from the north basin (Thorstensen et al. 2021), results that echo the differences in mass and total length for fish sampled in the present study. These morphological differences are consistent with both blood metabolite and gill transcriptional results, suggesting increased endogenous protein breakdown and decreased nutritional status in fish from the north basin. Together, these data suggest that fish from the north basin may be experiencing increased exposure to environmental (e.g., oxygen) and nutritional stressors.
Transcript levels of genes associated with ion regulatory processes were also significantly altered among sampling sites and generally consistent across years; however, the direction of the response was gene-dependent. Transcripts of Na+/K+-ATPase 1 isoform atp1a1 as well as Na+/H+ exchangers 1 and 3 (slc9a1 and slc9a3) were lowest in Dauphin River fish. Similarly, transcripts of several aquaporins and claudins were differentially regulated with most being lowest in Dauphin River fish. For ion regulatory gene transcripts that were highest for Dauphin River fish, the atp1a3 isoform of Na+/K+-ATPase 1, calcium/calmodulin-dependent protein kinases (camk-1, 1d, 2g), a tight-junction protein (tjp3), and mineralocorticoid receptor (nr3c2) were among those differentially regulated. Interestingly, genetic differences (e.g., single nucleotide polymorphisms (SNPs)) among Lake Winnipeg walleye were detected for transcripts related to ion channel activity (Thorstensen et al. 2020). Multiple SNPs were identified in atp1a3, Na+/H+ exchanger 6 (slc9a6), and claudin-10 (cldn10) transcripts that varied along a latitudinal gradient in Lake Winnipeg walleye (Thorstensen et al. 2020). Salinity and specific conductance differ across the Lake Winnipeg system, with higher levels being detected in the north basin (Na+ and Cl− 17–19 mg L−1; 313 µS cm−1) compared to the south basin and channel (Na+ and Cl− 9–11 mg L−1; 287 µS cm−1) (Environment Canada and Manitoba Water Stewardship 2011). Spatial differences in specific conductance and salinity are likely driven by the Dauphin River that transports ion-rich waters (Na+ and Cl− 184–305 mg L−1; 1200–1600 µs cm−1) from the more saline Lake Manitoba into Lake Winnipeg (Environment Canada and Manitoba Water Stewardship 2011). Lower salinity and specific conductance inflows from the Winnipeg River (Na+ and Cl− 1–2 mg L−1; 100 µS cm−1) also help to dilute waters in the south basin and channel (Environment Canada and Manitoba Water Stewardship 2011). Spatial variation in other physicochemical properties, such as sulfate, phosphorus, nitrogen, suspended solids, as well as temperature, precipitation, and river discharge, may also contribute to the potential ion regulatory differences in Lake Winnipeg walleye (Environment Canada and Manitoba Water Stewardship 2011). Together, these results suggest a level of reorganization of ion regulatory machinery that is sensitive to local conditions; however, the underlying mechanisms remain unclear.
In line with a potential gill ion regulatory response, aspects contributing to possible gill remodeling were also evident at a local scale. Several genes associated with the mTOR pathway were identified as differentially regulated across sites with some of these genes being consistently regulated across years (Fig. 4). Overall, activation of the mTOR pathway seemed evident for fish from the Dauphin River, in addition to downstream processes, such as increased protein synthesis and processing, as well as decreased autophagy. Similarly, key regulators and targets of AKT and the PI3K/AKT/mTOR pathway were highest for Dauphin River fish. For instance, mtor and pdpk1 that are involved in the activation of AKT were highest in fish from the north basin, as well as genes involved in the targeted effects of AKT such as fatty acid synthesis (acly, acaca) and cell survival and proliferation (foxo1a). Additionally, enrichment of biological processes such as actin cytoskeleton reorganization suggests potential alterations to the cellular and structural makeup of the gill architecture/tissue of fish from the north basin (Ciano‐Oliveira et al. 2006; Fiol et al. 2006). Similarly, transcripts with multiple SNPs related to the cytoskeleton varied along the latitudinal gradient in Lake Winnipeg walleye, suggesting a possible underlying genetic difference in these structural transcripts driven by local conditions (Thorstensen et al. 2020). Together with the responses indicative of exposure to environmental stressors in the Dauphin River fish, regulation of transcripts involved in remodeling of the gill may reflect differences in local environmental conditions (e.g., potential differences in oxygen or salinity).
Fig. 4.
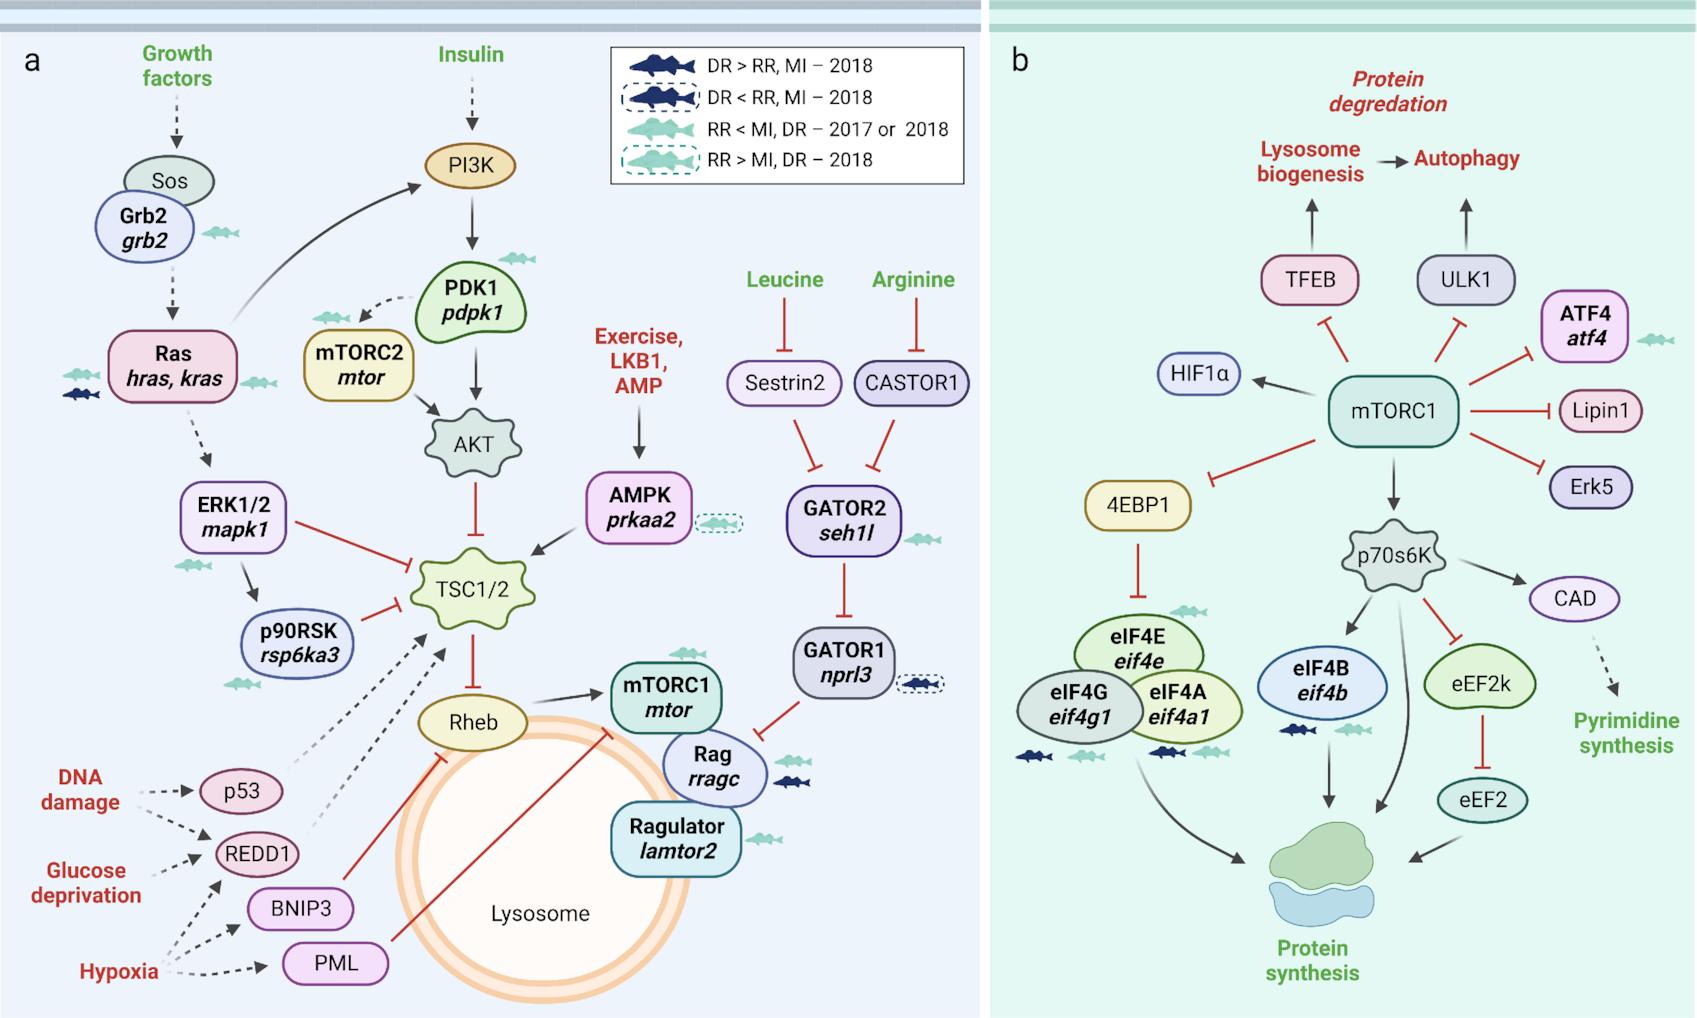
Fig. 5.
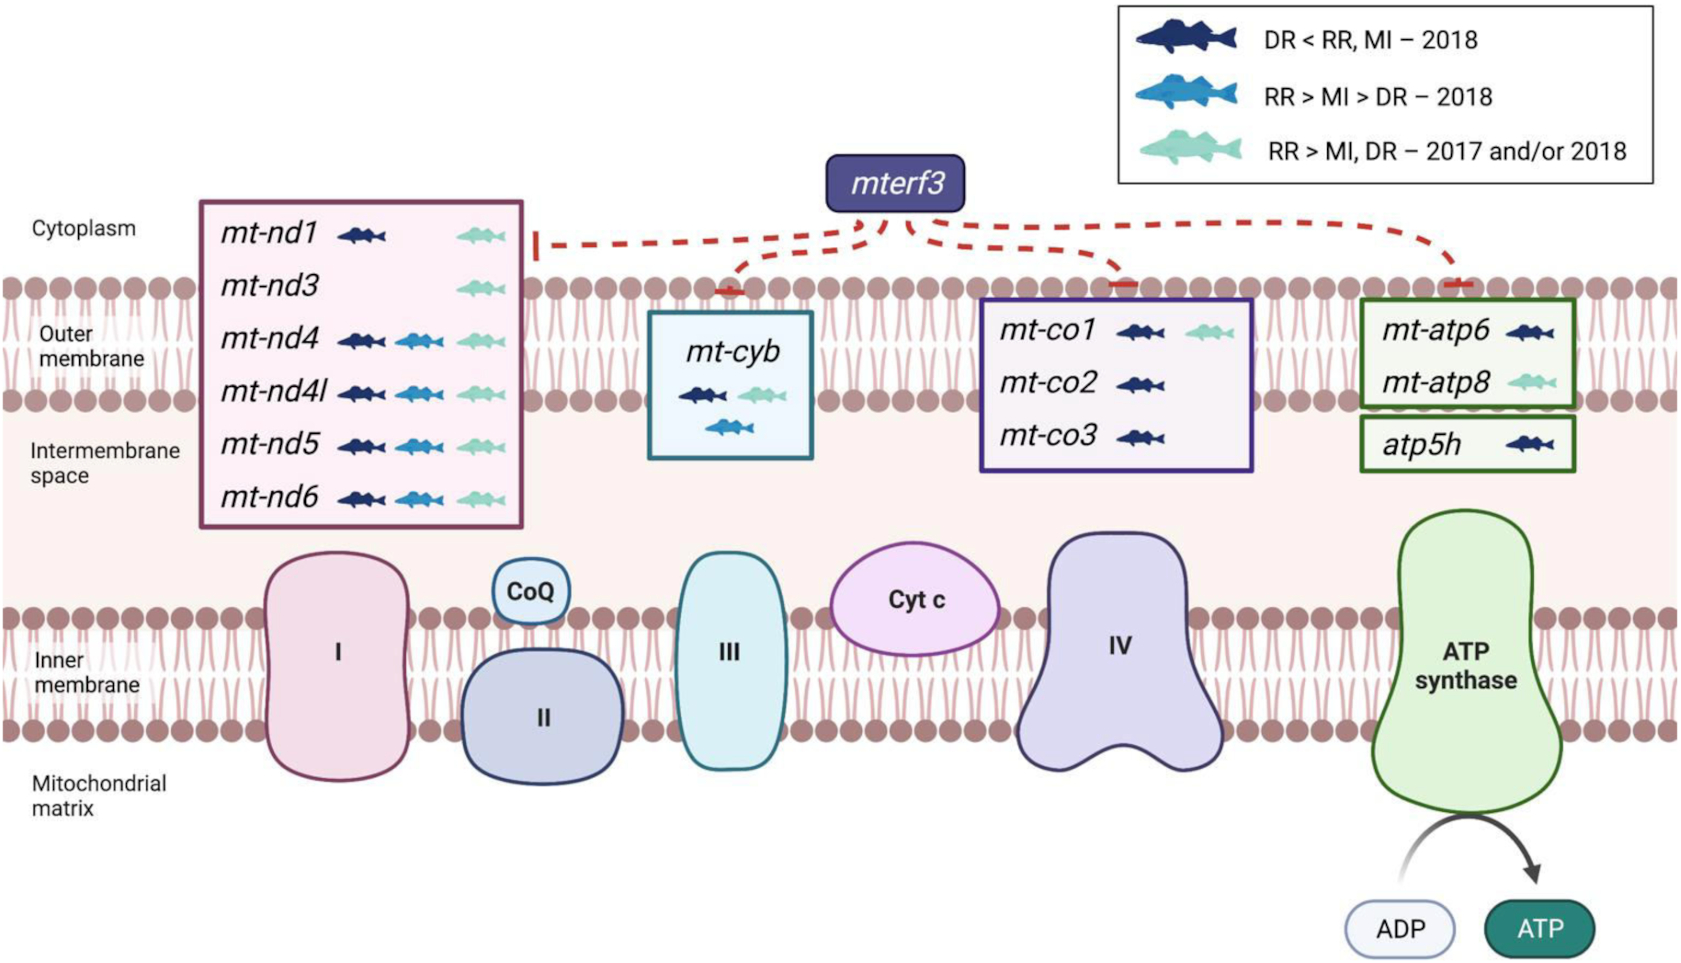
Fig. 6.
Transcriptomic responses of walleye in the system were verified in two ways in the present study. First, 20 target genes were identified using a PCA based on their differential regulation across sampling sites and examined using qPCR. Log2 fold change transcript levels were significantly correlated between qPCR and RNA-seq platforms. Similarly, examining the relative mRNA levels using a larger sample size suggested that the fish used for the RNA-seq study were representative of a larger group of fish for all but 1 of the 20 target genes. Secondly, relative mRNA levels were examined using qPCR across four sampling sites, which included the addition of the Riverton location in the south basin that was not included in the RNA-seq study. Even with significant year effects for several of the genes of interest, location-specific effects were evident for 10 of the 20 genes that were consistent with the RNA-seq results. For instance, transcript levels of gpx1 and rpa2 involved in the stress response and DNA repair, respectively, as well as cotl1, actr2, fam49b, and pfn2 involved in cytoskeleton organization, were all consistently lowest in Red River fish across years (Fig. S9). Together, these results suggest consistency among the RNA-seq and qPCR platforms as well as identify potential markers of stress responses and cytoskeleton reorganization in the gill that could be further explored for differences at a local scale among walleye in Lake Winnipeg or other systems.
With concerns for the status of the walleye fishery in the Lake Winnipeg system, a greater understanding of the state of this ecosystem is of vital importance. The generation of tools to improve our underlying knowledge of the physiology of walleye can improve our understanding of their condition and provide tools to monitor their status in the wild. Traditional measures of fisheries assessment, such as growth and reproductive outputs, are useful in providing population-scale indices, but these metrics are often based on terminal sampling and only evident at the point where vast changes to the population have already begun to take place (Attrill and Depledge 1997; Jeffrey et al. 2015). Using molecular and physiological tools through non-lethal sampling, as was done in the present study, has the potential to provide information about the health and status of a population on a shorter time scale, to complement population-level fisheries assessments (Jeffrey et al. 2015, 2020; Jeffries et al. 2021; Semeniuk et al. 2022). In the present study, gill transcriptomic patterns suggested that location-specific environmental factors (potentially dissolved oxygen and salinity/specific conductance levels) may be present and driving changes in the gill physiology of fish in the north basin compared to those of the south basin. Using qPCR and a targeted list of genes, we verified differential regulation of many of these pathways by location, as well as identified potential targets that could be used for assessing walleye physiology in the future.
Gill tissue provides an excellent target for studies that wish to non-lethally sample fish. From a physiological perspective, gills are a multi-functional tissue that are at the interface of the internal and external environments and are sensitive to environmental and biological stressors (Jeffries et al. 2021). Gill biopsies can also be retrieved with relative ease and with limited long-term effects on the fish, having been shown to have no subsequent impact on growth or survival (e.g., Martinelli-Liedtke et al. 1999; Zhao et al. 2014). Gill biopsies are being increasingly used to monitor fish health, with the gill transcriptome having been shown to be sensitive to a variety of stressors (e.g., environmental conditions on migration and spawning failure (Evans et al. 2011; Miller et al. 2011), pathogens (Jeffries et al. 2014), and elevated temperature and hypoxia (Jeffrey et al. 2020)). While results from the present study and those of previous studies reflect the value of using non-lethal gill samples to examine fish health, tissue-specific transcriptional patterns may limit our ability to capture “the whole picture” with a single tissue (Jeffries et al. 2021). For instance, using gill tissue may bias the potential environmental stressors identified in this study as those most likely to be exhibited by the gill transcriptome (e.g., temperature, dissolved oxygen, and ionic disturbances), whereas liver samples may have revealed additional information regarding toxicological stressors or the head kidney would provide valuable information on immune responses. Furthermore, sex-specific differences in walleye transcriptomic patterns were not examined in the present study due to limitations in accurately determining sex visually in this monomorphic species. However, when individuals of unknown sex were removed from the candidate gene mRNA dataset, there was no significant effect of sex when included as a covariate on the 20 genes evaluated. This limited analysis of gill tissue for sex-specific effects in the present study does not suggest an absence of sex effects in the fish sampled but may point to another tissue (e.g., liver and gonads) as being more suitable to examine such differences in wild-caught fish. Therefore, it is necessary to consider that walleye in the Lake Winnipeg system may exhibit additional responses to stressors not identified in the present study using gill tissue, but that data from the present study can be used to “spring-board” future work.
As conservation challenges threaten fish populations worldwide (Arthington et al. 2016; Dudgeon 2019), physiological responses can contribute to addressing those challenges by informing management and policy decisions (Somero et al. 2016). Transcriptomics can contribute to physiological information by measuring responses to stressors that may or may not be known in advance of sampling (Jeffries et al. 2021). Therefore, transcriptomic approaches may be useful for assessing physiological responses in wild organisms and contributing to management decisions (Connon et al. 2018). This study outlines an approach to using transcriptomics to non-lethally describe stress responses in a wild fish. We used mRNA sequencing to observe overall patterns in gill gene expression changes and qPCR to test hypotheses generated with mRNA sequencing and elucidate the population-scale patterns of specific genes by broadening the sample set used. Similar approaches, as well as the targets identified in this study, could be applied in other systems where undefined local conditions may be suspected as contributing to fish health and status. Overall, the results of the present study highlight the potential for incorporating high-throughput molecular techniques in the conservation of non-model species.
Acknowledgments
We thank D. Watkinson, D. Leroux, C. Charles, C. Kovachik, N. Turner, M. Gaudry, S. Glowa, and E. Barker for their role in fish capture and sampling. Thanks also to M. Gaudry for his help in sample preparation. We thank E. de Greef for their assistance with producing the map for Fig. 1. Thanks also to M. Lawrence and L. Wiens for valuable insight into the physiological significance of the differentially regulated pathways. Figures 3 and 5 were adapted from “Glycolysis and Glycolytic Enzymes” and “Electron Transport Chain”, respectively, by BioRender.com (2021), retrieved from https://app.biorender.com/biorender-templates. Figure 4 and the graphical abstract were also produced using BioRender.com. This work was supported by a Fisheries and Oceans Canada Ocean and Freshwater Science Contribution Program Partnership Fund grant awarded to JRT, KMJ, and DG, and Natural Sciences and Engineering Research Council of Canada Discovery Grants awarded to KMJ (#05479) and JRT (#06052). Work by JRT was also supported by the Canada Research Chairs program (#223744) and the Faculty of Science, University of Manitoba (#319254). Work by KMJ was also supported by a Genome Canada Large-Scale Applied Research Project grant.
References
Akbarzadeh A., Houde A.L.S., Sutherland B.J.G., Günther O.P., Miller K.M. 2020. Identification of hypoxia-specific biomarkers in salmonids using RNA-sequencing and validation using high-throughput qPCR. G3: Genes Genomes Genetics, 10: 3321–3336.
Arthington A.H., Dulvy N.K., Gladstone W., Winfield I.J. 2016. Fish conservation in freshwater and marine realms: status, threats and management. Aquatic Conservation: Marine Freshwater Ecosystems, 26(5): 838–857.
Attrill M.J., Depledge M.H. 1997. Community and population indicators of ecosystem health: targeting links between levels of biological organisation. Aquatic Toxicology, 38: 183–197.
Buccitelli C., Selbach M. 2020. mRNAs, proteins and the emerging principles of gene expression control. Nature Reviews Genetics, 21(10): 630–644.
Chen E.Y., Tan C.M., Kou Y., Duan Q., Wang Z., Meirelles G.V. et al. 2013. Enrichr: interactive and collaborative HTML5 gene list enrichment analysis tool. BMC Bioinformatics, 14: 128.
Connon R.E., Jeffries K.M., Komoroske L.M., Todgham A.E., Fangue N.A. 2018. The utility of transcriptomics in fish conservation. Journal of Experimental Biology, 221(2): jeb148833.
Cooke S.J., Sack L., Franklin C.E., Farrell A.P., Beardall J., Wikelski M., Chown S.L. 2013. What is conservation physiology? Perspectives on an increasingly integrated and essential science. Conservation Physiology, 1(1): cot001–cot001.
Crain C.M., Kroeker K., Halpern B.S. 2008. Interactive and cumulative effects of multiple human stressors in marine systems. Ecology Letters, 11(12): 1304–1315.
Crozier L.G., Hutchings J.A. 2014. Plastic and evolutionary responses to climate change in fish. Evolutionary Applications, 7(1): 68–87.
Di Ciano-Oliveira C.D., Thirone A.C.P., Szászi K., Kapus A. 2006. Osmotic stress and the cytoskeleton: the R(h)ole of Rho GTPases.Acta Physiologica, 187(1–2): 257–272.
Dudgeon D. 2019. Multiple threats imperil freshwater biodiversity in the Anthropocene. Current Biology, 29(19): R960–R967.
Enders E. 2019. Distribution patterns of the early invasion of zebra mussels, Dreissena polymorpha (Pallas, 1771), in the south basin of Lake Winnipeg. BioInvasions Records, 8(2): 329–342.
Enders E.C., Charles C., van der Lee A.S., Lumb C.E. 2021. Temporal variations in the pelagic fish community of Lake Winnipeg from 2002 to 2019. Journal of Great Lakes Research, 47(3): 626–634.
Environment Canada and Manitoba Water Stewardship. 2011. State of Lake Winnipeg: 1999 to 2007.
Evans T.G., Hammill E., Kaukinen K., Schulze A.D., Patterson D.A., English K.K. et al. 2011. Transcriptomics of environmental acclimatization and survival in wild adult Pacific sockeye salmon (Oncorhynchus nerka) during spawning migration. Molecular Ecology, 20(21): 4472–4489.
Fiol D.F., Chan S.Y., Kültz D. 2006. Identification and pathway analysis of immediate hyperosmotic stress responsive molecular mechanisms in tilapia (Oreochromis mossambicus) gill. Comparative Biochemistry and Physiology Part D: Genomics and Proteomics, 1(3): 344–356.
Hijmans R.J., Etten J. 2012. raster: geographic data analysis and modeling.
Homyack J. 2010. Evaluating habitat quality of vertebrates using conservation physiology tools. Wildlife Research, 37: 332.
Jackson M.C., Loewen C.J., Vinebrooke R.D., Chimimba C.T. 2016. Net effects of multiple stressors in freshwater ecosystems: a meta-analysis. Global Change Biology, 22(1): 180–189.
Jansen W., Gill G., Hann B. 2017. Rapid geographic expansion of spiny water flea (Bythotrephes longimanus) in Manitoba, Canada, 2009–2015. Aquatic Invasions, 12(3): 287–297.
Jeffrey J.D., Hasler C.T., Chapman J.M., Cooke S.J., Suski C.D. 2015. Linking landscape-scale disturbances to stress and condition of fish: implications for restoration and conservation. Integrative and Comparative Biology, 55(4): 618–630.
Jeffrey J.D., Jeffries K.M., Suski C.D. 2019. Physiological status of silver carp (Hypophthalmichthys molitrix) in the Illinois River: an assessment of fish at the leading edge of the invasion front. Comparative Biochemistry and Physiology Part D: Genomics and Proteomics, 32: 100614.
Jeffrey J.D., Carlson H., Wrubleski D., Enders E.C., Treberg J.R., Jeffries K.M. 2020. Applying a gene-suite approach to examine the physiological status of wild-caught walleye (Sander vitreus). Conservation Physiology, 8: coaa099.
Jeffries K.M., Hinch S.G., Gale M.K., Clark T.D., Lotto A.G., Casselman M.T. et al. 2014. Immune response genes and pathogen presence predict migration survival in wild salmon smolts. Molecular Ecology, 23(23): 5803–5815.
Jeffries K.M., Teffer A., Michaleski S., Bernier N.J., Heath D.D., Miller K.M. 2021. The use of non-lethal sampling for transcriptomics to assess the physiological status of wild fishes. Comparative Biochemistry and Physiology Part B: Biochemistry and Molecular Biology, 256: 110629.
Johnston T.A., Lysack W., Leggett W.C. 2012. Abundance, growth, and life history characteristics of sympatric walleye (Sander vitreus) and sauger (Sander canadensis) in Lake Winnipeg, Journal of Great Lakes Research, 38: 35–46.
Kassambara A., Mundt F. 2017. factoextra: extract and visualize the results of multivariate data analyses. R Package Version 1.0.7.
Lê S., Josse J., Husson F. 2008. FactoMineR: an R package for multivariate analysis. Journal of Statistical Software, 25(1).
Lenth R. 2020. emmeans: estimated marginal means, aka least-squares means. R package version 1.5.1.
Li H.L., Lin H.R., Xia J.H. 2017. Differential gene expression profiles and alternative isoform regulations in gill of Nile tilapia in response to acute hypoxia. Marine Biotechnology, 19(6): 551–562.
López-Maury L., Marguerat S., Bähler J. 2008. Tuning gene expression to changing environments: from rapid responses to evolutionary adaptation. Nature Reviews Genetics, 9(8): 583–593.
Lüdecke D., Makowski D., Waggoner P. 2020. Assessment of regression models performance. CRAN.
Manitoba Government. 2018. Fish populations: Lake Winnipeg Basin indicator series.
Manitoba Sustainable Development. 2018. Manitoba Sustainable Development Annual Report 2017–2018. Winnipeg.
Martinelli-Liedtke T.L., Shively R.S., Holmberg G.S., Sheer M.B., Schrock R.M. 1999. Nonlethal gill biopsy does not affect juvenile chinook salmon implanted with radio transmitters. North American Journal of Fisheries Management, 19(3): 856–859.
Massicotte P., South A. 2023. rnaturalearth: world map data from natural earth. R package version 0.3.2.
Miller K.M., Li S., Kaukinen K.H., Ginther N., Hammill E., Curtis J.M.R. et al. 2011. Genomic signatures predict migration and spawning failure in wild Canadian salmon. Science, 331(6014): 214–217.
Park C.B., Asin-Cayuela J., Cámara Y., Shi Y., Pellegrini M., Gaspari M. et al. 2007. MTERF3 is a negative regulator of mammalian mtDNA transcription. Cell, 130(2): 273–285.
Patro R., Duggal G., Love M.I., Irizarry R.A., Kingsford C. 2017. Salmon provides fast and bias-aware quantification of transcript expression. Nature Methods, 14(4): 417–419.
Robinson M.D., McCarthy D.J., Smyth G.K. 2010. edgeR: a bioconductor package for differential expression analysis of digital gene expression data. Bioinformatics, 26(1): 139–140.
Schindler D.W., Hecky R.E., McCullough G.K. 2012. The rapid eutrophication of Lake Winnipeg: greening under global change. Journal of Great Lakes Research, 38: 6–13.
Schulte P.M. 2014. What is environmental stress? Insights from fish living in a variable environment. Journal of Experimental Biology, 217(1): 23–34.
Semeniuk C.A.D., Jeffries K.M., Li T., Bettles C.M., Cooke S.J., Dufour B.A. et al. 2022. Innovating transcriptomics for practitioners in freshwater fish management and conservation: best practices across diverse resource-sector users. Reviews in Fish Biology and Fisheries, 32: 921–939.
Somero G.N., Beers J.M., Chan F., Hill T.M., Klinger T., Litvin S.Y. 2016. What changes in the carbonate system, oxygen, and temperature portend for the northeastern Pacific Ocean: a physiological perspective. Bioscience, 66(1): 14–26.
South A. 2011. rworldmap: a new R package for mapping global data. The R Journal, 3(1): 35–43.
Statistics Canada. 2011. Available from https://www12.statcan.gc.ca/census-recensement/2011/geo/bound-limit/bound-limit-2011-eng.cfm.
Supek F., Bosnjak M., Skunca N., Smuc T. 2011. REVIGO summarizes and visualizes long lists of gene ontology terms. PLoS One, 6(7): e21800.
Thorstensen M.J., Jeffrey J.D., Treberg J.R., Watkinson D.A., Enders E.C., Jeffries K.M. 2020. Genomic signals found using RNA sequencing show signatures of selection and subtle population differentiation in walleye (Sander vitreus) in a large freshwater ecosystem. Ecology and Evolution, 10(14): 7173–7188.
Thorstensen M.J., Wiens L.M., Jeffrey J.D., Klein G.M., Jeffries K.M., Treberg J.R. 2021. Morphology and blood metabolites reflect recent spatial and temporal differences among Lake Winnipeg walleye, Sander vitreus. Journal of Great Lakes Research, 47(3): 603–613.
Thorstensen M.J., Euclide P.T., Jeffrey J.D., Shi Y., Treberg J.R., Watkinson D.A. et al. 2022. A chromosomal inversion may facilitate adaptation despite periodic gene flow in a freshwater fish. Ecology and Evolution, 12(5): e8898.
van der Meer D.L.M., van den Thillart G.E.E.J.M., Witte F., de Bakker M.A.G., Besser J., Richardson M.K. et al. 2005. Gene expression profiling of the long-term adaptive response to hypoxia in the gills of adult zebrafish. American Journal of Physiology—Regulatory, Integrative and Comparative Physiology, 289(5): R1512–R1519.
Wassenaar L.I., Rao Y.R. 2012. Lake Winnipeg: the forgotten great lake. Journal of Great Lakes Research, 38: 1–5.
Weihrauch D., Wilkie M.P., Walsh P.J. 2009. Ammonia and urea transporters in gills of fish and aquatic crustaceans. Journal of Experimental Biology, 212(11): 1716–1730.
Whitehead A., Crawford D.L. 2006. Neutral and adaptive variation in gene expression. Proceedings of the National Academy of Sciences of the United States of America, 103(14): 5425–5430.
Whitehead A., Roach J.L., Zhang S., Galvez F. 2011. Genomic mechanisms of evolved physiological plasticity in killifish distributed along an environmental salinity gradient. Proceedings of the National Academy of Sciences of the United States of America, 108(15): 6193–6198.
Wickham H. 2016. ggplot2: elegant graphics for data analysis. In Second. Springer, Switzerland.
Xie F., Xiao P., Chen D., Xu L., Zhang B. 2012. miRDeepFinder: a miRNA analysis tool for deep sequencing of plant small RNAs. Plant Molecular Biology, 80(1): 75–84.
Zhang G., Zhao C., Wang Q., Gu Y., Li Z., Tao P. et al. 2017. Identification of HIF-1 signaling pathway in Pelteobagrus vachelli using RNA-Seq: effects of acute hypoxia and reoxygenation on oxygen sensors, respiratory metabolism, and hematology indices. Journal of Comparative Physiology B, 187(7): 931–943.
Zhao F., Zhuang P., Zhang T., Zhang L., Liu J., Hou J. 2014. Non-lethal gill biopsy of juvenile hybrid sturgeon (Acipenser ruthenus ♀ × A. schrenckii ♂): validity and impact on growth and osmoregulation. Journal of Applied Ichthyology, 30(6): 1243–1245.
Supplementary material
Supplementary Material 1 (PDF / 1.14 MB).
- Download
- 1.14 MB
Supplementary Material 2 (XLSX / 2.36 MB).
- Download
- 2.37 MB
Supplementary Material 3 (XLSX / 126 KB).
- Download
- 126.85 KB
Information & Authors
Information
Published In

FACETS
Volume 8 • January 2023
Pages: 1 - 15
Editor: Lisa Porter
History
Received: 8 August 2022
Accepted: 3 April 2023
Version of record online: 21 August 2023
Copyright
© 2023 The Author(s). This work is licensed under a Creative Commons Attribution 4.0 International License (CC BY 4.0), which permits unrestricted use, distribution, and reproduction in any medium, provided the original author(s) and source are credited.
Data Availability Statement
Raw RNA-sew reads were submitted to the NCBI SRA database, accession #PRJNA596986. All other data are available upon request.
Key Words
Sections
Subjects
Authors
Author Contributions
Conceptualization: JDJ, MJT, ECE, JRT, KMJ
Data curation: JDJ, MJT
Formal analysis: JDJ
Funding acquisition: JRT, KMJ
Investigation: JDJ, MJT, JRT, KMJ
Methodology: JDJ, MJT, JRT, KMJ
Project administration: ECE, JRT, KMJ
Resources: ECE, JRT, KMJ
Supervision: ECE, JRT, KMJ
Visualization: JDJ
Writing – original draft: JDJ
Writing – review & editing: JDJ, MJT, ECE, JRT, KMJ
Competing Interests
The authors are unaware of any competing interest.
Metrics & Citations
Metrics
Other Metrics
Citations
Cite As
Jennifer D. Jeffrey, Matt J. Thorstensen, Eva C. Enders, Jason R. Treberg, and Ken M. Jeffries. 2023. Using transcriptomics to examine the physiological status of wild-caught walleye (Sander vitreus). FACETS.
8(): 1-15. https://doi.org/10.1139/facets-2022-0177
Export Citations
If you have the appropriate software installed, you can download article citation data to the citation manager of your choice. Simply select your manager software from the list below and click Download.
There are no citations for this item